Attached files
| file | filename |
|---|---|
| 8-K - 8-K - MainStreet Bancshares, Inc. | d20504d8k.htm |
MainStreet Bancshares, Inc. Nasdaq: MNSB & MNSBP Financial Highlights 3rd Quarter 2020 A Russell 2000 Company December 3, 2020 Exhibit 99.1
This presentation contains forward-looking statements, including our expectations with respect to future events that are subject to various risks and uncertainties. The statements contained in this presentation that are not historical facts are forward-looking statements as defined in the Private Securities Litigation Reform Act of 1995. Words such as “may,” “will,” “could,” “should,” “expect,” “plan,” “project,” “intend,” “anticipate,” “believe,” “estimate,” “predict,” “potential,” “pursuant,” “target,” “continue,” and similar expressions are intended to identify such forward-looking statements. There are or will be important factors that could cause our actual results to differ materially from those indicated in these forward-looking statements, including, but not limited to, the following: the impact of developments related to the novel coronavirus (COVID-19), economic conditions, competition, inflation and market rates of interest, client relationships and changes in our organization. Factors that could cause actual results to differ materially are described in our Annual Report on Form 10-K for the year ended December 31, 2019, and in other documents subsequently filed will the Securities and Exchange Commission, available at www.sec.gov and www.mstreetbank.com. We caution readers that the list of factors is not exclusive. The forward-looking statements are made as of the date of this presentation, and we may not undertake steps to update the forward-looking statements to reflect the impact of any circumstances or events that arise after the date the forward-looking statements are made. In addition, our past results of operations are not necessarily indicative of future performance. This presentation supplements information contained in the Company’s preliminary prospectus supplement dated September 10, 2020 and should be read in conjunction therewith. Unless otherwise indicated or the context otherwise requires, all references in this presentation to “we,” “our,” “us,” and “the Company” refer to MainStreet Bancshares, Inc., and its consolidated subsidiaries, after giving effect to the reorganization transaction that was completed in July 2016, pursuant to which MainStreet Bank (the “Bank”) reorganized into a holding company structure, with each outstanding share of Bank common stock being automatically converted into and exchanged for one share of the Company’s common stock. For all periods prior to the completion of such reorganization transaction, these terms refer to the Bank and its consolidated subsidiaries, and all historical financial information included in this presentation prior to the completion of the reorganization reflect that of the Bank. The accounting and reporting policies of the Company conform to U.S. GAAP and prevailing practices in the banking industry. However, certain non-GAAP measures are used by management to supplement the evaluation of the Company’s performance. These measures include Pre-Tax Pre-Provision (PTPP) Income, Tangible Common Equity/Tangible Assets (TCE/TA), Tangible Book Value per Share (TBVPS) and Core Net Income. Management believes that the use of these non-GAAP measures provide meaningful information about operating performance by enhancing comparability with other financial periods and other financial institutions. The non-GAAP measures used by management enhance comparability by excluding the effects of items that do not reflect ongoing operating performance, including non-recurring gains or charges, that, in management’s opinion, can distort period-to-period comparisons. These non-GAAP financial measures should not be considered an alternative to U.S. GAAP-basis financial statements, and other bank holding companies may define or calculate these or similar measures differently. A reconciliation of the non-GAAP financial measures used by the Company to evaluate and measure the Company’s performance to the most directly comparable U.S. GAAP financial measures is presented in the Appendix. Disclaimers
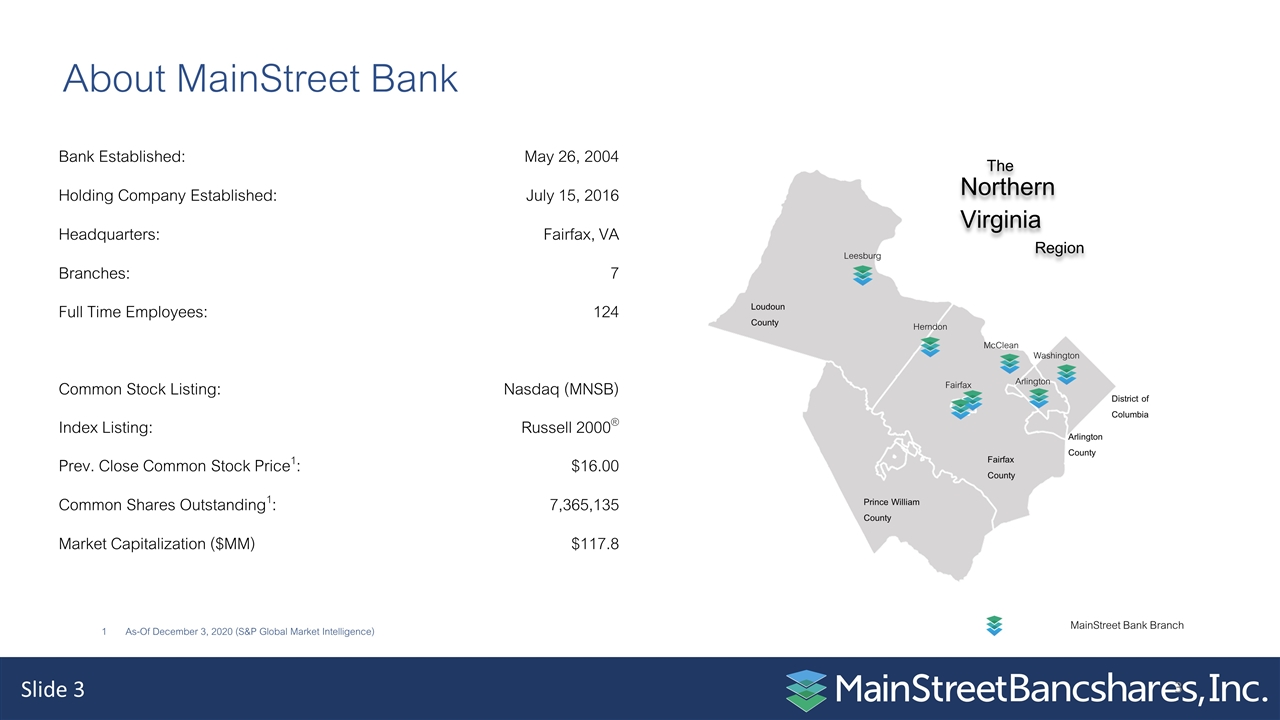
About MainStreet Bank Leesburg Herndon McClean Arlington Fairfax Washington The Northern Virginia Region MainStreet Bank Branch Loudoun County Prince William County Fairfax County District of Columbia Arlington County Bank Established: May 26, 2004 Holding Company Established: July 15, 2016 Headquarters: Fairfax, VA Branches: 7 Full Time Employees: 124 Common Stock Listing: Nasdaq (MNSB) Index Listing: Russell 2000® Prev. Close Common Stock Price1: $16.00 Common Shares Outstanding1: 7,365,135 Market Capitalization ($MM) $117.8 As-Of December 3, 2020 (S&P Global Market Intelligence)
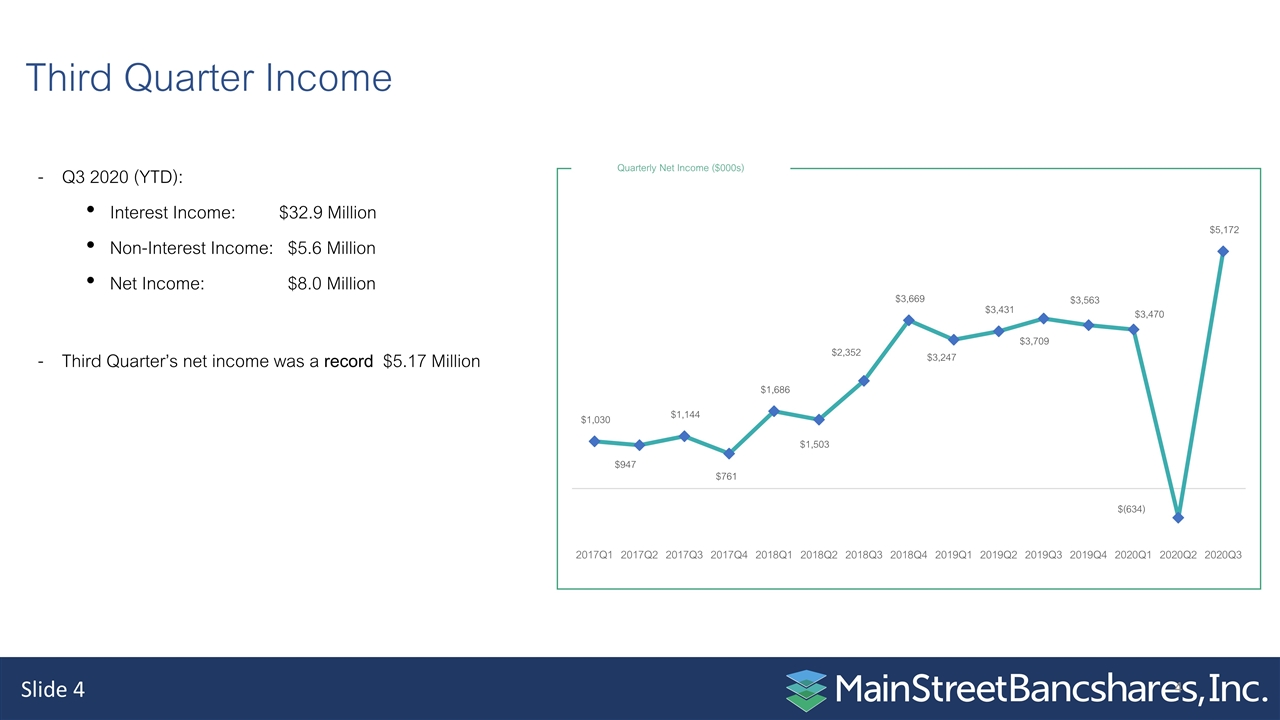
Third Quarter Income Q3 2020 (YTD): Interest Income: $32.9 Million Non-Interest Income: $5.6 Million Net Income: $8.0 Million Third Quarter’s net income was a record $5.17 Million Quarterly Net Income ($000s)
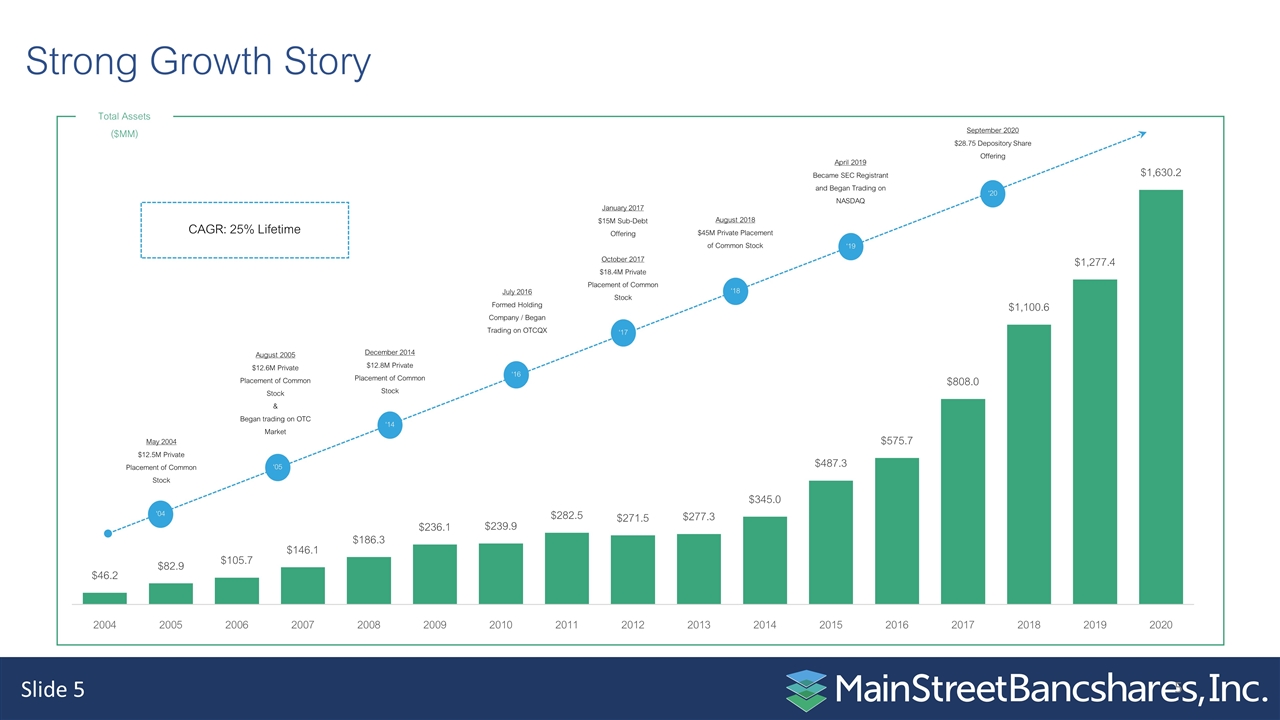
Strong Growth Story ‘04 May 2004 $12.5M Private Placement of Common Stock ‘05 August 2005 $12.6M Private Placement of Common Stock & Began trading on OTC Market ‘14 December 2014 $12.8M Private Placement of Common Stock ‘16 ‘17 ‘18 ‘19 ‘20 July 2016 Formed Holding Company / Began Trading on OTCQX January 2017 $15M Sub-Debt Offering October 2017 $18.4M Private Placement of Common Stock August 2018 $45M Private Placement of Common Stock April 2019 Became SEC Registrant and Began Trading on NASDAQ September 2020 $28.75 Depository Share Offering Total Assets ($MM) CAGR: 25% Lifetime
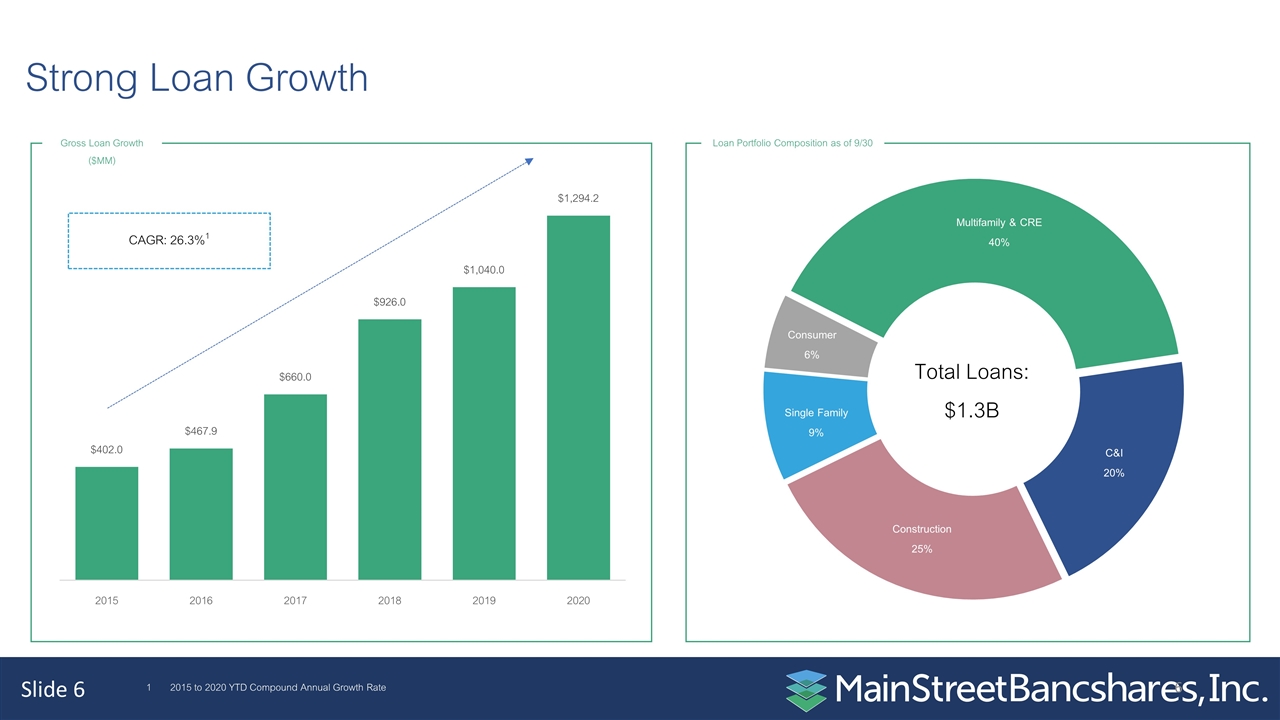
Strong Loan Growth Loan Portfolio Composition as of 9/30 Gross Loan Growth ($MM) CAGR: 26.3%1 Total Loans: $1.3B 2015 to 2020 YTD Compound Annual Growth Rate
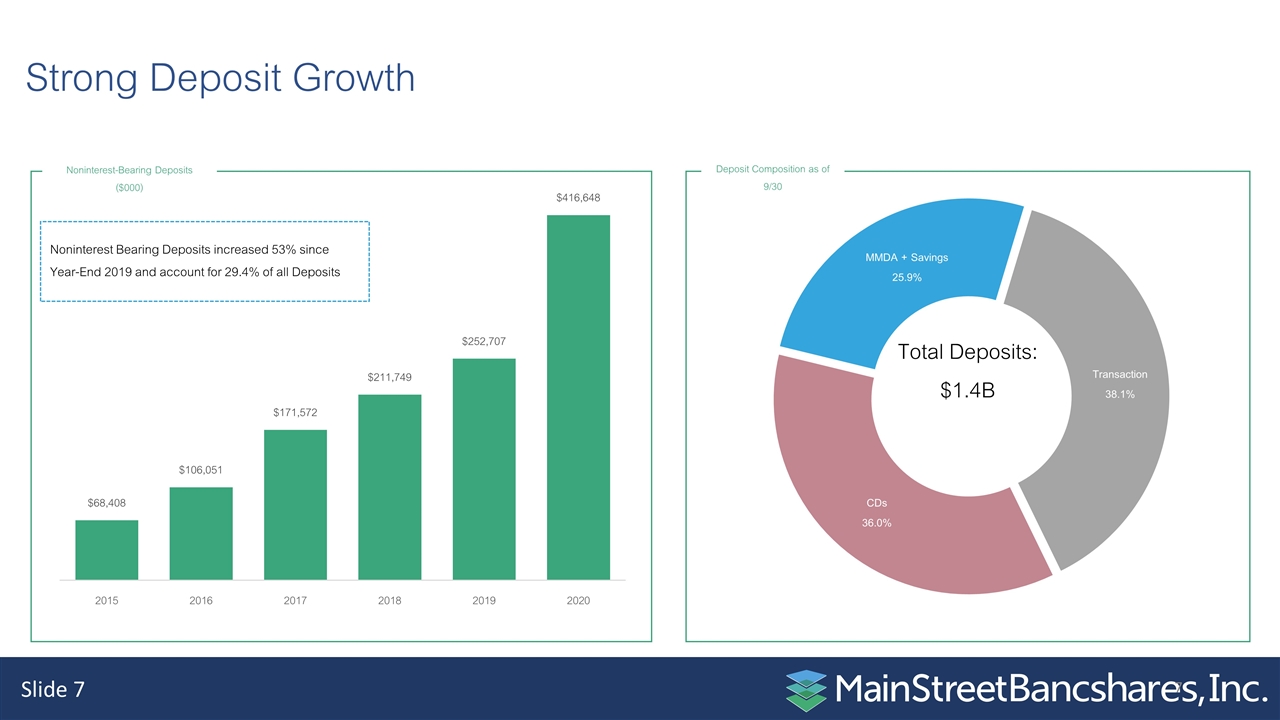
Strong Deposit Growth Deposit Composition as of 9/30 Noninterest-Bearing Deposits ($000) Total Deposits: $1.4B Noninterest Bearing Deposits increased 53% since Year-End 2019 and account for 29.4% of all Deposits
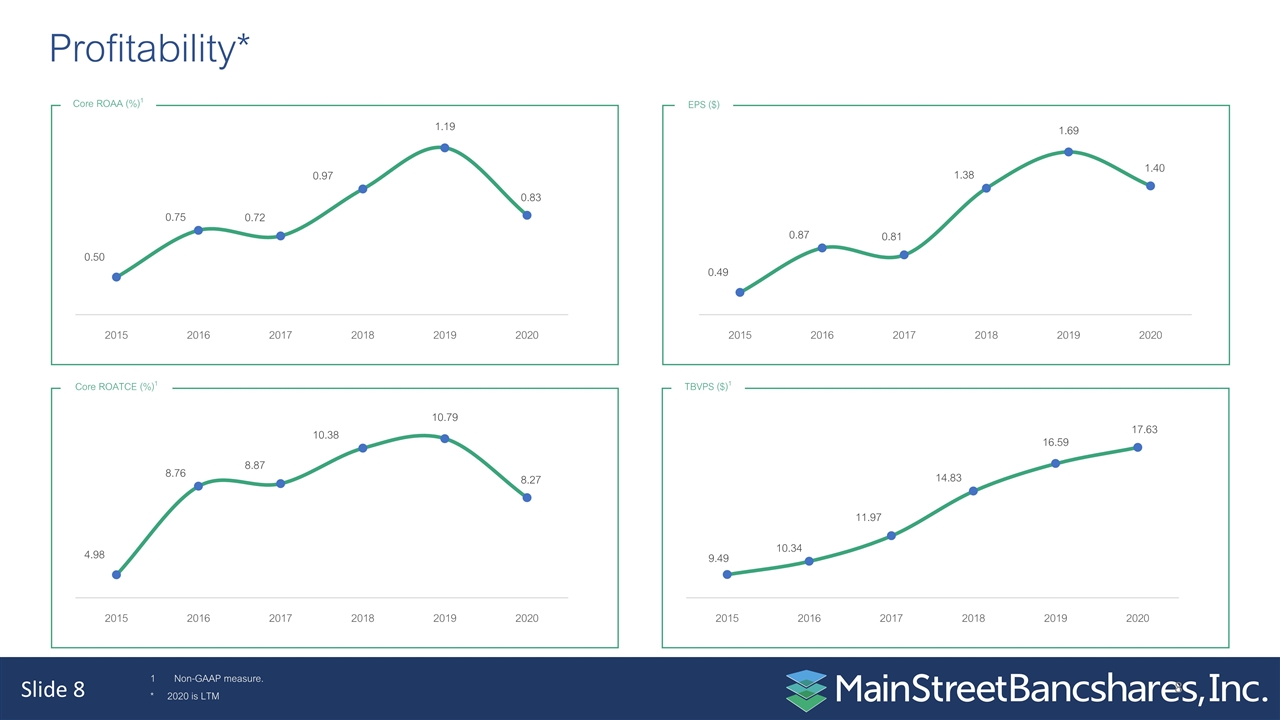
Profitability* Core ROAA (%)1 EPS ($) Core ROATCE (%)1 TBVPS ($)1 Non-GAAP measure. * 2020 is LTM
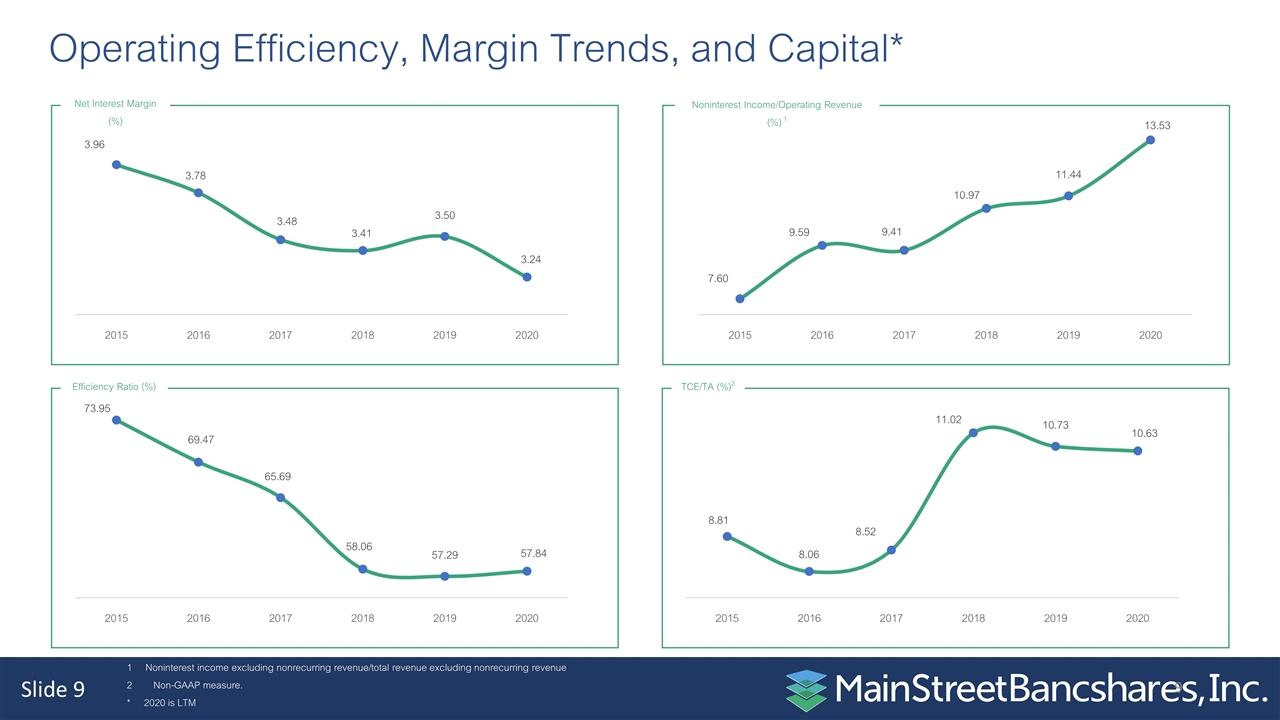
Operating Efficiency, Margin Trends, and Capital* Net Interest Margin (%) Noninterest Income/Operating Revenue (%) 1 Efficiency Ratio (%) TCE/TA (%)2 1 Noninterest income excluding nonrecurring revenue/total revenue excluding nonrecurring revenue Non-GAAP measure. * 2020 is LTM
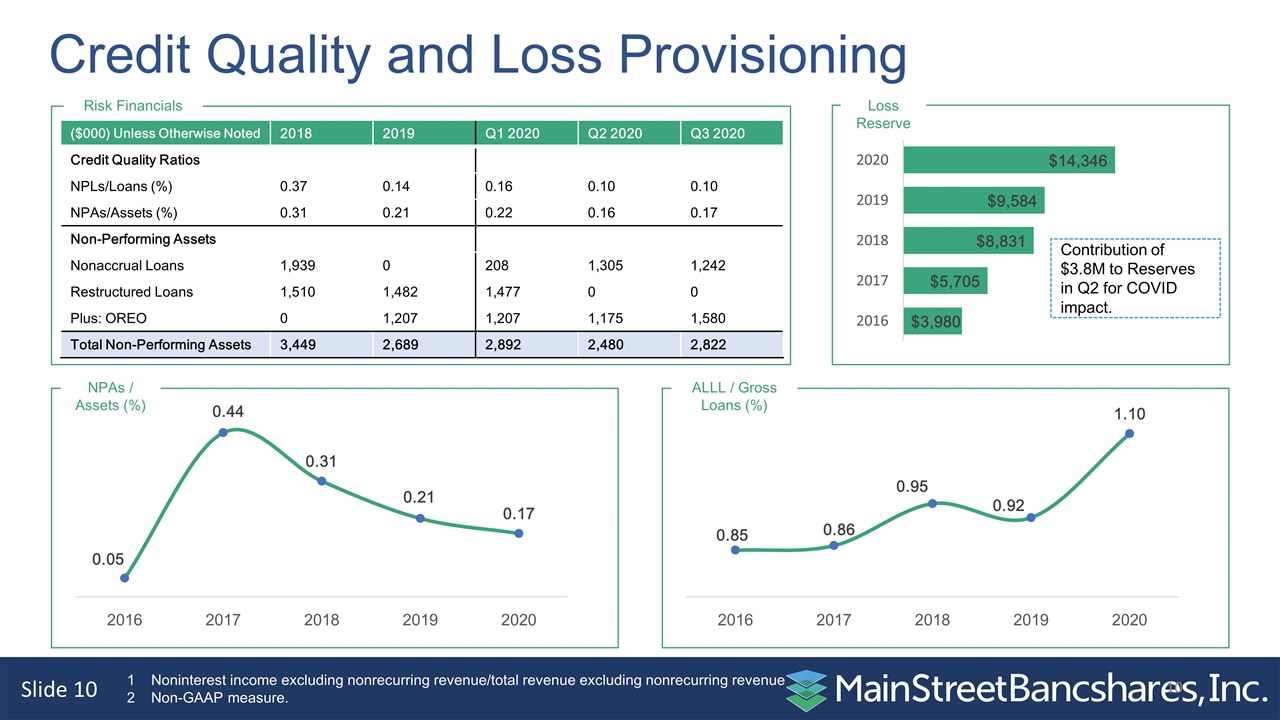
Credit Quality and Loss Provisioning Risk Financials Loss Reserve NPAs / Assets (%) ALLL / Gross Loans (%) 1 Noninterest income excluding nonrecurring revenue/total revenue excluding nonrecurring revenue 2 Non-GAAP measure. ($000) Unless Otherwise Noted 2018 2019 Q1 2020 Q2 2020 Q3 2020 Credit Quality Ratios NPLs/Loans (%) 0.37 0.14 0.16 0.10 0.10 NPAs/Assets (%) 0.31 0.21 0.22 0.16 0.17 Non-Performing Assets Nonaccrual Loans 1,939 0 208 1,305 1,242 Restructured Loans 1,510 1,482 1,477 0 0 Plus: OREO 0 1,207 1,207 1,175 1,580 Total Non-Performing Assets 3,449 2,689 2,892 2,480 2,822 Contribution of $3.8M to Reserves in Q2 for COVID impact.
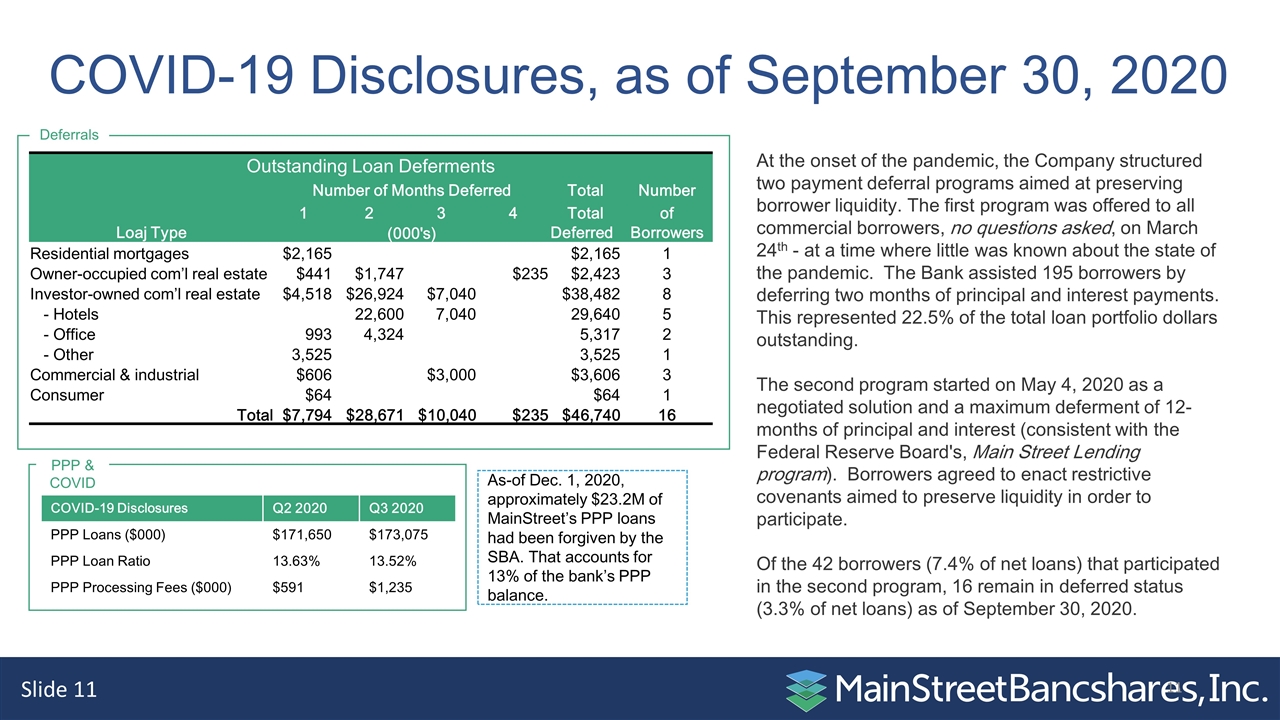
PPP & COVID COVID-19 Disclosures Q2 2020 Q3 2020 PPP Loans ($000) $171,650 $173,075 PPP Loan Ratio 13.63% 13.52% PPP Processing Fees ($000) $591 $1,235 COVID-19 Disclosures, as of September 30, 2020 Outstanding Loan Deferments Number of Months Deferred Total Number 1 2 3 4 Total of Loaj Type (000's) Deferred Borrowers Residential mortgages $2,165 $2,165 1 Owner-occupied com’l real estate $441 $1,747 $235 $2,423 3 Investor-owned com’l real estate $4,518 $26,924 $7,040 $38,482 8 - Hotels 22,600 7,040 29,640 5 - Office 993 4,324 5,317 2 - Other 3,525 3,525 1 Commercial & industrial $606 $3,000 $3,606 3 Consumer $64 $64 1 Total $7,794 $28,671 $10,040 $235 $46,740 16 Deferrals At the onset of the pandemic, the Company structured two payment deferral programs aimed at preserving borrower liquidity. The first program was offered to all commercial borrowers, no questions asked, on March 24th - at a time where little was known about the state of the pandemic. The Bank assisted 195 borrowers by deferring two months of principal and interest payments. This represented 22.5% of the total loan portfolio dollars outstanding. The second program started on May 4, 2020 as a negotiated solution and a maximum deferment of 12-months of principal and interest (consistent with the Federal Reserve Board's, Main Street Lending program). Borrowers agreed to enact restrictive covenants aimed to preserve liquidity in order to participate. Of the 42 borrowers (7.4% of net loans) that participated in the second program, 16 remain in deferred status (3.3% of net loans) as of September 30, 2020. As-of Dec. 1, 2020, approximately $23.2M of MainStreet’s PPP loans had been forgiven by the SBA. That accounts for 13% of the bank’s PPP balance.
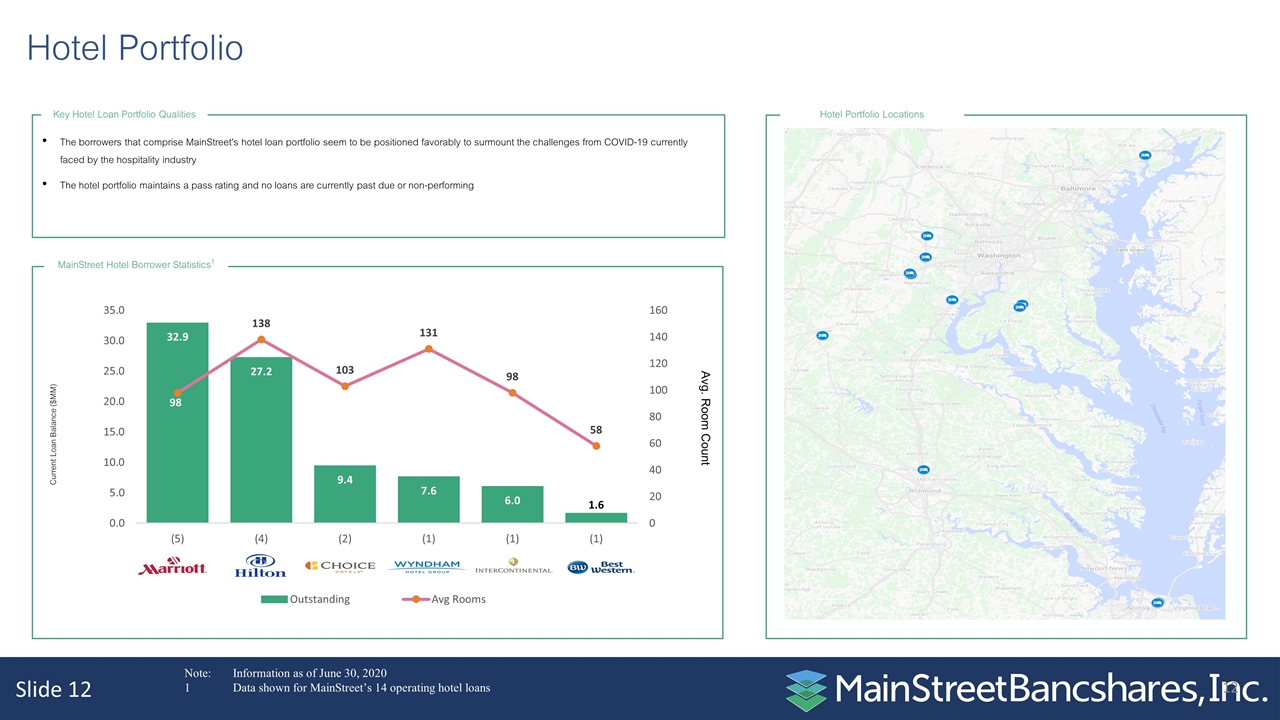
Hotel Portfolio Locations Note: Information as of June 30, 2020 1Data shown for MainStreet’s 14 operating hotel loans The borrowers that comprise MainStreet’s hotel loan portfolio seem to be positioned favorably to surmount the challenges from COVID-19 currently faced by the hospitality industry The hotel portfolio maintains a pass rating and no loans are currently past due or non-performing Key Hotel Loan Portfolio Qualities Current Loan Balance ($MM) Avg. Room Count MainStreet Hotel Borrower Statistics1 Hotel Portfolio
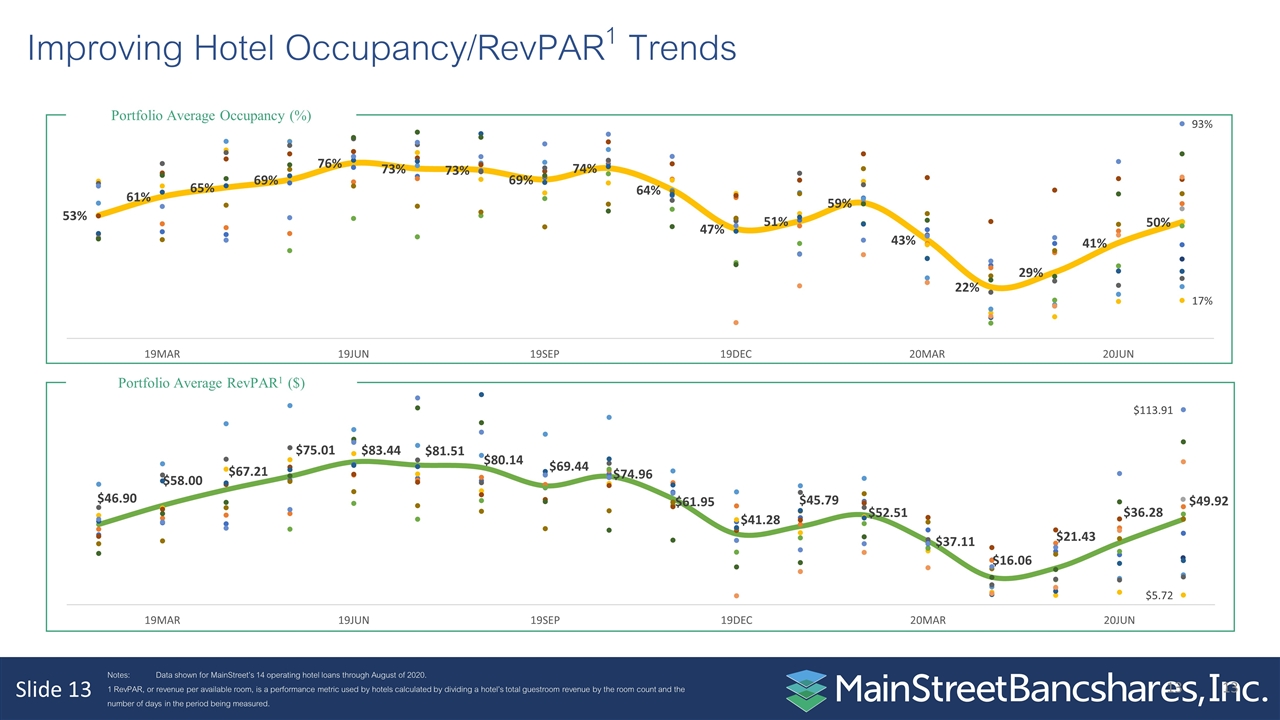
Notes:Data shown for MainStreet’s 14 operating hotel loans through August of 2020. 1 RevPAR, or revenue per available room, is a performance metric used by hotels calculated by dividing a hotel’s total guestroom revenue by the room count and the number of days in the period being measured. Portfolio Average Occupancy (%) Portfolio Average RevPAR1 ($) Improving Hotel Occupancy/RevPAR1 Trends
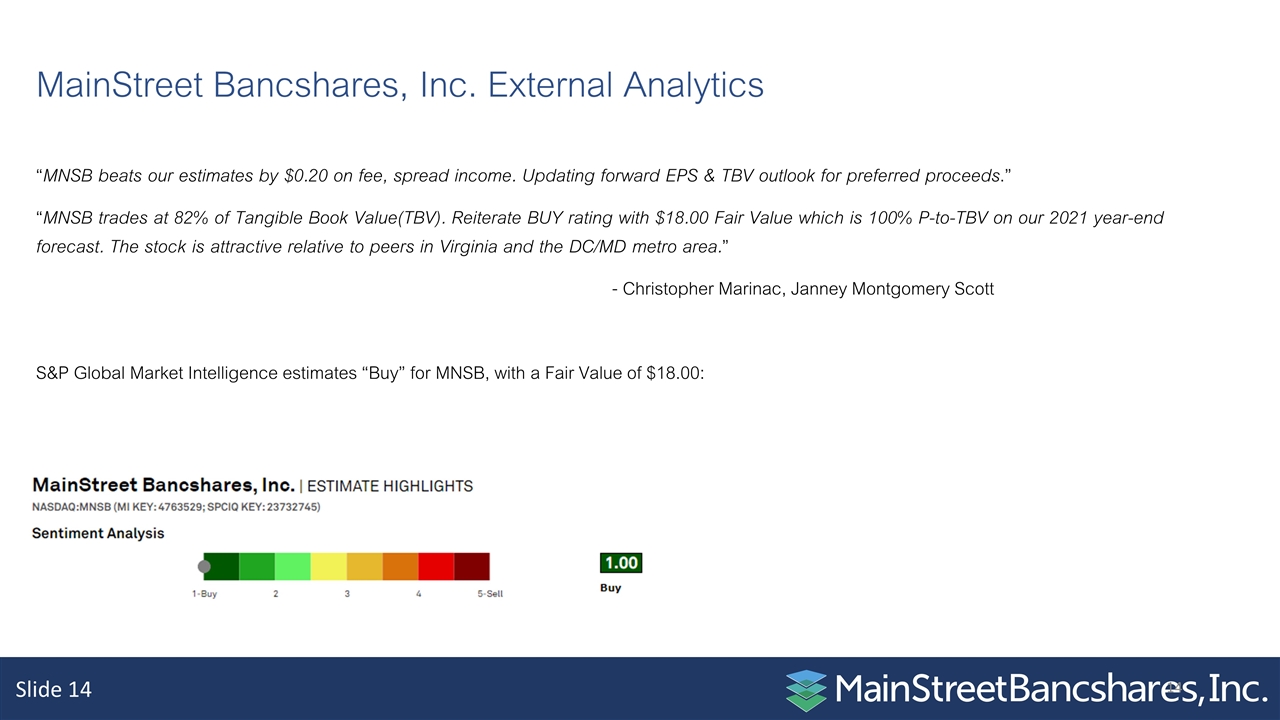
MainStreet Bancshares, Inc. External Analytics “MNSB beats our estimates by $0.20 on fee, spread income. Updating forward EPS & TBV outlook for preferred proceeds.” “MNSB trades at 82% of Tangible Book Value(TBV). Reiterate BUY rating with $18.00 Fair Value which is 100% P-to-TBV on our 2021 year-end forecast. The stock is attractive relative to peers in Virginia and the DC/MD metro area.” - Christopher Marinac, Janney Montgomery Scott S&P Global Market Intelligence estimates “Buy” for MNSB, with a Fair Value of $18.00:

Excellent Board Diversity
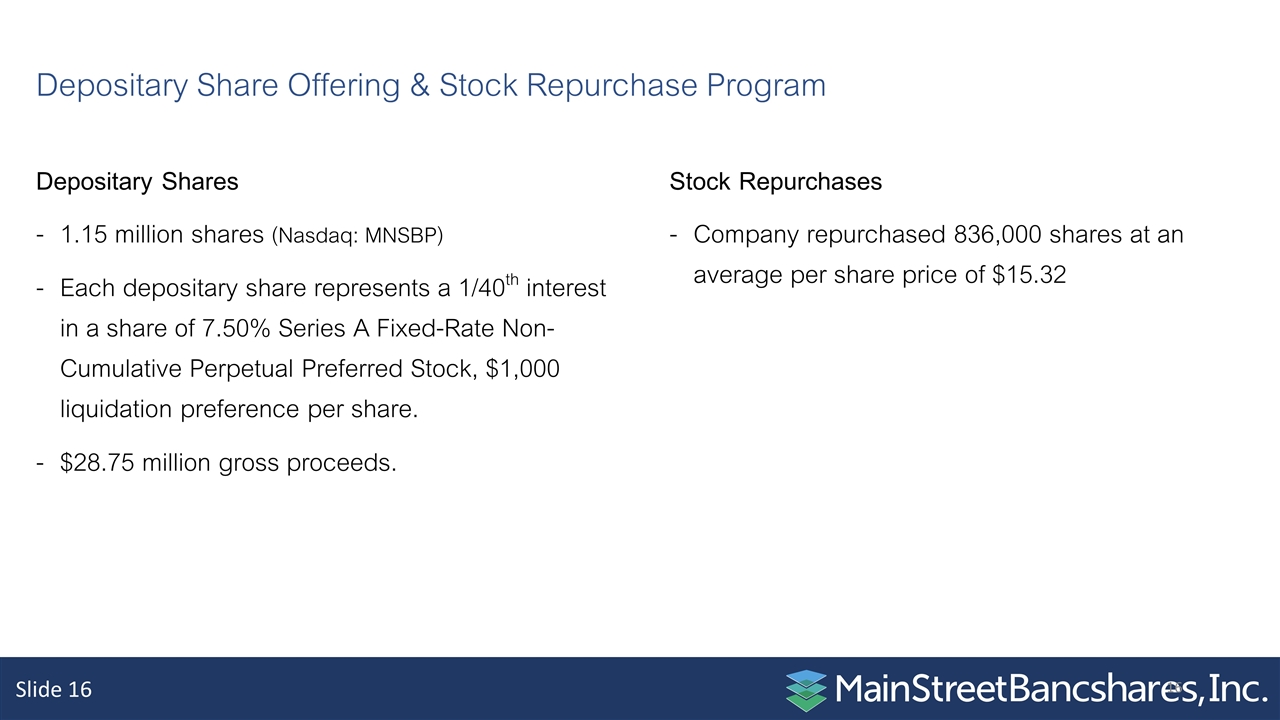
Depositary Share Offering & Stock Repurchase Program Depositary Shares 1.15 million shares (Nasdaq: MNSBP) Each depositary share represents a 1/40th interest in a share of 7.50% Series A Fixed-Rate Non-Cumulative Perpetual Preferred Stock, $1,000 liquidation preference per share. $28.75 million gross proceeds. Stock Repurchases Company repurchased 836,000 shares at an average per share price of $15.32
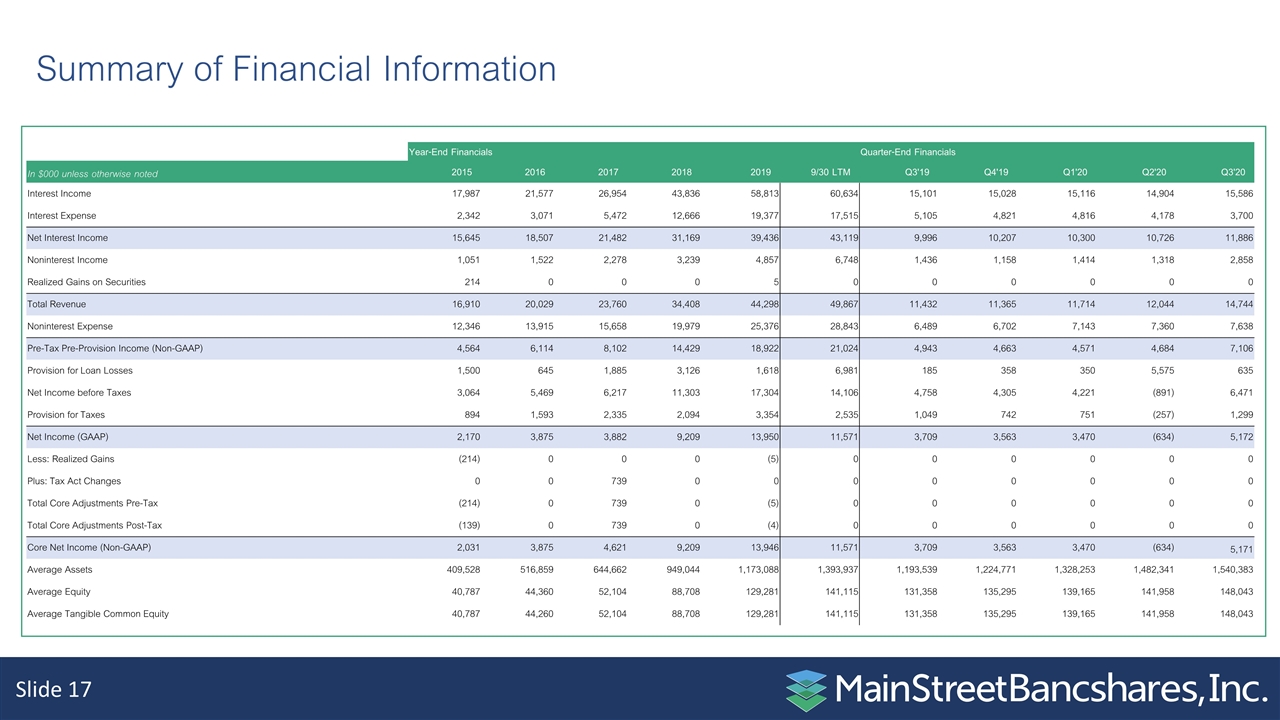
Summary of Financial Information Year-End Financials Quarter-End Financials In $000 unless otherwise noted 2015 2016 2017 2018 2019 9/30 LTM Q3'19 Q4'19 Q1'20 Q2'20 Q3'20 Interest Income 17,987 21,577 26,954 43,836 58,813 60,634 15,101 15,028 15,116 14,904 15,586 Interest Expense 2,342 3,071 5,472 12,666 19,377 17,515 5,105 4,821 4,816 4,178 3,700 Net Interest Income 15,645 18,507 21,482 31,169 39,436 43,119 9,996 10,207 10,300 10,726 11,886 Noninterest Income 1,051 1,522 2,278 3,239 4,857 6,748 1,436 1,158 1,414 1,318 2,858 Realized Gains on Securities 214 0 0 0 5 0 0 0 0 0 0 Total Revenue 16,910 20,029 23,760 34,408 44,298 49,867 11,432 11,365 11,714 12,044 14,744 Noninterest Expense 12,346 13,915 15,658 19,979 25,376 28,843 6,489 6,702 7,143 7,360 7,638 Pre-Tax Pre-Provision Income (Non-GAAP) 4,564 6,114 8,102 14,429 18,922 21,024 4,943 4,663 4,571 4,684 7,106 Provision for Loan Losses 1,500 645 1,885 3,126 1,618 6,981 185 358 350 5,575 635 Net Income before Taxes 3,064 5,469 6,217 11,303 17,304 14,106 4,758 4,305 4,221 (891) 6,471 Provision for Taxes 894 1,593 2,335 2,094 3,354 2,535 1,049 742 751 (257) 1,299 Net Income (GAAP) 2,170 3,875 3,882 9,209 13,950 11,571 3,709 3,563 3,470 (634) 5,172 Less: Realized Gains (214) 0 0 0 (5) 0 0 0 0 0 0 Plus: Tax Act Changes 0 0 739 0 0 0 0 0 0 0 0 Total Core Adjustments Pre-Tax (214) 0 739 0 (5) 0 0 0 0 0 0 Total Core Adjustments Post-Tax (139) 0 739 0 (4) 0 0 0 0 0 0 Core Net Income (Non-GAAP) 2,031 3,875 4,621 9,209 13,946 11,571 3,709 3,563 3,470 (634) 5,171 Average Assets 409,528 516,859 644,662 949,044 1,173,088 1,393,937 1,193,539 1,224,771 1,328,253 1,482,341 1,540,383 Average Equity 40,787 44,360 52,104 88,708 129,281 141,115 131,358 135,295 139,165 141,958 148,043 Average Tangible Common Equity 40,787 44,260 52,104 88,708 129,281 141,115 131,358 135,295 139,165 141,958 148,043
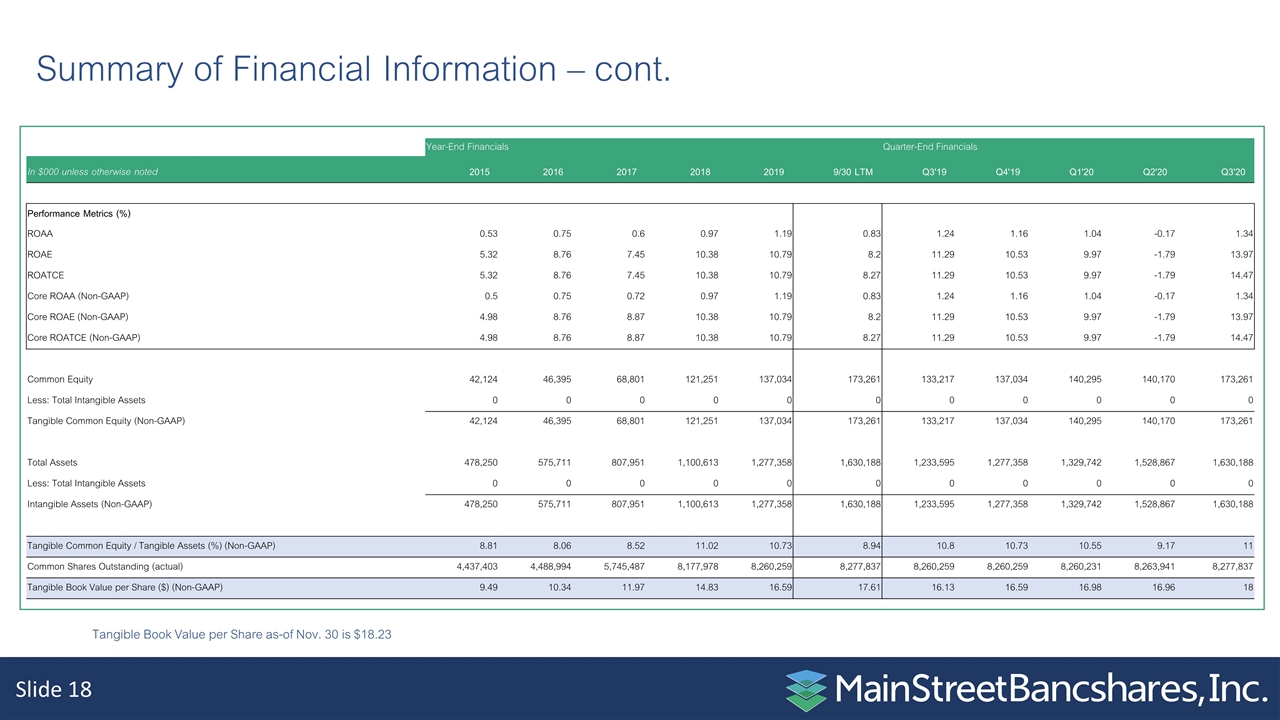
Summary of Financial Information – cont. Year-End Financials Quarter-End Financials In $000 unless otherwise noted 2015 2016 2017 2018 2019 9/30 LTM Q3'19 Q4'19 Q1'20 Q2'20 Q3'20 Performance Metrics (%) ROAA 0.53 0.75 0.6 0.97 1.19 0.83 1.24 1.16 1.04 -0.17 1.34 ROAE 5.32 8.76 7.45 10.38 10.79 8.2 11.29 10.53 9.97 -1.79 13.97 ROATCE 5.32 8.76 7.45 10.38 10.79 8.27 11.29 10.53 9.97 -1.79 14.47 Core ROAA (Non-GAAP) 0.5 0.75 0.72 0.97 1.19 0.83 1.24 1.16 1.04 -0.17 1.34 Core ROAE (Non-GAAP) 4.98 8.76 8.87 10.38 10.79 8.2 11.29 10.53 9.97 -1.79 13.97 Core ROATCE (Non-GAAP) 4.98 8.76 8.87 10.38 10.79 8.27 11.29 10.53 9.97 -1.79 14.47 Common Equity 42,124 46,395 68,801 121,251 137,034 173,261 133,217 137,034 140,295 140,170 173,261 Less: Total Intangible Assets 0 0 0 0 0 0 0 0 0 0 0 Tangible Common Equity (Non-GAAP) 42,124 46,395 68,801 121,251 137,034 173,261 133,217 137,034 140,295 140,170 173,261 Total Assets 478,250 575,711 807,951 1,100,613 1,277,358 1,630,188 1,233,595 1,277,358 1,329,742 1,528,867 1,630,188 Less: Total Intangible Assets 0 0 0 0 0 0 0 0 0 0 0 Intangible Assets (Non-GAAP) 478,250 575,711 807,951 1,100,613 1,277,358 1,630,188 1,233,595 1,277,358 1,329,742 1,528,867 1,630,188 Tangible Common Equity / Tangible Assets (%) (Non-GAAP) 8.81 8.06 8.52 11.02 10.73 8.94 10.8 10.73 10.55 9.17 11 Common Shares Outstanding (actual) 4,437,403 4,488,994 5,745,487 8,177,978 8,260,259 8,277,837 8,260,259 8,260,259 8,260,231 8,263,941 8,277,837 Tangible Book Value per Share ($) (Non-GAAP) 9.49 10.34 11.97 14.83 16.59 17.61 16.13 16.59 16.98 16.96 18 Tangible Book Value per Share as-of Nov. 30 is $18.23
