Attached files
| file | filename |
|---|---|
| 8-K - 8-K - Citizens Community Bancorp Inc. | czwi-20201204.htm |

Filed Pursuant to Rule 433 Registration Statement No. __________ Issuer Free Writing Prospectus Dated October __, 2015 Relating to Preliminary Prospectus Supplement Dated October __, 2015 2020 Third Quarter Results Citizens Community Bancorp Inc. Raymond James Emerging Markets Conference EXHIBIT 99.1

DATES AND PERIODS PRESENTED Unless otherwise noted, “20YY” refers to either the corresponding fiscal year-end date or the corresponding 12-months (i.e. fiscal year) then ended. “MMM-YY” refers to either the corresponding quarter-end date, or the corresponding three-month period then ended. CAUTIONARY NOTE REGARDING FORWARD LOOKING STATEMENTS This presentation contains certain forward-looking statements within the meaning of Section 27A of the Securities Act of 1933, and Section 21E of the Securities Exchange Act of 1934. These statements include, but are not limited to, descriptions of the financial condition, results of operations, asset and credit quality trends, profitability, projected earnings, future plans, strategies and expectations of Citizens Community Bancorp, Inc. (“CZWI” or the “Company”) and its subsidiary, Citizens Community Federal, National Association (“CCFBank”) . The Company intends such forward-looking statements to be covered by the safe harbor provisions for forward-looking statements contained in the Private Securities Litigation Reform Act of 1995 and is including this statement for purposes of complying with those safe harbor provisions. Forward-looking statements, which are based on certain assumptions of the Company, are generally identifiable by use of the words “believe,” “expect,” “estimates,” “intend,” “anticipate,” “estimate,” “project,” “seek,” “target,” “potential,” “focus,” “may,” “preliminary,” “could,” “should” or similar expressions. These forward-looking statements express management’s current expectations or forecasts of future events, and by their nature, are subject to risks and uncertainties. Therefore, there are a number of factors that might cause actual results to differ materially from those in such statements. These uncertainties include conditions in the financial markets and economic conditions generally; adverse impacts to the Company or CCFBank arising from the COVID-19 pandemic; the possibility of a deterioration in the residential real estate markets; interest rate risk; lending risk; the sufficiency of loan allowances; changes in the fair value or ratings downgrades of our securities; competitive pressures among depository and other financial institutions; our ability to maintain our reputation; our ability to realize the benefits of net deferred tax assets; our ability to maintain or increase our market share; acts of terrorism and political or military actions by the United States or other governments; legislative or regulatory changes or actions, or significant litigation, adversely affecting the Company or CCFBank; increases in FDIC insurance premiums or special assessments by the FDIC; disintermediation risk; our inability to obtain needed liquidity; risks related to the ongoing integration of F. & M. Bancorp. Of Tomah Inc. into the Company’s operations; our ability to successfully execute our acquisition growth strategy; risks posed by acquisitions and other expansion opportunities, including difficulties and delays in integrating the acquired business operations or fully realizing the cost savings and other benefits; our ability to raise capital needed to fund growth or meet regulatory requirements; the possibility that our internal controls and procedures could fail or be circumvented; our ability to attract and retain key personnel; our ability to keep pace with technological change; cybersecurity risks; changes in federal or state tax laws; changes in accounting principles, policies or guidelines and their impact on financial performance; restrictions on our ability to pay dividends; and the potential volatility of our stock price. Stockholders, potential investors and other readers are urged to consider these factors carefully in evaluating the forward-looking statements and are cautioned not to place undue reliance on such forward- looking statements. Such uncertainties and other risks that may affect the Company's performance are discussed further in Part I, Item 1A, "Risk Factors," in the Company's Form 10-K, for the year ended December 31, 2019 filed with the Securities and Exchange Commission ("SEC") on March 10, 2020, the Company’s Form 10-Qs for the quarters ended March 31, 2020, June 30, 2020 and September 30, 2020, filed with the SEC on May 11, 2020, August 6, 2020 and November 6, 2020, and the Company's subsequent filings with the SEC. The Company undertakes no obligation to make any revisions to the forward-looking statements contained herein or to update them to reflect events or circumstances occurring after the date hereof. NON-GAAP FINANCIAL MEASURES These slides may contain non-GAAP financial measures. For purposes of Regulation G, a non-GAAP financial measure is a numerical measure of the registrant's historical or future financial performance, financial position or cash flows that excludes amounts, or is subject to adjustments that have the effect of excluding amounts, that are included in the most directly comparable measure calculated and presented in accordance with GAAP in the statement of income, balance sheet or statement of cash flows (or equivalent statements) of the issuer; or includes amounts, or is subject to adjustments that have the effect of including amounts, that are excluded from the most directly comparable measure so calculated and presented. In this regard, GAAP refers to generally accepted accounting principles in the United States. Non·GAAP financial measures referred to herein include net income as adjusted, EPS as adjusted, ROAA as adjusted, ROATCE, tangible book value per share, efficiency ratio, efficiency ratio as adjusted and tangible common equity / tangible assets. Reconciliations of all Non·GAAP financial measures used herein to the comparable GAAP financial measures in the appendix at the end of this presentation. Cautionary Notes and Additional Disclosures 2

Investment Summary Diversification across geographies and industries reduces risk and enhances growth potential Improving earnings profile, leveraging infrastructure and growth to drive efficiency Strong credit metrics in CCF originated loan portfolio and improving asset quality in acquired loan portfolios Five percent stock buyback announced November 30, 2020 Strong Bank capital levels and improving holding company capital ratios Disciplined and proven acquirer 3

Values Our six main values are: integrity, commitment, innovation, collaboration, focus, and sustainability. Vision Make more possible for our customers, colleagues, communities, and shareholders! Mission Provide the best products, service, and ideas to our customers every interaction every day. Mission, Vision and Values 4

Performance Objectives Increase Tangible Book and Shareholder Value Reduced NPA’s & Classified Loans to Peer Group Median Increase Operating Leverage Consistency In Culture Targeted growth in TBV of 8-10%, increase in TCE to Tangible Assets > 8% and achieve ROA and ROE in the upper half of its peer group Aggressively reduce problem assets from acquired banks, manage the originated book prudently, and build the allowance to absorb potential COVID-19 related issues Achieve efficiency ratio in the mid 60% range by reducing branch and support expenses, optimize commercial portfolios and increase non-interest income sources Apply software and API’s to increase productivity and support future growth, while proactively managing operating and credit risk 5
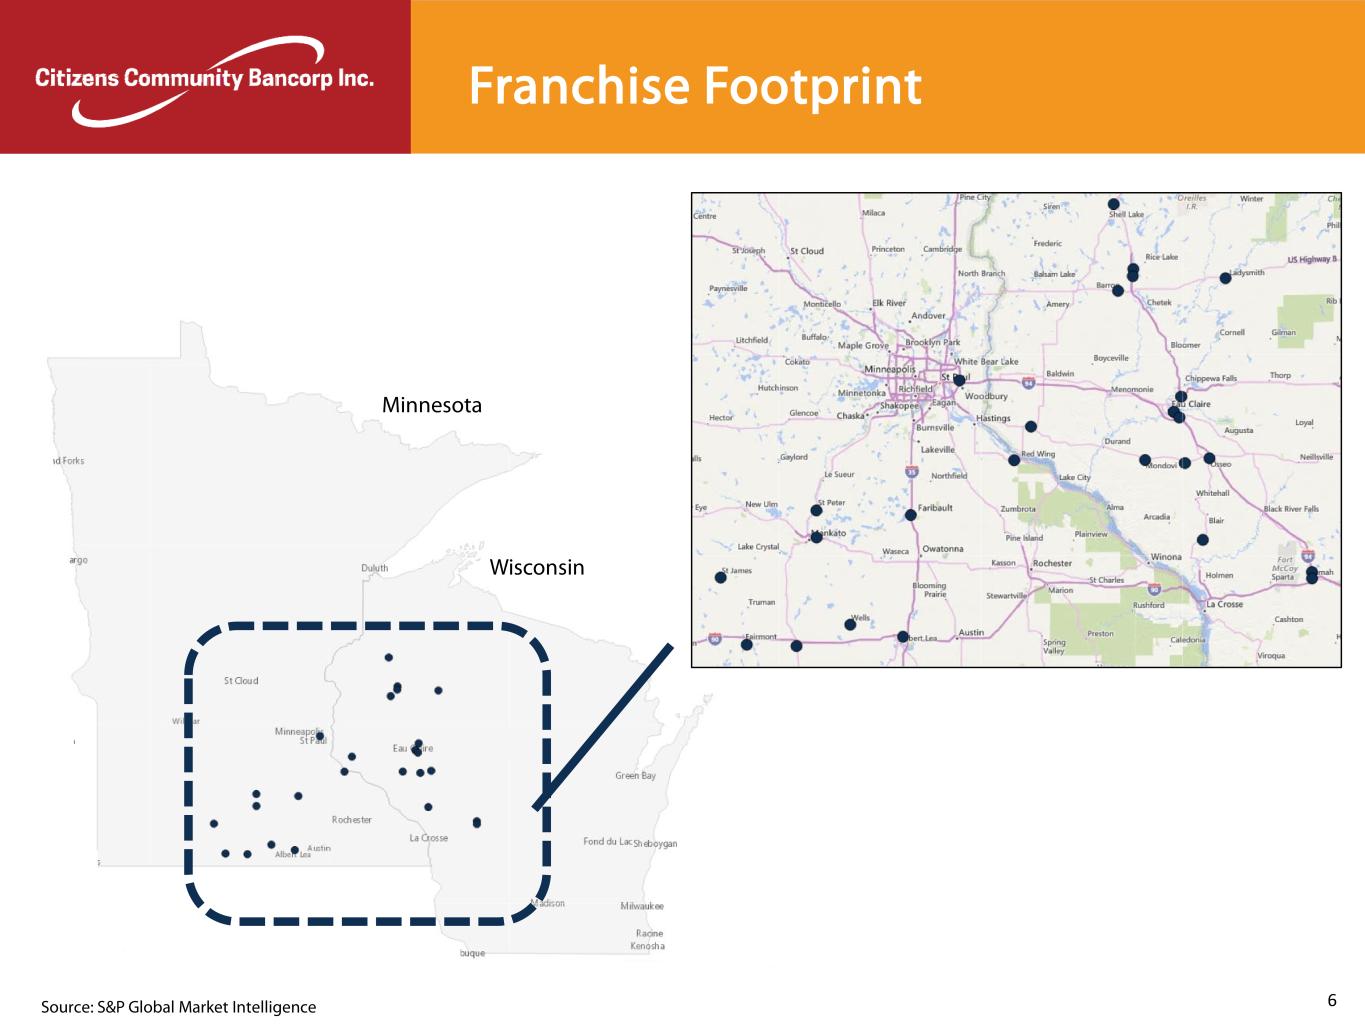
Franchise Footprint Minnesota Wisconsin Source: S&P Global Market Intelligence 0 0 0 0 0 0 0 0 0 0 6

$574 $733 $759 $1,177 $1,281 $1,230 $558 $743 $747 $1,196 $1,272 $1,271 $696 $941 $975 $1,531 $1,608 $1,623 2016 FY 2017 FY 2018 FY 2019 FY Jun-20 Sep-20 Recent Franchise Expansion CZWI has been focused on transforming the Company away from a consumer-based bank into a commercial-focused operation, creating a strengthened franchise value through this process. May 2016 Assets: $154mm Rice Lake, WI 2 Central Bank branches February 2016 Deposits: $27mm Northwestern WI August 2017 Assets: $269mm Wells, MN October 2018 Assets: $269mm Osseo, WI July 2019 Assets: $192mm Tomah, WI Total Assets Loans Receivable Total Deposits Source: S&P Global Market Intelligence, company filings 7
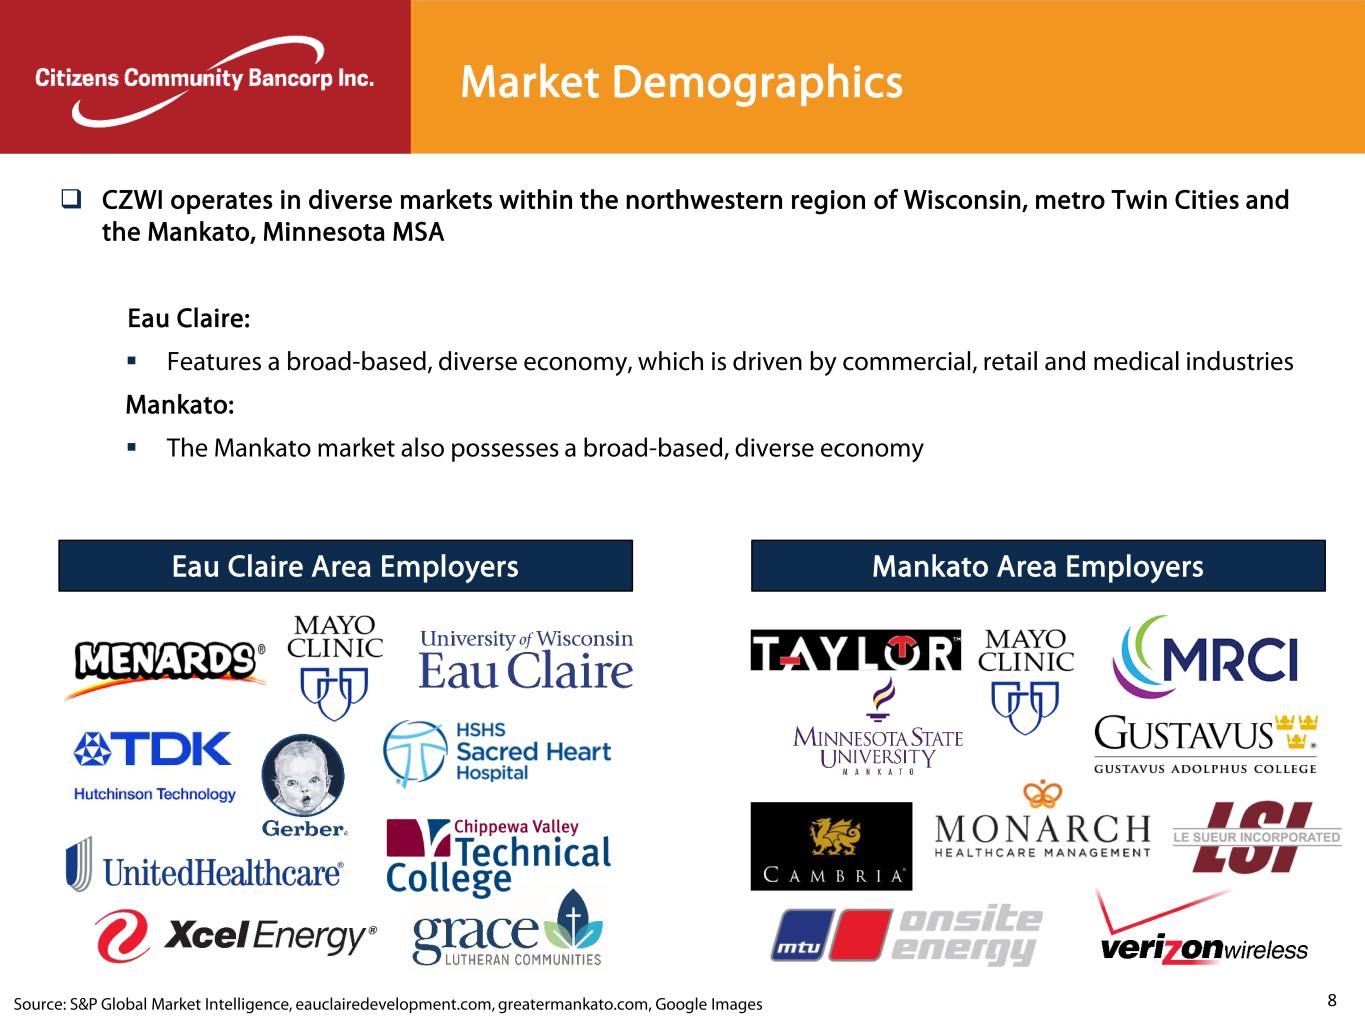
Source: S&P Global Market Intelligence, eauclairedevelopment.com, greatermankato.com, Google Images CZWI operates in diverse markets within the northwestern region of Wisconsin, metro Twin Cities and the Mankato, Minnesota MSA Eau Claire: Features a broad-based, diverse economy, which is driven by commercial, retail and medical industries Mankato: The Mankato market also possesses a broad-based, diverse economy Mankato Area EmployersEau Claire Area Employers Market Demographics 8

Net Income and Diluted EPS Source: S&P Global Market Intelligence, company filings Net Income as Adjusted and Diluted EPS Income as Adjusted are non-GAAP financial measures, which management believes may be helpful in understanding the Company's results of operations or financial position and comparing results over different periods. Reconciliation of Income and Diluted EPS Income as Adjusted to the comparable GAAP financial measure can be found in the appendix of this presentation. These measures should not be viewed as a substitute for operating results determined in accordance with GAAP. $2,573 $2,499 $4,283 $9,463 $2,606 $3,069 $3,480$3,563 $4,221 $4,962 $10,675 $2,606 $2,786 $3,348 $0 $2,000 $4,000 $6,000 $8,000 $10,000 $12,000 2016 2017 2018 2019 Mar-20 Jun-20 Sep-20 Net Income Net Income Net Income as Adjusted $0.49 $0.46 $0.58 $0.85 $0.23 $0.28 $0.31 $0.67 $0.78 $0.68 $0.96 $0.23 $0.25 $0.30 $0.00 $0.20 $0.40 $0.60 $0.80 $1.00 $1.20 2016 2017 2018 2019 Mar-20 Jun-20 Sep-20 Diluted EPS Diluted EPS Diluted EPS Income as Adjusted 9
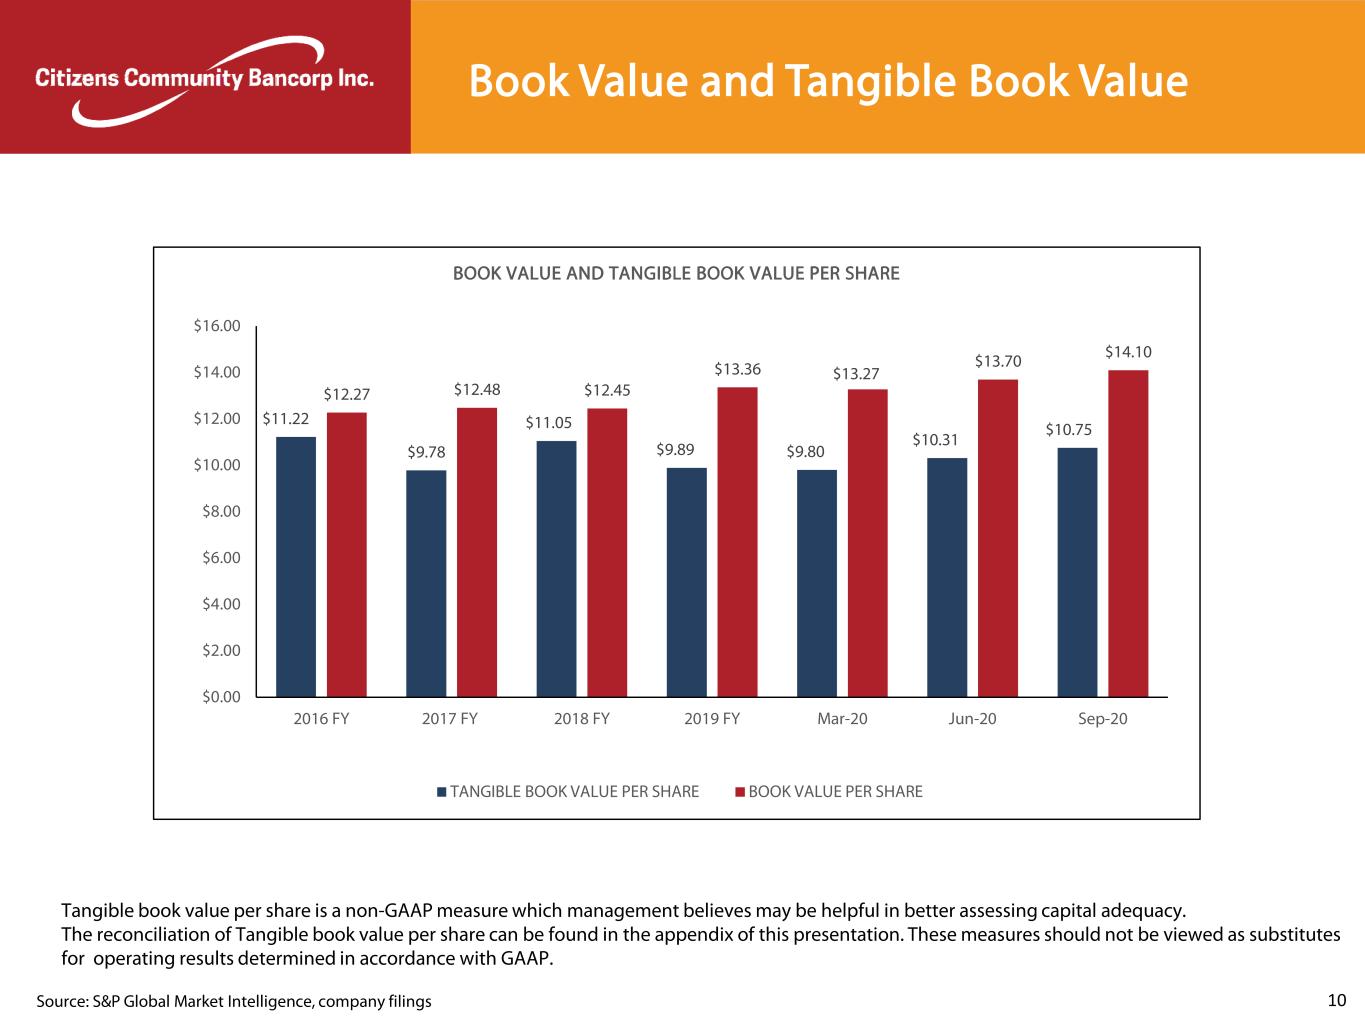
Book Value and Tangible Book Value Source: S&P Global Market Intelligence, company filings Tangible book value per share is a non-GAAP measure which management believes may be helpful in better assessing capital adequacy. The reconciliation of Tangible book value per share can be found in the appendix of this presentation. These measures should not be viewed as substitutes for operating results determined in accordance with GAAP. $11.22 $9.78 $11.05 $9.89 $9.80 $10.31 $10.75 $12.27 $12.48 $12.45 $13.36 $13.27 $13.70 $14.10 $0.00 $2.00 $4.00 $6.00 $8.00 $10.00 $12.00 $14.00 $16.00 2016 FY 2017 FY 2018 FY 2019 FY Mar-20 Jun-20 Sep-20 BOOK VALUE AND TANGIBLE BOOK VALUE PER SHARE TANGIBLE BOOK VALUE PER SHARE BOOK VALUE PER SHARE 10

4.4% 4.3% 4.8% 9.0% 9.5% 11.0% 12.0% 6.2% 7.3% 5.6% 10.1% 9.5% 10.0% 11.0% 0.0% 5.0% 10.0% 15.0% 20.0% 2016 2017 2018 2019 Mar-20 Jun-20 Sep-20 ROATCE ROATCE ROATCE INCOME AS ADJUSTED 0.40% 0.34% 0.45% 0.68% 0.69% 0.78% 0.85% 0.56% 0.58% 0.52% 0.76% 0.69% 0.71% 0.82% 0.00% 0.20% 0.40% 0.60% 0.80% 1.00% 1.20% 1.40% 2016 2017 2018 2019 Mar-20 Jun-20 Sep-20 ROAA ROAA ROAA INCOME AS ADJUSTED Return on average assets (ROAA), return on average assets as adjusted, return on average tangible common equity (ROATCE) and return on average tangible common equity as adjusted are non-GAAP measures, which management believes may be helpful in better understanding the underlying business performance trends related to average assets and average tangible equity. Reconciliations of ROAA as adjusted and ROTCE as adjusted can be found in the appendix of this presentation. These measures should not be viewed as substitutes for operating results determined in accordance with GAAP. Return on Average Assets and Return on Average Tangible Common Equity Source: SEC filings and Company documents 11

84% 85% 79% 73% 66% 66% 63% 77% 75% 78% 68% 66% 67% 64% 40% 45% 50% 55% 60% 65% 70% 75% 80% 85% 90% 2016 2017 2018 2019 Mar-20 Jun-20 Sep-20 EFFICIENCY RATIO EFFICIENCY RATIO EFFICIENCY RATIO AS ADJUSTED 3.27% 3.31% 3.42% 3.37% 3.64% 3.34% 3.11% 3.00% 3.20% 3.40% 3.60% 3.80% 4.00% 2016 2017 2018 2019 Mar-20 Jun-20 Sep-20 NET INTEREST MARGIN Efficiency Ratio and Net Interest Margin The efficiency ratio as adjusted is a non-GAAP measure, which management believes may be helpful in better understanding the underlying business performance trends related to non-interest expense. A reconciliation of the efficiency ratio as adjusted to its comparable financial measure can be found in the appendix of this presentation. This measure should not be viewed as a substitute for operating results determined in accordance with GAAP. Note: Net Interest Margin excluding realized non-accretable difference and schedule accretion on purchased loans was 3.01% for the quarter ended September 30, 2020, compared to 3.19% for the quarter ended June 30, 2020. 12

Capital Ratios Note: TCE/TA excluding PPP loans at 6/30/2020 was 8.0%; TCE/TA excluding PPP loans at 9/30/2020 was 8.3%. Note: 2018 FY represents the completion of the 2018 offering of $65 million, but does not include the acquisition of United Bank Source: S&P Global Market Intelligence, company filings 8.5% 6.2% 12.6% 9.9% 7.3% 7.6% 0.0% 2.0% 4.0% 6.0% 8.0% 10.0% 12.0% 14.0% 16.0% 18.0% 20.0% 2016 FY 2017 FY 2018 FY 2019 FY Jun-20 Sep-20 TANGIBLE COMMON EQUITY / TANGIBLE ASSETS 8.3% 6.6% 12.7% 7.7% 7.4% 7.5% 0.0% 2.0% 4.0% 6.0% 8.0% 10.0% 12.0% 14.0% 16.0% 18.0% 20.0% 2016 FY 2017 FY 2018 FY 2019 FY Jun-20 Sep-20 LEVERAGE RATIO 11.4% 8.8% 16.8% 9.1% 9.7% 10.5% 0.0% 2.0% 4.0% 6.0% 8.0% 10.0% 12.0% 14.0% 16.0% 18.0% 20.0% 2016 FY 2017 FY 2018 FY 2019 FY Jun-20 Sep-20 COMMON EQUITY TIER 1 RATIO 12.6% 12.0% 19.8% 11.2% 12.1% 14.3% 0.0% 2.0% 4.0% 6.0% 8.0% 10.0% 12.0% 14.0% 16.0% 18.0% 20.0% 2016 FY 2017 FY 2018 FY 2019 FY Jun-20 Sep-20 TOTAL CAPITAL RATIO 13

Asset Quality Building allowance to absorb any COVID-19 related issues Strong credit quality on CCF originated loan portfolio Actively reducing NPAs on acquired loan portfolio Source: S&P Global Market Intelligence, company filings 0.10% 0.07% 0.07% 0.08% 0.08% 0.00% 0.20% 0.40% 0.60% 0.80% 1.00% 2016 FY 2017 FY 2018 FY 2019 FY Sep-20 NET CHARGE OFFS (NCOS)/ AVERAGE LOANS NCOS / AVERAGE LOANS 0.62% 1.49% 1.14% 1.41% 0.92% 0.00% 0.50% 1.00% 1.50% 2.00% 2.50% 2016 FY 2017 FY 2018 FY 2019 FY Sep-20 NPAs / ASSETS CCF ORIGINATED NPA/ASSETS CCF ACQUIRED NPA/ASSETS 1.06% 0.81% 0.89% 0.87% 1.21% 0.25% 0.30% 0.60% 0.55% 0.13% 0.00% 0.20% 0.40% 0.60% 0.80% 1.00% 1.20% 1.40% 1.60% 2016 FY 2017 FY 2018 FY 2019 FY Sep-20 ALLL AND NON-ACCRETABLE DIFFERENCE TO TOTAL LOANS ALLL AS A % OF TOTAL LOANS NON-ACCRETABLE DIFF ON PCI LOANS 1.42% 1.34%1.31% 1.11% 1.49% 14

COVID-19 Related Loan Deferrals Company filings Dollars in Thousands Hotel includes approximately $45 million of second deferrals granted under the Cares Act, which involve an interest only payment and the Bank generally receives the reserve accounts pledge. 15 At September 30, 2020 Earnings Supplement September 2020 Updated November 2020 Commercial Deferrals 122,613$ 122,613$ Residential Deferrals 3,589 3,962 Consumer Deferrals 546 592 Total Deferrals at September 30, 2020 126,748 127,167 Forecasted Next P&I Payment in Fourth Quarter (49,912) (8,845) Made first P&I Payment October 1 through November 2020 - (51,365) November hotel payoffs (on deferral prior to payoff) - (8,432) Other principal reduction, primarily due to payoffs - (2,720) Estimated Deferrals December 31, 2020 76,836$ 55,805$ Recap estimated at December 31, 2020 Earnings Supplement September 2020 Updated November 2020 Hotel - Modification ends March 31, 2021 Quarter End 16,309$ 3,978$ Hotel - Modification ends June 30, 2021 Quarter End 53,904 45,450 Other Commercial Modification ends June 30, 2021 Quarter End 2,488 1,823 Residential 3,589 3,962 Consumer 546 592 Forecasted Total December 31, 2020 76,836$ 55,805$

Loan Portfolio CZWI has transformed its loan portfolio through organic growth and acquisitions Change has occurred from a primarily consumer focused portfolio to a diversified mix consisting of commercial real estate, agricultural and commercial business loans Credit quality remains a focus in conjunction with loan growth Transformation of the loan portfolio has occurred through both acquisitions and organic growth Note: Transformation charts exclude PPP loans Source: S&P Global Market Intelligence, company filings 9/30/2016 9/30/2020 CRE, C&I, Ag. Related, C&D 34% Residential & HELOC 33% Consumer 33% ($000s) Sep-16 Sep-17 Sep-18 Dec-19 Mar-20 Jun-20 Sep-20 Commercial Real Estate $54,600 $109,024 $156,735 $420,383 $424,497 $419,967 $413,100 Housing related CRE $53,475 $77,166 $108,029 $181,084 $198,636 $193,397 $197,242 Commercial & Industrial $31,001 $55,251 $76,254 $133,734 $122,006 $109,846 $104,372 Ag. Real Estate / Ag. Operating $42,845 $91,875 $97,066 $123,143 $121,358 $116,129 $107,100 Construction & Development $16,580 $19,708 $17,739 $86,410 $95,918 $110,132 $89,338 MRQ SBA PPP Loans $0 $0 $0 $0 $0 $137,330 $139,166 Yield Residential mortgage and Purchased HELOC loans $187,738 $247,634 $209,781 $184,739 $173,412 $159,285 $148,402 4.48% Indirect Consumer Installment $168,294 $115,287 $78,245 $39,585 $36,414 $32,031 $28,534 Consumer Installment $19,715 $20,668 $18,844 $18,186 $17,184 $15,814 $14,630 Total Gross Loans $574,248 $736,613 $762,693 $1,187,264 $1,189,425 $1,293,931 $1,241,884 CRE, C&I, Ag. Related, C&D 85% Residential & HELOC 12% Consumer 3% 16
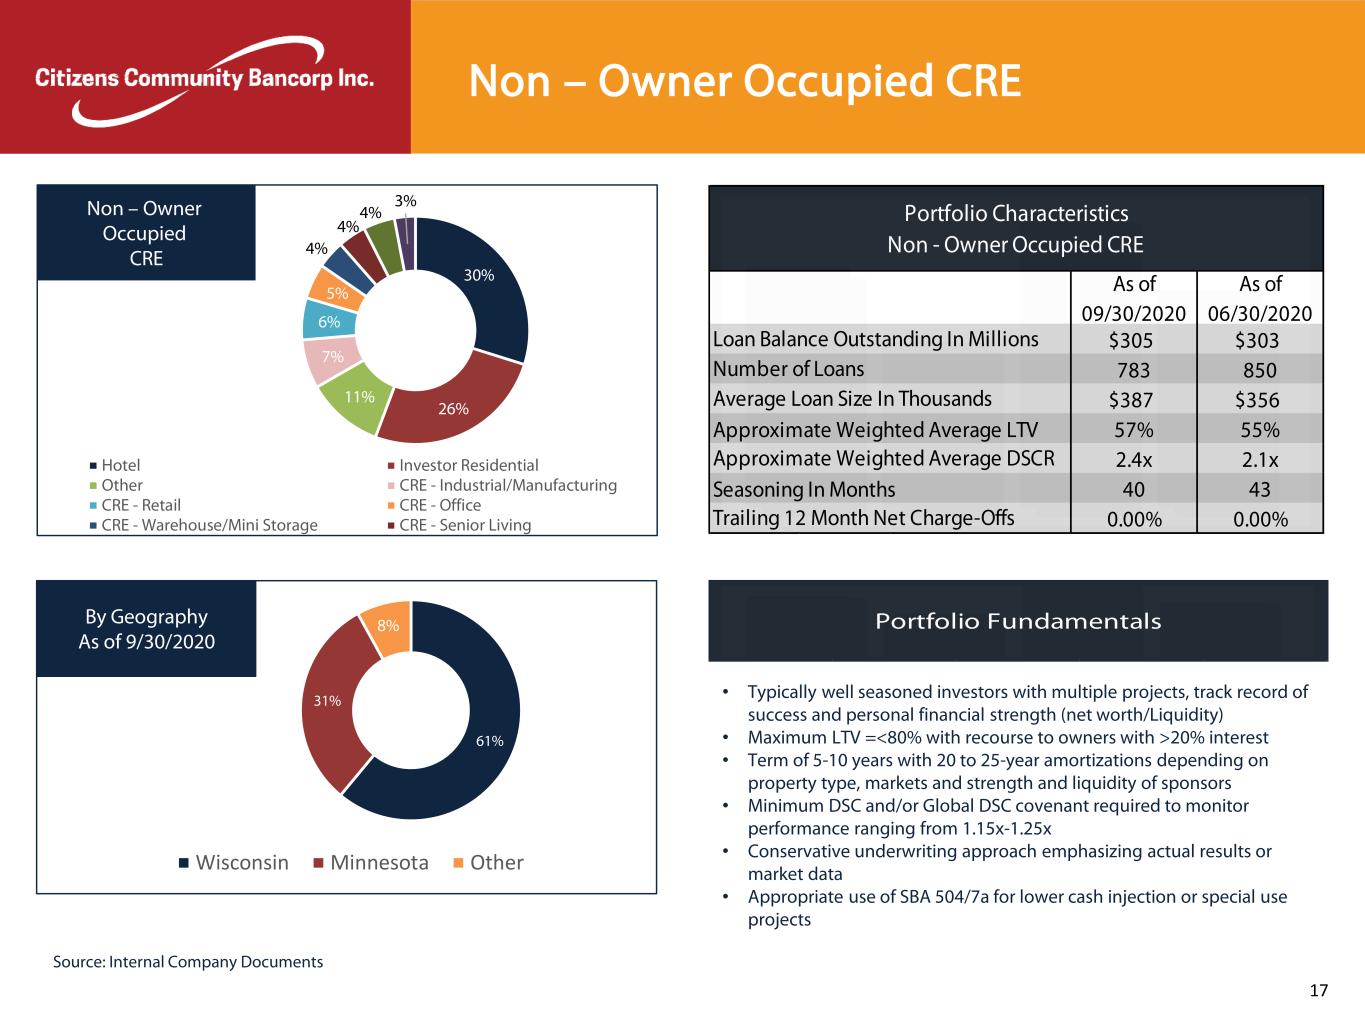
Source: Internal Company Documents Portfolio Fundamentals 61% 31% 8% Wisconsin Minnesota Other By Geography As of 9/30/2020 • Typically well seasoned investors with multiple projects, track record of success and personal financial strength (net worth/Liquidity) • Maximum LTV =<80% with recourse to owners with >20% interest • Term of 5-10 years with 20 to 25-year amortizations depending on property type, markets and strength and liquidity of sponsors • Minimum DSC and/or Global DSC covenant required to monitor performance ranging from 1.15x-1.25x • Conservative underwriting approach emphasizing actual results or market data • Appropriate use of SBA 504/7a for lower cash injection or special use projects Non – Owner Occupied CRE As of 09/30/2020 As of 06/30/2020 $305 $303 783 850 $387 $356 Approximate Weighted Average LTV 57% 55% 2.4x 2.1x Seasoning In Months 40 43 0.00% 0.00% Approximate Weighted Average DSCR Trailing 12 Month Net Charge-Offs Loan Balance Outstanding In Millions Number of Loans Average Loan Size In Thousands Portfolio Characteristics Non - Owner Occupied CRE 30% 26% 11% 7% 6% 5% 4% 4% 4% 3% Hotel Investor Residential Other CRE - Industrial/Manufacturing CRE - Retail CRE - Office CRE - Warehouse/Mini Storage CRE - Senior Living Non – Owner Occupied CRE 17
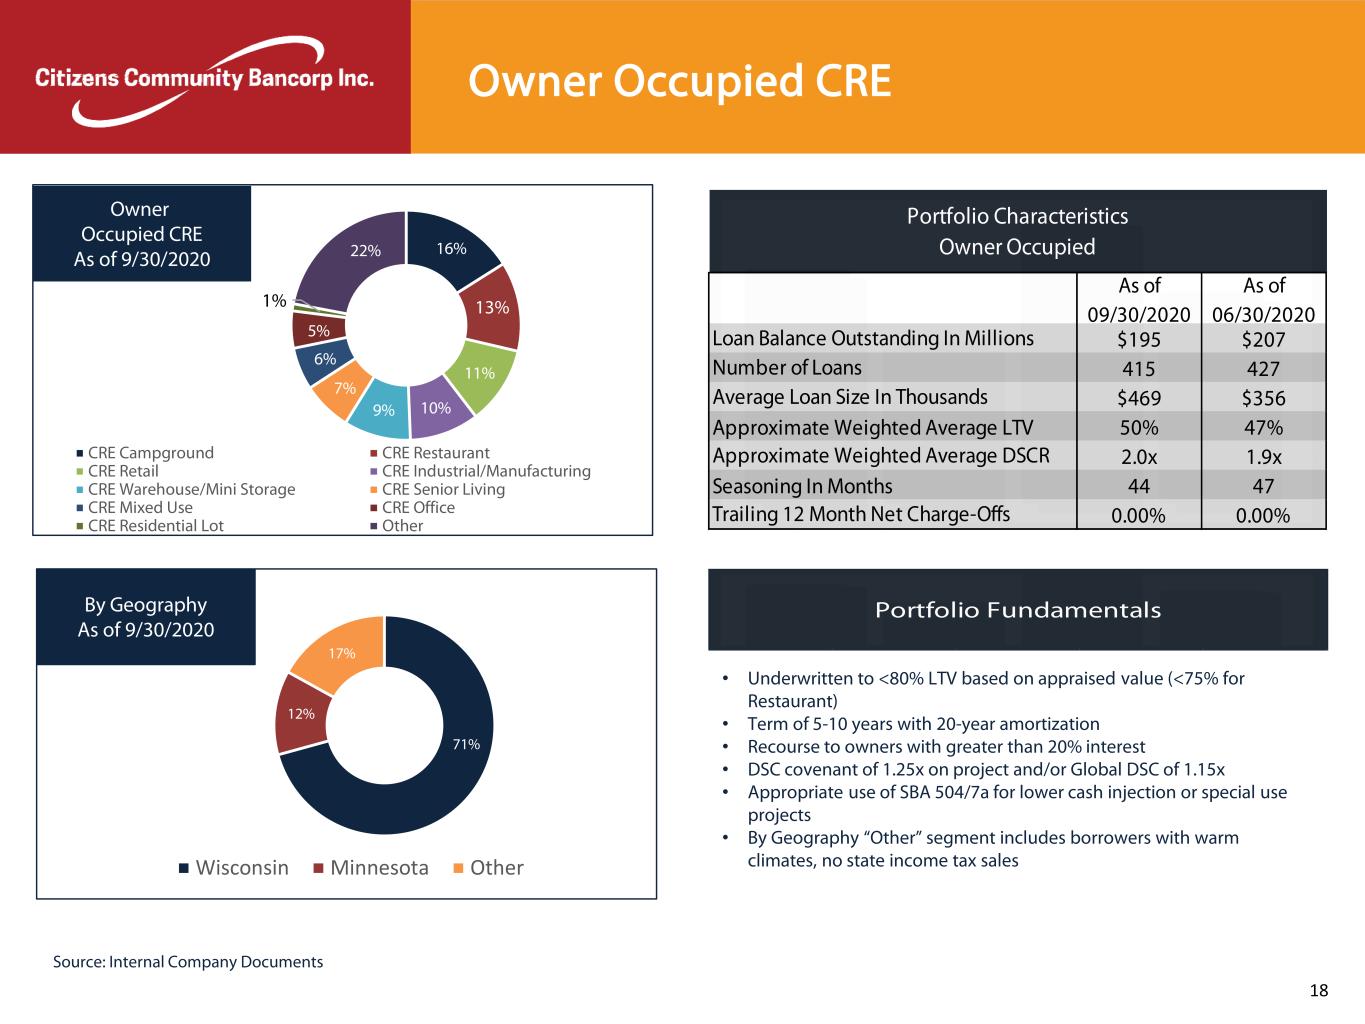
Source: Internal Company Documents 16% 13% 11% 10%9% 7% 6% 5% 1% 22% CRE Campground CRE Restaurant CRE Retail CRE Industrial/Manufacturing CRE Warehouse/Mini Storage CRE Senior Living CRE Mixed Use CRE Office CRE Residential Lot Other Owner Occupied CRE As of 9/30/2020 Portfolio Fundamentals 71% 12% 17% Wisconsin Minnesota Other By Geography As of 9/30/2020 • Underwritten to <80% LTV based on appraised value (<75% for Restaurant) • Term of 5-10 years with 20-year amortization • Recourse to owners with greater than 20% interest • DSC covenant of 1.25x on project and/or Global DSC of 1.15x • Appropriate use of SBA 504/7a for lower cash injection or special use projects • By Geography “Other” segment includes borrowers with warm climates, no state income tax sales Owner Occupied CRE As of 09/30/2020 As of 06/30/2020 $195 $207 415 427 $469 $356 Approximate Weighted Average LTV 50% 47% 2.0x 1.9x Seasoning In Months 44 47 0.00% 0.00% Approximate Weighted Average DSCR Trailing 12 Month Net Charge-Offs Portfolio Characteristics Owner Occupied Loan Balance Outstanding In Millions Number of Loans Average Loan Size In Thousands 18

Portfolio Fundamentals 53%46% 1% Wisconsin Minnesota Other By Geography As of 9/30/2020 100% Multi-family Multi-family As of 9/30/2020 Source: Internal Company Documents • Robust housing markets in Eau Claire and Mankato markets supported by student populations at state universities, technical colleges, and growing population and job markets • Multi-family sponsors experienced owners with multi-project portfolios • Typically underwritten to 75% LTV based on appraised value with recourse; metro markets and/or strong sponsors may warrant up to 80% LTV • Term of 5-10 years with 20 to 25-year amortization (varies by new versus existing, size of market and sponsor strength) • Covenant for minimum DSC/Global DSC Multi-family As of 09/30/2020 As of 06/30/2020 $110 $104 94 93 $1.16 $1.12 67% 59% Approximate Weighted Average DSCR 1.9x 1.8x 25 27 0.00% 0.00% Approximate Weighted Average LTV Seasoning In Months Trailing 12 Month Net Charge-Offs Portfolio Characteristics - Multi-family Loan Balance Outstanding In Millions Number of Loans Average Loan Size In Millions 19

84% 13% 3% Wisconsin Minnesota Other By Geography As of 9/30/2020 16% 11% 9% 9% 8% 8% 6% 5% 5% 5% 5% 4% 4% 3% 2% Manufacturing Public Administration Construction Real Estate, Rental and Leasing Transportation and Warehousing Other Services Wholesale Trade Retail Trade Educational Services Administrative and Support Finance and Insurance Professional Services Other Agriculture Health Care Commercial & Industrial As of 9/30/2020 Portfolio Fundamentals Source: Internal Company Documents • Highly diversified, secured loan portfolio underwritten with recourse • Lines of credit reviewed annually and may have borrowing base certificates governing line usage • Fixed asset LTV’s based on age and type of equipment; <5-year amortization • Use of SBA Guaranty Program (Preferred Lender or General Processing) as appropriate • “Retail Trade” segment consists of Farm Supply, Franchised Hardware, Franchised Auto Parts, Franchised and Non-franchised Auto Dealers and Repair Shops, Convenience Stores/Gas Stations Commercial & Industrial Loans As of 09/30/2020 As of 06/30/2020 $105 $110 740 864 $141 $127 2.3x 2.6x 32 34 0.51% 0.44% Committed Line, if collateral 51 65 Approximate Weighted Average DSCR Seasoning In Months Trailing 12 Month Net Charge-Offs Portfolio Characteristics - Commercial & Industrial Loan Balance In Millions Number of Loans Average Loan Size In Thousands 20
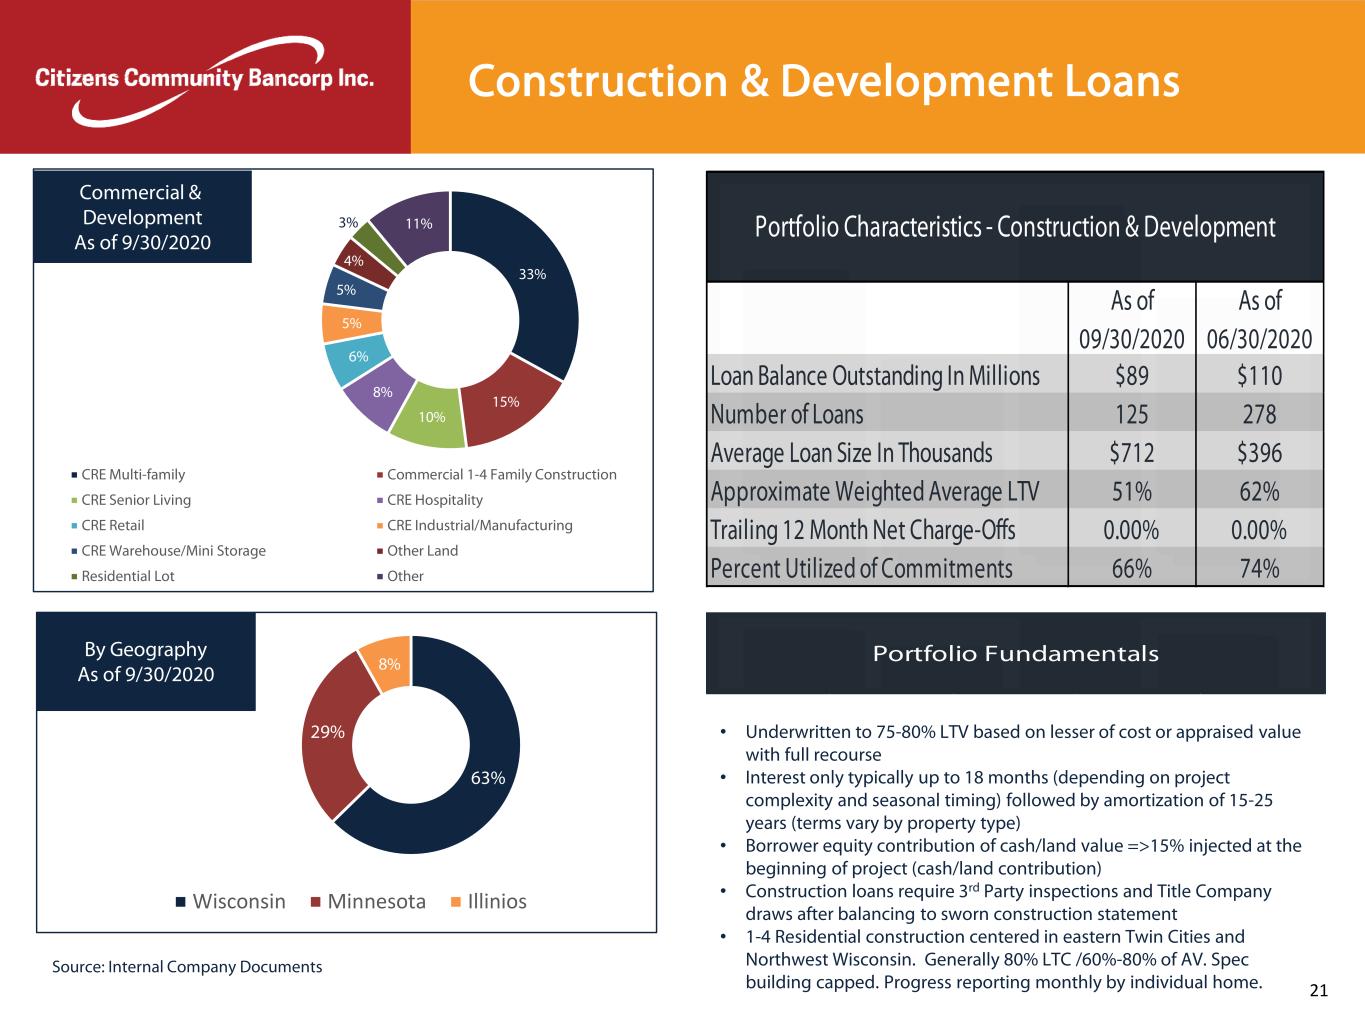
Portfolio Fundamentals 33% 15% 10% 8% 6% 5% 5% 4% 3% 11% CRE Multi-family Commercial 1-4 Family Construction CRE Senior Living CRE Hospitality CRE Retail CRE Industrial/Manufacturing CRE Warehouse/Mini Storage Other Land Residential Lot Other Commercial & Development As of 9/30/2020 63% 29% 8% Wisconsin Minnesota Illinios By Geography As of 9/30/2020 Source: Internal Company Documents • Underwritten to 75-80% LTV based on lesser of cost or appraised value with full recourse • Interest only typically up to 18 months (depending on project complexity and seasonal timing) followed by amortization of 15-25 years (terms vary by property type) • Borrower equity contribution of cash/land value =>15% injected at the beginning of project (cash/land contribution) • Construction loans require 3rd Party inspections and Title Company draws after balancing to sworn construction statement • 1-4 Residential construction centered in eastern Twin Cities and Northwest Wisconsin. Generally 80% LTC /60%-80% of AV. Spec building capped. Progress reporting monthly by individual home. Construction & Development Loans As of 09/30/2020 As of 06/30/2020 Loan Balance Outstanding In Millions $89 $110 Number of Loans 125 278 Average Loan Size In Thousands $712 $396 Approximate Weighted Average LTV 51% 62% Trailing 12 Month Net Charge-Offs 0.00% 0.00% Percent Utilized of Commitments 66% 74% Portfolio Characteristics - Construction & Development 21

35% 29% 23% 13% Crop Dairy Other Farming Other Agricultural As of 9/30/2020 Portfolio Fundamentals 68% 28% 4% Wisconsin Minnesota Other By Geography As of 9/30/2020 Source: Internal Company Documents • Producers required to have marketing plans to mitigate volatility of commodities • Appropriate crop/revenue insurance and/or dairy margin protection required • Maximum Ag RE LTV of less than 65%; Equipment LTV of less than 75% • Appropriate structuring to separate crop production cycles and to match length of loan with asset financed • Use of Farmer Mac, FSA, SBA or USDA programs to address DSC, collateral margins or working capital Agricultural RE & Operating Loans As of 09/30/2020 As of 06/30/2020 $106 $116 627 664 $169 $165 1.5x 1.9x 48 52 0.12% 0.17% Approximate Weighted Average DSCR Seasoning In Months Trailing 12 Month Net Charge-Offs Portfolio Characteristics - Agriculture Loan Balance Outstanding In Millions Number of Loans Average Loan Size In Thousands 22
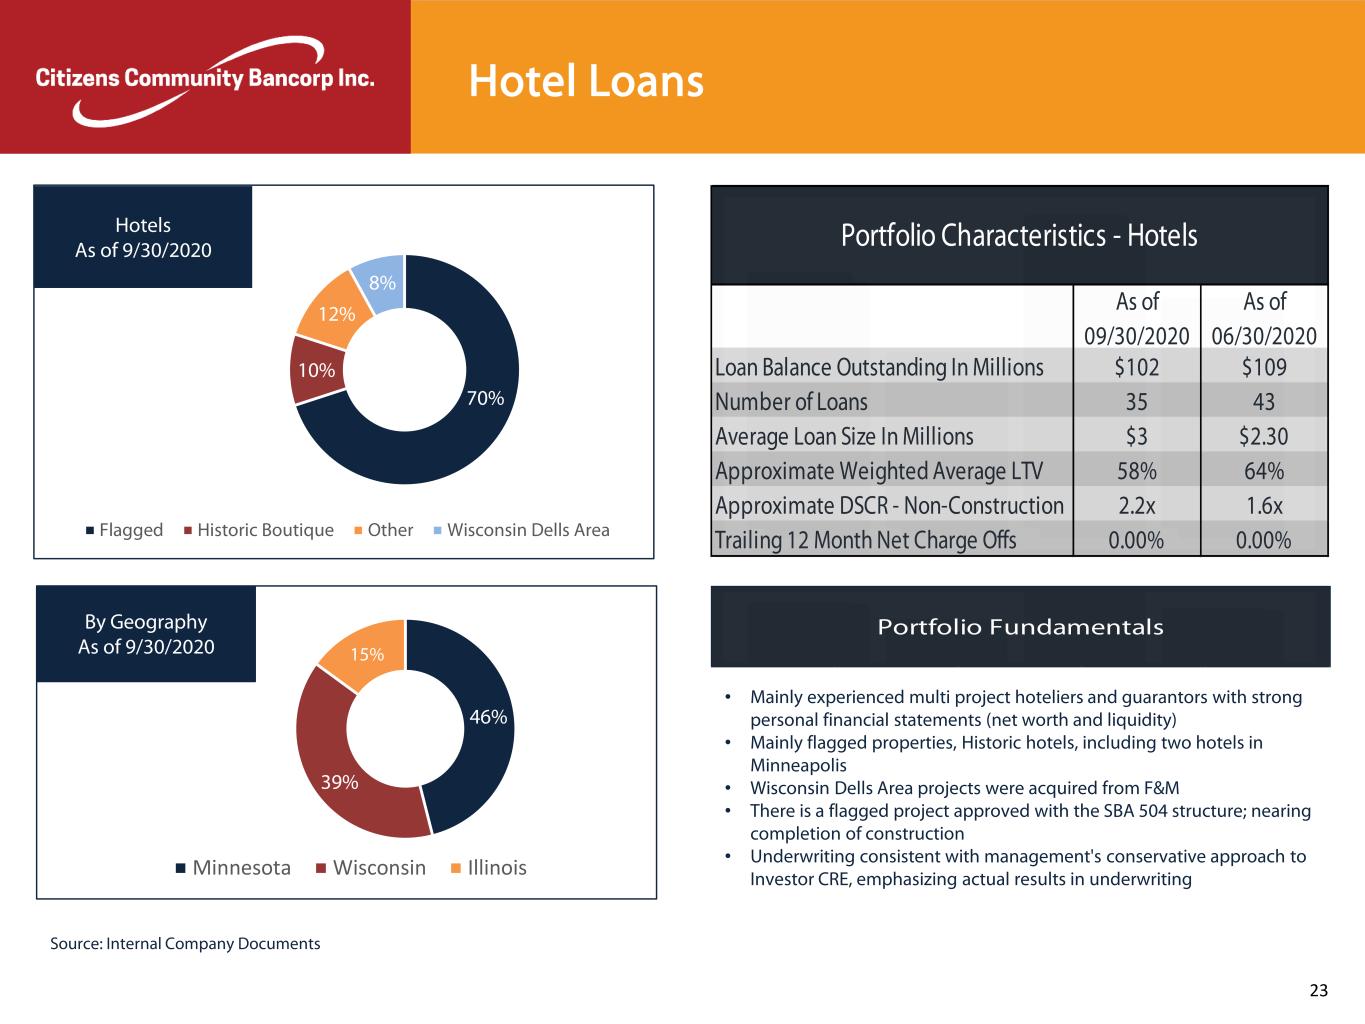
70% 10% 12% 8% Flagged Historic Boutique Other Wisconsin Dells Area Hotels As of 9/30/2020 Portfolio Fundamentals 46% 39% 15% Minnesota Wisconsin Illinois By Geography As of 9/30/2020 Source: Internal Company Documents • Mainly experienced multi project hoteliers and guarantors with strong personal financial statements (net worth and liquidity) • Mainly flagged properties, Historic hotels, including two hotels in Minneapolis • Wisconsin Dells Area projects were acquired from F&M • There is a flagged project approved with the SBA 504 structure; nearing completion of construction • Underwriting consistent with management's conservative approach to Investor CRE, emphasizing actual results in underwriting Hotel Loans As of 09/30/2020 As of 06/30/2020 $102 $109 35 43 $3 $2.30 58% 64% 2.2x 1.6x 0.00% 0.00%Trailing 12 Month Net Charge Offs Number of Loans Approximate DSCR - Non-Construction Portfolio Characteristics - Hotels Loan Balance Outstanding In Millions Average Loan Size In Millions Approximate Weighted Average LTV 23

48% 19% 13% 9% 6% 5% Culver's - Limited Service Restaurants Other National Limited Services Micro Breweries Other Drinking Establishments Restaurants As of 9/30/2020 Portfolio Fundamentals 79% 20% 1% Wisconsin Minnesota Other By Geography As of 9/30/2020 Source: Internal Company Documents • Experienced developers/operators of national Limited /Quick Service brands (Culver’s, Subway, Dairy Queen, McDonalds, Jimmy John’s, A&W) • Underwritten to =<80% LTV with full recourse (depending on sponsor history); 20-year amortization with 5 to 10-year terms • Use of SBA Guaranty Program (Preferred Lender or General Processing) as appropriate • Drinking establishments may have other collateral pledged and tend to be in smaller communities in our footprint • Micro Breweries concentrated in Eau Claire area • Lessors of RE include investor and owner-occupied structure Restaurant Loans As of 09/30/2020 As of 06/30/2020 $39 $42 91 99 $428 $426 54% 54% 2.8x 2.2x 0.00% 0.00% Portfolio Characteristics - Restaurants Approximate Weighted Average DSCR Trailing 12 Month Net Charge-Offs Loan Balance Outstanding In Millions Number of Loans Average Loan Size In Thousands Approximate Weighted Average LTV 24

Deposit Composition Focus has been on transforming the deposit composition to core deposits Deposit transformation and growth has been achieved through both acquisitions and organic initiatives 9/30/2016 9/30/2020 Source: S&P Global Market Intelligence, company filings Non Interest Bearing Demand 8% Interest Bearing Demand 9% MMDA & Savings 34% CDs 49% ($000) Sep-16 Sep-17 Sep-18 Dec-19 Mar-20 Jun-20 Sep-20 Non-interest-bearing demand deposits $45,408 $75,318 $87,495 $168,157 $150,139 $223,536 $229,217 Interest bearing demand deposits $48,934 $147,912 $139,276 $223,102 $242,824 $270,116 $279,648 MRQ Savings accounts $52,153 $102,756 $97,329 $156,599 $161,038 $185,816 $191,511 Cost of Deposits Money market accounts $137,234 $125,749 $109,314 $246,430 $243,715 $242,536 $246,651 0.70% Certificate accounts $273,948 $290,769 $313,115 $401,414 $382,339 $350,193 $323,751 Total Deposits $557,677 $742,504 $746,529 $1,195,702 $1,180,055 $1,272,197 $1,270,778 Deposit Composition - Quarter Lookback Non Interest Bearing Demand 18% Interest Bearing Demand 22%MMDA & Savings 35% CDs 25% 25

Appendix 26

BUSINESS MODEL CULTURE STRATEGIC GROWTH CREDIT • Serving small to mid-sized entrepreneurs • Responsive professionals • Products to compete vs. big banks, superior to smaller community banks • Experienced, energetic leadership team • Accountability for doing the right thing and getting results • Entrepreneurial spirit, winning attitude • Loan and deposit growth through prudent M&A • Robust commercial loan and deposit growth • Quality and quantity of earnings improving • Prudent risk taking • Process driven, transparent • Nimble, centralized approval process • Proactive risk management Key Market Differentiators 27

28 Location & ReadinessTaking Care of Colleagues 58% 42% Staff at CCF Location Remote Staff Benefits • Emergency Sick Leave for employees diagnosed, quarantined or lost daycare for children • Permit PTO accrual for employees to go negative if additional time is needed • Appreciation Pay (monthly stipend) for employees who work at bank facilities Health & Safety • Spacing and masks based on State guidelines • Remote work capabilities expanded • Assign colleagues of essential departments to multiple locations (operations/accounting etc.) • Hand sanitizers and wipes, gloves and periodic deep cleaning in all locations • Daily attendance & work location tracking of colleagues • Readiness plan to remediate COVID exposure at a bank facility Colleague Assistance, Safety & Readiness

Net Interest Margin Analysis Source: S&P Global Market Intelligence, company filings (1) The decrease is primarily related to higher realized non-accretable difference, included in loan interest income, due to the payoff of certain purchased credit impaired loans in the prior quarter. (2) Fully taxable equivalent. The average yield on tax exempt securities is computed on a tax equivalent basis using a tax rate of 21% for the quarters ended September 30, 2020, June 30, 2020 and March 31, 2020. 29 Quarter ended September 30, 2020 Quarter ended June 30, 2020 Quarter ended March 31, 2020 Interest Average Interest Average Interest Average Average Income/ Yield/ Average Income/ Yield/ Average Income/ Yield/ ($ Dollars in Thousands) Balance Expense Rate Balance Expense Rate Balance Expense Rate Average interest earning assets: Cash and cash equivalents 77,774$ 18$ 0.09% 19,995$ 5$ 0.10% 31,069$ 118$ 1.53% Loans receivable (1) 1,258,224 14,154 4.48% 1,266,273 14,687 4.66% 1,172,246 15,459 5.30% Interest-bearing deposits 3,752 23 2.44% 3,788 23 2.44% 4,362 27 2.49% Investment securities (2) 166,622 846 2.02% 174,875 988 2.27% 179,287 1,131 2.54% Non-marketable equity securities, at cost 15,145 177 4.65% 15,160 183 4.86% 15,006 173 4.64% Total interest earning assets 1,521,517$ 15,218$ 3.98% 1,480,091$ 15,886$ 4.32% 1,401,970$ 16,908$ 4.85% Average interest-bearing liabilities: Total deposits 1,064,077$ 2,255$ 0.84% 1,052,638$ 2,607$ 1.00% 1,022,678$ 3,180$ 1.25% FHLB Advances & Other Borrowings 173,758 1,054 2.41% 186,191 976 2.11% 146,810 1,057 2.90% Total interest bearing liabilities 1,237,835$ 3,309$ 1.06% 1,238,829$ 3,583$ 1.16% 1,169,488$ 4,237$ 1.46% Net interest income 11,909$ 12,303$ 12,671$ Interest Rate Spread 2.92% 3.16% 3.39% Net interest margin 3.11% 3.34% 3.64%

Reconciliation of Non-GAAP Financial Measures Reconciliation of GAAP Earnings and Core Earnings (non-GAAP): GAAP pre-tax earnings 3,859$ 3,822$ 6,609$ 12,277$ 3,543$ 4,174$ 4,747$ Merger related costs (1) 701$ 1,860$ 463$ 3,880$ -$ -$ -$ Branch closure costs (2) 839$ 951$ 26$ 15$ -$ -$ -$ Settlement proceeds (3) -$ (283)$ -$ -$ -$ (131)$ -$ FHLB borrowings prepayment fee (4) -$ 104$ -$ -$ -$ -$ -$ Audit and Financial Reporting (5) -$ -$ -$ 358$ -$ -$ -$ Net gain on sale of branch -$ -$ -$ (2,295)$ -$ -$ -$ Net gain on sale of acquired business lines (6) -$ -$ -$ -$ -$ (252)$ (180)$ Income before provision for income taxes as adjusted (7) 5,399$ 6,454$ 7,098$ 14,235$ 3,543$ 3,791$ 4,567$ Provision for income tax on pre-tax earnings as adjusted (8) 1,836$ 2,233$ 1,798$ 3,260$ 937$ 1,005$ 1,219$ Tax impact of certain acquired BOLI policies (9) -$ -$ -$ 300$ -$ -$ -$ Tax cuts and Jobs Act of 2017 (10) -$ -$ 338$ -$ -$ -$ -$ Total provision for income tax as adjusted 1,836$ 2,233$ 2,136$ 3,560$ 937$ 1,005$ 1,219$ Net income as adjusted after income taxes (non-GAAP) (7) 3,563$ 4,221$ 4,962$ 10,675$ 2,606$ 2,786$ 3,348$ GAAP diluted earnings per share, net of tax 0.49$ 0.46$ 0.58$ 0.85$ 0.23$ 0.28$ 0.31$ Merger related costs, net of tax 0.09$ 0.22$ 0.06$ 0.27$ -$ -$ -$ Branch related costs, net of tax 0.09$ 0.12$ -$ -$ -$ -$ -$ Settlement proceeds -$ (0.03)$ -$ -$ -$ (0.01)$ -$ FHLB borrowings prepayment fee -$ 0.01$ -$ -$ -$ -$ -$ Tax impact of certain acquired BOLI policies (9) -$ -$ -$ (0.03)$ -$ -$ -$ Tax Cuts and Jobs Act of 2017 tax provision (10) -$ -$ 0.04$ -$ -$ -$ -$ Audit and Financial Reporting, net of tax -$ -$ -$ 0.02$ -$ -$ -$ Net gain on sale of branch -$ -$ -$ (0.15)$ -$ -$ -$ Net gain on sale of acquired business lines -$ -$ -$ -$ -$ (0.02)$ (0.01)$ Diluted earnings per share, as adjusted, net of tax (non-GAAP) 0.67$ 0.78$ 0.68$ 0.96$ 0.23$ 0.25$ 0.30$ Average diluted shares outstanding 5,257,304 5,378,548 7,335,247 11,121,435 11,219,660 11,150,785 11,155,337 Sep-20Mar-20FY 2016 FY 2017 FY 2018 FY 2019 Jun-20 30

Reconciliation of Non-GAAP Financial Measures (1) Costs incurred are included as professional fees and other non-interest expense in the consolidated statement of operations and include costs of $0, $0 and $0 for the quarters ended September 30, 2020, June 30, 2020 and March 31, 2020, respectively, and $341,000, $350,000, $565,000 and $0 for the years ended December 31, 2019, September 30, 2018 September 30, 2017 and September 30, 2016, respectively, which are nondeductible expenses for federal income tax purposes. (2) Branch closure costs include severance pay recorded in compensation and benefits, accelerated depreciation expense and lease termination fees included in occupancy and other costs included in other non-interest expense in the consolidated statement of operations. In addition, other non- interest expense includes costs related to the reduction in valuation of the Ridgeland branch office in the fourth quarter of fiscal 2017. Professional services includes legal costs related to the sale of the sole Michigan branch included in these Branch closure costs during the quarters ended December 31, 2018 and March 31, 2019. (3) Settlement proceeds includes litigation income from a JP Morgan Residential Mortgage-Backed Security (RMBS) claim. This JP Morgan RMBS was previously owned by the Bank and sold in 2011. (4) The prepayment fee to restructure our FHLB borrowings is included in other non-interest expense in the consolidated statement of operations. (5) Audit and financial reporting costs include additional audit and professional fees related to the change in our year end from September 30 to December 31, effective December 31, 2018. (6) Gain on sale of acquired business lines resulted from (1) the sale of Wells Insurance Agency and (2) the termination and sale of the wealth management business line sales contract acquired in a former acquisition. (7) Income before provision for income tax as adjusted and net income as adjusted are non-GAAP measures that management believes enhances the markets ability to assess the underlying business performance and trends related to core business activities. (8) Provision for income tax on pre-tax income as adjusted is calculated at our effective tax rate for each respective period presented. (9) Tax impact of certain acquired BOLI policies from United Bank. (10) As a result of the Tax Cuts and Jobs Act of 2017, we recorded a one-time net tax provision of $338,000 in 2018, which is included in provision for income taxes expense in the consolidated statement of operations. 31

Reconciliation of Non-GAAP Financial Measures Note: All quarterly periods are annualized for net income / net income as adjusted. 2016 2017 2018 2019 Mar-20 Jun-20 Sep-20 Net Income 2,573$ 2,499$ 4,283$ 9,463$ 10,481$ 12,343$ 13,844$ Net Income as adjusted 3,563$ 4,221$ 4,962$ 10,675$ 10,481$ 11,205$ 13,319$ Average assets 638,007$ 731,407$ 954,912$ 1,398,482$ 1,516,957$ 1,585,421$ 1,627,497$ Return on average assets 0.40% 0.34% 0.45% 0.68% 0.69% 0.78% 0.85% Return on average assets as adjusted 0.56% 0.58% 0.52% 0.76% 0.69% 0.71% 0.82% 2016 2017 2018 2019 Mar-20 Jun-20 Sep-20 Common Equity 64,544$ 73,483$ 135,847$ 150,553$ 147,933$ 152,790$ 157,323$ Less: Goodwill (4,663) (10,444) (10,444) (31,498) (31,498) (31,498) (31,498) Less: Core Deposit and other intangibles (872) (5,449) (4,805) (7,587) (7,175) (6,293) (5,893) Tangible Common Equity (TCE) 59,009$ 57,590$ 120,598$ 111,468$ 109,260$ 114,999$ 119,932$ Average Tangible Common Equity 57,891$ 58,300$ 89,094$ 105,340$ 110,364$ 112,130$ 117,466$ Net Income 2,573$ 2,499$ 4,283$ 9,463$ 10,481$ 12,343$ 13,844$ Net Income as adjusted 3,563$ 4,221$ 4,962$ 10,675$ 10,481$ 11,205$ 13,319$ ROATCE 4.4% 4.3% 4.8% 9.0% 9.5% 11.0% 11.8% ROATCE as adjusted 6.2% 7.2% 5.6% 10.1% 9.5% 10.0% 11.3% (In thousands except ROAA and ROAA as adjusted) (In thousands except ROATCE and ROATCE as adjusted) Return on Average Tangible Common Equity (ROATCE) Return on Average Assets (ROAA) as Adjusted 32

Reconciliation of Non-GAAP Financial Measures Note: All quarterly periods are annualized for net income / net income as adjusted 33 2016 2017 2018 2019 Mar-20 Jun-20 Sep-20 Non-interest Expense (GAAP) 20,058$ 22,878$ 29,764$ 42,686$ 10,731$ 11,392$ 10,724$ Merger related costs (701) (1,860) (463) (3,880) - - - Branch Closure costs (839) (951) (26) (15) - - - Audit and financial reporting - - - (358) - - - Prepayment fee - (104) - - - - - Non-interest expense as adjusted 18,518$ 19,963$ 29,275$ 38,433$ 10,731$ 11,392$ 10,724$ Non-interest income 3,915$ 4,751$ 7,370$ 14,975$ 3,603$ 5,013$ 5,062$ Net interest margin 20,077 22,268 30,303 43,513 12,671 12,303 11,909 Efficiency ratio denominator (GAAP) 23,992 27,019 37,673 58,488 16,274 17,316 16,971 Net gain on sale of branch - - - (2,295) - - Net gain on sale of acquired business lines - - - - - (252) (180) Settlement proceeds - (283) - - - (131) - Efficiency ratio denominator as adjusted 23,992$ 26,736$ 37,673$ 56,193$ 16,274$ 16,933$ 16,791$ Efficiency ratio 84% 85% 79% 73% 66% 66% 63% Efficiency ratio as adjusted 77% 75% 78% 68% 66% 67% 64% 2016 2017 2018 2019 Mar-20 Jun-20 Sep-20 Total Stockholders' equity 64,544$ 73,483$ 135,847$ 150,553$ 147,933$ 152,790$ 157,323$ Less: Goodwill (4,663) (10,444) (10,444) (31,498) (31,498) (31,498) (31,498) Less: Core deposit and intangibles (872) (5,449) (4,805) (7,587) (7,175) (6,293) (5,893) Tangible common equity (non-GAAP) 59,009$ 57,590$ 120,598$ 111,468$ 109,260$ 114,999$ 119,932$ Shares outstanding 5,260,098 5,888,816 10,913,853 11,266,954 11,151,009 11,150,695 11,154,645 Book Value 12.27$ 12.48$ 12.45$ 13.36$ 13.27$ 13.70$ 14.10$ TBVPS 11.22$ 9.78$ 11.05$ 9.89$ 9.80$ 10.31$ 10.75$ 2016 2017 2018 2019 Mar-20 Jun-20 Sep-20 Total Assets 695,865$ 940,664$ 975,409$ 1,167,060$ 1,505,164$ 1,607,514$ 1,622,593$ Less: Goodwill (4,663) (10,444) (10,444) (31,498) (31,498) (31,498) (31,498) Less: Core deposit and intangibles (872) (5,449) (4,805) (7,587) (7,175) (6,293) (5,893) Tangible Assets (non-GAAP) 690,330$ 924,771$ 960,160$ 1,127,975$ 1,466,491$ 1,569,723$ 1,585,202$ Tangible Common Equity / Tangible Assets 8.5% 6.2% 12.6% 9.9% 7.5% 7.3% 7.6% (In thousands except Tangible Common Equity / Tangible Asets) (In thousands except Efficiency Ratio and Efficiency Ratio as adjusted) (In thousands except Shares Outstanding, Book Value and TBVPS) Efficiency Ratio as Adjusted Tangible Book Value Per Share (TBVPS) as Adjusted Tangible Common Equity / Tangible Assets
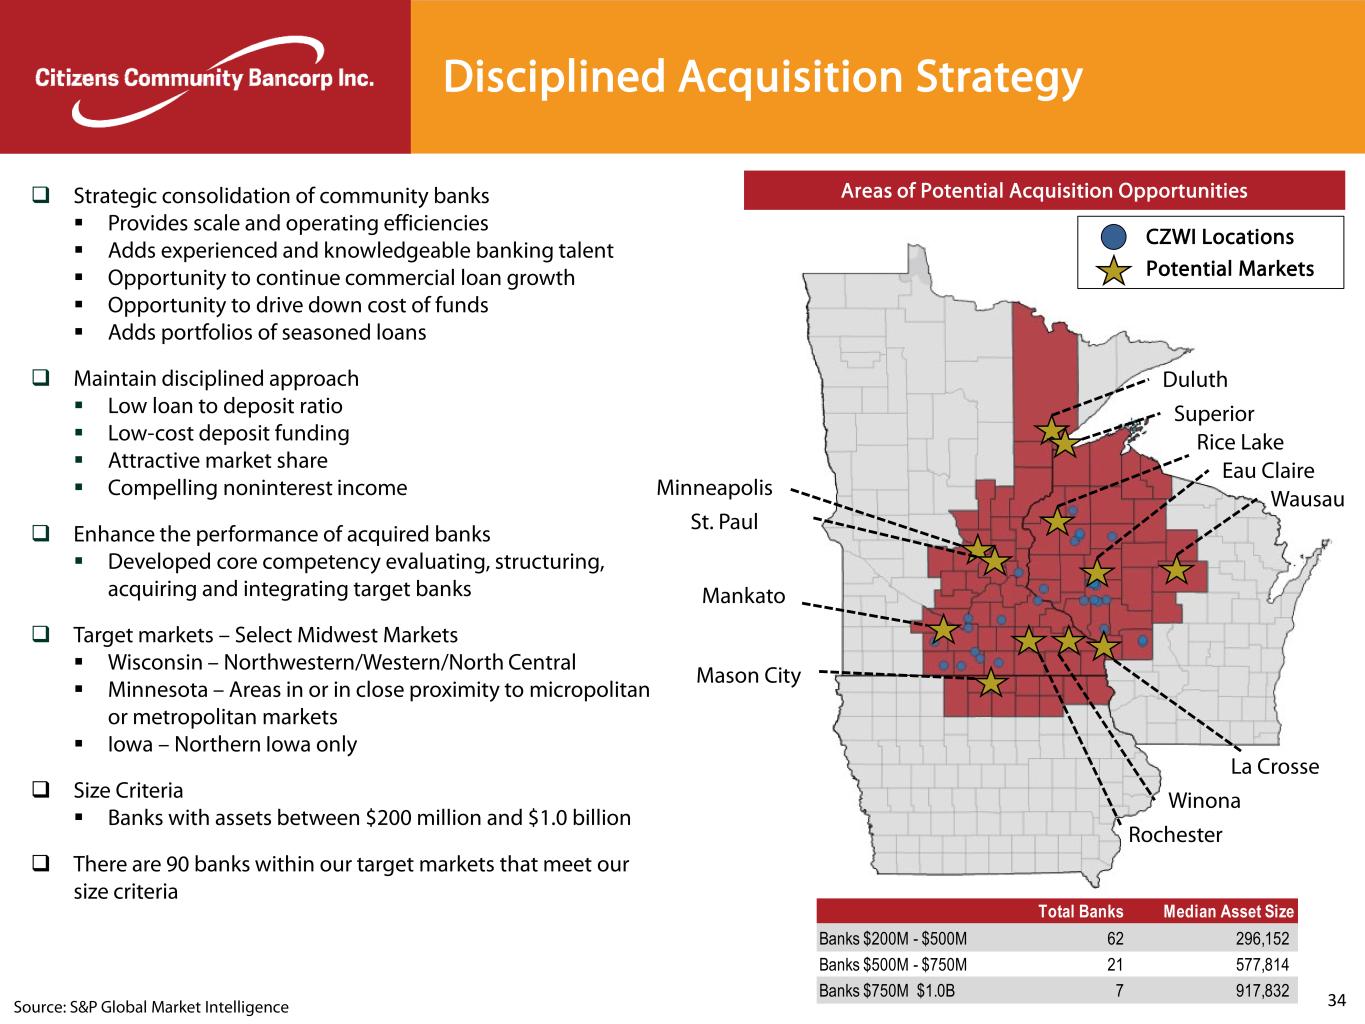
Disciplined Acquisition Strategy Strategic consolidation of community banks Provides scale and operating efficiencies Adds experienced and knowledgeable banking talent Opportunity to continue commercial loan growth Opportunity to drive down cost of funds Adds portfolios of seasoned loans Maintain disciplined approach Low loan to deposit ratio Low-cost deposit funding Attractive market share Compelling noninterest income Enhance the performance of acquired banks Developed core competency evaluating, structuring, acquiring and integrating target banks Target markets – Select Midwest Markets Wisconsin – Northwestern/Western/North Central Minnesota – Areas in or in close proximity to micropolitan or metropolitan markets Iowa – Northern Iowa only Size Criteria Banks with assets between $200 million and $1.0 billion There are 90 banks within our target markets that meet our size criteria Areas of Potential Acquisition Opportunities CZWI Locations Potential Markets Eau Claire Superior Rice Lake La Crosse Mankato Winona Mason City Rochester St. Paul Minneapolis Duluth Wausau Source: S&P Global Market Intelligence Total Banks Median Asset Size Banks $200M - $500M 62 296,152 Banks $500M - $750M 21 577,814 Banks $750M $1.0B 7 917,832 34

Leadership Team Stephen M. Bianchi Chairman of the Board President & CEO Mr. Stephen M. Bianchi, also known as Steve, has been the Chief Executive Officer and President of Citizens Community Bancorp, Inc. and Citizens Community Federal since June 24, 2016. He has been Chairman of Citizens Community Bancorp, Inc. since October 2018 and Citizens Community Federal National Association. As a 34-year banking veteran, Mr. Bianchi served in several senior management positions at Wells Fargo Bank and with Associated Bank. He served as the Chief Executive Officer at HF Financial Corp. from October 2011 and its President from April 2010 to May 2015. Mr. Bianchi served as the Chief Executive Officer and President of Home Federal Bank, a subsidiary of HF Financial Corp. from August 2012 to May 2015. He served as the Interim Chief Executive Officer and Interim President of HF Financial Corp. from October 2011 until July 2012. Mr. Bianchi served as Senior Vice President at Associated Bank, where he served as Minnesota Regional President and Minnesota Regional Commercial Banking Manager from July 2006 to April 2010. Before that, he served as Twin Cities Business Banking Manager for Wells Fargo Bank, where he held several other management positions over 14 years. He has been a Director of Citizens Community Bancorp, Inc. since May 25, 2017. He has been a Director of Citizens Community Federal since June 24, 2016. Mr. Bianchi received his B.S. degree in Finance and M.B.A. from Providence College. James S. Broucek Executive VP, CFO Principal Accounting Officer, Treasurer & Secretary Mr. James S. Broucek, also known as Jim, has been Chief Financial Officer and Principal Accounting Officer at Citizens Community Bancorp, Inc. since October 31, 2017 and serves as its Treasurer since January 17, 2018. He serves as Executive Vice President and Secretary of Citizens Community Bancorp, Inc. He serves as Executive Vice President, Treasurer and Secretary at Citizens Community Federal National Association. He has been Chief Financial Officer and Principal Accounting Officer of Citizens Community Federal National Association since October 31, 2017. He served as a Senior Manager of Wipfli LLP (“Wipfli”) from December 2013 to October 2017. Before joining Wipfli, Mr. Broucek held several positions with TCF Financial Corporation (“TCF Financial”) and its subsidiaries from 1995 to 2013, with his last position being Treasurer of TCF Financial. Prior to joining TCF Financial, Mr. Broucek served as the Controller of Great Lakes Bancorp. Mr. Broucek holds a B.A. in mathematics and business administration with a concentration in accounting from Hope College. 35
