Attached files
| file | filename |
|---|---|
| 8-K - WSFS FINANCIAL CORP | e20592_wsfs-8k.htm |
1 WSFS Financial Corporation Investor Presentation December 2020
2 Forward Looking Statements : This presentation contains estimates, predictions, opinions, projections and other "forward - looking statements" as that phrase is defined in the Private Securities Litigation Reform Act of 1995 . Such statements include, without limitation, references to the Company's predictions or expectations of future business or financial performance as well as its goals and objectives for future operations, financial and business trends, business prospects, and management's outlook or expectations for earnings, revenues, expenses, capital levels, liquidity levels, asset quality or other future financial or business performance, strategies or expectations . The words “believe,” “expect,” “anticipate,” “plan,” “estimate,” “target,” “project” and similar expressions, among others, generally identify forward - looking statements . Such forward - looking statements are based on various assumptions (some of which may be beyond the Company's control) and are subject to significant risks and uncertainties (which change over time) and other factors, including the uncertain effects of the COVID - 19 pandemic and actions taken in response thereto on our business, results of operations, capital and liquidity, which could cause actual results to differ materially from those currently anticipated . Such risks and uncertainties are discussed in detail the Company's Form 10 - K for the year ended December 31 , 2019 , Form 10 - Q for the quarter ended March 31 , 2020 , Form 10 - Q for the quarter ended June 30 , 2020 , Form 10 - Q for the quarter ended September 30 , 2020 , and other documents filed by the Company with the Securities and Exchange Commission from time to time . We caution readers not to place undue reliance on any such forward - looking statements, which speak only as of the date on which they are made, and the Company disclaims any duty to revise or update any forward - looking statement, whether written or oral, that may be made from time to time by or on behalf of the Company for any reason, except as specifically required by law . As used in this presentation, the terms "WSFS", "the Company", "registrant", "we", "us", and "our" mean WSFS Financial Corporation and its subsidiaries, on a consolidated basis, unless the context indicates otherwise . Non - GAAP Financial Measures : This presentation contains financial measures determined by methods other than in accordance with accounting principles generally accepted in the United States (“GAAP”) . These non - GAAP measures include core earnings per share (“EPS”), core net income, core return on equity, core efficiency ratio, pre - provision net revenue (“PPNR”), core PPNR, PPNR to average assets ratio, core PPNR to average assets ratio, core return on assets (“ROA”), core Net Interest Margin (“NIM”), return on tangible common equity (“ROTCE”), core ROTCE, core fee income and core fee income as a percentage of total core net revenue . The Company’s management believes that these non - GAAP measures provide a greater understanding of ongoing operations, enhance comparability of results of operations with prior periods and show the effects of significant gains and charges in the periods presented . The Company’s management believes that investors may use these non - GAAP measures to analyze the Company’s financial performance without the impact of unusual items or events that may obscure trends in the Company’s underlying performance . This non - GAAP data should be considered in addition to results prepared in accordance with GAAP, and is not a substitute for, or superior to, GAAP results . For a reconciliation of these non - GAAP measures to their comparable GAAP measures, see the Appendix . Forward Looking Statements & Non - GAAP
3 Table of Contents WSFS Franchise and Markets Page 4 Financial Highlights and Trends Page 7 Balance Sheet Composition and Credit Risk Management Page 11 Capital Trends and Interest Coverage Page 15 Lines of Business and Delivery Transformation Page 17 Appendix: Non - GAAP Financial Information Page 23
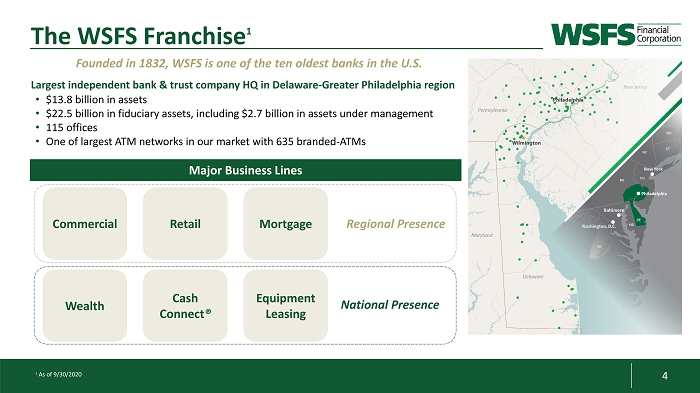
4 1 As of 9/30/2020 The WSFS Franchise 1 • $13.8 billion in assets • $22.5 billion in fiduciary assets, including $2.7 billion in assets under management • 115 offices • One of largest ATM networks in our market with 635 branded - ATMs Founded in 1832, WSFS is one of the ten oldest banks in the U.S. National Presence Commercial Retail Wealth Cash Connect ® Equipment Leasing Major Business Lines Largest independent bank & trust company HQ in Delaware - Greater Philadelphia region Mortgage Regional Presence
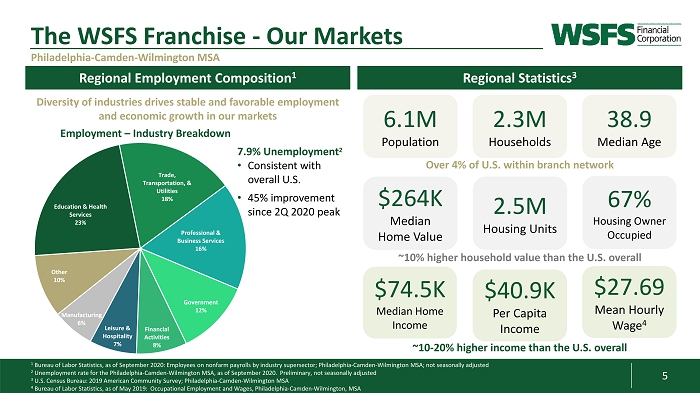
5 Education & Health Services 23% Trade, Transportation, & Utilities 18% Professional & Business Services 16% Government 12% Financial Activities 8% Leisure & Hospitality 7% Manufacturing 6% Other 10% Employment – Industry Breakdown ~10 - 20% higher income than the U.S. overall 1 Bureau of Labor Statistics, as of September 2020: Employees on nonfarm payrolls by industry supersector ; Philadelphia - Camden - Wilmington MSA; not seasonally adjusted 2 Unemployment rate for the Philadelphia - Camden - Wilmington MSA, as of September 2020. Preliminary, not seasonally adjusted 3 U.S. Census Bureau: 2019 American Community Survey; Philadelphia - Camden - Wilmington MSA 4 Bureau of Labor Statistics, as of May 2019 : Occupational Employment and Wages, Philadelphia - Camden - Wilmington, MSA Diversity of industries drives stable and favorable employment and economic growth in our markets Regional Employment Composition 1 Regional Statistics 3 The WSFS Franchise - Our Markets Philadelphia - Camden - Wilmington MSA Over 4% of U.S. within branch network 6.1M Population 2.3M Households 2.5M Housing Units $40.9K Per Capita Income $264K Median Home Value ~10% higher household value than the U.S. overall 38.9 Median Age 67% Housing Owner Occupied 7.9% Unemployment 2 • Consistent with overall U.S. • 45% improvement since 2Q 2020 peak Purchasing power vs. US Avg Income $27.69 Mean Hourly Wage 4 $74.5K Median Home Income
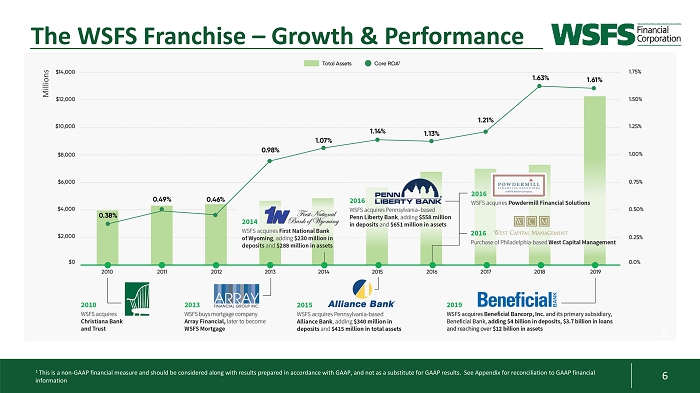
6 6 The WSFS Franchise – Growth & Performance Millions 1 This is a non - GAAP financial measure and should be considered along with results prepared in accordance with GAAP, and not as a substitute for GAAP results. See Appendix for reconciliation to GAAP financial information
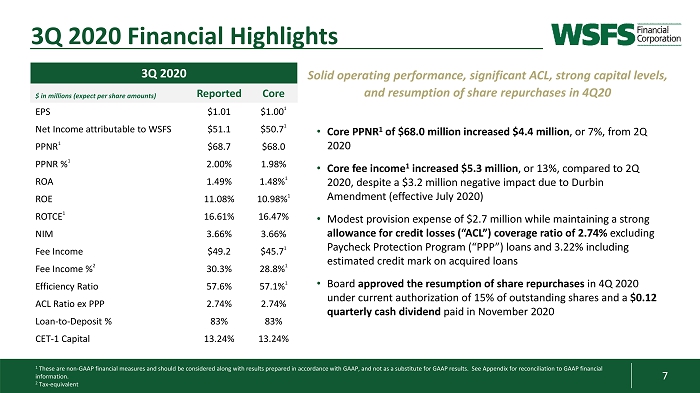
7 3Q 2020 $ in millions (expect per share amounts) Reported Core EPS $1.01 $1.00 1 Net Income attributable to WSFS $51.1 $50.7 1 PPNR 1 $68.7 $68.0 PPNR % 1 2.00% 1.98% ROA 1.49% 1.48% 1 ROE 11.08% 10.98% 1 ROTCE 1 16.61% 16.47% NIM 3.66% 3.66% Fee Income $49.2 $45.7 1 Fee Income % 2 30.3% 28.8% 1 Efficiency Ratio 57.6% 57.1% 1 ACL Ratio ex PPP 2.74% 2.74% Loan - to - Deposit % 83% 83% CET - 1 Capital 13.24% 13.24% 1 These are non - GAAP financial measures and should be considered along with results prepared in accordance with GAAP, and not as a substitute for GAAP results. See Appendix for reconciliation to GAAP financial information. 2 Tax - equivalent 3Q 2020 Financial Highlights • Core PPNR 1 of $68.0 million increased $4.4 million , or 7%, from 2Q 2020 • Core fee income 1 increased $5.3 million , or 13%, compared to 2Q 2020, despite a $3.2 million negative impact due to Durbin Amendment (effective July 2020) • Modest provision expense of $2.7 million while maintaining a strong allowance for credit losses (“ACL”) coverage ratio of 2.74% excluding Paycheck Protection Program (“PPP”) loans and 3.22% including estimated credit mark on acquired loans • Board approved the resumption of share repurchases in 4Q 2020 under current authorization of 15% of outstanding shares and a $0.12 quarterly cash dividend paid in November 2020 Solid operating performance, significant ACL, strong capital levels, and resumption of share repurchases in 4Q20
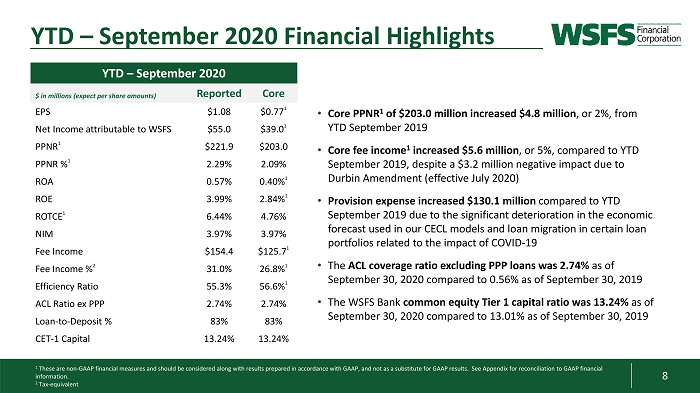
8 1 These are non - GAAP financial measures and should be considered along with results prepared in accordance with GAAP, and not as a substitute for GAAP results. See Appendix for reconciliation to GAAP financial information. 2 Tax - equivalent YTD – September 2020 Financial Highlights • Core PPNR 1 of $203.0 million increased $4.8 million , or 2%, from YTD September 2019 • Core fee income 1 increased $5.6 million , or 5%, compared to YTD September 2019, despite a $3.2 million negative impact due to Durbin Amendment (effective July 2020) • Provision expense increased $130.1 million compared to YTD September 2019 due to the significant deterioration in the economic forecast used in our CECL models and loan migration in certain loan portfolios related to the impact of COVID - 19 • The ACL coverage ratio excluding PPP loans was 2.74% as of September 30, 2020 compared to 0.56% as of September 30, 2019 • The WSFS Bank common equity Tier 1 capital ratio was 13.24% as of September 30, 2020 compared to 13.01% as of September 30, 2019 YTD – September 2020 $ in millions (expect per share amounts) Reported Core EPS $1.08 $0.77 1 Net Income attributable to WSFS $55.0 $39.0 1 PPNR 1 $221.9 $203.0 PPNR % 1 2.29% 2.09% ROA 0.57% 0.40% 1 ROE 3.99% 2.84% 1 ROTCE 1 6.44% 4.76% NIM 3.97% 3.97% Fee Income $154.4 $125.7 1 Fee Income % 2 31.0% 26.8% 1 Efficiency Ratio 55.3% 56.6% 1 ACL Ratio ex PPP 2.74% 2.74% Loan - to - Deposit % 83% 83% CET - 1 Capital 13.24% 13.24%
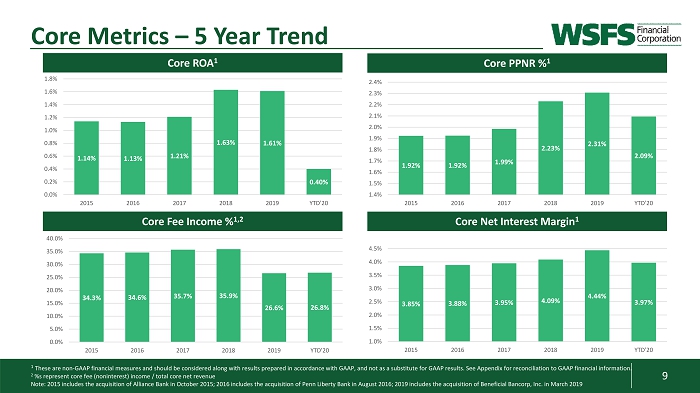
9 Core PPNR % 1 Core Net Interest Margin 1 Core ROA 1 Core Fee Income % 1,2 Core Metrics – 5 Year Trend 1.14% 1.13% 1.21% 1.63% 1.61% 0.40% 0.0% 0.2% 0.4% 0.6% 0.8% 1.0% 1.2% 1.4% 1.6% 1.8% 2015 2016 2017 2018 2019 YTD'20 34.3% 34.6% 35.7% 35.9% 26.6% 26.8% 0.0% 5.0% 10.0% 15.0% 20.0% 25.0% 30.0% 35.0% 40.0% 2015 2016 2017 2018 2019 YTD'20 3.85% 3.88% 3.95% 4.09% 4.44% 3.97% 1.0% 1.5% 2.0% 2.5% 3.0% 3.5% 4.0% 4.5% 2015 2016 2017 2018 2019 YTD'20 1.92% 1.92% 1.99% 2.23% 2.31% 2.09% 1.4% 1.5% 1.6% 1.7% 1.8% 1.9% 2.0% 2.1% 2.2% 2.3% 2.4% 2015 2016 2017 2018 2019 YTD'20 1 These are non - GAAP financial measures and should be considered along with results prepared in accordance with GAAP, and not as a substitute for GAAP results. See Appendix for reconciliation to GAAP financial information. 2 %s represent core fee (noninterest) income / total core net revenue Note: 2015 includes the acquisition of Alliance Bank in October 2015; 2016 includes the acquisition of Penn Liberty Bank in A ugu st 2016; 2019 includes the acquisition of Beneficial Bancorp, Inc. in March 2019
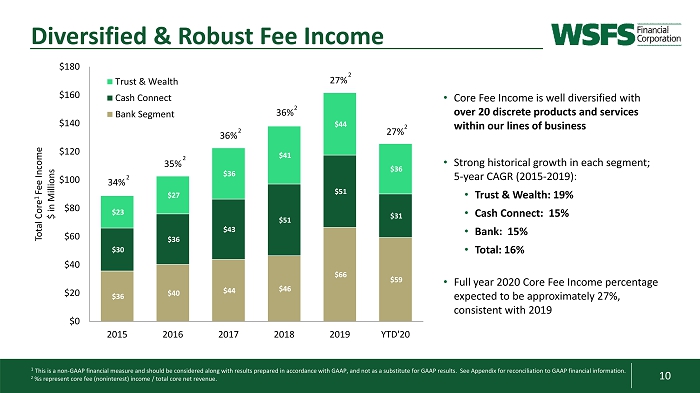
10 $36 $40 $44 $46 $66 $59 $30 $36 $43 $51 $51 $31 $23 $27 $36 $41 $44 $36 34% 35% 36% 36% 27% $0 $20 $40 $60 $80 $100 $120 $140 $160 $180 2015 2016 2017 2018 2019 YTD'20 Total Core 1 Fee Income $ in Millions Trust & Wealth Cash Connect Bank Segment 27% 1 This is a non - GAAP financial measure and should be considered along with results prepared in accordance with GAAP, and not as a substitute for GAAP results. See Appendix for reconciliation to GAAP financial information. 2 %s represent core fee (noninterest) income / total core net revenue. • Core Fee Income is well diversified with over 20 discrete products and services within our lines of business • Strong historical growth in each segment; 5 - year CAGR (2015 - 2019): • Trust & Wealth: 19% • Cash Connect: 15% • Bank: 15% • Total: 16% • Full year 2020 Core Fee Income percentage expected to be approximately 27%, consistent with 2019 Diversified & Robust Fee Income 2 2 2 2 2 2
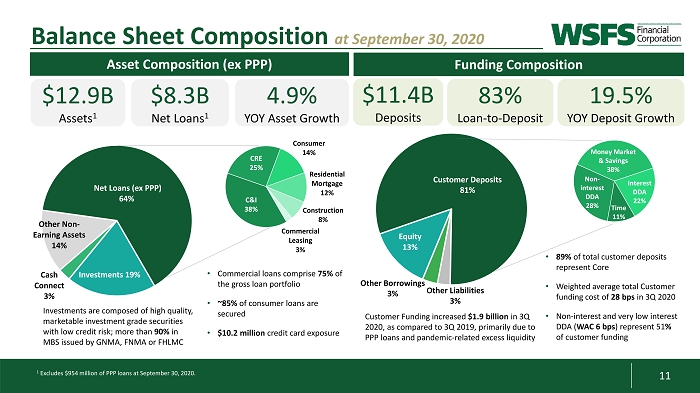
11 Time 11% Non - interest DDA 28% Money Market & Savings 38% Interest DDA 22% Customer Funding increased $1.9 billion in 3Q 2020, as compared to 3Q 2019, primarily due to PPP loans and pandemic - related excess liquidity Balance Sheet Composition at September 30, 2020 C&I 38% CRE 25% Consumer 14% Residential Mortgage 12% Construction 8% Commercial Leasing 3% Investments 19% Cash Connect 3% Other Non - Earning Assets 14% Net Loans (ex PPP) 64% • Commercial loans comprise 75% of the gross loan portfolio • ~85% of consumer loans are secured • $10.2 million credit card exposure Equity 13% Customer Deposits 81% • 89% of total customer deposits represent Core • Weighted average total Customer funding cost of 28 bps in 3Q 2020 • Non - interest and very low interest DDA ( WAC 6 bps ) represent 51 % of customer funding Investments are composed of high quality, marketable investment grade securities with low credit risk; more than 90% in MBS issued by GNMA, FNMA or FHLMC 1 Excludes $954 million of PPP loans at September 30, 2020. $12.9B Assets 1 $8.3B Net Loans 1 Asset Composition (ex PPP) 4.9% YOY Asset Growth Funding Composition $11.4B Deposits 83% Loan - to - Deposit 19.5% YOY Deposit Growth Other Borrowings 3% Other Liabilities 3%
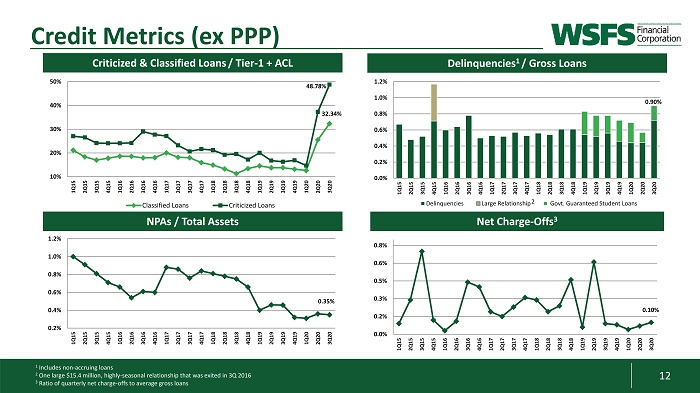
12 0.0% 0.2% 0.3% 0.5% 0.6% 0.8% 1Q15 2Q15 3Q15 4Q15 1Q16 2Q16 3Q16 4Q16 1Q17 2Q17 3Q17 4Q17 1Q18 2Q18 3Q18 4Q18 1Q19 2Q19 3Q19 4Q19 1Q20 2Q20 3Q20 0.2% 0.4% 0.6% 0.8% 1.0% 1.2% 1Q15 2Q15 3Q15 4Q15 1Q16 2Q16 3Q16 4Q16 1Q17 2Q17 3Q17 4Q17 1Q18 2Q18 3Q18 4Q18 1Q19 2Q19 3Q19 4Q19 1Q20 2Q20 3Q20 10% 20% 30% 40% 50% 1Q15 2Q15 3Q15 4Q15 1Q16 2Q16 3Q16 4Q16 1Q17 2Q17 3Q17 4Q17 1Q18 2Q18 3Q18 4Q18 1Q19 2Q19 3Q19 4Q19 1Q20 2Q20 3Q20 Classified Loans Criticized Loans Delinquencies 1 / Gross Loans Net Charge - Offs 3 1 Includes non - accruing loans 2 One large $15.4 million, highly - seasonal relationship that was exited in 3Q 2016 3 Ratio of quarterly net charge - offs to average gross loans Criticized & Classified Loans / Tier - 1 + ACL NPAs / Total Assets 48.78% 32.34% 0.35% 0.10% Credit Metrics (ex PPP) 0.0% 0.2% 0.4% 0.6% 0.8% 1.0% 1.2% 1Q15 2Q15 3Q15 4Q15 1Q16 2Q16 3Q16 4Q16 1Q17 2Q17 3Q17 4Q17 1Q18 2Q18 3Q18 4Q18 1Q19 2Q19 3Q19 4Q19 1Q20 2Q20 3Q20 Delinquencies Large Relationship Govt. Guaranteed Student Loans 0.90% 2
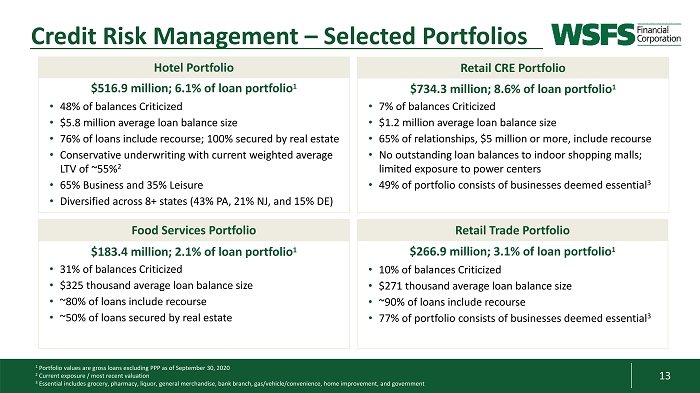
13 3 Credit Risk Management – Selected Portfolios Hotel Portfolio Retail Trade Portfolio Retail CRE Portfolio Food Services Portfolio 1 Portfolio values are gross loans excluding PPP as of September 30, 2020 2 Current exposure / most recent valuation 3 Essential includes grocery, pharmacy, liquor, general merchandise, bank branch, gas/vehicle/convenience, home improvement, an d government $266.9 million; 3.1% of loan portfolio 1 • 10% of balances Criticized • $271 thousand average loan balance size • ~90% of loans include recourse • 77% of portfolio consists of businesses deemed essential 3 $183.4 million; 2.1% of loan portfolio 1 • 31% of balances Criticized • $325 thousand average loan balance size • ~80% of loans include recourse • ~50% of loans secured by real estate $516.9 million; 6.1% of loan portfolio 1 • 48% of balances Criticized • $5.8 million average loan balance size • 76% of loans include recourse; 100% secured by real estate • Conservative underwriting with current weighted average LTV of ~55% 2 • 65% Business and 35% Leisure • Diversified across 8+ states (43% PA, 21% NJ, and 15% DE) $734.3 million; 8.6% of loan portfolio 1 • 7% of balances Criticized • $1.2 million average loan balance size • 65% of relationships, $5 million or more, include recourse • No outstanding loan balances to indoor shopping malls; limited exposure to power centers • 49% of portfolio consists of businesses deemed essential 3
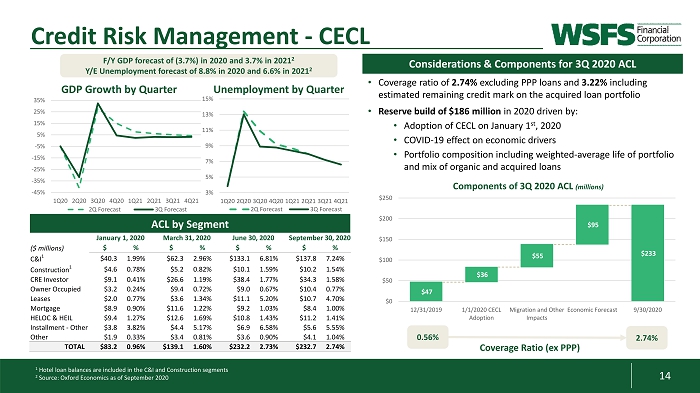
14 $47 $36 $55 $95 $233 $0 $50 $100 $150 $200 $250 12/31/2019 1/1/2020 CECL Adoption Migration and Other Impacts Economic Forecast 9/30/2020 -45% -35% -25% -15% -5% 5% 15% 25% 35% 1Q20 2Q20 3Q20 4Q20 1Q21 2Q21 3Q21 4Q21 2Q Forecast 3Q Forecast 1 Hotel loan balances are included in the C&I and Construction segments 2 Source: Oxford Economics as of September 2020 Credit Risk Management - CECL ACL by Segment F/Y GDP forecast of (3.7%) in 2020 and 3.7% in 2021 2 Y/E Unemployment forecast of 8.8% in 2020 and 6.6% in 2021 2 Considerations & Components for 3Q 2020 ACL • Coverage ratio of 2.74% excluding PPP loans and 3.22% including estimated remaining credit mark on the acquired loan portfolio • Reserve build of $186 million in 2020 driven by: • Adoption of CECL on January 1 st , 2020 • COVID - 19 effect on economic drivers • Portfolio composition including weighted - average life of portfolio and mix of organic and acquired loans 0.56% 2.74% Coverage Ratio (ex PPP) GDP Growth by Quarter Unemployment by Quarter 3% 5% 7% 9% 11% 13% 15% 1Q20 2Q20 3Q20 4Q20 1Q21 2Q21 3Q21 4Q21 2Q Forecast 3Q Forecast Components of 3Q 2020 ACL (millions) ($ millions) $ % $ % $ % $ % C&I 1 $40.3 1.99% $62.3 2.96% $133.1 6.81% $137.8 7.24% Construction 1 $4.6 0.78% $5.2 0.82% $10.1 1.59% $10.2 1.54% CRE Investor $9.1 0.41% $26.6 1.19% $38.4 1.77% $34.3 1.58% Owner Occupied $3.2 0.24% $9.4 0.72% $9.0 0.67% $10.4 0.77% Leases $2.0 0.77% $3.6 1.34% $11.1 5.20% $10.7 4.70% Mortgage $8.9 0.90% $11.6 1.22% $9.2 1.03% $8.4 1.00% HELOC & HEIL $9.4 1.27% $12.6 1.69% $10.8 1.43% $11.2 1.41% Installment - Other $3.8 3.82% $4.4 5.17% $6.9 6.58% $5.6 5.55% Other $1.9 0.33% $3.4 0.81% $3.6 0.90% $4.1 1.04% TOTAL $83.2 0.96% $139.1 1.60% $232.2 2.73% $232.7 2.74% January 1, 2020 March 31, 2020 June 30, 2020 September 30, 2020
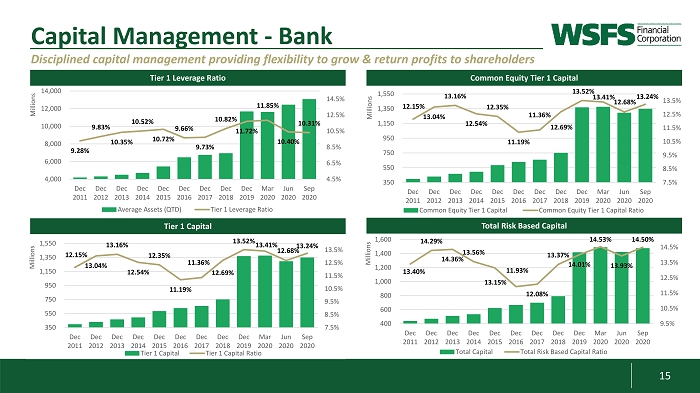
15 Capital Management - Bank Disciplined capital management providing flexibility to grow & return profits to shareholders 12.15% 13.04% 13.16% 12.54% 12.35% 11.19% 11.36% 12.69% 13.52% 13.41% 12.68% 13.24% 7.5% 8.5% 9.5% 10.5% 11.5% 12.5% 13.5% 350 550 750 950 1,150 1,350 1,550 Dec 2011 Dec 2012 Dec 2013 Dec 2014 Dec 2015 Dec 2016 Dec 2017 Dec 2018 Dec 2019 Mar 2020 Jun 2020 Sep 2020 Millions Tier 1 Capital Tier 1 Capital Ratio 9.28% 9.83% 10.35% 10.52% 10.72% 9.66% 9.73% 10.82% 11.72% 11.85% 10.40% 10.31% 4.5% 6.5% 8.5% 10.5% 12.5% 14.5% 4,000 6,000 8,000 10,000 12,000 14,000 Dec 2011 Dec 2012 Dec 2013 Dec 2014 Dec 2015 Dec 2016 Dec 2017 Dec 2018 Dec 2019 Mar 2020 Jun 2020 Sep 2020 Millions Average Assets (QTD) Tier 1 Leverage Ratio Tier 1 Leverage Ratio 12.15% 13.04% 13.16% 12.54% 12.35% 11.19% 11.36% 12.69% 13.52% 13.41% 12.68% 13.24% 7.5% 8.5% 9.5% 10.5% 11.5% 12.5% 13.5% 350 550 750 950 1,150 1,350 1,550 Dec 2011 Dec 2012 Dec 2013 Dec 2014 Dec 2015 Dec 2016 Dec 2017 Dec 2018 Dec 2019 Mar 2020 Jun 2020 Sep 2020 Millions Common Equity Tier 1 Capital Common Equity Tier 1 Capital Ratio Common Equity Tier 1 Capital 13.40% 14.29% 14.36% 13.56% 13.15% 11.93% 12.08% 13.37% 14.01% 14.53% 13.93% 14.50% 9.5% 10.5% 11.5% 12.5% 13.5% 14.5% 400 600 800 1,000 1,200 1,400 1,600 Dec 2011 Dec 2012 Dec 2013 Dec 2014 Dec 2015 Dec 2016 Dec 2017 Dec 2018 Dec 2019 Mar 2020 Jun 2020 Sep 2020 Millions Total Capital Total Risk Based Capital Ratio Tier 1 Capital Total Risk Based Capital
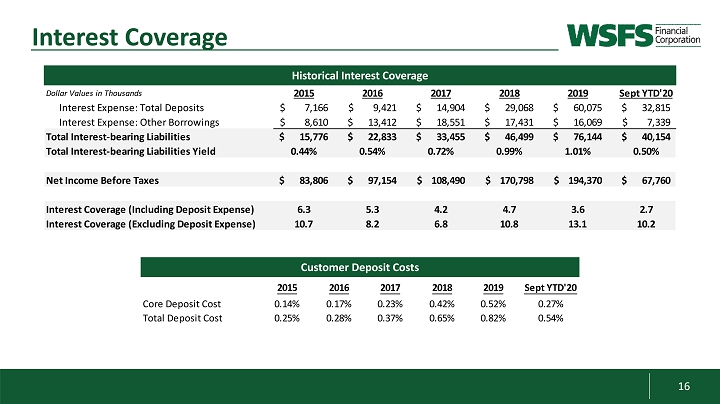
16 Historical Interest Coverage Interest Coverage Dollar Values in Thousands 2015 2016 2017 2018 2019 Sept YTD'20 Interest Expense: Total Deposits 7,166$ 9,421$ 14,904$ 29,068$ 60,075$ 32,815$ Interest Expense: Other Borrowings 8,610$ 13,412$ 18,551$ 17,431$ 16,069$ 7,339$ Total Interest-bearing Liabilities 15,776$ 22,833$ 33,455$ 46,499$ 76,144$ 40,154$ Total Interest-bearing Liabilities Yield 0.44% 0.54% 0.72% 0.99% 1.01% 0.50% Net Income Before Taxes 83,806$ 97,154$ 108,490$ 170,798$ 194,370$ 67,760$ Interest Coverage (Including Deposit Expense) 6.3 5.3 4.2 4.7 3.6 2.7 Interest Coverage (Excluding Deposit Expense) 10.7 8.2 6.8 10.8 13.1 10.2 Customer Deposit Costs 2015 2016 2017 2018 2019 Sept YTD'20 Core Deposit Cost 0.14% 0.17% 0.23% 0.42% 0.52% 0.27% Total Deposit Cost 0.25% 0.28% 0.37% 0.65% 0.82% 0.54%
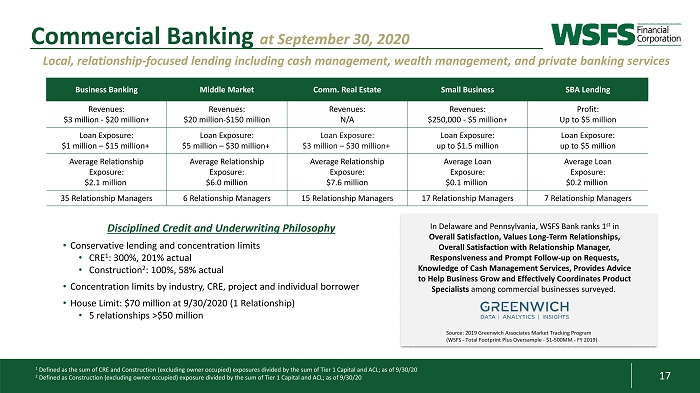
17 Disciplined Credit and Underwriting Philosophy • Conservative lending and concentration limits • CRE 1 : 300%, 201% actual • Construction 2 : 100%, 58% actual • Concentration limits by industry, CRE, project and individual borrower • House Limit: $70 million at 9/30/2020 (1 Relationship) • 5 relationships >$50 million Business Banking Middle Market Comm. Real Estate Small Business SBA Lending Revenues: $3 million - $20 million+ Revenues: $20 million - $150 million Revenues: N/A Revenues: $250,000 - $5 million+ Profit: Up to $5 million Loan Exposure: $1 million – $15 million+ Loan Exposure: $5 million – $30 million+ Loan Exposure: $3 million – $30 million+ Loan Exposure: up to $1.5 million Loan Exposure: up to $5 million Average Relationship Exposure: $2.1 million Average Relationship Exposure: $6.0 million Average Relationship Exposure: $7.6 million Average Loan Exposure: $0.1 million Average Loan Exposure: $0.2 million 35 Relationship Managers 6 Relationship Managers 15 Relationship Managers 17 Relationship Managers 7 Relationship Managers Local, relationship - focused lending including cash management, wealth management, and private banking services In Delaware and Pennsylvania, WSFS Bank ranks 1 st in Overall Satisfaction, Values Long - Term Relationships, Overall Satisfaction with Relationship Manager, Responsiveness and Prompt Follow - up on Requests, Knowledge of Cash Management Services, Provides Advice to Help Business Grow and Effectively Coordinates Product Specialists among commercial businesses surveyed. Source: 2019 Greenwich Associates Market Tracking Program (WSFS - Total Footprint Plus Oversample - $1 - 500MM - FY 2019) 1 Defined as the sum of CRE and Construction (excluding owner occupied) exposures divided by the sum of Tier 1 Capital and ACL; a s of 9/30/20 2 Defined as Construction (excluding owner occupied) exposure divided by the sum of Tier 1 Capital and ACL; as of 9/30/20 Commercial Banking at September 30, 2020
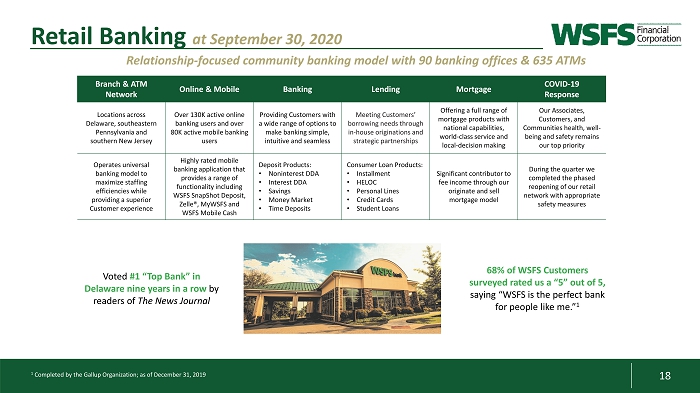
18 Branch & ATM Network Online & Mobile Banking Lending Mortgage COVID - 19 Response Locations across Delaware, southeastern Pennsylvania and southern New Jersey Over 130K active online banking users and over 80K active mobile banking users Providing Customers with a wide range of options to make banking simple, intuitive and seamless Meeting Customers’ borrowing needs through in - house originations and strategic partnerships Offering a full range of mortgage products with national capabilities, world - class service and local - decision making Our Associates, Customers, and Communities health, well - being and safety remains our top priority Operates universal banking model to maximize staffing efficiencies while providing a superior Customer experience Highly rated mobile banking application that provides a range of functionality including WSFS SnapShot Deposit, Zelle®, MyWSFS and WSFS Mobile Cash Deposit Products: • Noninterest DDA • Interest DDA • Savings • Money Market • Time Deposits Consumer Loan Products: • Installment • HELOC • Personal Lines • Credit Cards • Student Loans Significant contributor to fee income through our originate and sell mortgage model During the quarter we completed the phased reopening of our retail network with appropriate safety measures 1 Completed by the Gallup Organization; as of December 31, 2019 68% of WSFS Customers surveyed rated us a “5” out of 5, saying “WSFS is the perfect bank for people like me.” 1 Voted #1 “Top Bank” in Delaware nine years in a row by readers of The News Journal Relationship - focused community banking model with 90 banking offices & 635 ATMs Retail Banking at September 30, 2020
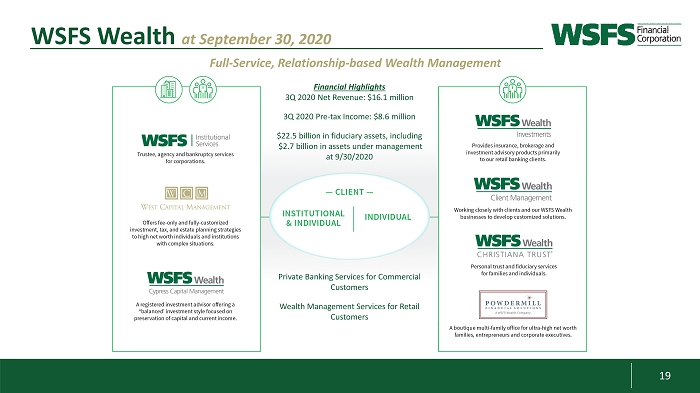
19 WSFS Wealth at September 30, 2020 Private Banking Services for Commercial Customers Wealth Management Services for Retail Customers Financial Highlights 3Q 2020 Net Revenue: $16.1 million 3Q 2020 Pre - tax Income: $8.6 million $22.5 billion in fiduciary assets, including $2.7 billion in assets under management at 9/30/2020 Full - Service, Relationship - based Wealth Management
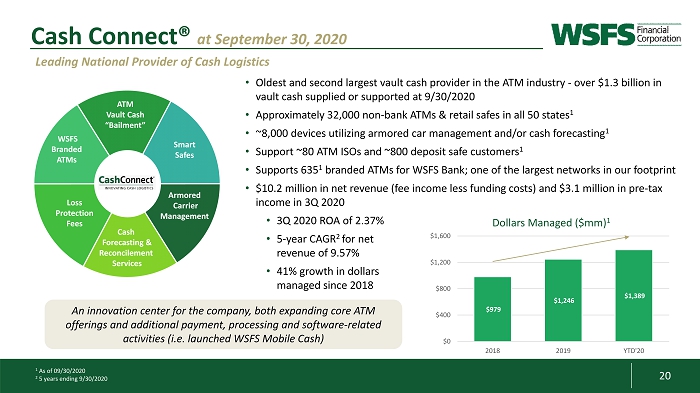
20 • Oldest and second largest vault cash provider in the ATM industry - o ver $1.3 billion in vault cash supplied or supported at 9/30/2020 • Approximately 32,000 non - bank ATMs & retail safes in all 50 states 1 • ~8,000 devices utilizing armored car management and/or cash forecasting 1 • Support ~80 ATM ISOs and ~800 deposit safe customers 1 • Supports 635 1 branded ATMs for WSFS Bank; one of the largest networks in our footprint • $10.2 million in net revenue (fee income less funding costs) and $3.1 million in pre - tax income in 3Q 2020 • 3Q 2020 ROA of 2.37% • 5 - year CAGR 2 for net revenue of 9.57% • 41% growth in dollars managed since 2018 $979 $1,246 $1,389 $0 $400 $800 $1,200 $1,600 2018 2019 YTD'20 1 As of 09/30/2020 2 5 years ending 9/30/2020 ATM Vault Cash “Bailment” Smart Safes Armored Carrier Management Cash Forecasting & Reconcilement Services Loss Protection Fees WSFS Branded ATMs Leading National Provider of Cash Logistics Cash Connect® at September 30, 2020 An innovation center for the company, both expanding core ATM offerings and additional payment, processing and software - related activities (i.e. launched WSFS Mobile Cash) Dollars Managed ($mm) 1
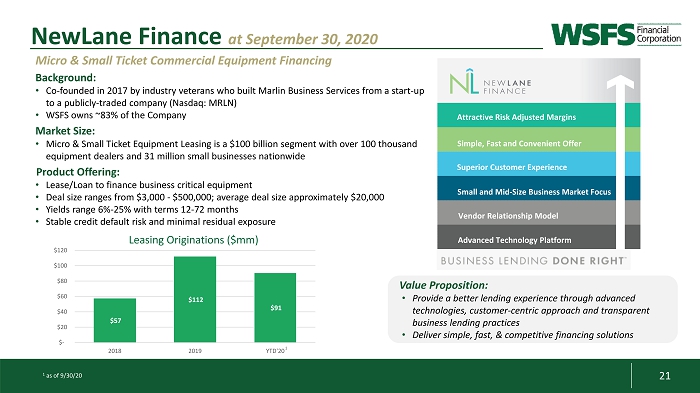
21 NewLane Finance at September 30, 2020 Background: • Co - founded in 2017 by industry veterans who built Marlin Business Services from a start - up to a publicly - traded company (Nasdaq: MRLN) • WSFS owns ~83% of the Company Market Size: • Micro & Small Ticket Equipment Leasing is a $100 billion segment with over 100 thousand equipment dealers and 31 million small businesses nationwide Product Offering: • Lease/Loan to finance business critical equipment • Deal size ranges from $3,000 - $500,000; average deal size approximately $20,000 • Yields range 6% - 25% with terms 12 - 72 months • Stable credit default risk and minimal residual exposure Vendor Relationship Model Small and Mid - Size Business Market Focus Advanced Technology Platform Superior Customer Experience Simple, Fast and Convenient Offer Attractive Risk Adjusted Margins Micro & Small Ticket Commercial Equipment Financing Value Proposition: • Provide a better lending experience through advanced technologies, customer - centric approach and transparent business lending practices • Deliver simple, fast, & competitive financing solutions $57 $112 $91 $- $20 $40 $60 $80 $100 $120 2018 2019 YTD'20 Leasing Originations ($mm) 1 as of 9/30/20 1
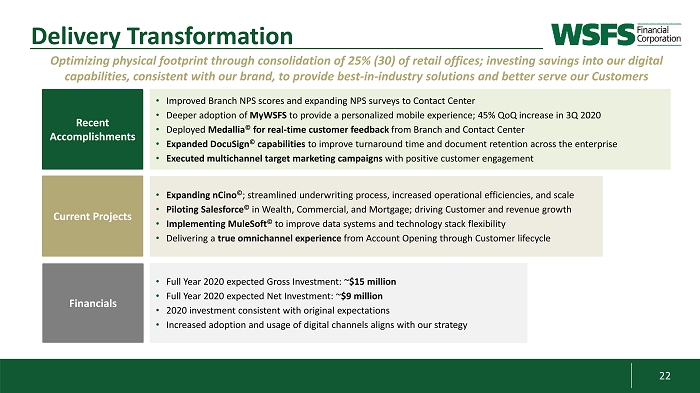
22 • Improved Branch NPS scores and expanding NPS surveys to Contact Center • Deeper adoption of MyWSFS to provide a personalized mobile experience; 45% QoQ increase in 3Q 2020 • Deployed Medallia © for real - time customer feedback from Branch and Contact Center • Expanded DocuSign © capabilities to improve turnaround time and document retention across the enterprise • Executed multichannel target marketing campaigns with positive customer engagement Recent Accomplishments Optimizing physical footprint through consolidation of 25% (30) of retail offices; investing savings into our digital capabilities, consistent with our brand, to provide best - in - industry solutions and better serve our Customers Delivery Transformation • Expanding nCino © ; streamlined underwriting process, increased operational efficiencies, and scale • Piloting Salesforce © in Wealth, Commercial, and Mortgage; driving Customer and revenue growth • Implementing MuleSoft © to improve data systems and technology stack flexibility • Delivering a true omnichannel experience from Account Opening through Customer lifecycle Current Projects • Full Year 2020 expected Gross Investment: ~ $15 million • Full Year 2020 expected Net Investment: ~ $9 million • 2020 investment consistent with original expectations • Increased adoption and usage of digital channels aligns with our strategy Financials
23 Appendix: Non - GAAP Financial Information
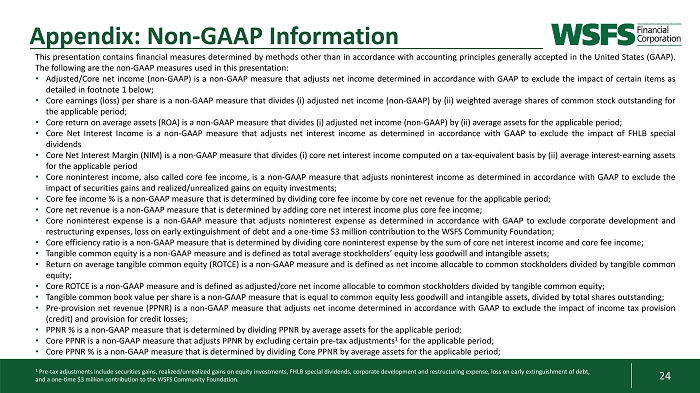
24 Appendix: Non - GAAP Information This presentation contains financial measures determined by methods other than in accordance with accounting principles generally accepted in the United States (GAAP) . The following are the non - GAAP measures used in this presentation : • Adjusted/Core net income (non - GAAP) is a non - GAAP measure that adjusts net income determined in accordance with GAAP to exclude the impact of certain items as detailed in footnote 1 below ; • Core earnings (loss) per share is a non - GAAP measure that divides ( i ) adjusted net income (non - GAAP) by (ii) weighted average shares of common stock outstanding for the applicable period ; • Core return on average assets (ROA) is a non - GAAP measure that divides ( i ) adjusted net income (non - GAAP) by (ii) average assets for the applicable period ; • Core Net Interest Income is a non - GAAP measure that adjusts net interest income as determined in accordance with GAAP to exclude the impact of FHLB special dividends • Core Net Interest Margin (NIM) is a non - GAAP measure that divides ( i ) core net interest income computed on a tax - equivalent basis by (ii) average interest - earning assets for the applicable period • Core noninterest income, also called core fee income, is a non - GAAP measure that adjusts noninterest income as determined in accordance with GAAP to exclude the impact of securities gains and realized/unrealized gains on equity investments ; • Core fee income % is a non - GAAP measure that is determined by dividing core fee income by core net revenue for the applicable period ; • Core net revenue is a non - GAAP measure that is determined by adding core net interest income plus core fee income ; • Core noninterest expense is a non - GAAP measure that adjusts noninterest expense as determined in accordance with GAAP to exclude corporate development and restructuring expenses, loss on early extinguishment of debt and a one - time $ 3 million contribution to the WSFS Community Foundation ; • Core efficiency ratio is a non - GAAP measure that is determined by dividing core noninterest expense by the sum of core net interest income and core fee income ; • Tangible common equity is a non - GAAP measure and is defined as total average stockholders’ equity less goodwill and intangible assets ; • Return on average tangible common equity (ROTCE) is a non - GAAP measure and is defined as net income allocable to common stockholders divided by tangible common equity ; • Core ROTCE is a non - GAAP measure and is defined as adjusted/core net income allocable to common stockholders divided by tangible common equity ; • Tangible common book value per share is a non - GAAP measure that is equal to common equity less goodwill and intangible assets, divided by total shares outstanding ; • Pre - provision net revenue (PPNR) is a non - GAAP measure that adjusts net income determined in accordance with GAAP to exclude the impact of income tax provision (credit) and provision for credit losses ; • PPNR % is a non - GAAP measure that is determined by dividing PPNR by average assets for the applicable period ; • Core PPNR is a non - GAAP measure that adjusts PPNR by excluding certain pre - tax adjustments 1 for the applicable period ; • Core PPNR % is a non - GAAP measure that is determined by dividing Core PPNR by average assets for the applicable period ; 1 Pre - tax adjustments include securities gains, realized/unrealized gains on equity investments, FHLB special dividends, corporat e development and restructuring expense, loss on early extinguishment of debt, and a one - time $3 million contribution to the WSFS Community Foundation.
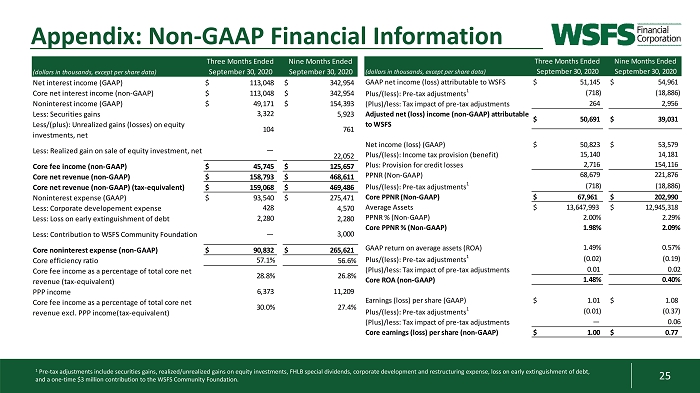
25 Appendix: Non - GAAP Financial Information 1 Pre - tax adjustments include securities gains, realized/unrealized gains on equity investments, FHLB special dividends, corporat e development and restructuring expense, loss on early extinguishment of debt, and a one - time $3 million contribution to the WSFS Community Foundation. (dollars in thousands, except per share data) Net interest income (GAAP) $ 113,048 $ 342,954 Core net interest income (non-GAAP) $ 113,048 $ 342,954 Noninterest income (GAAP) $ 49,171 $ 154,393 Less: Securities gains Less/(plus): Unrealized gains (losses) on equity investments, net Less: Realized gain on sale of equity investment, net Core fee income (non-GAAP) $ 45,745 $ 125,657 Core net revenue (non-GAAP) $ 158,793 $ 468,611 Core net revenue (non-GAAP) (tax-equivalent) $ 159,068 $ 469,486 Noninterest expense (GAAP) $ 93,540 $ 275,471 Less: Corporate developement expense Less: Loss on early extinguishment of debt Less: Contribution to WSFS Community Foundation Core noninterest expense (non-GAAP) $ 90,832 $ 265,621 Core efficiency ratio Core fee income as a percentage of total core net revenue (tax-equivalent) PPP income Core fee income as a percentage of total core net revenue excl. PPP income(tax-equivalent) Three Months Ended Nine Months Ended September 30, 2020September 30, 2020 5,923 761 22,052 2,280 3,322 104 — 428 4,570 2,280 3,000 56.6% — 57.1% 28.8% 6,373 30.0% 26.8% 11,209 27.4% (dollars in thousands, except per share data) GAAP net income (loss) attributable to WSFS $ 51,145 $ 54,961 Plus/(less): Pre-tax adjustments 1 (Plus)/less: Tax impact of pre-tax adjustments Adjusted net (loss) income (non-GAAP) attributable to WSFS $ 50,691 $ 39,031 Net income (loss) (GAAP) $ 50,823 $ 53,579 Plus/(less): Income tax provision (benefit) Plus: Provision for credit losses PPNR (Non-GAAP) Plus/(less): Pre-tax adjustments 1 Core PPNR (Non-GAAP) $ 67,961 $ 202,990 Average Assets $ 13,647,993 $ 12,945,318 PPNR % (Non-GAAP) 2.00% 2.29% Core PPNR % (Non-GAAP) 1.98% 2.09% GAAP return on average assets (ROA) Plus/(less): Pre-tax adjustments 1 (Plus)/less: Tax impact of pre-tax adjustments Core ROA (non-GAAP) Earnings (loss) per share (GAAP) $ 1.01 $ 1.08 Plus/(less): Pre-tax adjustments 1 (Plus)/less: Tax impact of pre-tax adjustments Core earnings (loss) per share (non-GAAP) $ 1.00 $ 0.77 Three Months Ended Nine Months Ended (718) 264 (18,886) 2,956 September 30, 2020 September 30, 2020 0.06 15,140 14,181 154,116 221,876 (18,886) 0.57% 0.01 1.48% (0.01) — 2,716 68,679 (718) 1.49% (0.02) (0.19) 0.02 0.40% (0.37)
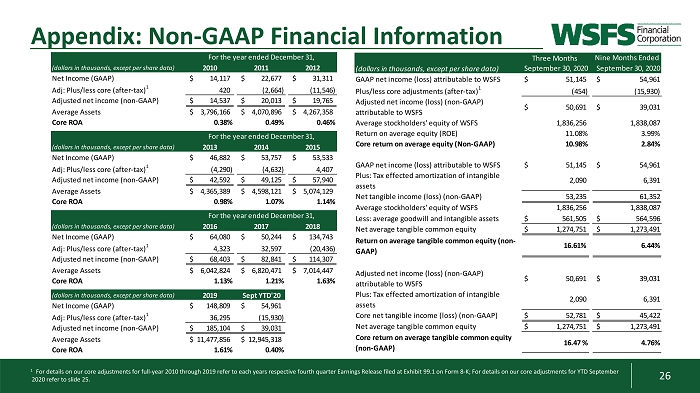
26 Appendix: Non - GAAP Financial Information 1 For details on our core adjustments for full - year 2010 through 2019 refer to each years respective fourth quarter Earnings Rele ase filed at Exhibit 99.1 on Form 8 - K; For details on our core adjustments for YTD September 2020 refer to slide 25. (dollars in thousands, except per share data) 2010 2011 2012 Net Income (GAAP) 14,117$ 22,677$ 31,311$ Adj: Plus/less core (after-tax) 1 420 (2,664) (11,546) Adjusted net income (non-GAAP) 14,537$ 20,013$ 19,765$ Average Assets 3,796,166$ 4,070,896$ 4,267,358$ Core ROA 0.38% 0.49% 0.46% (dollars in thousands, except per share data) 2013 2014 2015 Net Income (GAAP) 46,882$ 53,757$ 53,533$ Adj: Plus/less core (after-tax) 1 (4,290) (4,632) 4,407 Adjusted net income (non-GAAP) 42,592$ 49,125$ 57,940$ Average Assets 4,365,389$ 4,598,121$ 5,074,129$ Core ROA 0.98% 1.07% 1.14% (dollars in thousands, except per share data) 2016 2017 2018 Net Income (GAAP) 64,080$ 50,244$ 134,743$ Adj: Plus/less core (after-tax) 1 4,323 32,597 (20,436) Adjusted net income (non-GAAP) 68,403$ 82,841$ 114,307$ Average Assets 6,042,824$ 6,820,471$ 7,014,447$ Core ROA 1.13% 1.21% 1.63% (dollars in thousands, except per share data) 2019 Sept YTD'20 Net Income (GAAP) 148,809$ 54,961$ Adj: Plus/less core (after-tax) 1 36,295 (15,930) Adjusted net income (non-GAAP) 185,104$ 39,031$ Average Assets 11,477,856$ 12,945,318$ Core ROA 1.61% 0.40% For the year ended December 31, For the year ended December 31, For the year ended December 31, (dollars in thousands, except per share data) GAAP net income (loss) attributable to WSFS $ 51,145 $ 54,961 Plus/less core adjustments (after-tax) 1 (454) (15,930) Adjusted net income (loss) (non-GAAP) attributable to WSFS $ 50,691 $ 39,031 Average stockholders' equity of WSFS Return on average equity (ROE) 11.08% 3.99% Core return on average equity (Non-GAAP) 10.98% 2.84% GAAP net income (loss) attributable to WSFS $ 51,145 $ 54,961 Plus: Tax effected amortization of intangible assets Net tangible income (loss) (non-GAAP) Average stockholders' equity of WSFS Less: average goodwill and intangible assets $ 561,505 $ 564,596 Net average tangible common equity $ 1,274,751 $ 1,273,491 Return on average tangible common equity (non- GAAP) Adjusted net income (loss) (non-GAAP) attributable to WSFS $ 50,691 $ 39,031 Plus: Tax effected amortization of intangible assets Core net tangible income (loss) (non-GAAP) $ 52,781 $ 45,422 Net average tangible common equity $ 1,274,751 $ 1,273,491 Core return on average tangible common equity (non-GAAP) 16.61% 6,391 4.76% Nine Months Ended 61,352 1,838,087 6.44% 2,090 16.47 % Three Months 2,090 53,235 1,836,256 1,836,256 1,838,087 September 30, 2020 6,391 September 30, 2020
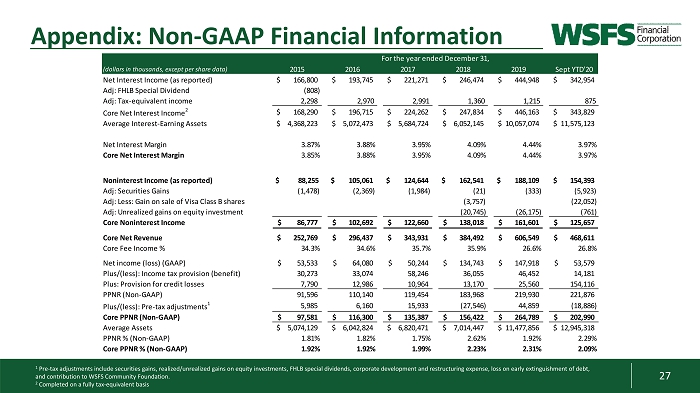
27 Appendix: Non - GAAP Financial Information 1 Pre - tax adjustments include securities gains, realized/unrealized gains on equity investments, FHLB special dividends, corporat e development and restructuring expense, loss on early extinguishment of debt, and contribution to WSFS Community Foundation. 2 Completed on a fully tax - equivalent basis (dollars in thousands, except per share data) 2015 2016 2017 2018 2019 Sept YTD'20 Net Interest Income (as reported) 166,800$ 193,745$ 221,271$ 246,474$ 444,948$ 342,954$ Adj: FHLB Special Dividend (808) Adj: Tax-equivalent income 2,298 2,970 2,991 1,360 1,215 875 Core Net Interest Income 2 168,290$ 196,715$ 224,262$ 247,834$ 446,163$ 343,829$ Average Interest-Earning Assets 4,368,223$ 5,072,473$ 5,684,724$ 6,052,145$ 10,057,074$ 11,575,123$ Net Interest Margin 3.87% 3.88% 3.95% 4.09% 4.44% 3.97% Core Net Interest Margin 3.85% 3.88% 3.95% 4.09% 4.44% 3.97% Noninterest Income (as reported) $ 88,255 $ 105,061 $ 124,644 $ 162,541 $ 188,109 154,393$ Adj: Securities Gains (1,478) (2,369) (1,984) (21) (333) (5,923) Adj: Less: Gain on sale of Visa Class B shares (3,757) (22,052) Adj: Unrealized gains on equity investment (20,745) (26,175) (761) Core Noninterest Income 86,777$ 102,692$ 122,660$ 138,018$ 161,601$ 125,657$ Core Net Revenue 252,769$ 296,437$ 343,931$ 384,492$ 606,549$ 468,611$ Core Fee Income % 34.3% 34.6% 35.7% 35.9% 26.6% 26.8% Net income (loss) (GAAP) 53,533$ 64,080$ 50,244$ 134,743$ 147,918$ 53,579$ Plus/(less): Income tax provision (benefit) 30,273 33,074 58,246 36,055 46,452 14,181 Plus: Provision for credit losses 7,790 12,986 10,964 13,170 25,560 154,116 PPNR (Non-GAAP) 91,596 110,140 119,454 183,968 219,930 221,876 Plus/(less): Pre-tax adjustments 1 5,985 6,160 15,933 (27,546) 44,859 (18,886) Core PPNR (Non-GAAP) 97,581$ 116,300$ 135,387$ 156,422$ 264,789$ 202,990$ Average Assets 5,074,129$ 6,042,824$ 6,820,471$ 7,014,447$ 11,477,856$ 12,945,318$ PPNR % (Non-GAAP) 1.81% 1.82% 1.75% 2.62% 1.92% 2.29% Core PPNR % (Non-GAAP) 1.92% 1.92% 1.99% 2.23% 2.31% 2.09% For the year ended December 31,