Attached files
| file | filename |
|---|---|
| 10-K - 10-K - SUBURBAN PROPANE PARTNERS LP | sph-10k_20200926.htm |
| EX-32.2 - EX-32.2 - SUBURBAN PROPANE PARTNERS LP | sph-ex322_14.htm |
| EX-32.1 - EX-32.1 - SUBURBAN PROPANE PARTNERS LP | sph-ex321_9.htm |
| EX-31.2 - EX-31.2 - SUBURBAN PROPANE PARTNERS LP | sph-ex312_12.htm |
| EX-31.1 - EX-31.1 - SUBURBAN PROPANE PARTNERS LP | sph-ex311_7.htm |
| EX-23.1 - EX-23.1 - SUBURBAN PROPANE PARTNERS LP | sph-ex231_10.htm |
| EX-21.1 - EX-21.1 - SUBURBAN PROPANE PARTNERS LP | sph-ex211_11.htm |
Exhibit 99.2
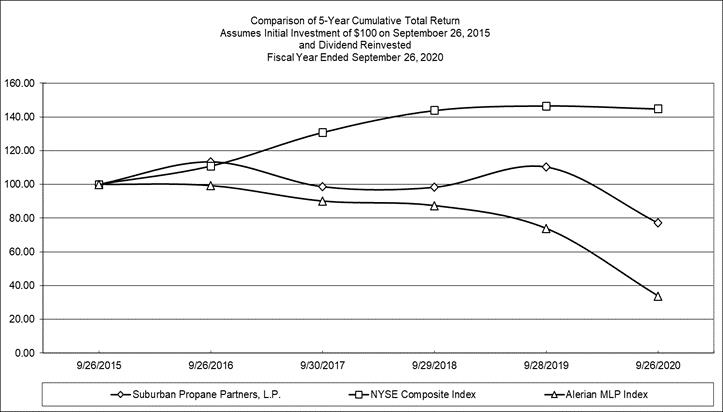
FIVE-YEAR PERFORMANCE GRAPH 1
The following graph compares the performance of our Common Units with the performance of the NYSE Composite Index and the Alerian MLP Index for the period of the five fiscal years commencing September 26, 2015. The graph assumes that at the beginning of the period, $100 was invested in each of (1) our Common Units, (2) the NYSE Composite Index and (3) the Alerian MLP Index, and that all distributions or dividends were reinvested.
We do not believe that any published industry or line-of-business index accurately reflects our business.
1 The performance graph shall not be deemed incorporated by reference by any general statement incorporating by reference this Annual Report on Form 10-K into any filing under the Securities Act of 1933, as amended, or the Securities Exchange Act of 1934, as amended, except to the extent that Suburban specifically incorporates this information by reference in such filing, and shall not otherwise be deemed filed under such Acts.