Attached files
| file | filename |
|---|---|
| EX-99.2 - EX-99.2 - DEERE & CO | de-20201125xex99d2.htm |
| EX-99.1 - EX-99.1 - DEERE & CO | de-20201125xex99d1.htm |
| 8-K - 8-K - DEERE & CO | de-20201125x8k.htm |
Exhibit 99.3
| 4Q 2020 Earnings Call 25 November 2020 23 |
| John Deere | 4Q 2020 Earnings Call | November 25, 2020 2 Safe Harbor Statement & Disclosures The earnings call and accompanying material include forward-looking comments and information concerning the company’s plans and projections for the future, including estimates and assumptions with respect to economic, political, technological, weather, market acceptance, acquisitions and divestitures of businesses, anticipated transaction costs, the integration of new businesses, anticipated benefits of acquisitions, and other factors that impact our businesses and customers. They also may include financial measures that are not in conformance with accounting principles generally accepted in the United States of America (GAAP). Words such as “forecast,” “projection,” “outlook,” “prospects,” “expected,” “estimated,” “will,” “plan,” “anticipate,” “intend,” “believe,” or other similar words or phrases often identify forward-looking statements. Actual results may differ materially from those projected in these forward-looking statements based on a number of factors and uncertainties, including those related to the effects of the COVID-19 pandemic. Additional information concerning factors that could cause actual results to differ materially is contained in the company’s most recent Form 8-K and periodic report filed with the U.S. Securities and Exchange Commission, and is incorporated by reference herein. Investors should refer to and consider the incorporated information on risks and uncertainties in addition to the information presented here. The company, except as required by law, undertakes no obligation to update or revise its forward-looking statements whether as a result of new developments or otherwise. The call and accompanying materials are not an offer to sell or a solicitation of offers to buy any of the company’s securities. 24 |

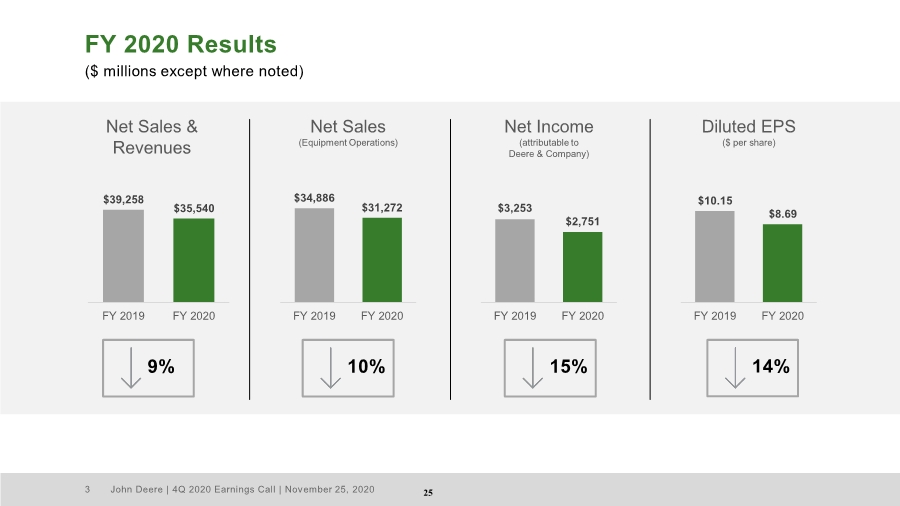
| John Deere | 4Q 2020 Earnings Call | November 25, 2020 3 FY 2020 Results ($ millions except where noted) $39,258 $35,540 FY 2019 FY 2020 $34,886 $31,272 FY 2019 FY 2020 $3,253 $2,751 FY 2019 FY 2020 $10.15 $8.69 FY 2019 FY 2020 10% Net Sales & Revenues Net Sales (Equipment Operations) Net Income (attributable to Deere & Company) Diluted EPS ($ per share) 9% 15% 14% 25 |
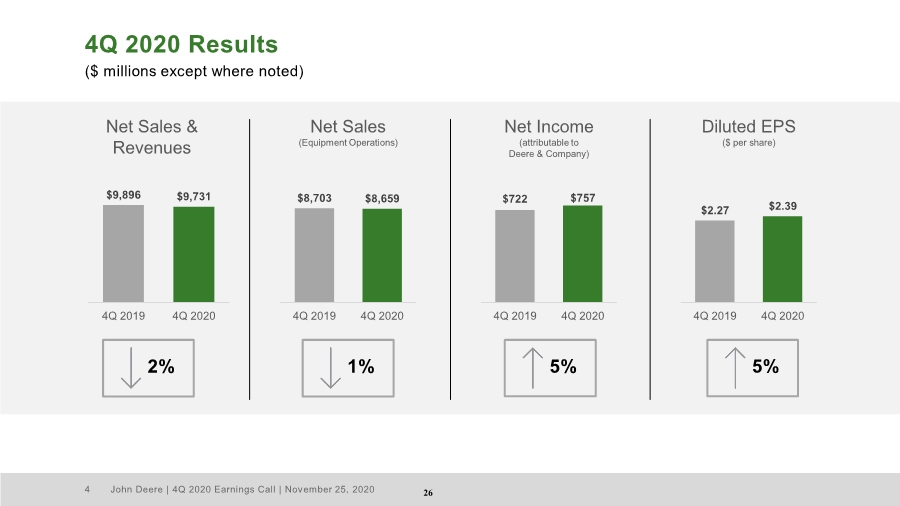
| John Deere | 4Q 2020 Earnings Call | November 25, 2020 4 4Q 2020 Results ($ millions except where noted) $9,896 $9,731 4Q 2019 4Q 2020 $8,703 $8,659 4Q 2019 4Q 2020 $722 $757 4Q 2019 4Q 2020 $2.27 $2.39 4Q 2019 4Q 2020 1% Net Sales & Revenues Net Sales (Equipment Operations) Net Income (attributable to Deere & Company) Diluted EPS ($ per share) 2% 5% 5% 26 |
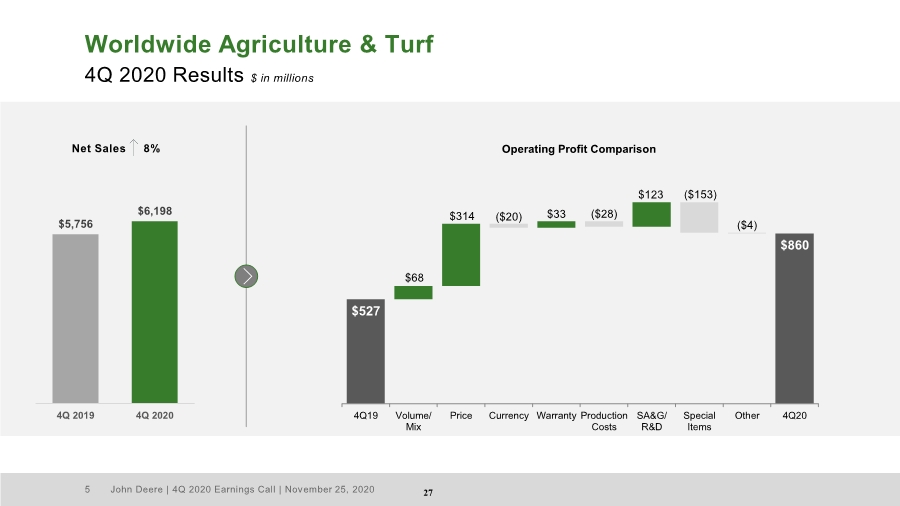
| John Deere | 4Q 2020 Earnings Call | November 25, 2020 5 Worldwide Agriculture & Turf 4Q 2020 Results $ in millions $5,756 $6,198 4Q 2019 4Q 2020 Net Sales 8% $860 $68 ($153) ($4) $527 $314 ($20) $33 ($28) $123 4Q19 Volume/ Mix Price Currency Warranty Production Costs SA&G/ R&D Special Items Other 4Q20 Operating Profit Comparison 27 |
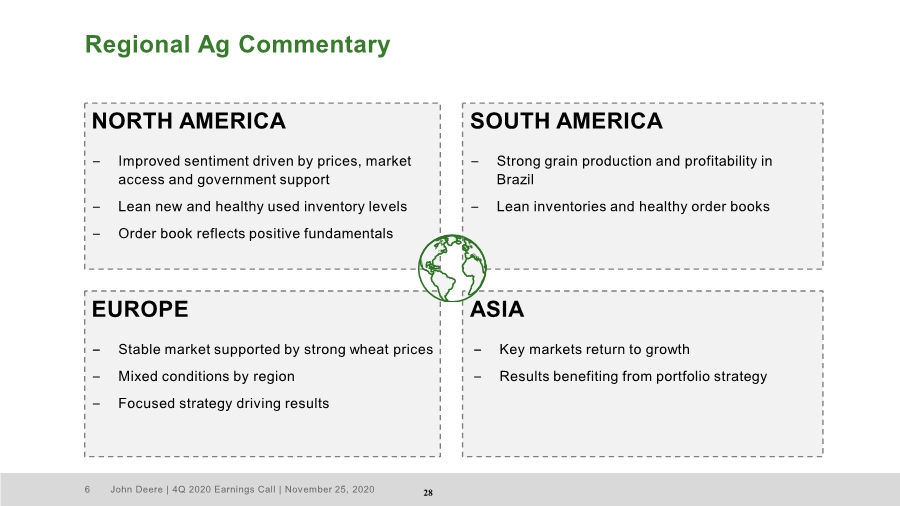
| John Deere | 4Q 2020 Earnings Call | November 25, 2020 6 Regional Ag Commentary NORTH AMERICA SOUTH AMERICA EUROPE ASIA – Key markets return to growth – Results benefiting from portfolio strategy – Stable market supported by strong wheat prices – Mixed conditions by region – Focused strategy driving results – Strong grain production and profitability in Brazil – Lean inventories and healthy order books – Improved sentiment driven by prices, market access and government support – Lean new and healthy used inventory levels – Order book reflects positive fundamentals 28 |
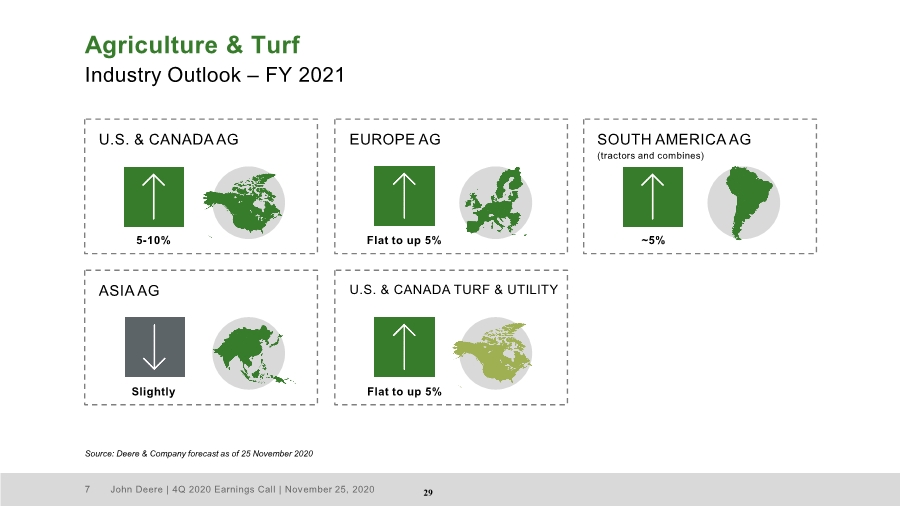
| John Deere | 4Q 2020 Earnings Call | November 25, 2020 7 Agriculture & Turf Industry Outlook – FY 2021 Source: Deere & Company forecast as of 25 November 2020 U.S. & CANADA AG EUROPE AG SOUTH AMERICA AG (tractors and combines) ASIA AG U.S. & CANADA TURF & UTILITY 5-10% Flat to up 5% ~5% Flat to up 5% Slightly 29 |
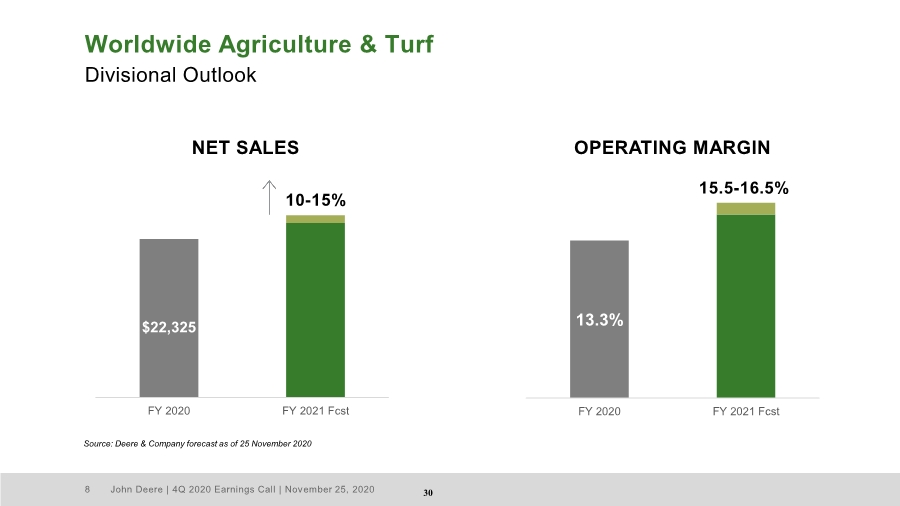
| John Deere | 4Q 2020 Earnings Call | November 25, 2020 8 13.3% FY 2020 FY 2021 Fcst Worldwide Agriculture & Turf Divisional Outlook $22,325 FY 2020 FY 2021 Fcst NET SALES 15.5-16.5% OPERATING MARGIN Source: Deere & Company forecast as of 25 November 2020 10-15% 30 |
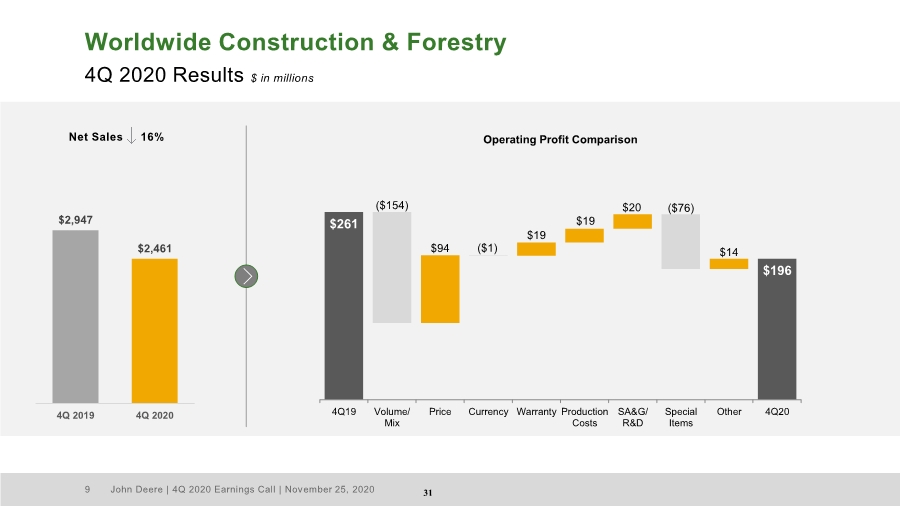
| John Deere | 4Q 2020 Earnings Call | November 25, 2020 9 Worldwide Construction & Forestry 4Q 2020 Results $ in millions $2,947 $2,461 4Q 2019 4Q 2020 Net Sales 16% $196 ($154) $19 $19 $20 ($76) $261 $94 ($1) $14 4Q19 Volume/ Mix Price Currency Warranty Production Costs SA&G/ R&D Special Items Other 4Q20 Operating Profit Comparison 31 |
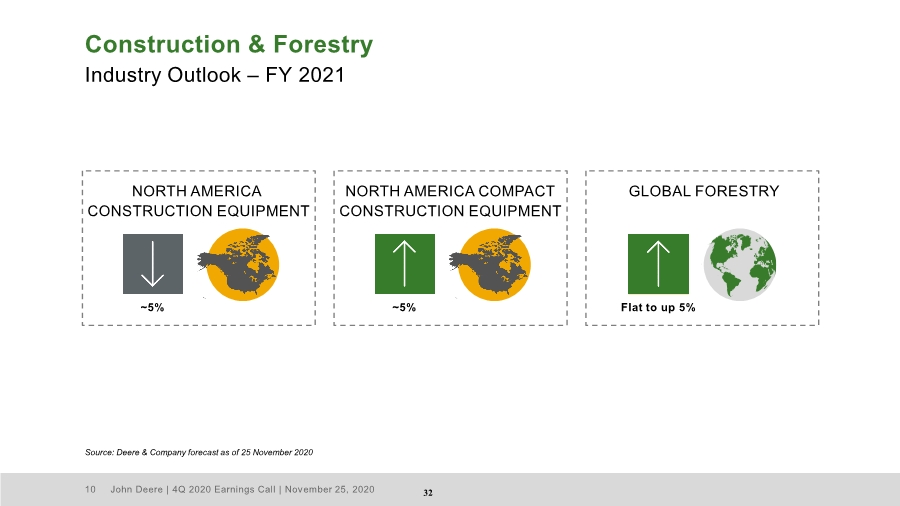
| John Deere | 4Q 2020 Earnings Call | November 25, 2020 10 Construction & Forestry Industry Outlook – FY 2021 Source: Deere & Company forecast as of 25 November 2020 NORTH AMERICA COMPACT CONSTRUCTION EQUIPMENT ~5% GLOBAL FORESTRY Flat to up 5% NORTH AMERICA CONSTRUCTION EQUIPMENT ~5% 32 |
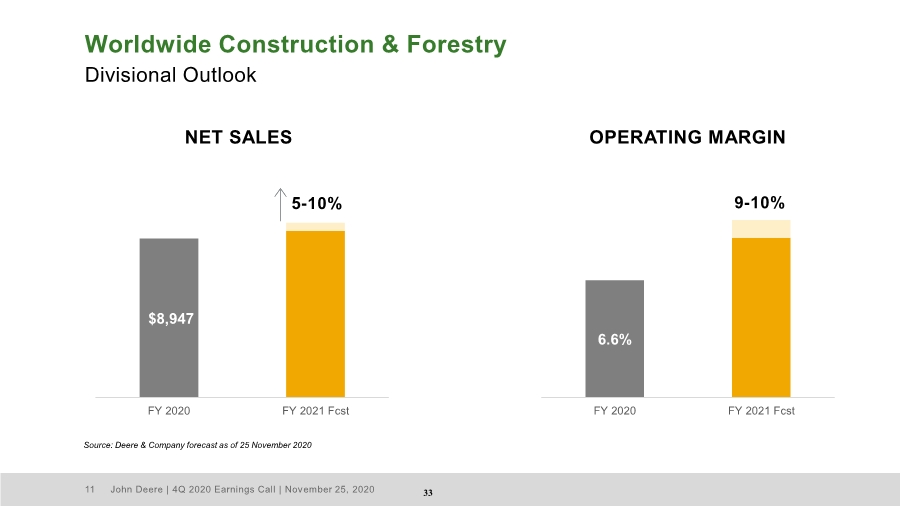
| John Deere | 4Q 2020 Earnings Call | November 25, 2020 11 6.6% FY 2020 FY 2021 Fcst Worldwide Construction & Forestry Divisional Outlook Source: Deere & Company forecast as of 25 November 2020 $8,947 FY 2020 FY 2021 Fcst NET SALES 9-10% OPERATING MARGIN 5-10% 33 |
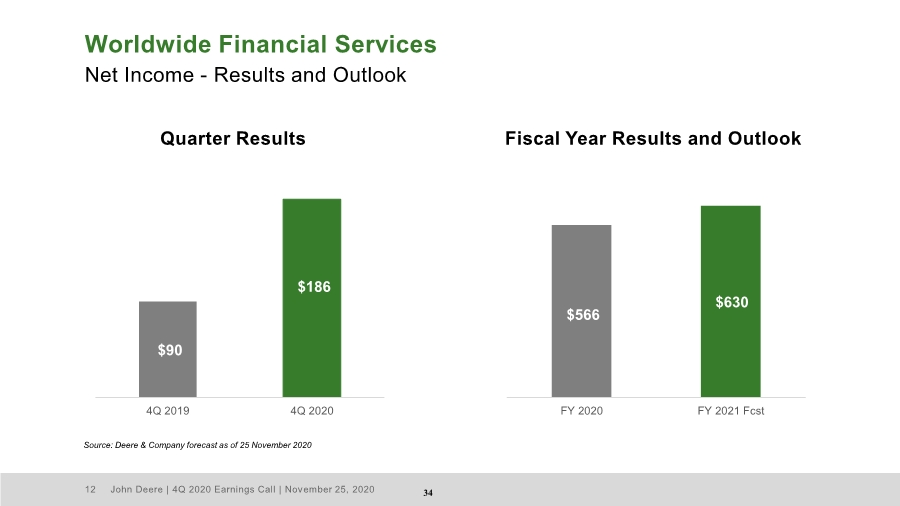
| John Deere | 4Q 2020 Earnings Call | November 25, 2020 12 Worldwide Financial Services Net Income - Results and Outlook Source: Deere & Company forecast as of 25 November 2020 $90 $186 4Q 2019 4Q 2020 Quarter Results Fiscal Year Results and Outlook $566 $630 FY 2020 FY 2021 Fcst 34 |
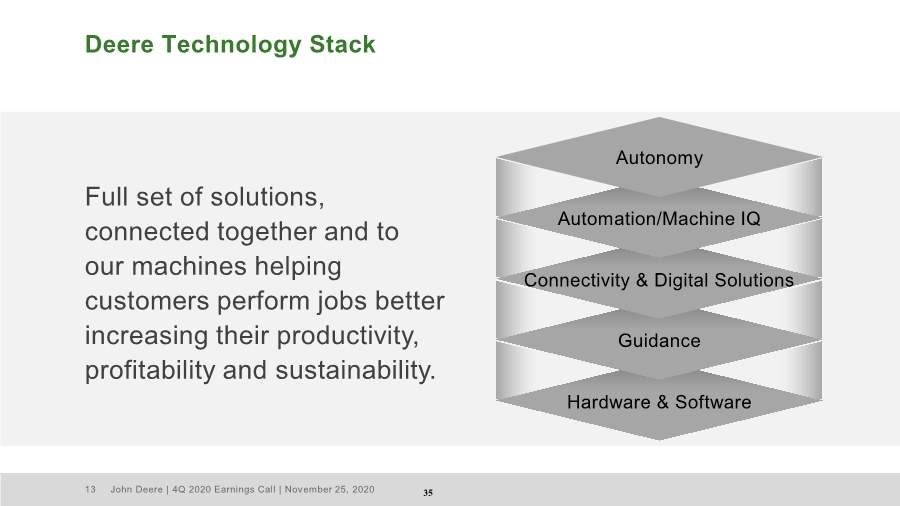
| John Deere | 4Q 2020 Earnings Call | November 25, 2020 13 Deere Technology Stack Full set of solutions, connected together and to our machines helping customers perform jobs better increasing their productivity, profitability and sustainability. Hardware & Software Guidance Connectivity & Digital Solutions Automation/Machine IQ Autonomy 35 |
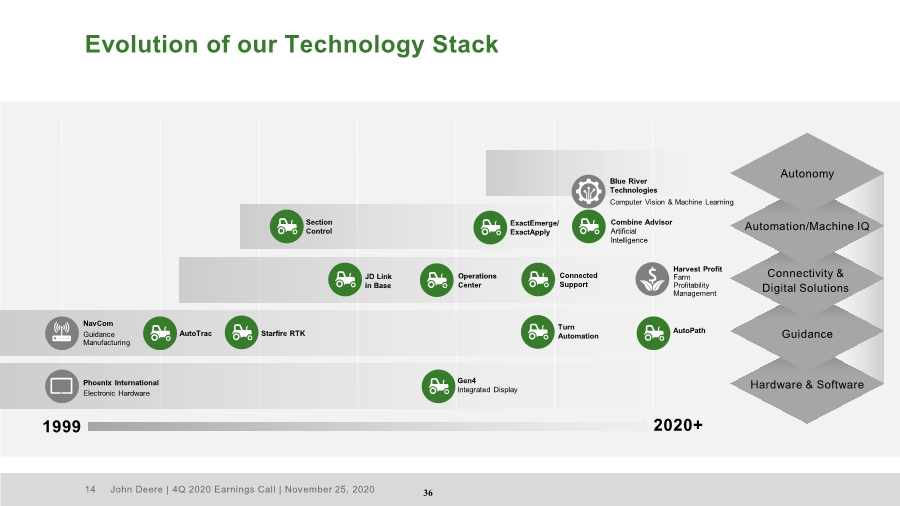
| John Deere | 4Q 2020 Earnings Call | November 25, 2020 14 Evolution of our Technology Stack Hardware & Software Guidance Automation/Machine IQ Autonomy 1999 Phoenix International Electronic Hardware NavCom Guidance Manufacturing Section Control AutoTrac JD Link in Base Operations Center Combine Advisor Artificial Intelligence Blue River Technologies Computer Vision & Machine Learning 2020+ Harvest Profit Farm Profitability Management AutoPath Turn Automation Gen4 Integrated Display Starfire RTK Connected Support ExactEmerge/ ExactApply Connectivity & Digital Solutions 36 |
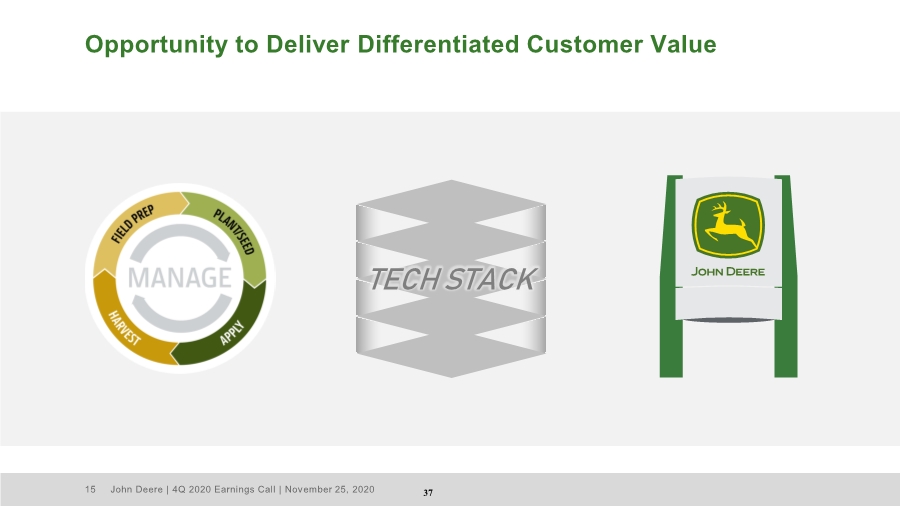
| John Deere | 4Q 2020 Earnings Call | November 25, 2020 15 Opportunity to Deliver Differentiated Customer Value TECH STACK 37 |
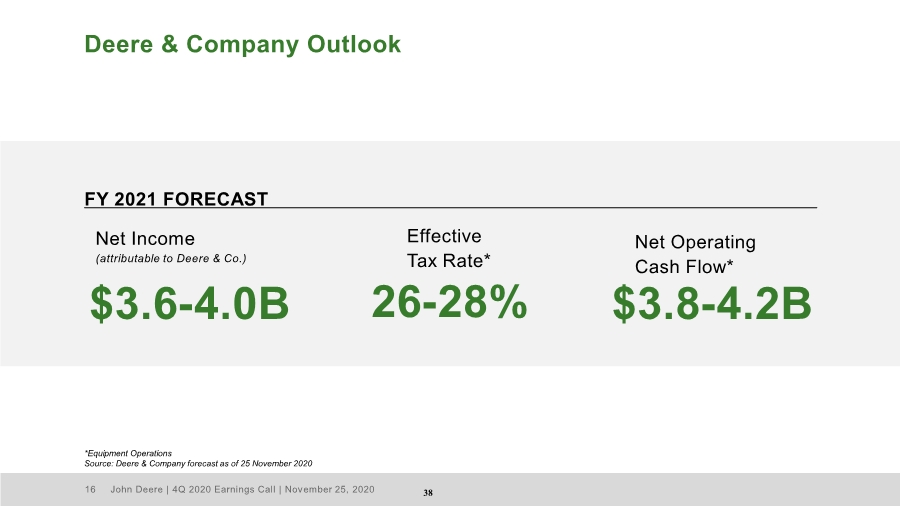
| John Deere | 4Q 2020 Earnings Call | November 25, 2020 16 Deere & Company Outlook Effective Tax Rate* Net Income (attributable to Deere & Co.) 26-28% $3.6-4.0B FY 2021 FORECAST Net Operating Cash Flow* $3.8-4.2B *Equipment Operations Source: Deere & Company forecast as of 25 November 2020 38 |
| John Deere | 4Q 2020 Earnings Call | November 25, 2020 17 Appendix 39 |

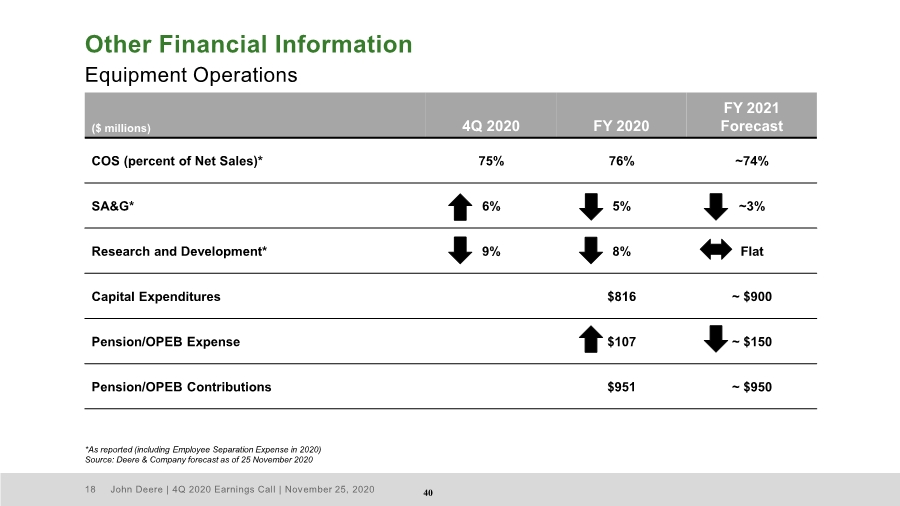
| John Deere | 4Q 2020 Earnings Call | November 25, 2020 18 ($ millions) 4Q 2020 FY 2020 FY 2021 Forecast COS (percent of Net Sales)* 75% 76% ~74% SA&G* 6% 5% ~3% Research and Development* 9% 8% Flat Capital Expenditures $816 ~ $900 Pension/OPEB Expense $107 ~ $150 Pension/OPEB Contributions $951 ~ $950 Other Financial Information Equipment Operations *As reported (including Employee Separation Expense in 2020) Source: Deere & Company forecast as of 25 November 2020 40 |
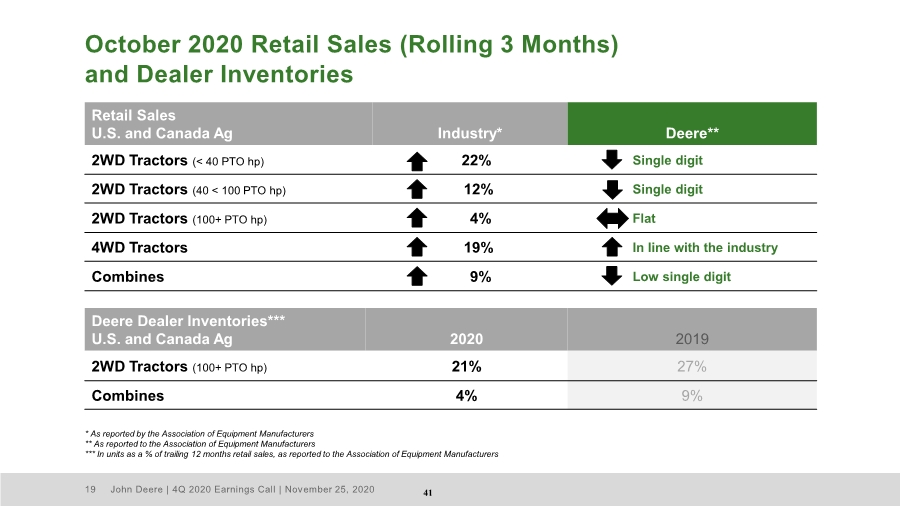
| John Deere | 4Q 2020 Earnings Call | November 25, 2020 19 October 2020 Retail Sales (Rolling 3 Months) and Dealer Inventories Retail Sales U.S. and Canada Ag Industry* Deere** 2WD Tractors (< 40 PTO hp) 22% Single digit 2WD Tractors (40 < 100 PTO hp) 12% Single digit 2WD Tractors (100+ PTO hp) 4% Flat 4WD Tractors 19% In line with the industry Combines 9% Low single digit Deere Dealer Inventories*** U.S. and Canada Ag 2020 2019 2WD Tractors (100+ PTO hp) 21% 27% Combines 4% 9% * As reported by the Association of Equipment Manufacturers ** As reported to the Association of Equipment Manufacturers *** In units as a % of trailing 12 months retail sales, as reported to the Association of Equipment Manufacturers 41 |
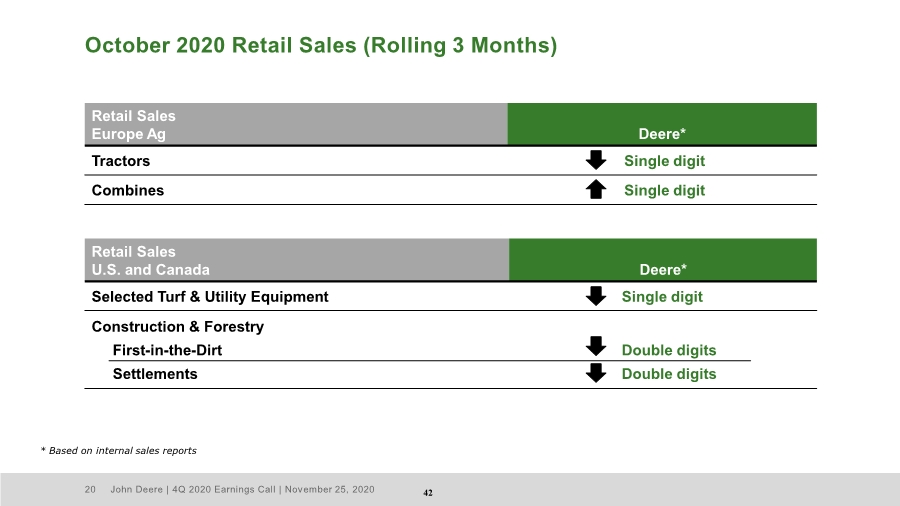
| John Deere | 4Q 2020 Earnings Call | November 25, 2020 20 Retail Sales U.S. and Canada Deere* Selected Turf & Utility Equipment Single digit Construction & Forestry First-in-the-Dirt Settlements Double digits Double digits October 2020 Retail Sales (Rolling 3 Months) Retail Sales Europe Ag Deere* Tractors Single digit Combines Single digit * Based on internal sales reports 42 |
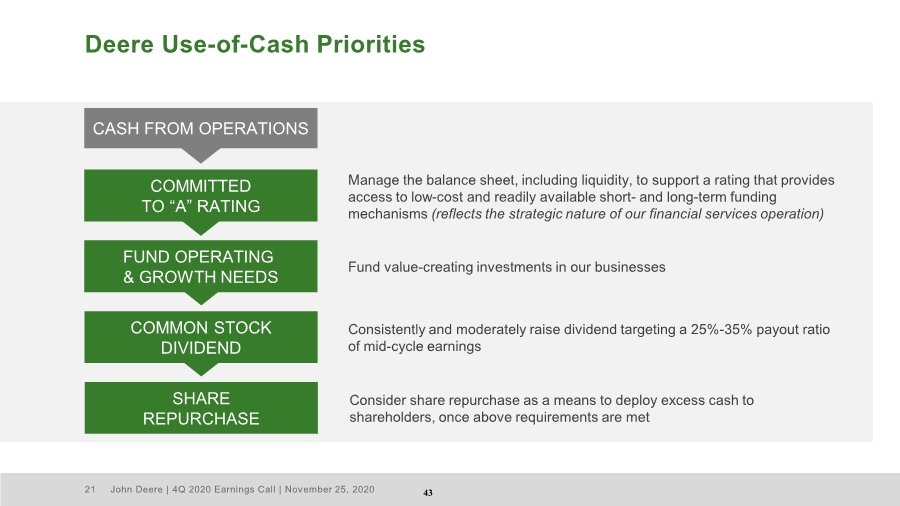
| John Deere | 4Q 2020 Earnings Call | November 25, 2020 21 Deere Use-of-Cash Priorities SHARE REPURCHASE Manage the balance sheet, including liquidity, to support a rating that provides access to low-cost and readily available short- and long-term funding mechanisms (reflects the strategic nature of our financial services operation) Fund value-creating investments in our businesses Consistently and moderately raise dividend targeting a 25%-35% payout ratio of mid-cycle earnings Consider share repurchase as a means to deploy excess cash to shareholders, once above requirements are met COMMITTED TO “A” RATING FUND OPERATING & GROWTH NEEDS COMMON STOCK DIVIDEND CASH FROM OPERATIONS 43 |
| John Deere | 4Q 2020 Earnings Call | November 25, 2020 22 Deere & Company’s 1Q 2021 earnings call is scheduled for 9:00 a.m. central time on Friday, 19 February 2021. 44 |

| 45 |