Attached files
| file | filename |
|---|---|
| 8-K - 8-K - Old COPPER Company, Inc. | d72607d8k.htm |
Exhibit 99.1
J. C. PENNEY COMPANY, INC.
(Debtor-in-Possession)
CONSOLIDATED STATEMENTS OF OPERATIONS
(Unaudited)
| Month Ended | Nine Months Ended | |||||||||||||||
| (In millions) | October 31, 2020 |
November 2, 2019 |
October 31, 2020 |
November 2, 2019 |
||||||||||||
| Total net sales |
$ | 479 | $ | 764 | $ | 4,147 | $ | 7,332 | ||||||||
| Credit income and other |
30 | 36 | 266 | 342 | ||||||||||||
|
|
|
|
|
|
|
|
|
|||||||||
| Total revenues |
509 | 800 | 4,413 | 7,674 | ||||||||||||
| Costs and expenses/(income): |
||||||||||||||||
| Cost of goods sold (exclusive of depreciation and amortization shown separately below) |
334 | 455 | 2,909 | 4,756 | ||||||||||||
| Selling, general and administrative (SG&A) |
198 | 261 | 1,621 | 2,580 | ||||||||||||
| Depreciation and amortization |
46 | 41 | 462 | 415 | ||||||||||||
| Real estate and other, net |
2 | — | (6 | ) | (3 | ) | ||||||||||
| Restructuring and management transition |
7 | 4 | 236 | 36 | ||||||||||||
|
|
|
|
|
|
|
|
|
|||||||||
| Total costs and expenses |
587 | 761 | 5,222 | 7,784 | ||||||||||||
|
|
|
|
|
|
|
|
|
|||||||||
| Operating income/(loss) |
(78 | ) | 39 | (809 | ) | (110 | ) | |||||||||
| Other components of net periodic pension cost/(income) |
8 | (4 | ) | 44 | (39 | ) | ||||||||||
| (Gain) / loss on extinguishment of debt |
— | — | — | (1 | ) | |||||||||||
| Net interest expense |
28 | 25 | 238 | 220 | ||||||||||||
| Loss due to discontinuance of hedge accounting |
— | — | 77 | — | ||||||||||||
| Reorganization items, net |
42 | — | 210 | — | ||||||||||||
|
|
|
|
|
|
|
|
|
|||||||||
| Income/(loss) before income taxes |
(156 | ) | 18 | (1,378 | ) | (290 | ) | |||||||||
| Income tax expense/(benefit) |
— | (3 | ) | (66 | ) | 5 | ||||||||||
|
|
|
|
|
|
|
|
|
|||||||||
| Net income/(loss) |
$ | (156 | ) | $ | 21 | $ | (1,312 | ) | $ | (295 | ) | |||||
|
|
|
|
|
|
|
|
|
|||||||||
Note: The financial statements presented are internal monthly financial statements within a fiscal quarter, do not include certain quarterly adjustments and other important explanatory notes, and have not been audited or reviewed by any independent public accounting firm. Quarterly financial statements are subject to internal controls over financial reporting performed only with respect to quarterly financial statements. Consequently, these monthly financial statements may be subject to future reconciliation or adjustments to conform to generally accepted accounting principles or reporting requirements of the SEC and may not be representative of our financial position or indicative of future operating results or cash flows.
J. C. PENNEY COMPANY, INC.
(Debtor-in-Possession)
CONSOLIDATED BALANCE SHEETS
(Unaudited)
| (In millions) | October 31, 2020 |
November 2, 2019 |
February 1, 2020 |
|||||||||
| Assets |
||||||||||||
| Current assets: |
||||||||||||
| Cash in banks and in transit |
$ | 195 | $ | 147 | $ | 108 | ||||||
| Cash short-term investments |
476 | 10 | 278 | |||||||||
| Restricted cash |
515 | — | — | |||||||||
|
|
|
|
|
|
|
|||||||
| Cash, cash equivalents and restricted cash |
1,186 | 157 | 386 | |||||||||
| Merchandise inventory |
1,907 | 2,934 | 2,166 | |||||||||
| Prepaid expenses and other |
610 | 285 | 174 | |||||||||
|
|
|
|
|
|
|
|||||||
| Total current assets |
3,703 | 3,376 | 2,726 | |||||||||
| Property and equipment, net |
3,037 | 3,548 | 3,488 | |||||||||
| Operating lease assets |
753 | 942 | 998 | |||||||||
| Prepaid pension |
16 | 175 | 120 | |||||||||
| Other assets |
625 | 658 | 657 | |||||||||
|
|
|
|
|
|
|
|||||||
| Total assets |
$ | 8,134 | $ | 8,699 | $ | 7,989 | ||||||
|
|
|
|
|
|
|
|||||||
| Liabilities and stockholders’ equity |
||||||||||||
| Current liabilities: |
||||||||||||
| Merchandise accounts payable |
$ | 252 | $ | 1,105 | $ | 786 | ||||||
| Other accounts payable and accrued expenses |
805 | 899 | 931 | |||||||||
| Current operating lease liabilities |
— | 78 | 68 | |||||||||
|
Debtor-in-possession financing |
900 | — | — | |||||||||
| Current portion of long-term debt, net |
1,264 | 147 | 147 | |||||||||
|
|
|
|
|
|
|
|||||||
| Total current liabilities |
3,221 | 2,229 | 1,932 | |||||||||
| Noncurrent operating lease liabilities |
— | 1,112 | 1,108 | |||||||||
| Long-term debt |
— | 4,011 | 3,574 | |||||||||
| Deferred taxes |
41 | 117 | 116 | |||||||||
| Other liabilities |
284 | 362 | 430 | |||||||||
|
|
|
|
|
|
|
|||||||
| Total liabilities not subject to compromise |
3,546 | 7,831 | 7,160 | |||||||||
|
|
|
|
|
|
|
|||||||
| Liabilities subject to compromise |
5,063 | — | — | |||||||||
| Stockholders’ (deficit) equity |
||||||||||||
| Common stock |
161 | 160 | 160 | |||||||||
| Additional paid-in capital |
4,721 | 4,720 | 4,723 | |||||||||
| Reinvested earnings/(accumulated deficit) |
(4,981 | ) | (3,694 | ) | (3,667 | ) | ||||||
| Accumulated other comprehensive income/(loss) |
(376 | ) | (318 | ) | (387 | ) | ||||||
|
|
|
|
|
|
|
|||||||
| Total stockholders’ (deficit) equity |
(475 | ) | 868 | 829 | ||||||||
|
|
|
|
|
|
|
|||||||
| Total liabilities and stockholders’ (deficit) equity |
$ | 8,134 | $ | 8,699 | $ | 7,989 | ||||||
|
|
|
|
|
|
|
|||||||
Note: The financial statements presented are internal monthly financial statements within a fiscal quarter, do not include certain quarterly adjustments and other important explanatory notes, and have not been audited or reviewed by any independent public accounting firm. Quarterly financial statements are subject to internal controls over financial reporting performed only with respect to quarterly financial statements. Consequently, these monthly financial statements may be subject to future reconciliation or adjustments to conform to generally accepted accounting principles or reporting requirements of the SEC and may not be representative of our financial position or indicative of future operating results or cash flows.
J. C. PENNEY COMPANY, INC.
(Debtor-in-Possession)
CONSOLIDATED STATEMENTS OF STOCKHOLDERS’ (DEFICIT) EQUITY
(Unaudited)
| (In millions) | Number of Common Shares |
Common Stock |
Additional Paid-in Capital |
Reinvested Earnings/(Accumulated Deficit) |
Accumulated Other Comprehensive Income/(Loss) |
Total Stockholders’ (Deficit)/ Equity |
||||||||||||||||||
| February 1, 2020 |
320.5 | $ | 160 | $ | 4,723 | $ | (3,667 | ) | $ | (387 | ) | $ | 829 | |||||||||||
| Net income/(loss) |
— | — | — | (1,156 | ) | — | (1,156 | ) | ||||||||||||||||
| Discontinuance of hedge accounting |
— | — | — | — | 64 | 64 | ||||||||||||||||||
| Other comprehensive income/(loss) |
— | — | — | — | (35 | ) | (35 | ) | ||||||||||||||||
| Stock-based compensation and other |
2.3 | 1 | (2 | ) | (1 | ) | — | (2 | ) | |||||||||||||||
|
|
|
|
|
|
|
|
|
|
|
|
|
|||||||||||||
| October 3, 2020 |
322.8 | 161 | 4,721 | (4,824 | ) | (358 | ) | (300 | ) | |||||||||||||||
| Net income/(loss) |
— | — | — | (156 | ) | — | (156 | ) | ||||||||||||||||
| Other comprehensive income/(loss) |
— | — | — | — | (16 | ) | (16 | ) | ||||||||||||||||
| Stock-based compensation and other |
— | — | — | (1 | ) | (2 | ) | (3 | ) | |||||||||||||||
|
|
|
|
|
|
|
|
|
|
|
|
|
|||||||||||||
| October 31, 2020 |
322.8 | $ | 161 | $ | 4,721 | $ | (4,981 | ) | $ | (376 | ) | $ | (475 | ) | ||||||||||
|
|
|
|
|
|
|
|
|
|
|
|
|
|||||||||||||
| (In millions) | Number of Common Shares |
Common Stock |
Additional Paid-in Capital |
Reinvested Earnings/(Accumulated Deficit) |
Accumulated Other Comprehensive Income/(Loss) |
Total Stockholders’ Equity |
||||||||||||||||||
| February 2, 2019 |
316.1 | $ | 158 | $ | 4,713 | $ | (3,373 | ) | $ | (328 | ) | $ | 1,170 | |||||||||||
| ASC 842 (Leases) and ASU 2018-02 (Stranded Taxes) adoption |
— | — | — | (26 | ) | 53 | 27 | |||||||||||||||||
| Net income/(loss) |
— | — | — | (316 | ) | — | (316 | ) | ||||||||||||||||
| Other comprehensive income/(loss) |
— | — | — | — | (39 | ) | (39 | ) | ||||||||||||||||
| Stock-based compensation and other |
2.3 | 1 | 10 | (2 | ) | — | 9 | |||||||||||||||||
|
|
|
|
|
|
|
|
|
|
|
|
|
|||||||||||||
| October 5, 2019 |
318.4 | 159 | 4,723 | (3,717 | ) | (314 | ) | 851 | ||||||||||||||||
| Net income/(loss) |
— | — | — | 21 | — | 21 | ||||||||||||||||||
| Other comprehensive income/(loss) |
— | — | — | — | (4 | ) | (4 | ) | ||||||||||||||||
| Stock-based compensation and other |
1.6 | 1 | (3 | ) | 2 | — | — | |||||||||||||||||
|
|
|
|
|
|
|
|
|
|
|
|
|
|||||||||||||
| November 2, 2019 |
320.0 | $ | 160 | $ | 4,720 | $ | (3,694 | ) | $ | (318 | ) | $ | 868 | |||||||||||
|
|
|
|
|
|
|
|
|
|
|
|
|
|||||||||||||
Note: The financial statements presented are internal monthly financial statements within a fiscal quarter, do not include certain quarterly adjustments and other important explanatory notes, and have not been audited or reviewed by any independent public accounting firm. Quarterly financial statements are subject to internal controls over financial reporting performed only with respect to quarterly financial statements. Consequently, these monthly financial statements may be subject to future reconciliation or adjustments to conform to generally accepted accounting principles or reporting requirements of the SEC and may not be representative of our financial position or indicative of future operating results or cash flows.
J. C. PENNEY COMPANY, INC.
(Debtor-in-Possession)
CONSOLIDATED STATEMENTS OF CASH FLOWS
(Unaudited)
| Month Ended | Nine Months Ended | |||||||||||||||
| (In millions) | October 31, 2020 | November 2, 2019 | October 31, 2020 | November 2, 2019 | ||||||||||||
| Cash flows from operating activities: |
||||||||||||||||
| Net income/(loss) |
$ | (156 | ) | $ | 21 | $ | (1,312 | ) | $ | (295 | ) | |||||
| Adjustments to reconcile net income/(loss) to net cash provided by/(used in) operating activities: |
||||||||||||||||
| Restructuring and management transition |
18 | — | 163 | 20 | ||||||||||||
| Reorganization items, net |
11 | — | 28 | — | ||||||||||||
| Net (gain)/loss on sale of non-operating assets |
— | — | — | (1 | ) | |||||||||||
| Net (gain)/loss on sale of operating assets |
— | — | — | 2 | ||||||||||||
| Discontinuance of hedge accounting |
— | — | 77 | — | ||||||||||||
| (Gain)/loss on extinguishment of debt |
— | — | — | (1 | ) | |||||||||||
| Depreciation and amortization |
46 | 41 | 462 | 415 | ||||||||||||
| Benefit plans |
10 | (3 | ) | 59 | (44 | ) | ||||||||||
| Stock-based compensation |
— | — | (2 | ) | 9 | |||||||||||
| Deferred taxes |
— | (6 | ) | (66 | ) | (5 | ) | |||||||||
| Change in cash from: |
||||||||||||||||
| Inventory |
(67 | ) | (145 | ) | 259 | (497 | ) | |||||||||
| Prepaid expenses and other assets |
(7 | ) | (27 | ) | (428 | ) | (109 | ) | ||||||||
| Merchandise accounts payable |
(26 | ) | (40 | ) | (42 | ) | 258 | |||||||||
| Income taxes |
— | 4 | — | 3 | ||||||||||||
| Accrued expenses and other |
5 | 31 | 4 | (61 | ) | |||||||||||
|
|
|
|
|
|
|
|
|
|||||||||
| Net cash provided by/(used in) operating activities |
(166 | ) | (124 | ) | (798 | ) | (306 | ) | ||||||||
|
|
|
|
|
|
|
|
|
|||||||||
| Cash flows from investing activities: |
||||||||||||||||
| Capital expenditures |
(2 | ) | (29 | ) | (59 | ) | (226 | ) | ||||||||
| Proceeds from sale of non-operating assets |
— | — | — | 1 | ||||||||||||
| Proceeds from sale of operating assets |
2 | — | 12 | 14 | ||||||||||||
| Insurance proceeds received for damage to property and equipment |
1 | — | 1 | — | ||||||||||||
|
|
|
|
|
|
|
|
|
|||||||||
| Net cash provided by/(used in) investing activities |
1 | (29 | ) | (46 | ) | (211 | ) | |||||||||
|
|
|
|
|
|
|
|
|
|||||||||
| Cash flows from financing activities: |
||||||||||||||||
| Proceeds from debtor-in-possession financing |
— | — | 450 | — | ||||||||||||
| Proceeds from borrowings under the credit facility |
8 | 552 | 2,735 | 1,827 | ||||||||||||
| Payments of borrowings under the credit facility |
— | (385 | ) | (1,471 | ) | (1,398 | ) | |||||||||
| Payments of finance leases and note payable |
— | (1 | ) | (1 | ) | (2 | ) | |||||||||
| Payments of long-term debt |
— | — | (19 | ) | (86 | ) | ||||||||||
|
Debtor-in-possession financing fees |
— | — | (50 | ) | — | |||||||||||
| Proceeds from stock issued under stock plans |
— | — | — | 1 | ||||||||||||
| Tax withholding payments for vested restricted stock |
— | (1 | ) | — | (1 | ) | ||||||||||
|
|
|
|
|
|
|
|
|
|||||||||
| Net cash provided by/(used in) financing activities |
8 | 165 | 1,644 | 341 | ||||||||||||
|
|
|
|
|
|
|
|
|
|||||||||
| Net increase/(decrease) in cash, cash equivalents and restricted cash |
(157 | ) | 12 | 800 | (176 | ) | ||||||||||
| Cash, cash equivalents and restricted cash at beginning of period |
1,343 | 145 | 386 | 333 | ||||||||||||
|
|
|
|
|
|
|
|
|
|||||||||
| Cash, cash equivalents and restricted cash at end of period |
$ | 1,186 | $ | 157 | $ | 1,186 | $ | 157 | ||||||||
|
|
|
|
|
|
|
|
|
|||||||||
Note: The financial statements presented are internal monthly financial statements within a fiscal quarter, do not include certain quarterly adjustments and other important explanatory notes, and have not been audited or reviewed by any independent public accounting firm. Quarterly financial statements are subject to internal controls over financial reporting performed only with respect to quarterly financial statements. Consequently, these monthly financial statements may be subject to future reconciliation or adjustments to conform to generally accepted accounting principles or reporting requirements of the SEC and may not be representative of our financial position or indicative of future operating results or cash flows.
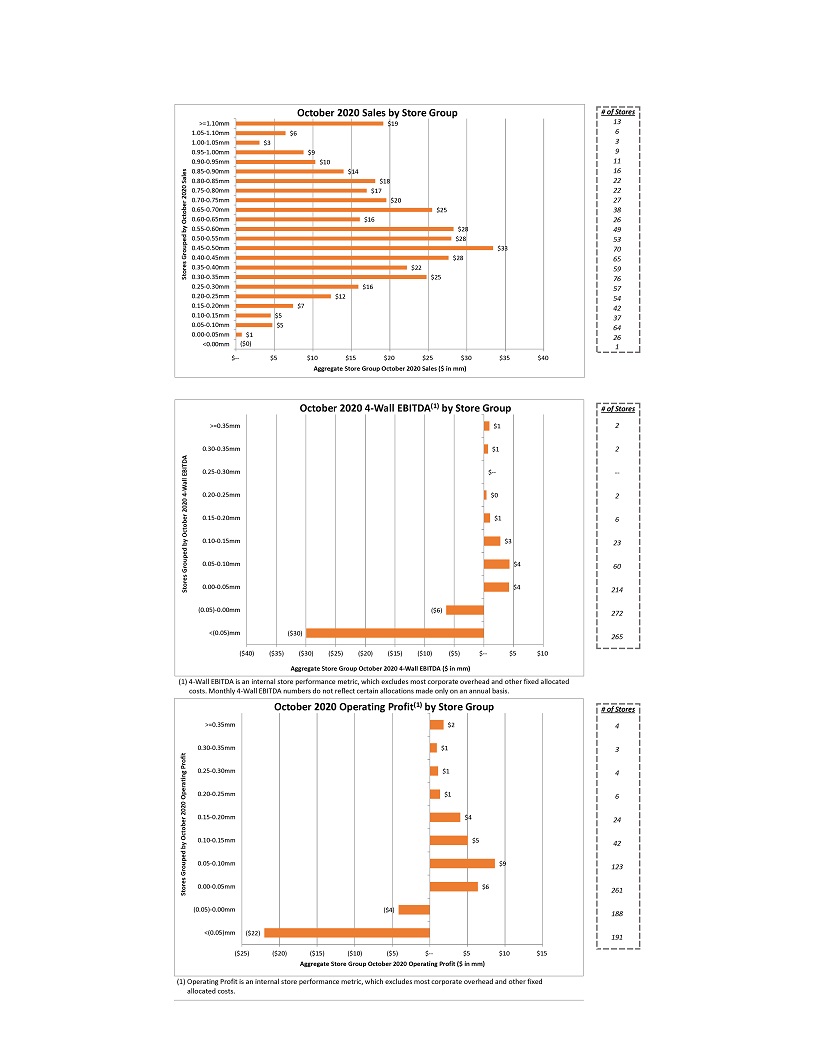
October 2020 Sales by Store Group # of Stores >=1.10mm $19 13 1.05-1.10mm $6 6 1.00-1.05mm $3 3 0.95-1.00mm $9 9 0.90-0.95mm $10 11 0.85-0.90mm $14 16 Sales 0.80-0.85mm $18 22 2020 0.75-0.80mm $17 22 0.70-0.75mm $20 27 0.65-0.70mm $25 38 October 0.60-0.65mm $16 26 by 0.55-0.60mm $28 49 0.50-0.55mm $28 53 Grouped 0.45-0.50mm $33 70 0.40-0.45mm $28 65 0.35-0.40mm $22 59 Stores 0.30-0.35mm $25 76 0.25-0.30mm $16 57 0.20-0.25mm $12 54 0.15-0.20mm $7 42 0.10-0.15mm $5 37 0.05-0.10mm $5 64 0.00-0.05mm $1 26 <0.00mm ($0) 1 $— $5 $10 $15 $20 $25 $30 $35 $40 Aggregate Store Group October 2020 Sales ($ in mm) October 2020 4-Wall EBITDA(1) by Store Group # of Stores >=0.35mm $1 2 0.30-0.35mm $1 2 EBITDA 0.25-0.30mm $-—- Wall 4—0.20-0.25mm $0 2 2020 0.15-0.20mm $1 October 6 by 0.10-0.15mm $3 23 Grouped 0.05-0.10mm $4 60 Stores 0.00-0.05mm $4 214 (0.05)-0.00mm ($6) 272 <(0.05)mm ($30) 265 ($40) ($35) ($30) ($25) ($20) ($15) ($10) ($5) $— $5 $10 Aggregate Store Group October 2020 4-Wall EBITDA ($ in mm) (1) 4-Wall EBITDA is an internal store performance metric, which excludes most corporate overhead and other fixed allocated costs. Monthly 4-Wall EBITDA numbers do not reflect certain allocations made only on an annual basis. October 2020 Operating Profit(1) by Store Group # of Stores >=0.35mm $2 4 0.30-0.35mm $1 3 Profit 0.25-0.30mm $1 4 Operating 0.20-0.25mm $1 6 2020 October 0.15-0.20mm $4 24 by 0.10-0.15mm $5 42 Grouped 0.05-0.10mm $9 123 Stores 0.00-0.05mm $6 261 (0.05)-0.00mm ($4) 188 <(0.05)mm ($22) 191 ($25) ($20) ($15) ($10) ($5) $— $5 $10 $15 Aggregate Store Group October 2020 Operating Profit ($ in mm) (1) Operating Profit is an internal store performance metric, which excludes most corporate overhead and other fixed allocated costs.
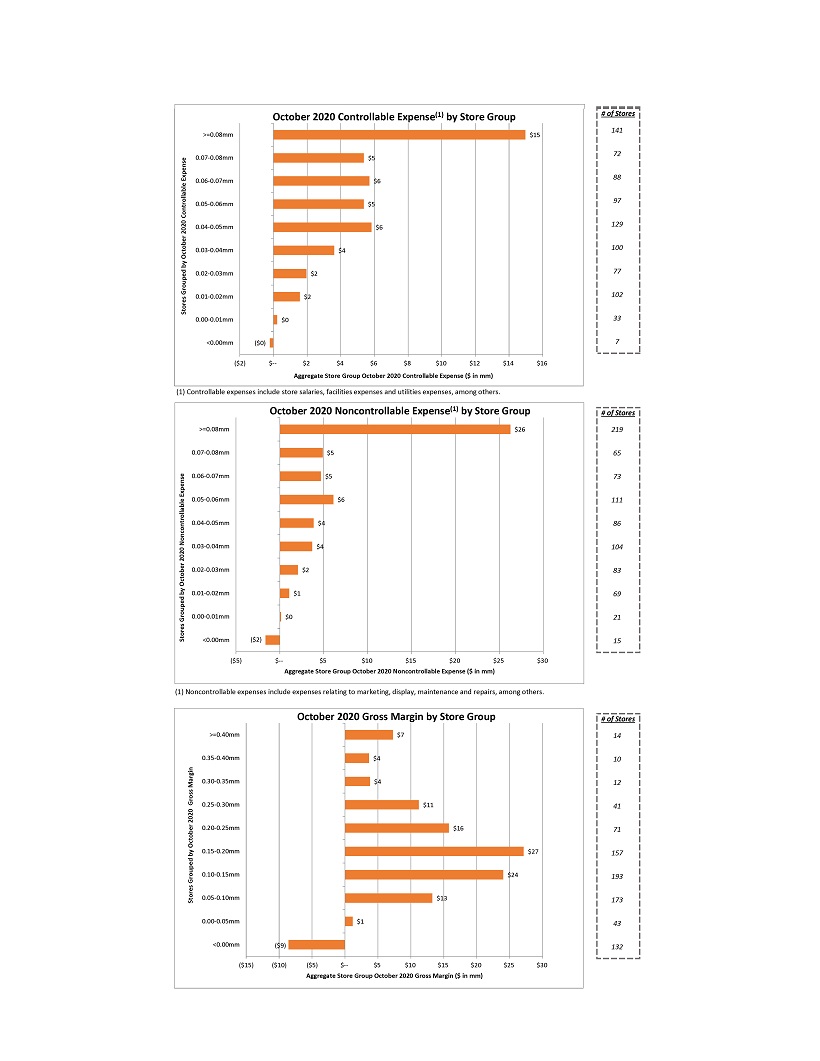
October 2020 Controllable Expense(1) by Store Group # of Stores 141 >=0.08mm $15 72 0.07-0.08mm $5 Expense 88 0.06-0.07mm $6 0.05-0.06mm 97 Controllable $5 129 2020 0.04-0.05mm $6 October 0.03-0.04mm $4 100 by Grouped 0.02-0.03mm $2 77 Stores 0.01-0.02mm $2 102 0.00-0.01mm $0 33 <0.00mm ($0) 7 ($2) $— $2 $4 $6 $8 $10 $12 $14 $16 Aggregate Store Group October 2020 Controllable Expense ($ in mm) (1) Controllable expenses include store salaries, facilities expenses and utilities expenses, among others. October 2020 Noncontrollable Expense(1) by Store Group # of Stores >=0.08mm $26 219 0.07-0.08mm $5 65 Expense 0.06-0.07mm $5 73 0.05-0.06mm $6 111 Noncontrollable 0.04-0.05mm $4 86 2020 0.03-0.04mm $4 104 October 0.02-0.03mm $2 83 by 0.01-0.02mm $1 69 Grouped 0.00-0.01mm $0 21 Stores <0.00mm ($2) 15 ($5) $— $5 $10 $15 $20 $25 $30 Aggregate Store Group October 2020 Noncontrollable Expense ($ in mm) (1)Noncontrollable expenses include expenses relating to marketing, display, maintenance and repairs, among others. October 2020 Gross Margin by Store Group # of Stores >=0.40mm $7 14 0.35-0.40mm $4 10 Margin 0.30-0.35mm $4 12 Gross 0.25-0.30mm $11 41 2020 October 0.20-0.25mm $16 71 by 0.15-0.20mm $27 157 Grouped 0.10-0.15mm $24 193 Stores 0.05-0.10mm $13 173 0.00-0.05mm $1 43 <0.00mm ($9) 132 ($15) ($10) ($5) $— $5 $10 $15 $20 $25 $30 Aggregate Store Group October 2020 Gross Margin ($ in mm)
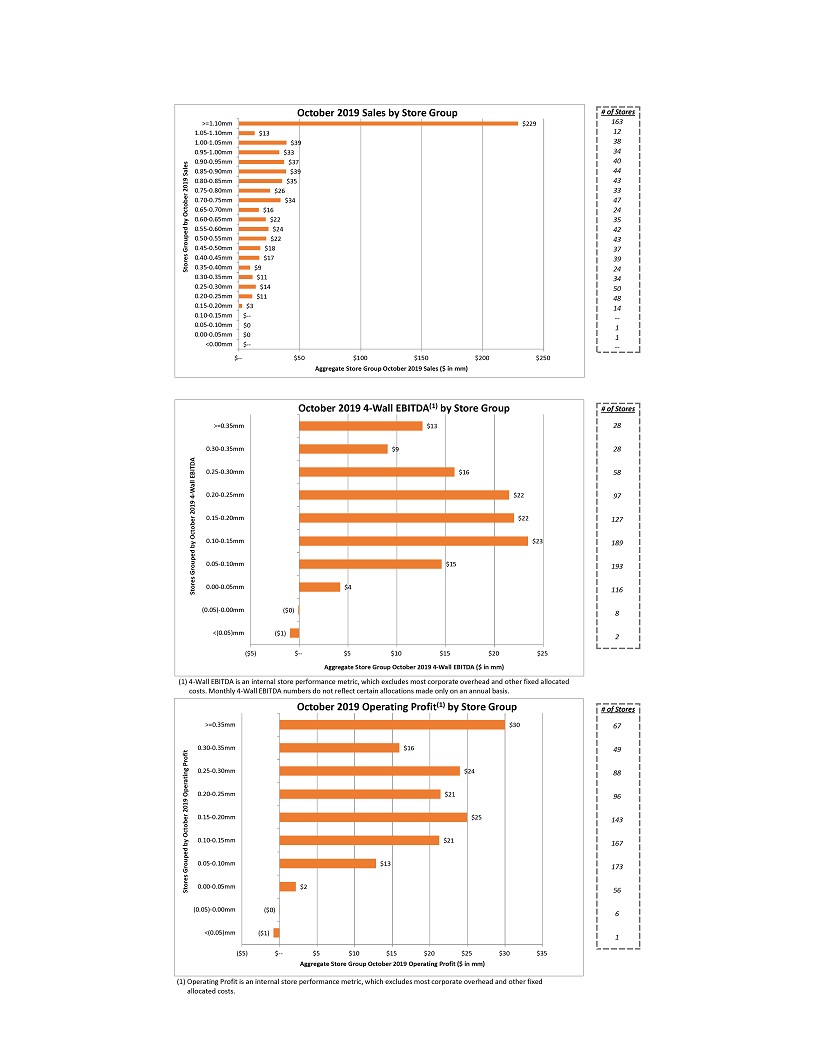
October 2019 Sales by Store Group # of Stores >=1.10mm $229 163 1.05-1.10mm $13 12 1.00-1.05mm $39 38 0.95-1.00mm $33 34 0.90-0.95mm $37 40 Sales 0.85-0.90mm $39 44 2019 0.80-0.85mm $35 43 0.75-0.80mm $26 33 0.70-0.75mm $34 47 October 0.65-0.70mm $16 24 by 0.60-0.65mm $22 35 0.55-0.60mm $24 42 0.50-0.55mm $22 43 Grouped 0.45-0.50mm $18 37 0.40-0.45mm $17 39 Stores 0.35-0.40mm $9 24 0.30-0.35mm $11 34 0.25-0.30mm $14 50 0.20-0.25mm $11 48 0.15-0.20mm $3 14 0.10-0.15mm $-—-0.05-0.10mm $0 1 0.00-0.05mm $0 1 <0.00mm $-—- $— $50 $100 $150 $200 $250 Aggregate Store Group October 2019 Sales ($ in mm) October 2019 4-Wall EBITDA(1) by Store Group # of Stores >=0.35mm $13 28 0.30-0.35mm $9 28 EBITDA 0.25-0.30mm $16 58 Wall —4 0.20-0.25mm $22 97 2019 October 0.15-0.20mm $22 127 by 0.10-0.15mm $23 189 Grouped 0.05-0.10mm $15 193 Stores 0.00-0.05mm $4 116 (0.05)-0.00mm ($0) 8 <(0.05)mm ($1) 2 ($5) $— $5 $10 $15 $20 $25 Aggregate Store Group October 2019 4-Wall EBITDA ($ in mm) (1) 4-Wall EBITDA is an internal store performance metric, which excludes most corporate overhead and other fixed allocated costs. Monthly 4-Wall EBITDA numbers do not reflect certain allocations made only on an annual basis. October 2019 Operating Profit(1) by Store Group # of Stores >=0.35mm $30 67 Profit 0.30-0.35mm $16 49 0.25-0.30mm $24 88 Operating 0.20-0.25mm $21 2019 96 0.15-0.20mm $25 October 143 0.10-0.15mm $21 by 167 Grouped 0.05-0.10mm $13 173 Stores 0.00-0.05mm $2 56 (0.05)-0.00mm ($0) 6 <(0.05)mm ($1) 1 ($5) $— $5 $10 $15 $20 $25 $30 $35 Aggregate Store Group October 2019 Operating Profit ($ in mm) (1) Operating Profit is an internal store performance metric, which excludes most corporate overhead and other fixed allocated costs.
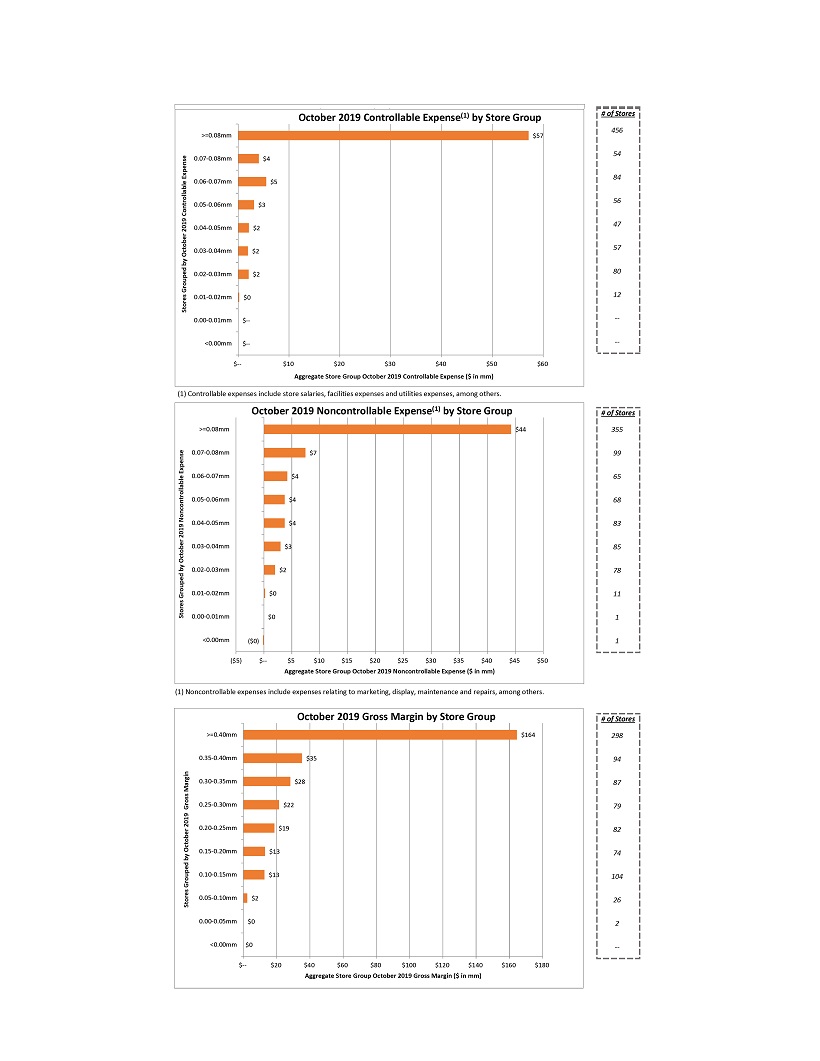
October 2019 Controllable Expense(1) by Store Group # of Stores 456 >=0.08mm $57 54 Expense 0.07-0.08mm $4 84 0.06-0.07mm $5 56 Controllable 0.05-0.06mm $3 47 2019 0.04-0.05mm $2 0.03-0.04mm 57 October $2 by 80 Grouped 0.02-0.03mm $2 Stores 0.01-0.02mm $0 12 0.00-0.01mm $-—- <0.00mm $-—- $— $10 $20 $30 $40 $50 $60 Aggregate Store Group October 2019 Controllable Expense ($ in mm) (1) Controllable expenses include store salaries, facilities expenses and utilities expenses, among others. October 2019 Noncontrollable Expense(1) by Store Group # of Stores >=0.08mm $44 355 Expense 0.07-0.08mm $7 99 0.06-0.07mm $4 65 Noncontrollable 0.05-0.06mm $4 68 2019 0.04-0.05mm $4 83 October 0.03-0.04mm $3 85 by 0.02-0.03mm $2 78 Grouped 0.01-0.02mm $0 11 Stores 0.00-0.01mm $0 1 <0.00mm ($0) 1 ($5) $— $5 $10 $15 $20 $25 $30 $35 $40 $45 $50 Aggregate Store Group October 2019 Noncontrollable Expense ($ in mm) (1)Noncontrollable expenses include expenses relating to marketing, display, maintenance and repairs, among others. October 2019 Gross Margin by Store Group # of Stores >=0.40mm $164 298 0.35-0.40mm $35 94 Margin 0.30-0.35mm $28 87 Gross 0.25-0.30mm $22 79 2019 October 0.20-0.25mm $19 82 by 0.15-0.20mm $13 74 Grouped 0.10-0.15mm $13 104 Stores 0.05-0.10mm $2 26 0.00-0.05mm $0 2 <0.00mm $0 — $— $20 $40 $60 $80 $100 $120 $140 $160 $180 Aggregate Store Group October 2019 Gross Margin ($ in mm)
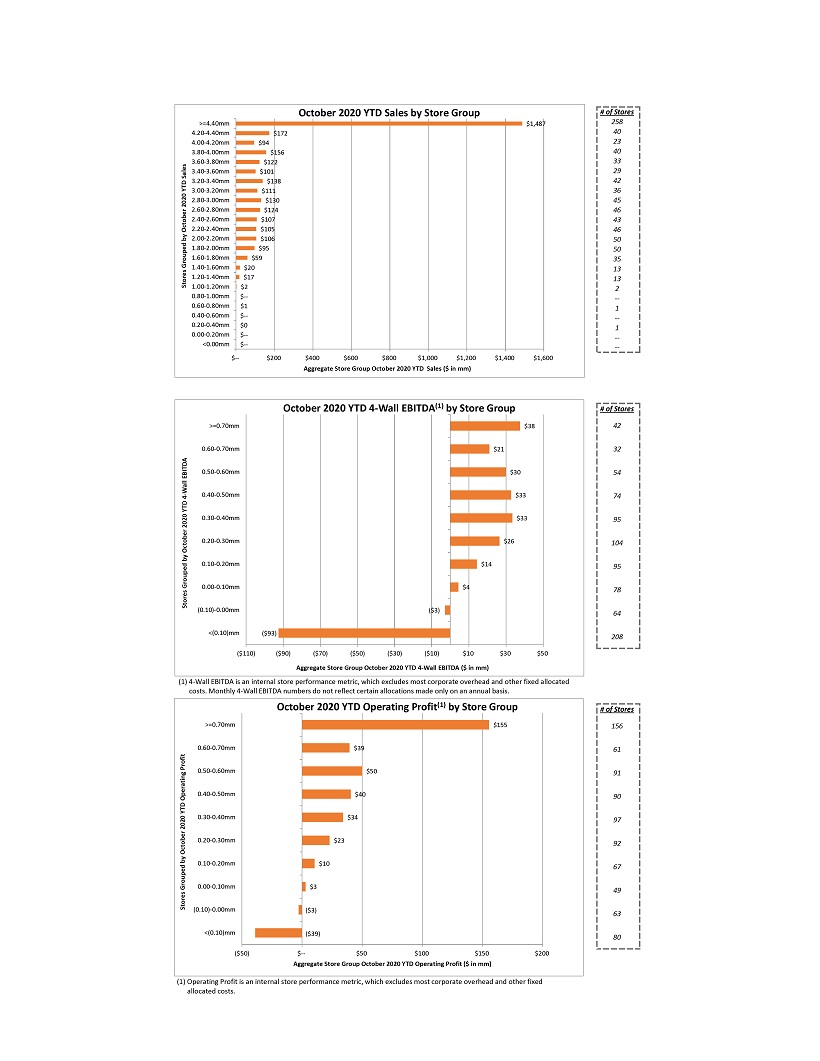
October 2020 YTD Sales by Store Group # of Stores >=4.40mm $1,487 258 4.20-4.40mm $172 40 4.00-4.20mm $94 23 3.80-4.00mm $156 40 3.60-3.80mm $122 33 Sales 3.40-3.60mm $101 29 YTD 3.20-3.40mm $138 42 3.00-3.20mm $111 36 2020 2.80-3.00mm $130 45 2.60-2.80mm $124 46 2.40-2.60mm $107 43 October 2.20-2.40mm $105 46 by 2.00-2.20mm $106 50 1.80-2.00mm $95 50 Grouped 1.60-1.80mm $59 35 1.40-1.60mm $20 13 Stores 1.20-1.40mm $17 13 1.00-1.20mm $2 2 0.80-1.00mm $-—-0.60-0.80mm $1 1 0.40-0.60mm $-—-0.20-0.40mm $0 1 0.00-0.20mm $-—-<0.00mm $-—- $— $200 $400 $600 $800 $1,000 $1,200 $1,400 $1,600 Aggregate Store Group October 2020 YTD Sales ($ in mm) October 2020 YTD 4-Wall EBITDA(1) by Store Group # of Stores >=0.70mm $38 42 0.60-0.70mm $21 32 EBITDA 0.50-0.60mm $30 54 Wall —4 0.40-0.50mm $33 74 YTD 0.30-0.40mm $33 2020 95 October 0.20-0.30mm $26 104 by Grouped 0.10-0.20mm $14 95 0.00-0.10mm $4 78 Stores (0.10)-0.00mm ($3) 64 <(0.10)mm ($93) 208 ($110) ($90) ($70) ($50) ($30) ($10) $10 $30 $50 Aggregate Store Group October 2020 YTD 4-Wall EBITDA ($ in mm) (1) 4-Wall EBITDA is an internal store performance metric, which excludes most corporate overhead and other fixed allocated costs. Monthly 4-Wall EBITDA numbers do not reflect certain allocations made only on an annual basis. October 2020 YTD Operating Profit(1) by Store Group # of Stores >=0.70mm $155 156 0.60-0.70mm $39 61 Profit 0.50-0.60mm $50 91 Operating 0.40-0.50mm $40 90 YTD 2020 0.30-0.40mm $34 97 October 0.20-0.30mm $23 92 by 0.10-0.20mm $10 67 Grouped 0.00-0.10mm $3 Stores 49 (0.10)-0.00mm ($3) 63 <(0.10)mm ($39) 80 ($50) $— $50 $100 $150 $200 Aggregate Store Group October 2020 YTD Operating Profit ($ in mm) (1) Operating Profit is an internal store performance metric, which excludes most corporate overhead and other fixed allocated costs.
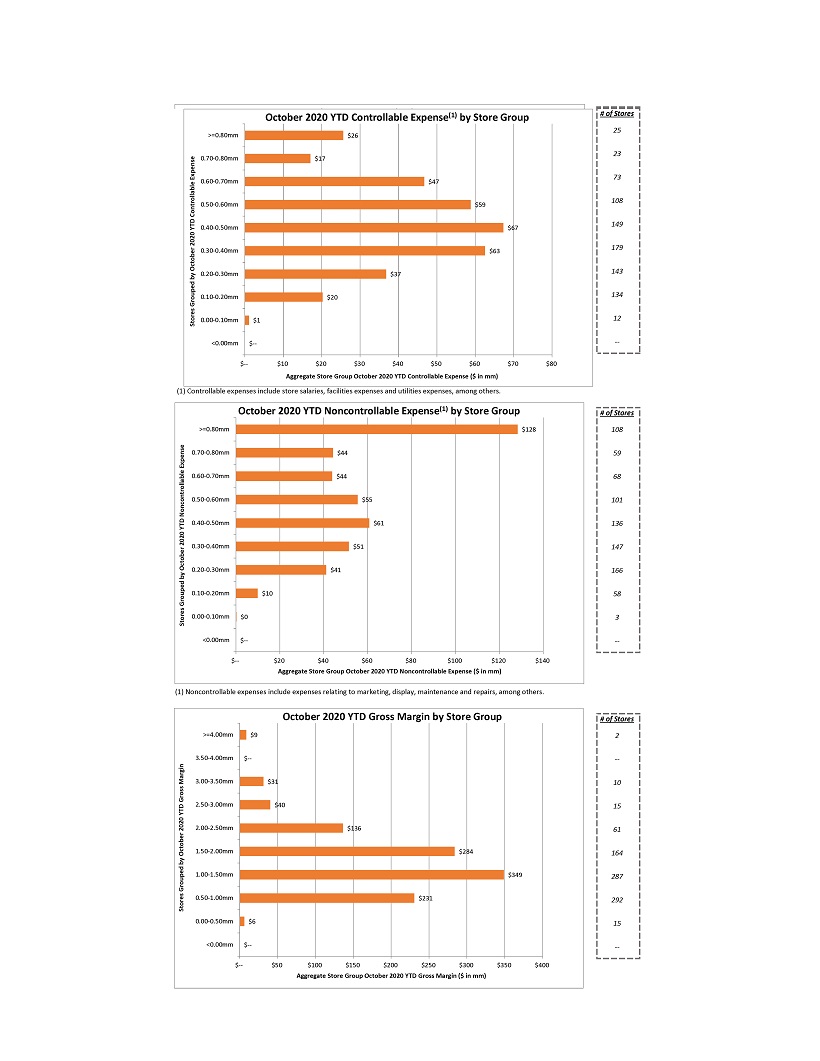
October 2020 YTD Controllable Expense(1) by Store Group # of Stores 25 >=0.80mm $26 23 0.70-0.80mm $17 Expense 73 0.60-0.70mm $47 108 Controllable 0.50-0.60mm $59 149 YTD 0.40-0.50mm $67 2020 October 0.30-0.40mm $63 179 by 0.20-0.30mm $37 143 Grouped 0.10-0.20mm $20 134 Stores 0.00-0.10mm $1 12 <0.00mm $-—- $— $10 $20 $30 $40 $50 $60 $70 $80 Aggregate Store Group October 2020 YTD Controllable Expense ($ in mm) (1) Controllable expenses include store salaries, facilities expenses and utilities expenses, among others. October 2020 YTD Noncontrollable Expense(1) by Store Group # of Stores >=0.80mm $128 108 Expense 0.70-0.80mm $44 59 0.60-0.70mm $44 68 Noncontrollable 0.50-0.60mm $55 101 YTD 0.40-0.50mm $61 136 2020 October 0.30-0.40mm $51 147 by 0.20-0.30mm $41 166 Grouped 0.10-0.20mm $10 58 Stores 0.00-0.10mm $0 3 <0.00mm $-—- $— $20 $40 $60 $80 $100 $120 $140 Aggregate Store Group October 2020 YTD Noncontrollable Expense ($ in mm) (1)Noncontrollable expenses include expenses relating to marketing, display, maintenance and repairs, among others. October 2020 YTD Gross Margin by Store Group # of Stores >=4.00mm $9 2 3.50-4.00mm $-—-Margin 3.00-3.50mm $31 10 Gross YTD 2.50-3.00mm $40 15 2020 2.00-2.50mm $136 61 October 1.50-2.00mm $284 164 by Grouped 1.00-1.50mm $349 287 0.50-1.00mm $231 Stores 292 0.00-0.50mm $6 15 <0.00mm $-—- $— $50 $100 $150 $200 $250 $300 $350 $400 Aggregate Store Group October 2020 YTD Gross Margin ($ in mm)
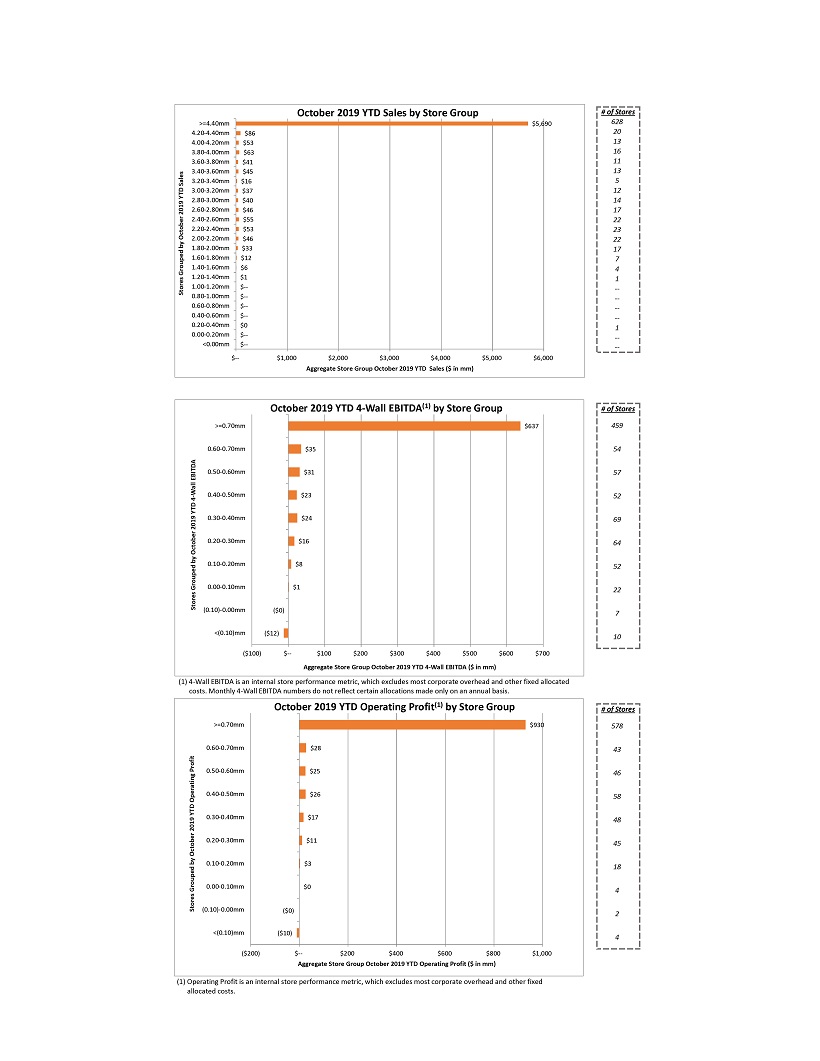
October 2019 YTD Sales by Store Group # of Stores >=4.40mm $5,690 628 4.20-4.40mm $86 20 4.00-4.20mm $53 13 3.80-4.00mm $63 16 3.60-3.80mm $41 11 3.40-3.60mm $45 13 Sales 3.20-3.40mm $16 5 YTD 3.00-3.20mm $37 12 2.80-3.00mm $40 14 2019 2.60-2.80mm $46 17 2.40-2.60mm $55 22 October 2.20-2.40mm $53 23 2.00-2.20mm $46 by 22 1.80-2.00mm $33 17 1.60-1.80mm $12 7 Grouped 1.40-1.60mm $6 4 1.20-1.40mm $1 1 Stores 1.00-1.20mm $-—-0.80-1.00mm $-—-0.60-0.80mm $-—-0.40-0.60mm $-—-0.20-0.40mm $0 1 0.00-0.20mm $-—-<0.00mm $-—- $— $1,000 $2,000 $3,000 $4,000 $5,000 $6,000 Aggregate Store Group October 2019 YTD Sales ($ in mm) October 2019 YTD 4-Wall EBITDA(1) by Store Group # of Stores >=0.70mm $637 459 0.60-0.70mm $35 54 EBITDA 0.50-0.60mm $31 57 Wall —4 0.40-0.50mm $23 52 YTD 2019 0.30-0.40mm $24 69 October 0.20-0.30mm $16 64 by 0.10-0.20mm $8 52 Grouped 0.00-0.10mm $1 Stores 22 (0.10)-0.00mm ($0) 7 <(0.10)mm ($12) 10 ($100) $— $100 $200 $300 $400 $500 $600 $700 Aggregate Store Group October 2019 YTD 4-Wall EBITDA ($ in mm) (1) 4-Wall EBITDA is an internal store performance metric, which excludes most corporate overhead and other fixed allocated costs. Monthly 4-Wall EBITDA numbers do not reflect certain allocations made only on an annual basis. October 2019 YTD Operating Profit(1) by Store Group # of Stores >=0.70mm $930 578 0.60-0.70mm $28 43 Profit 0.50-0.60mm $25 46 Operating 0.40-0.50mm $26 58 YTD 2019 0.30-0.40mm $17 48 October 0.20-0.30mm $11 45 by 0.10-0.20mm $3 18 Grouped 0.00-0.10mm $0 4 Stores (0.10)-0.00mm ($0) 2 <(0.10)mm ($10) 4 ($200) $— $200 $400 $600 $800 $1,000 Aggregate Store Group October 2019 YTD Operating Profit ($ in mm) (1) Operating Profit is an internal store performance metric, which excludes most corporate overhead and other fixed allocated costs.
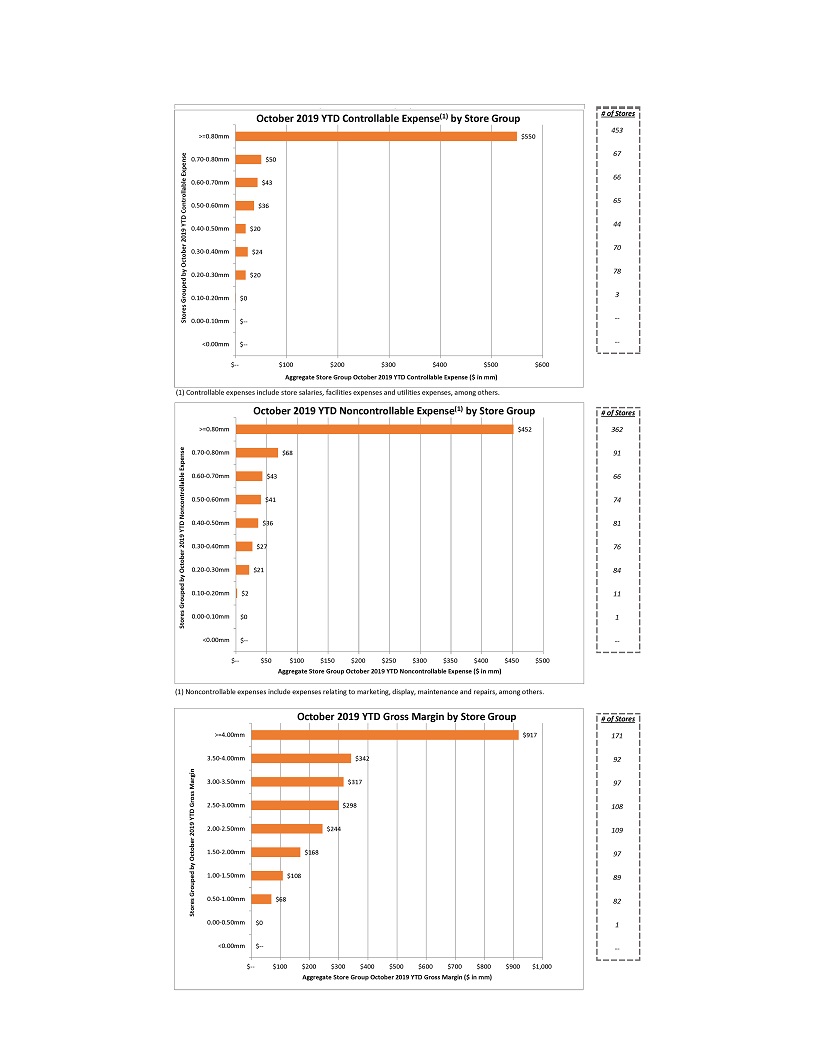
October 2019 YTD Controllable Expense(1) by Store Group # of Stores 453 >=0.80mm $550 67 Expense 0.70-0.80mm $50 0.60-0.70mm $43 66 65 Controllable 0.50-0.60mm $36 YTD 44 0.40-0.50mm $20 2019 70 October 0.30-0.40mm $24 by 78 0.20-0.30mm $20 0.10-0.20mm 3 Grouped $0 Stores 0.00-0.10mm $-—-<0.00mm $-—- $— $100 $200 $300 $400 $500 $600 Aggregate Store Group October 2019 YTD Controllable Expense ($ in mm) (1) Controllable expenses include store salaries, facilities expenses and utilities expenses, among others. October 2019 YTD Noncontrollable Expense(1) by Store Group # of Stores >=0.80mm $452 362 Expense 0.70-0.80mm $68 91 0.60-0.70mm $43 66 Noncontrollable 0.50-0.60mm $41 74 YTD 0.40-0.50mm $36 81 2019 0.30-0.40mm $27 76 October 0.20-0.30mm $21 84 by Grouped 0.10-0.20mm $2 11 Stores 0.00-0.10mm $0 1 <0.00mm $-—- $— $50 $100 $150 $200 $250 $300 $350 $400 $450 $500 Aggregate Store Group October 2019 YTD Noncontrollable Expense ($ in mm) (1)Noncontrollable expenses include expenses relating to marketing, display, maintenance and repairs, among others. October 2019 YTD Gross Margin by Store Group # of Stores >=4.00mm $917 171 3.50-4.00mm $342 92 Margin 3.00-3.50mm $317 97 Gross 2.50-3.00mm $298 108 YTD 2019 2.00-2.50mm $244 109 October 1.50-2.00mm $168 97 by 1.00-1.50mm $108 Grouped 89 Stores 0.50-1.00mm $68 82 0.00-0.50mm $0 1 <0.00mm $-—- $— $100 $200 $300 $400 $500 $600 $700 $800 $900 $1,000 Aggregate Store Group October 2019 YTD Gross Margin ($ in mm)