Attached files
| file | filename |
|---|---|
| EX-99.1 - EX-99.1 - i3 Verticals, Inc. | iiiv4q20earningsrelease.htm |
| 8-K - 8-K - i3 Verticals, Inc. | iiiv-20201119.htm |
Q4 Fiscal 2020 Supplemental Information
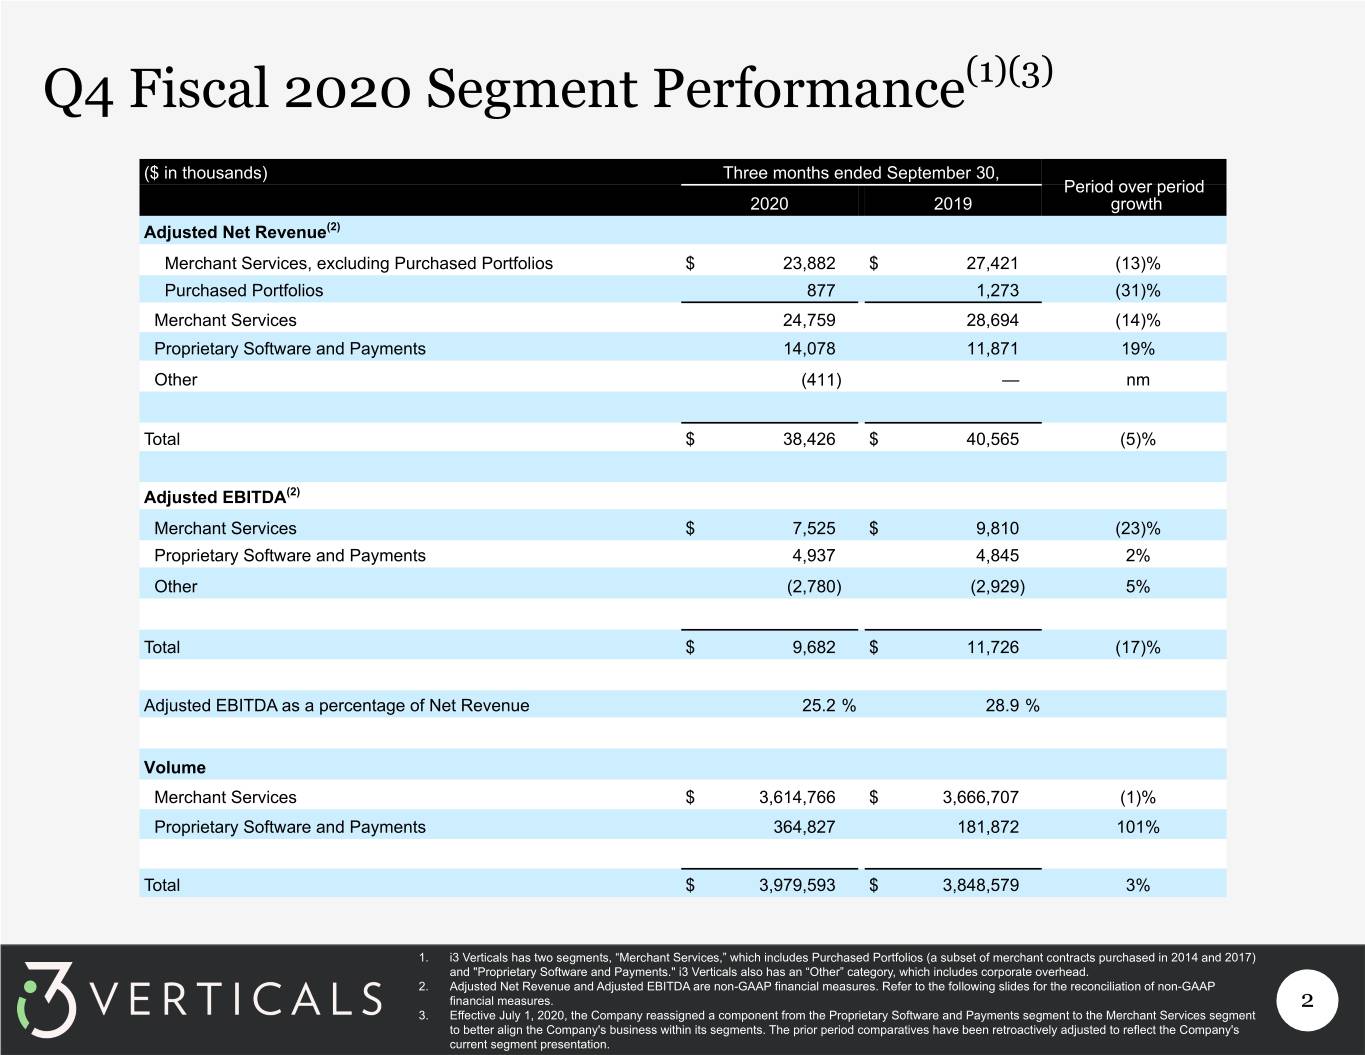
Q4 Fiscal 2020 Segment Performance(1)(3) ($ in thousands) Three months ended September 30, Period over period 2020 2019 growth Adjusted Net Revenue(2) Merchant Services, excluding Purchased Portfolios $ 23,882 $ 27,421 (13)% Purchased Portfolios 877 1,273 (31)% Merchant Services 24,759 28,694 (14)% Proprietary Software and Payments 14,078 11,871 19% Other (411) — nm Total $ 38,426 $ 40,565 (5)% Adjusted EBITDA(2) Merchant Services $ 7,525 $ 9,810 (23)% Proprietary Software and Payments 4,937 4,845 2% Other (2,780) (2,929) 5% Total $ 9,682 $ 11,726 (17)% Adjusted EBITDA as a percentage of Net Revenue 25.2 % 28.9 % Volume Merchant Services $ 3,614,766 $ 3,666,707 (1)% Proprietary Software and Payments 364,827 181,872 101% Total $ 3,979,593 $ 3,848,579 3% 1. i3 Verticals has two segments, “Merchant Services,” which includes Purchased Portfolios (a subset of merchant contracts purchased in 2014 and 2017) and "Proprietary Software and Payments." i3 Verticals also has an “Other” category, which includes corporate overhead. 2. Adjusted Net Revenue and Adjusted EBITDA are non-GAAP financial measures. Refer to the following slides for the reconciliation of non-GAAP financial measures. 2 3. Effective July 1, 2020, the Company reassigned a component from the Proprietary Software and Payments segment to the Merchant Services segment to better align the Company's business within its segments. The prior period comparatives have been retroactively adjusted to reflect the Company's current segment presentation.
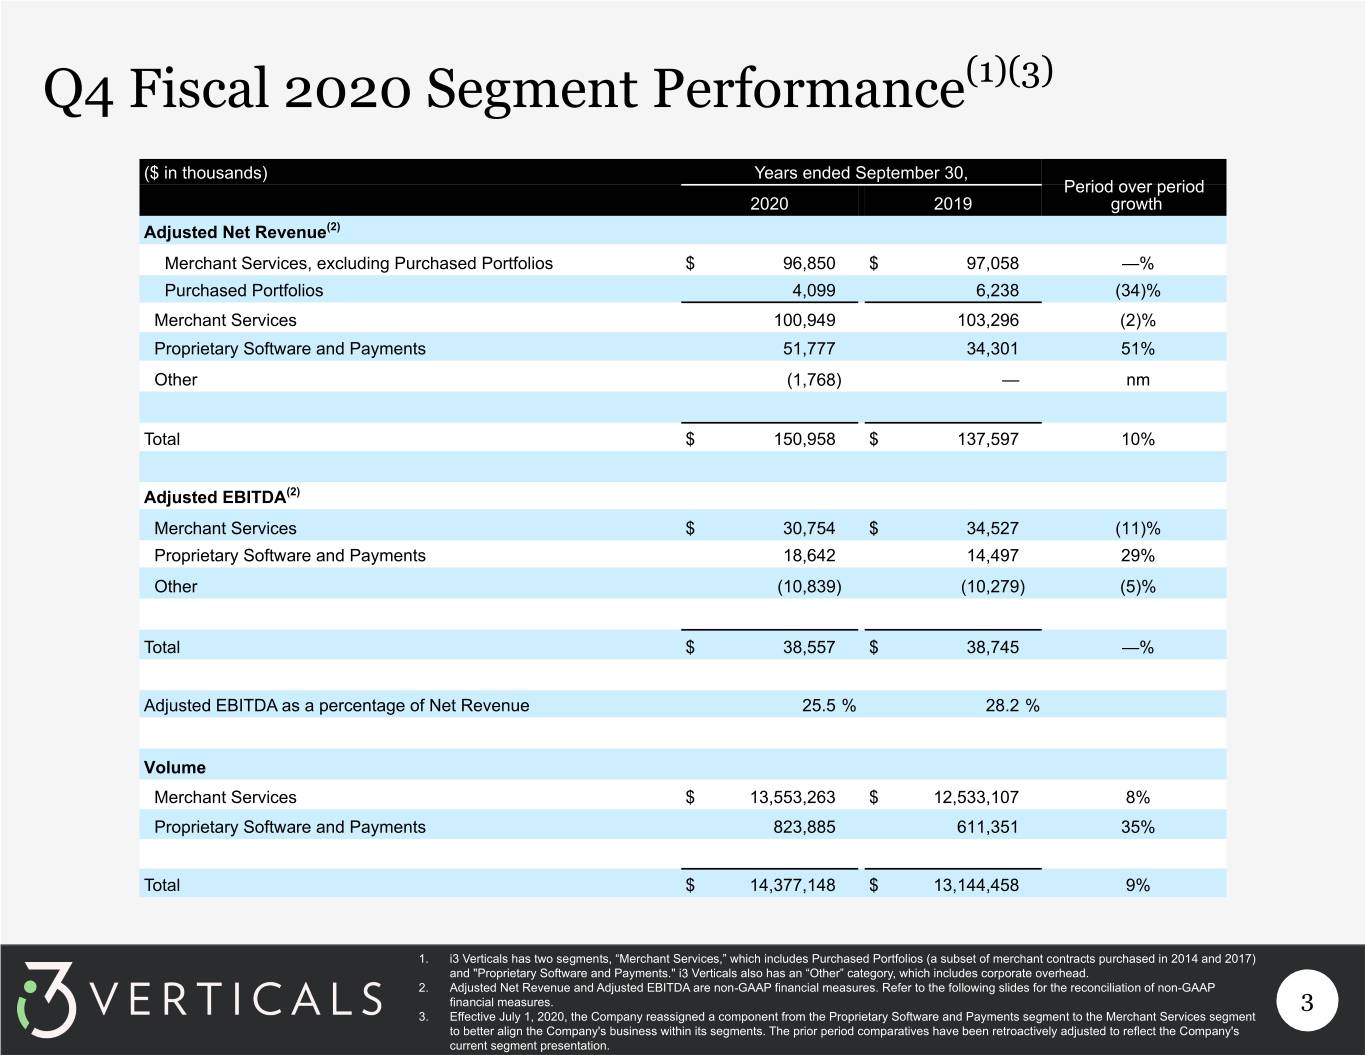
Q4 Fiscal 2020 Segment Performance(1)(3) ($ in thousands) Years ended September 30, Period over period 2020 2019 growth Adjusted Net Revenue(2) Merchant Services, excluding Purchased Portfolios $ 96,850 $ 97,058 —% Purchased Portfolios 4,099 6,238 (34)% Merchant Services 100,949 103,296 (2)% Proprietary Software and Payments 51,777 34,301 51% Other (1,768) — nm Total $ 150,958 $ 137,597 10% Adjusted EBITDA(2) Merchant Services $ 30,754 $ 34,527 (11)% Proprietary Software and Payments 18,642 14,497 29% Other (10,839) (10,279) (5)% Total $ 38,557 $ 38,745 —% Adjusted EBITDA as a percentage of Net Revenue 25.5 % 28.2 % Volume Merchant Services $ 13,553,263 $ 12,533,107 8% Proprietary Software and Payments 823,885 611,351 35% Total $ 14,377,148 $ 13,144,458 9% 1. i3 Verticals has two segments, “Merchant Services,” which includes Purchased Portfolios (a subset of merchant contracts purchased in 2014 and 2017) and "Proprietary Software and Payments." i3 Verticals also has an “Other” category, which includes corporate overhead. 2. Adjusted Net Revenue and Adjusted EBITDA are non-GAAP financial measures. Refer to the following slides for the reconciliation of non-GAAP financial measures. 3 3. Effective July 1, 2020, the Company reassigned a component from the Proprietary Software and Payments segment to the Merchant Services segment to better align the Company's business within its segments. The prior period comparatives have been retroactively adjusted to reflect the Company's current segment presentation.
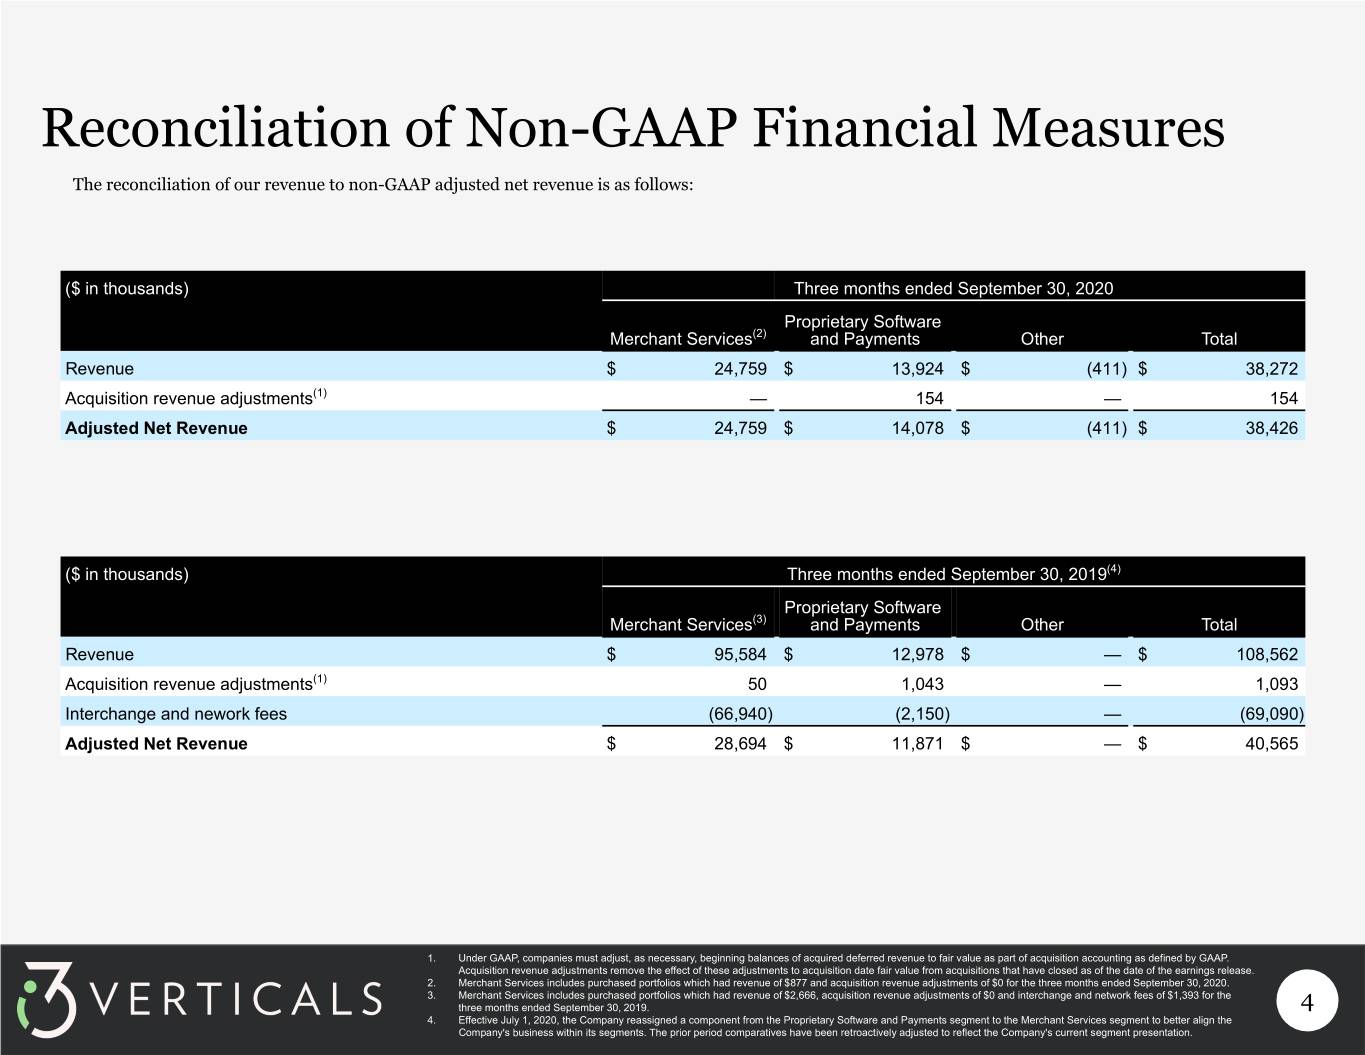
Reconciliation of Non-GAAP Financial Measures The reconciliation of our revenue to non-GAAP adjusted net revenue is as follows: ($ in thousands) Three months ended September 30, 2020 Proprietary Software Merchant Services(2) and Payments Other Total Revenue $ 24,759 $ 13,924 $ (411) $ 38,272 Acquisition revenue adjustments(1) — 154 — 154 Adjusted Net Revenue $ 24,759 $ 14,078 $ (411) $ 38,426 ($ in thousands) Three months ended September 30, 2019(4) Proprietary Software Merchant Services(3) and Payments Other Total Revenue $ 95,584 $ 12,978 $ — $ 108,562 Acquisition revenue adjustments(1) 50 1,043 — 1,093 Interchange and nework fees (66,940) (2,150) — (69,090) Adjusted Net Revenue $ 28,694 $ 11,871 $ — $ 40,565 1. Under GAAP, companies must adjust, as necessary, beginning balances of acquired deferred revenue to fair value as part of acquisition accounting as defined by GAAP. Acquisition revenue adjustments remove the effect of these adjustments to acquisition date fair value from acquisitions that have closed as of the date of the earnings release. 2. Merchant Services includes purchased portfolios which had revenue of $877 and acquisition revenue adjustments of $0 for the three months ended September 30, 2020. 3. Merchant Services includes purchased portfolios which had revenue of $2,666, acquisition revenue adjustments of $0 and interchange and network fees of $1,393 for the three months ended September 30, 2019. 4 4. Effective July 1, 2020, the Company reassigned a component from the Proprietary Software and Payments segment to the Merchant Services segment to better align the Company's business within its segments. The prior period comparatives have been retroactively adjusted to reflect the Company's current segment presentation.
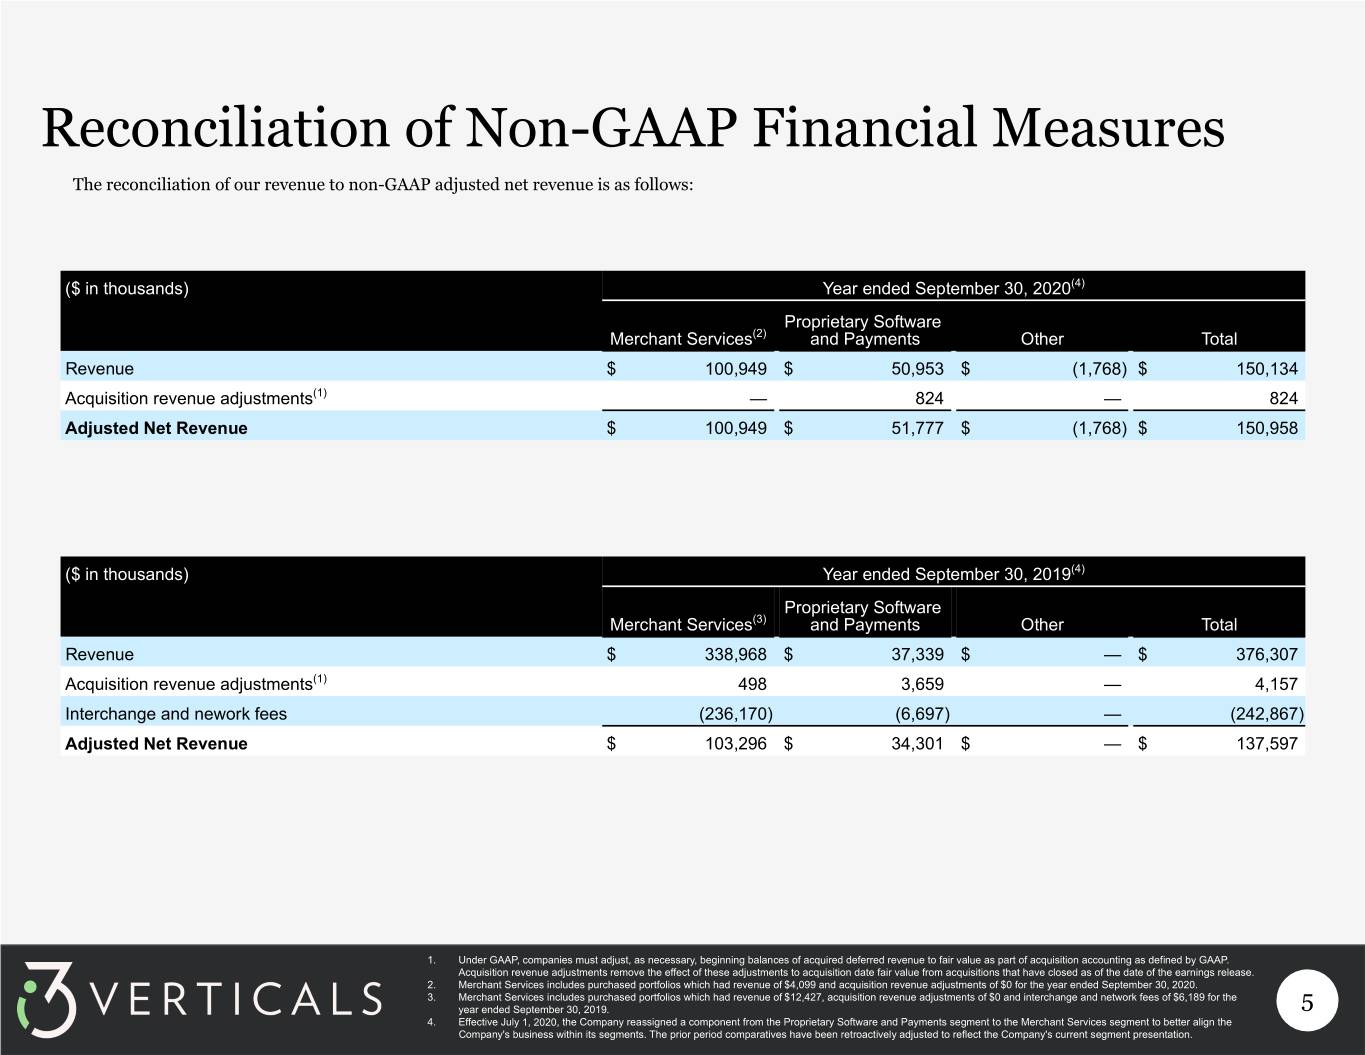
Reconciliation of Non-GAAP Financial Measures The reconciliation of our revenue to non-GAAP adjusted net revenue is as follows: ($ in thousands) Year ended September 30, 2020(4) Proprietary Software Merchant Services(2) and Payments Other Total Revenue $ 100,949 $ 50,953 $ (1,768) $ 150,134 Acquisition revenue adjustments(1) — 824 — 824 Adjusted Net Revenue $ 100,949 $ 51,777 $ (1,768) $ 150,958 ($ in thousands) Year ended September 30, 2019(4) Proprietary Software Merchant Services(3) and Payments Other Total Revenue $ 338,968 $ 37,339 $ — $ 376,307 Acquisition revenue adjustments(1) 498 3,659 — 4,157 Interchange and nework fees (236,170) (6,697) — (242,867) Adjusted Net Revenue $ 103,296 $ 34,301 $ — $ 137,597 1. Under GAAP, companies must adjust, as necessary, beginning balances of acquired deferred revenue to fair value as part of acquisition accounting as defined by GAAP. Acquisition revenue adjustments remove the effect of these adjustments to acquisition date fair value from acquisitions that have closed as of the date of the earnings release. 2. Merchant Services includes purchased portfolios which had revenue of $4,099 and acquisition revenue adjustments of $0 for the year ended September 30, 2020. 3. Merchant Services includes purchased portfolios which had revenue of $12,427, acquisition revenue adjustments of $0 and interchange and network fees of $6,189 for the year ended September 30, 2019. 5 4. Effective July 1, 2020, the Company reassigned a component from the Proprietary Software and Payments segment to the Merchant Services segment to better align the Company's business within its segments. The prior period comparatives have been retroactively adjusted to reflect the Company's current segment presentation.
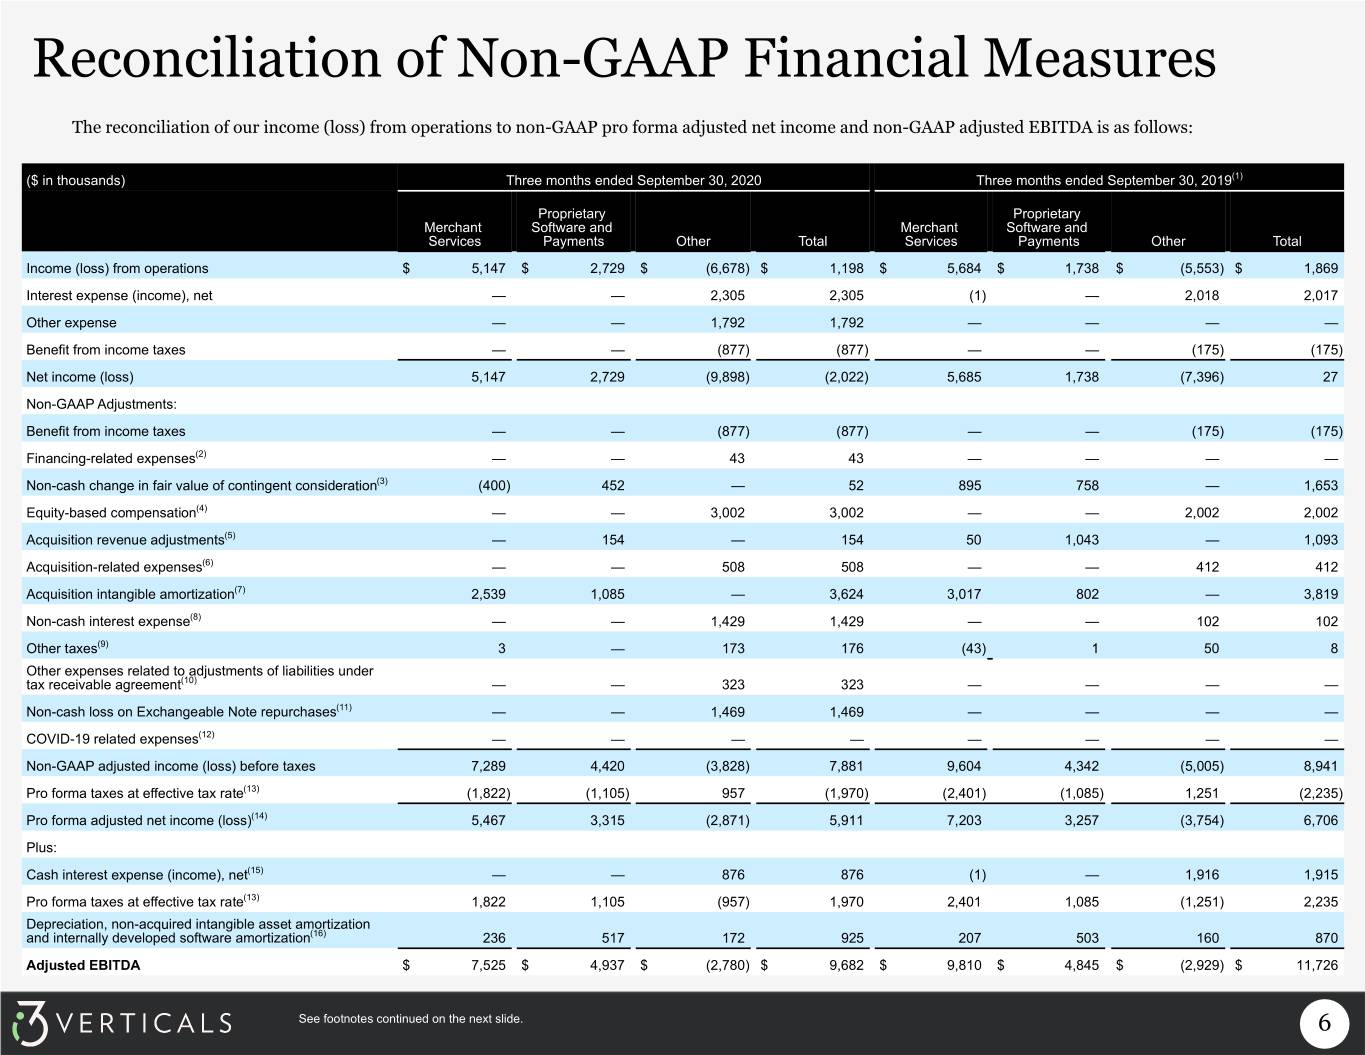
Reconciliation of Non-GAAP Financial Measures The reconciliation of our income (loss) from operations to non-GAAP pro forma adjusted net income and non-GAAP adjusted EBITDA is as follows: ($ in thousands) Three months ended September 30, 2020 Three months ended September 30, 2019(1) Proprietary Proprietary Merchant Software and Merchant Software and Services Payments Other Total Services Payments Other Total Income (loss) from operations $ 5,147 $ 2,729 $ (6,678) $ 1,198 $ 5,684 $ 1,738 $ (5,553) $ 1,869 Interest expense (income), net — — 2,305 2,305 (1) — 2,018 2,017 Other expense — — 1,792 1,792 — — — — Benefit from income taxes — — (877) (877) — — (175) (175) Net income (loss) 5,147 2,729 (9,898) (2,022) 5,685 1,738 (7,396) 27 Non-GAAP Adjustments: Benefit from income taxes — — (877) (877) — — (175) (175) Financing-related expenses(2) — — 43 43 — — — — Non-cash change in fair value of contingent consideration(3) (400) 452 — 52 895 758 — 1,653 Equity-based compensation(4) — — 3,002 3,002 — — 2,002 2,002 Acquisition revenue adjustments(5) — 154 — 154 50 1,043 — 1,093 Acquisition-related expenses(6) — — 508 508 — — 412 412 Acquisition intangible amortization(7) 2,539 1,085 — 3,624 3,017 802 — 3,819 Non-cash interest expense(8) — — 1,429 1,429 — — 102 102 Other taxes(9) 3 — 173 176 (43) 1 50 8 Other expenses related to adjustments of liabilities under tax receivable agreement(10) — — 323 323 — — — — Non-cash loss on Exchangeable Note repurchases(11) — — 1,469 1,469 — — — — COVID-19 related expenses(12) — — — — — — — — Non-GAAP adjusted income (loss) before taxes 7,289 4,420 (3,828) 7,881 9,604 4,342 (5,005) 8,941 Pro forma taxes at effective tax rate(13) (1,822) (1,105) 957 (1,970) (2,401) (1,085) 1,251 (2,235) Pro forma adjusted net income (loss)(14) 5,467 3,315 (2,871) 5,911 7,203 3,257 (3,754) 6,706 Plus: Cash interest expense (income), net(15) — — 876 876 (1) — 1,916 1,915 Pro forma taxes at effective tax rate(13) 1,822 1,105 (957) 1,970 2,401 1,085 (1,251) 2,235 Depreciation, non-acquired intangible asset amortization and internally developed software amortization(16) 236 517 172 925 207 503 160 870 Adjusted EBITDA $ 7,525 $ 4,937 $ (2,780) $ 9,682 $ 9,810 $ 4,845 $ (2,929) $ 11,726 See footnotes continued on the next slide. 6
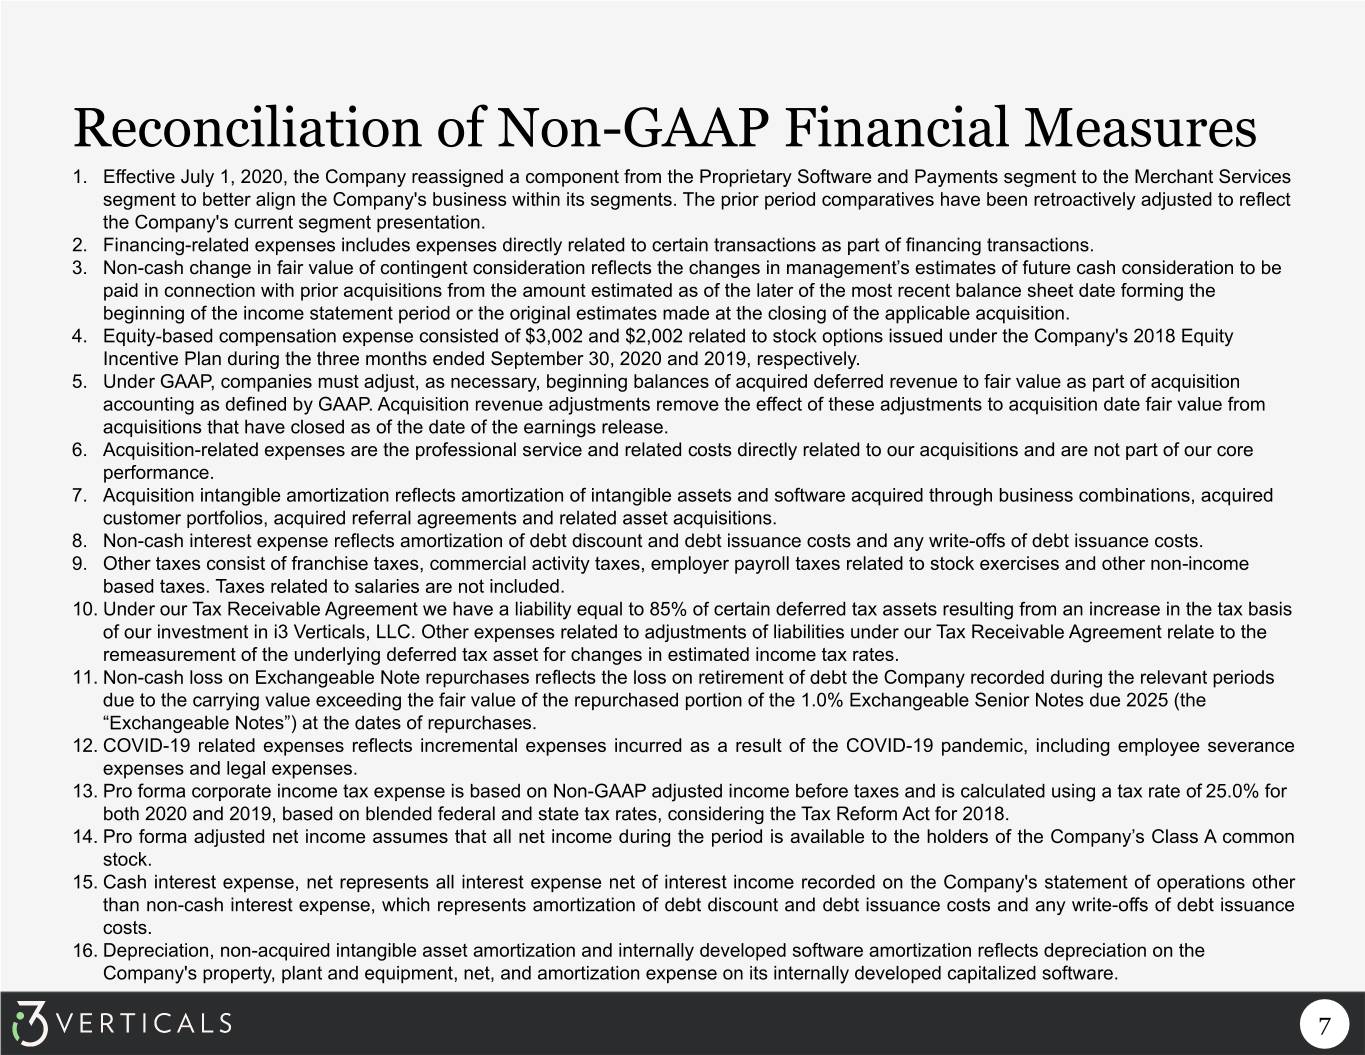
Reconciliation of Non-GAAP Financial Measures 1. Effective July 1, 2020, the Company reassigned a component from the Proprietary Software and Payments segment to the Merchant Services segment to better align the Company's business within its segments. The prior period comparatives have been retroactively adjusted to reflect the Company's current segment presentation. 2. Financing-related expenses includes expenses directly related to certain transactions as part of financing transactions. 3. Non-cash change in fair value of contingent consideration reflects the changes in management’s estimates of future cash consideration to be paid in connection with prior acquisitions from the amount estimated as of the later of the most recent balance sheet date forming the beginning of the income statement period or the original estimates made at the closing of the applicable acquisition. 4. Equity-based compensation expense consisted of $3,002 and $2,002 related to stock options issued under the Company's 2018 Equity Incentive Plan during the three months ended September 30, 2020 and 2019, respectively. 5. Under GAAP, companies must adjust, as necessary, beginning balances of acquired deferred revenue to fair value as part of acquisition accounting as defined by GAAP. Acquisition revenue adjustments remove the effect of these adjustments to acquisition date fair value from acquisitions that have closed as of the date of the earnings release. 6. Acquisition-related expenses are the professional service and related costs directly related to our acquisitions and are not part of our core performance. 7. Acquisition intangible amortization reflects amortization of intangible assets and software acquired through business combinations, acquired customer portfolios, acquired referral agreements and related asset acquisitions. 8. Non-cash interest expense reflects amortization of debt discount and debt issuance costs and any write-offs of debt issuance costs. 9. Other taxes consist of franchise taxes, commercial activity taxes, employer payroll taxes related to stock exercises and other non-income based taxes. Taxes related to salaries are not included. 10. Under our Tax Receivable Agreement we have a liability equal to 85% of certain deferred tax assets resulting from an increase in the tax basis of our investment in i3 Verticals, LLC. Other expenses related to adjustments of liabilities under our Tax Receivable Agreement relate to the remeasurement of the underlying deferred tax asset for changes in estimated income tax rates. 11. Non-cash loss on Exchangeable Note repurchases reflects the loss on retirement of debt the Company recorded during the relevant periods due to the carrying value exceeding the fair value of the repurchased portion of the 1.0% Exchangeable Senior Notes due 2025 (the “Exchangeable Notes”) at the dates of repurchases. 12. COVID-19 related expenses reflects incremental expenses incurred as a result of the COVID-19 pandemic, including employee severance expenses and legal expenses. 13. Pro forma corporate income tax expense is based on Non-GAAP adjusted income before taxes and is calculated using a tax rate of 25.0% for both 2020 and 2019, based on blended federal and state tax rates, considering the Tax Reform Act for 2018. 14. Pro forma adjusted net income assumes that all net income during the period is available to the holders of the Company’s Class A common stock. 15. Cash interest expense, net represents all interest expense net of interest income recorded on the Company's statement of operations other than non-cash interest expense, which represents amortization of debt discount and debt issuance costs and any write-offs of debt issuance costs. 16. Depreciation, non-acquired intangible asset amortization and internally developed software amortization reflects depreciation on the Company's property, plant and equipment, net, and amortization expense on its internally developed capitalized software. 7
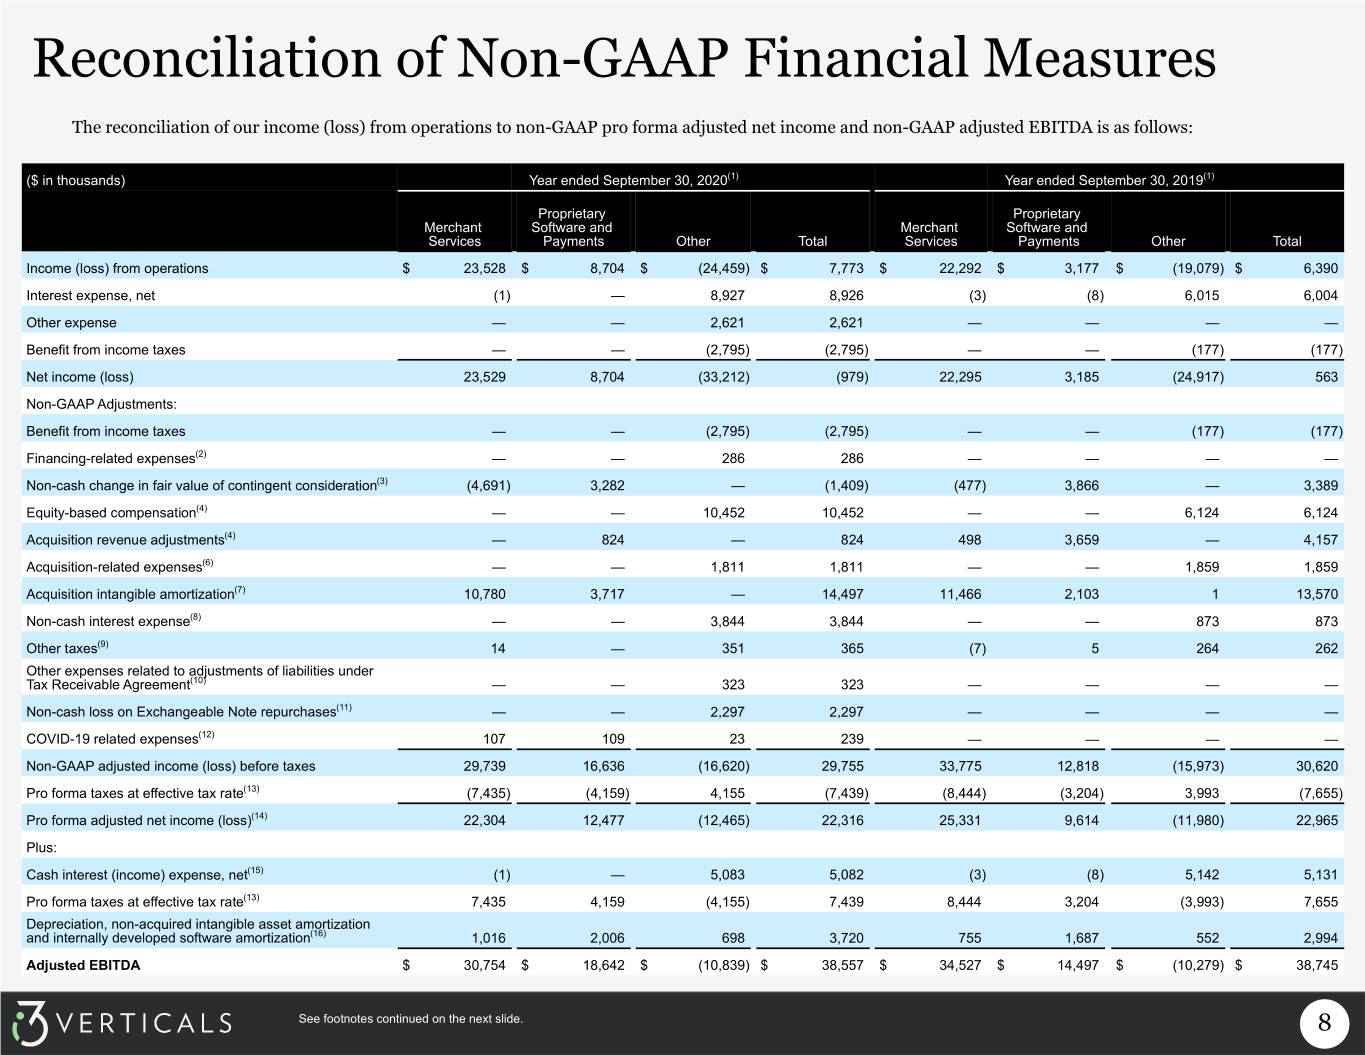
Reconciliation of Non-GAAP Financial Measures The reconciliation of our income (loss) from operations to non-GAAP pro forma adjusted net income and non-GAAP adjusted EBITDA is as follows: ($ in thousands) Year ended September 30, 2020(1) Year ended September 30, 2019(1) Proprietary Proprietary Merchant Software and Merchant Software and Services Payments Other Total Services Payments Other Total Income (loss) from operations $ 23,528 $ 8,704 $ (24,459) $ 7,773 $ 22,292 $ 3,177 $ (19,079) $ 6,390 Interest expense, net (1) — 8,927 8,926 (3) (8) 6,015 6,004 Other expense — — 2,621 2,621 — — — — Benefit from income taxes — — (2,795) (2,795) — — (177) (177) Net income (loss) 23,529 8,704 (33,212) (979) 22,295 3,185 (24,917) 563 Non-GAAP Adjustments: Benefit from income taxes — — (2,795) (2,795) — — (177) (177) Financing-related expenses(2) — — 286 286 — — — — Non-cash change in fair value of contingent consideration(3) (4,691) 3,282 — (1,409) (477) 3,866 — 3,389 Equity-based compensation(4) — — 10,452 10,452 — — 6,124 6,124 Acquisition revenue adjustments(4) — 824 — 824 498 3,659 — 4,157 Acquisition-related expenses(6) — — 1,811 1,811 — — 1,859 1,859 Acquisition intangible amortization(7) 10,780 3,717 — 14,497 11,466 2,103 1 13,570 Non-cash interest expense(8) — — 3,844 3,844 — — 873 873 Other taxes(9) 14 — 351 365 (7) 5 264 262 Other expenses related to adjustments of liabilities under Tax Receivable Agreement(10) — — 323 323 — — — — Non-cash loss on Exchangeable Note repurchases(11) — — 2,297 2,297 — — — — COVID-19 related expenses(12) 107 109 23 239 — — — — Non-GAAP adjusted income (loss) before taxes 29,739 16,636 (16,620) 29,755 33,775 12,818 (15,973) 30,620 Pro forma taxes at effective tax rate(13) (7,435) (4,159) 4,155 (7,439) (8,444) (3,204) 3,993 (7,655) Pro forma adjusted net income (loss)(14) 22,304 12,477 (12,465) 22,316 25,331 9,614 (11,980) 22,965 Plus: Cash interest (income) expense, net(15) (1) — 5,083 5,082 (3) (8) 5,142 5,131 Pro forma taxes at effective tax rate(13) 7,435 4,159 (4,155) 7,439 8,444 3,204 (3,993) 7,655 Depreciation, non-acquired intangible asset amortization and internally developed software amortization(16) 1,016 2,006 698 3,720 755 1,687 552 2,994 Adjusted EBITDA $ 30,754 $ 18,642 $ (10,839) $ 38,557 $ 34,527 $ 14,497 $ (10,279) $ 38,745 See footnotes continued on the next slide. 8
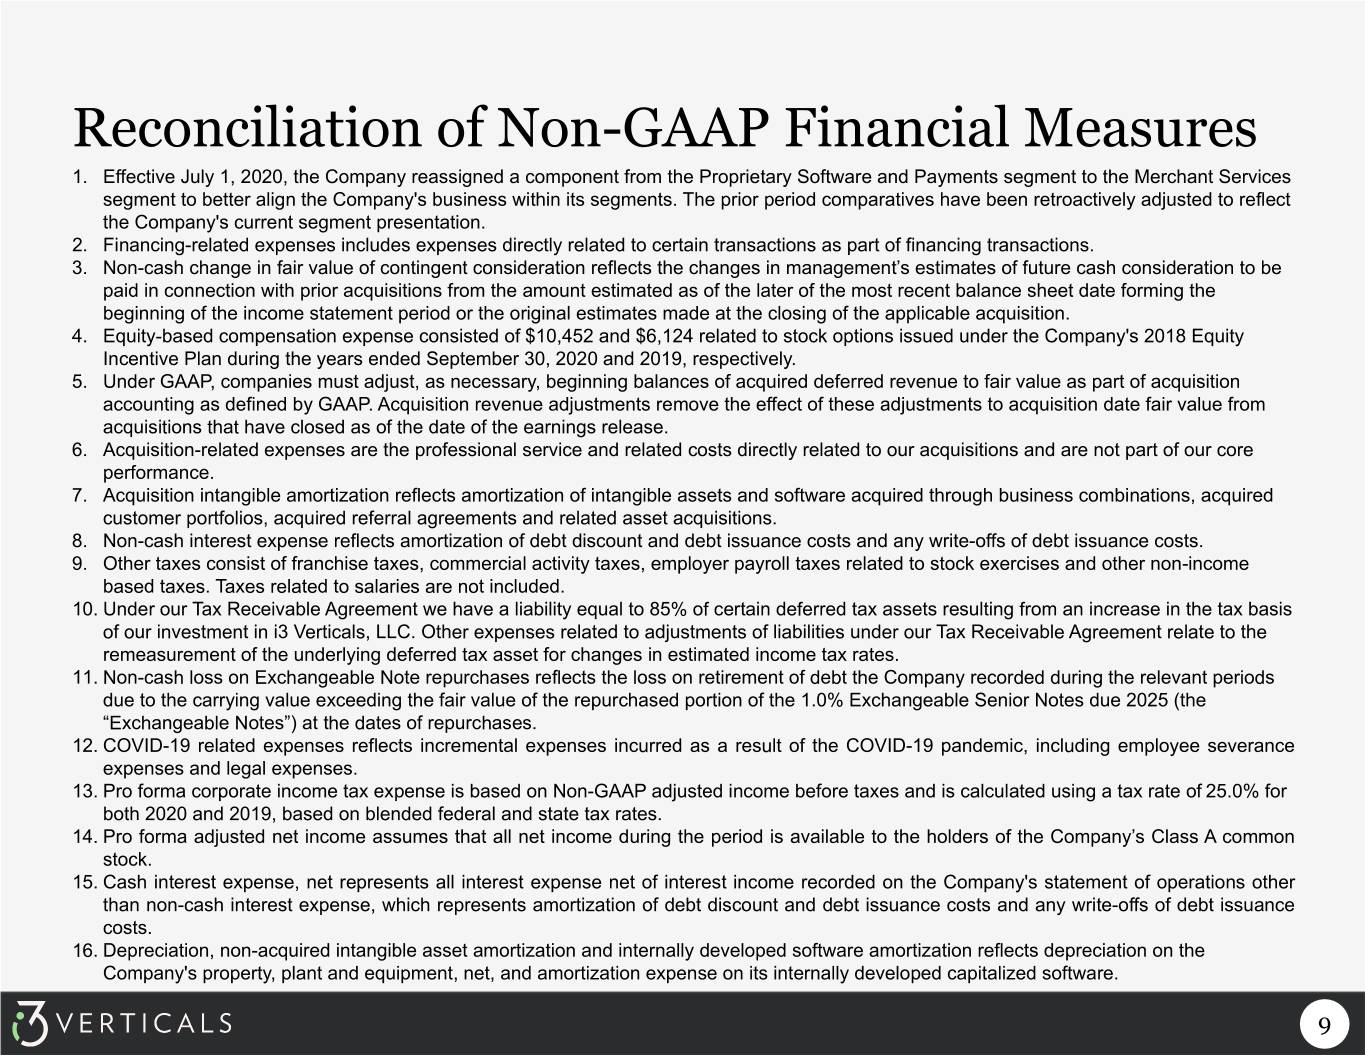
Reconciliation of Non-GAAP Financial Measures 1. Effective July 1, 2020, the Company reassigned a component from the Proprietary Software and Payments segment to the Merchant Services segment to better align the Company's business within its segments. The prior period comparatives have been retroactively adjusted to reflect the Company's current segment presentation. 2. Financing-related expenses includes expenses directly related to certain transactions as part of financing transactions. 3. Non-cash change in fair value of contingent consideration reflects the changes in management’s estimates of future cash consideration to be paid in connection with prior acquisitions from the amount estimated as of the later of the most recent balance sheet date forming the beginning of the income statement period or the original estimates made at the closing of the applicable acquisition. 4. Equity-based compensation expense consisted of $10,452 and $6,124 related to stock options issued under the Company's 2018 Equity Incentive Plan during the years ended September 30, 2020 and 2019, respectively. 5. Under GAAP, companies must adjust, as necessary, beginning balances of acquired deferred revenue to fair value as part of acquisition accounting as defined by GAAP. Acquisition revenue adjustments remove the effect of these adjustments to acquisition date fair value from acquisitions that have closed as of the date of the earnings release. 6. Acquisition-related expenses are the professional service and related costs directly related to our acquisitions and are not part of our core performance. 7. Acquisition intangible amortization reflects amortization of intangible assets and software acquired through business combinations, acquired customer portfolios, acquired referral agreements and related asset acquisitions. 8. Non-cash interest expense reflects amortization of debt discount and debt issuance costs and any write-offs of debt issuance costs. 9. Other taxes consist of franchise taxes, commercial activity taxes, employer payroll taxes related to stock exercises and other non-income based taxes. Taxes related to salaries are not included. 10. Under our Tax Receivable Agreement we have a liability equal to 85% of certain deferred tax assets resulting from an increase in the tax basis of our investment in i3 Verticals, LLC. Other expenses related to adjustments of liabilities under our Tax Receivable Agreement relate to the remeasurement of the underlying deferred tax asset for changes in estimated income tax rates. 11. Non-cash loss on Exchangeable Note repurchases reflects the loss on retirement of debt the Company recorded during the relevant periods due to the carrying value exceeding the fair value of the repurchased portion of the 1.0% Exchangeable Senior Notes due 2025 (the “Exchangeable Notes”) at the dates of repurchases. 12. COVID-19 related expenses reflects incremental expenses incurred as a result of the COVID-19 pandemic, including employee severance expenses and legal expenses. 13. Pro forma corporate income tax expense is based on Non-GAAP adjusted income before taxes and is calculated using a tax rate of 25.0% for both 2020 and 2019, based on blended federal and state tax rates. 14. Pro forma adjusted net income assumes that all net income during the period is available to the holders of the Company’s Class A common stock. 15. Cash interest expense, net represents all interest expense net of interest income recorded on the Company's statement of operations other than non-cash interest expense, which represents amortization of debt discount and debt issuance costs and any write-offs of debt issuance costs. 16. Depreciation, non-acquired intangible asset amortization and internally developed software amortization reflects depreciation on the Company's property, plant and equipment, net, and amortization expense on its internally developed capitalized software. 9
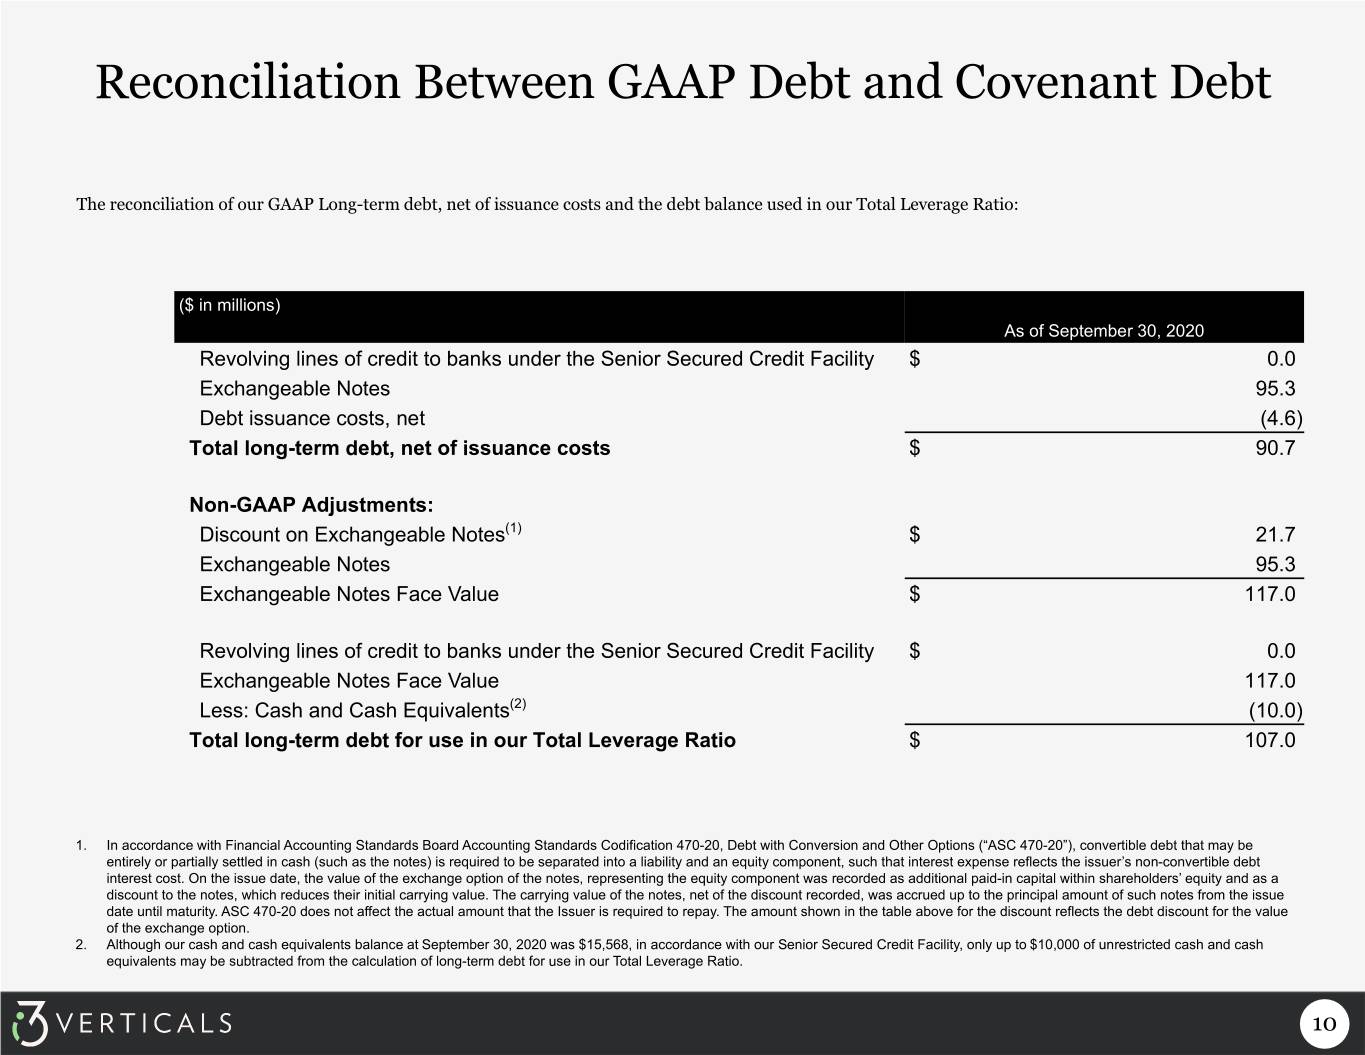
Reconciliation Between GAAP Debt and Covenant Debt The reconciliation of our GAAP Long-term debt, net of issuance costs and the debt balance used in our Total Leverage Ratio: ($ in millions) As of September 30, 2020 Revolving lines of credit to banks under the Senior Secured Credit Facility $ 0.0 Exchangeable Notes 95.3 Debt issuance costs, net (4.6) Total long-term debt, net of issuance costs $ 90.7 Non-GAAP Adjustments: Discount on Exchangeable Notes(1) $ 21.7 Exchangeable Notes 95.3 Exchangeable Notes Face Value $ 117.0 Revolving lines of credit to banks under the Senior Secured Credit Facility $ 0.0 Exchangeable Notes Face Value 117.0 Less: Cash and Cash Equivalents(2) (10.0) Total long-term debt for use in our Total Leverage Ratio $ 107.0 1. In accordance with Financial Accounting Standards Board Accounting Standards Codification 470-20, Debt with Conversion and Other Options (“ASC 470-20”), convertible debt that may be entirely or partially settled in cash (such as the notes) is required to be separated into a liability and an equity component, such that interest expense reflects the issuer’s non-convertible debt interest cost. On the issue date, the value of the exchange option of the notes, representing the equity component was recorded as additional paid-in capital within shareholders’ equity and as a discount to the notes, which reduces their initial carrying value. The carrying value of the notes, net of the discount recorded, was accrued up to the principal amount of such notes from the issue date until maturity. ASC 470-20 does not affect the actual amount that the Issuer is required to repay. The amount shown in the table above for the discount reflects the debt discount for the value of the exchange option. 2. Although our cash and cash equivalents balance at September 30, 2020 was $15,568, in accordance with our Senior Secured Credit Facility, only up to $10,000 of unrestricted cash and cash equivalents may be subtracted from the calculation of long-term debt for use in our Total Leverage Ratio. 10
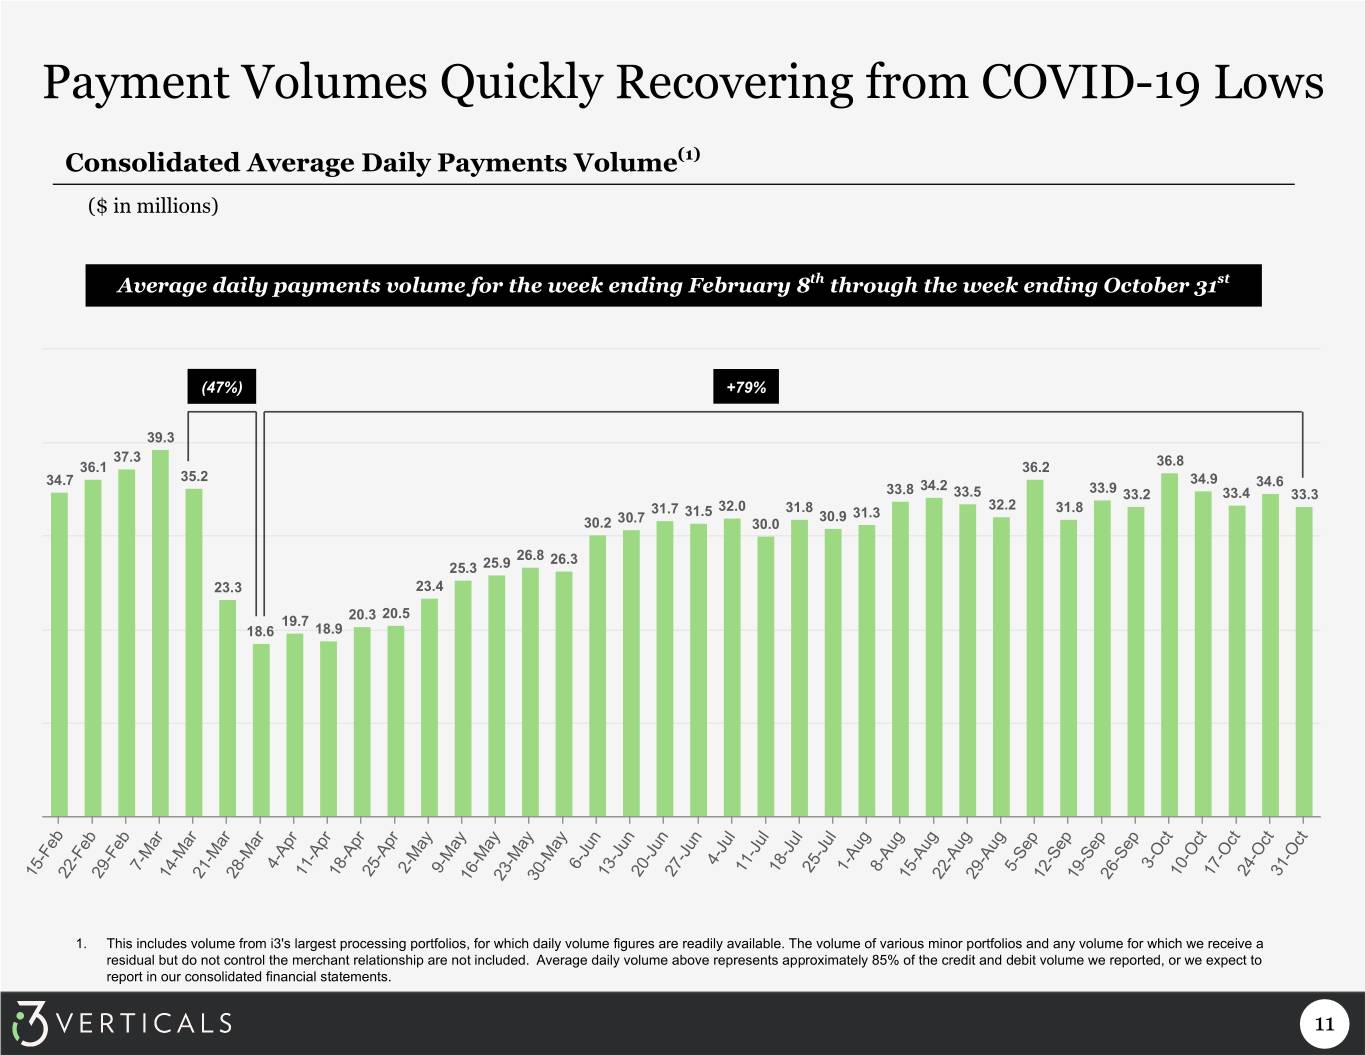
Payment Volumes Quickly Recovering from COVID-19 Lows Consolidated Average Daily Payments Volume(1) ($ in millions) Average daily payments volume for the week ending February 8th through the week ending October 31st (47%) +79% 39.3 37.3 36.1 36.2 36.8 35.2 34.7 34.2 34.9 34.6 33.8 33.5 33.9 33.2 33.4 33.3 31.7 32.0 31.8 32.2 31.8 31.5 30.9 31.3 30.2 30.7 30.0 26.8 26.3 25.3 25.9 23.3 23.4 20.5 19.7 20.3 18.6 18.9 4-Jul 7-Mar 4-Apr 2-May 9-May 6-Jun 11-Jul 18-Jul 25-Jul 1-Aug 8-Aug 5-Sep 3-Oct 15-Feb 22-Feb 29-Feb 14-Mar 21-Mar 28-Mar 11-Apr 18-Apr 25-Apr 16-May 23-May 30-May 13-Jun 20-Jun 27-Jun 15-Aug 22-Aug 29-Aug 12-Sep 19-Sep 26-Sep 10-Oct 17-Oct 24-Oct 31-Oct 1. This includes volume from i3's largest processing portfolios, for which daily volume figures are readily available. The volume of various minor portfolios and any volume for which we receive a residual but do not control the merchant relationship are not included. Average daily volume above represents approximately 85% of the credit and debit volume we reported, or we expect to report in our consolidated financial statements. 11
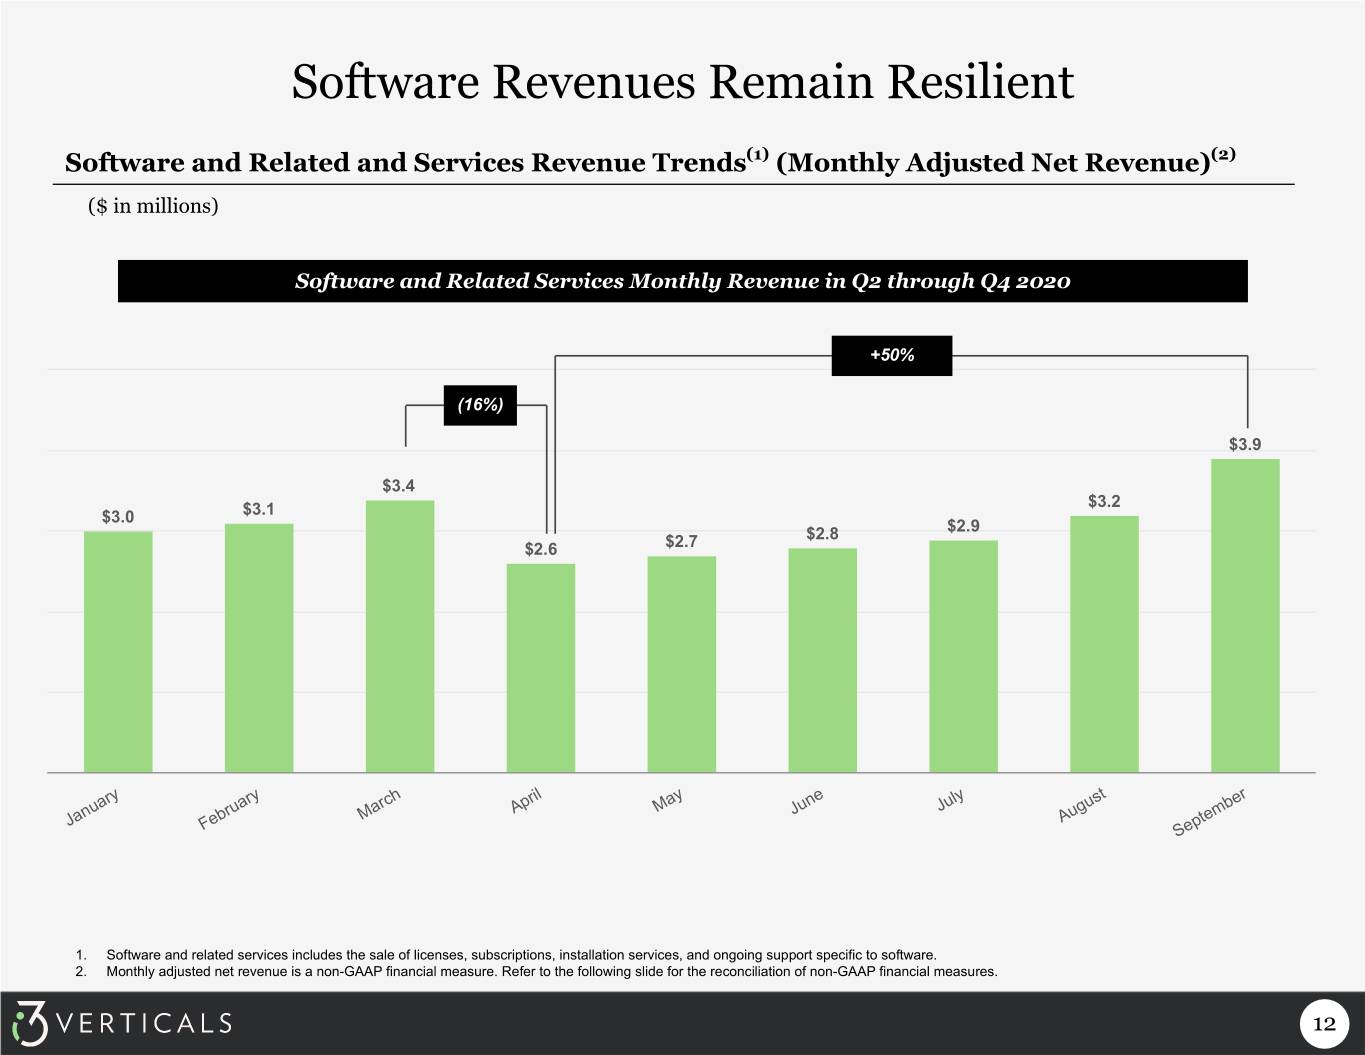
Software Revenues Remain Resilient Software and Related and Services Revenue Trends(1) (Monthly Adjusted Net Revenue)(2) ($ in millions) Software and Related Services Monthly Revenue in Q2 through Q4 2020 +50% (16%) $3.9 $3.4 $3.2 $3.0 $3.1 $2.8 $2.9 $2.6 $2.7 April May June July January March August February September 1. Software and related services includes the sale of licenses, subscriptions, installation services, and ongoing support specific to software. 2. Monthly adjusted net revenue is a non-GAAP financial measure. Refer to the following slide for the reconciliation of non-GAAP financial measures. 12
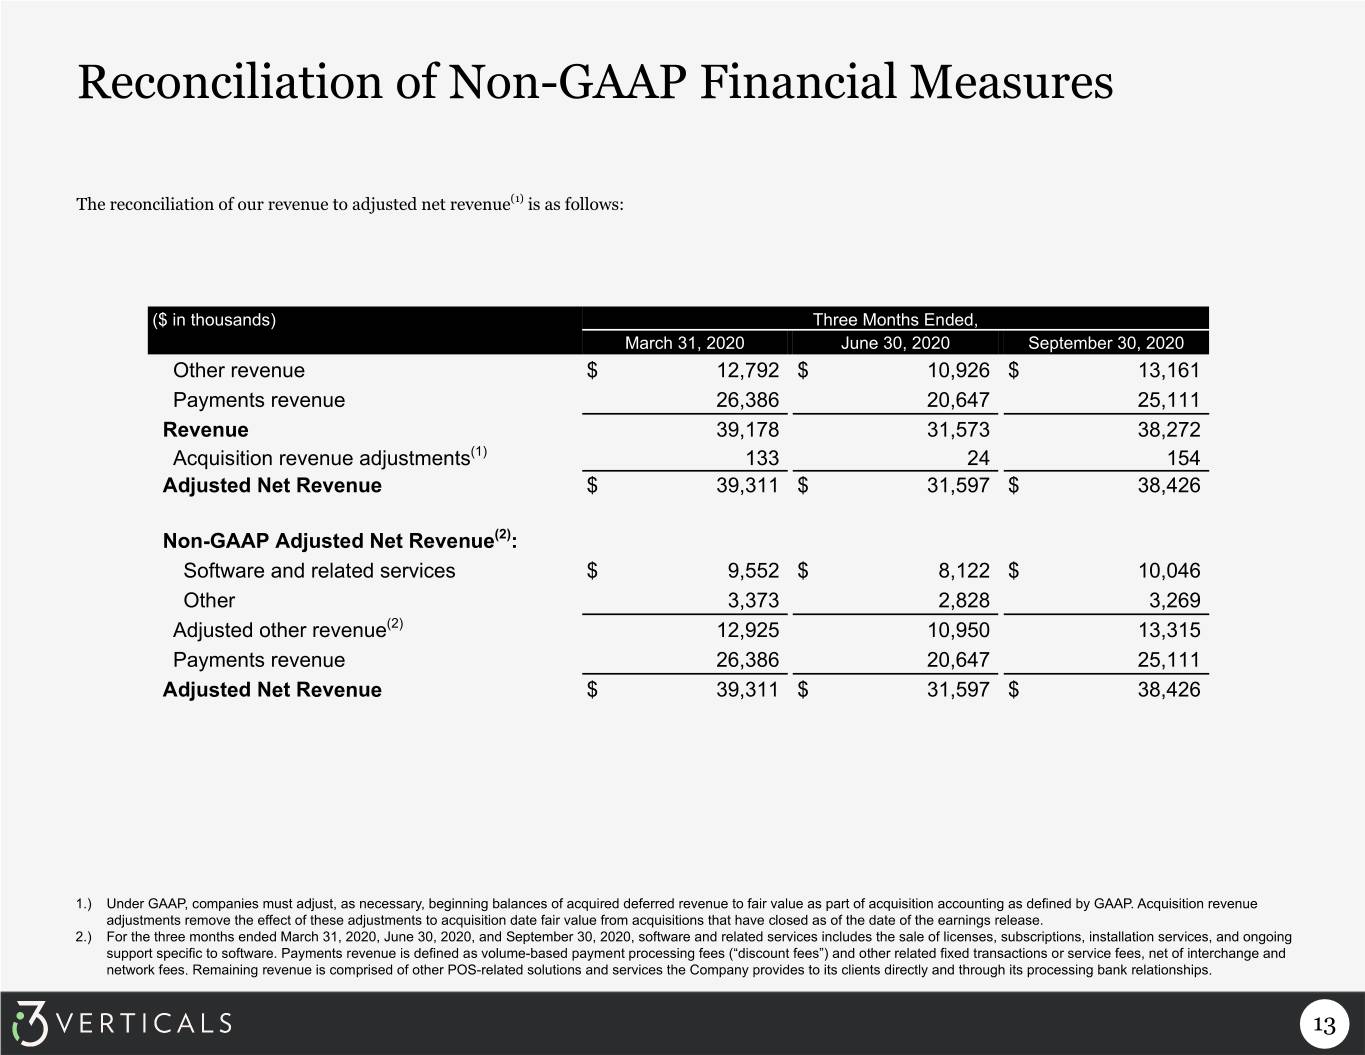
Reconciliation of Non-GAAP Financial Measures The reconciliation of our revenue to adjusted net revenue(1) is as follows: ($ in thousands) Three Months Ended, March 31, 2020 June 30, 2020 September 30, 2020 Other revenue $ 12,792 $ 10,926 $ 13,161 Payments revenue 26,386 20,647 25,111 Revenue 39,178 31,573 38,272 Acquisition revenue adjustments(1) 133 24 154 Adjusted Net Revenue $ 39,311 $ 31,597 $ 38,426 Non-GAAP Adjusted Net Revenue(2): Software and related services $ 9,552 $ 8,122 $ 10,046 Other 3,373 2,828 3,269 Adjusted other revenue(2) 12,925 10,950 13,315 Payments revenue 26,386 20,647 25,111 Adjusted Net Revenue $ 39,311 $ 31,597 $ 38,426 1.) Under GAAP, companies must adjust, as necessary, beginning balances of acquired deferred revenue to fair value as part of acquisition accounting as defined by GAAP. Acquisition revenue adjustments remove the effect of these adjustments to acquisition date fair value from acquisitions that have closed as of the date of the earnings release. 2.) For the three months ended March 31, 2020, June 30, 2020, and September 30, 2020, software and related services includes the sale of licenses, subscriptions, installation services, and ongoing support specific to software. Payments revenue is defined as volume-based payment processing fees (“discount fees”) and other related fixed transactions or service fees, net of interchange and network fees. Remaining revenue is comprised of other POS-related solutions and services the Company provides to its clients directly and through its processing bank relationships. 13
Q3 Fiscal 2020 Supplemental Information
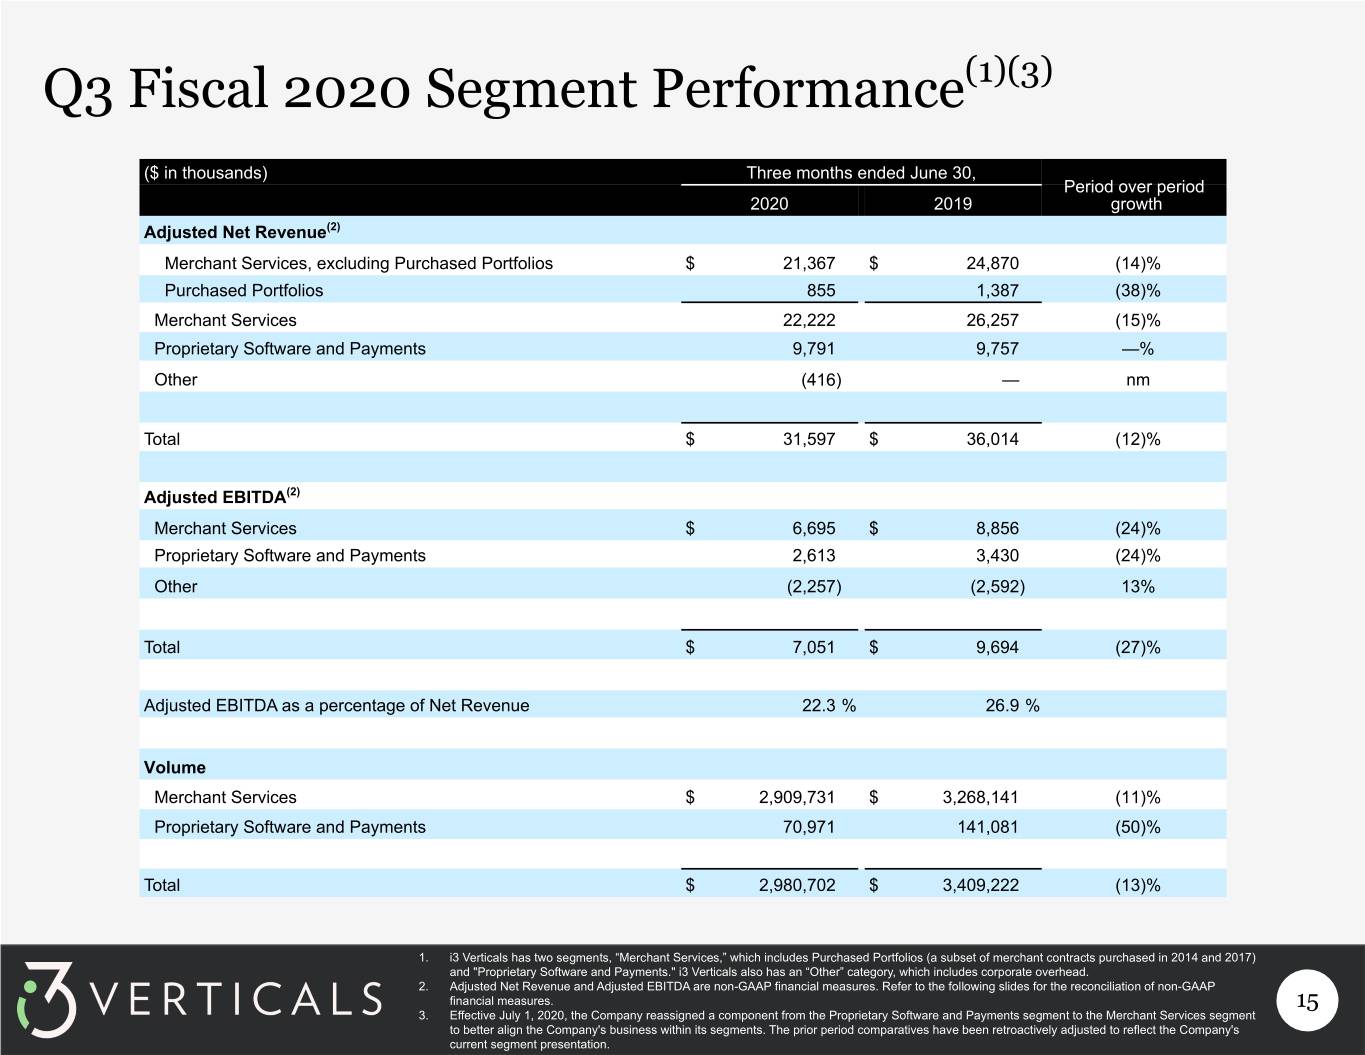
Q3 Fiscal 2020 Segment Performance(1)(3) ($ in thousands) Three months ended June 30, Period over period 2020 2019 growth Adjusted Net Revenue(2) Merchant Services, excluding Purchased Portfolios $ 21,367 $ 24,870 (14)% Purchased Portfolios 855 1,387 (38)% Merchant Services 22,222 26,257 (15)% Proprietary Software and Payments 9,791 9,757 —% Other (416) — nm Total $ 31,597 $ 36,014 (12)% Adjusted EBITDA(2) Merchant Services $ 6,695 $ 8,856 (24)% Proprietary Software and Payments 2,613 3,430 (24)% Other (2,257) (2,592) 13% Total $ 7,051 $ 9,694 (27)% Adjusted EBITDA as a percentage of Net Revenue 22.3 % 26.9 % Volume Merchant Services $ 2,909,731 $ 3,268,141 (11)% Proprietary Software and Payments 70,971 141,081 (50)% Total $ 2,980,702 $ 3,409,222 (13)% 1. i3 Verticals has two segments, “Merchant Services,” which includes Purchased Portfolios (a subset of merchant contracts purchased in 2014 and 2017) and "Proprietary Software and Payments." i3 Verticals also has an “Other” category, which includes corporate overhead. 2. Adjusted Net Revenue and Adjusted EBITDA are non-GAAP financial measures. Refer to the following slides for the reconciliation of non-GAAP financial measures. 15 3. Effective July 1, 2020, the Company reassigned a component from the Proprietary Software and Payments segment to the Merchant Services segment to better align the Company's business within its segments. The prior period comparatives have been retroactively adjusted to reflect the Company's current segment presentation.
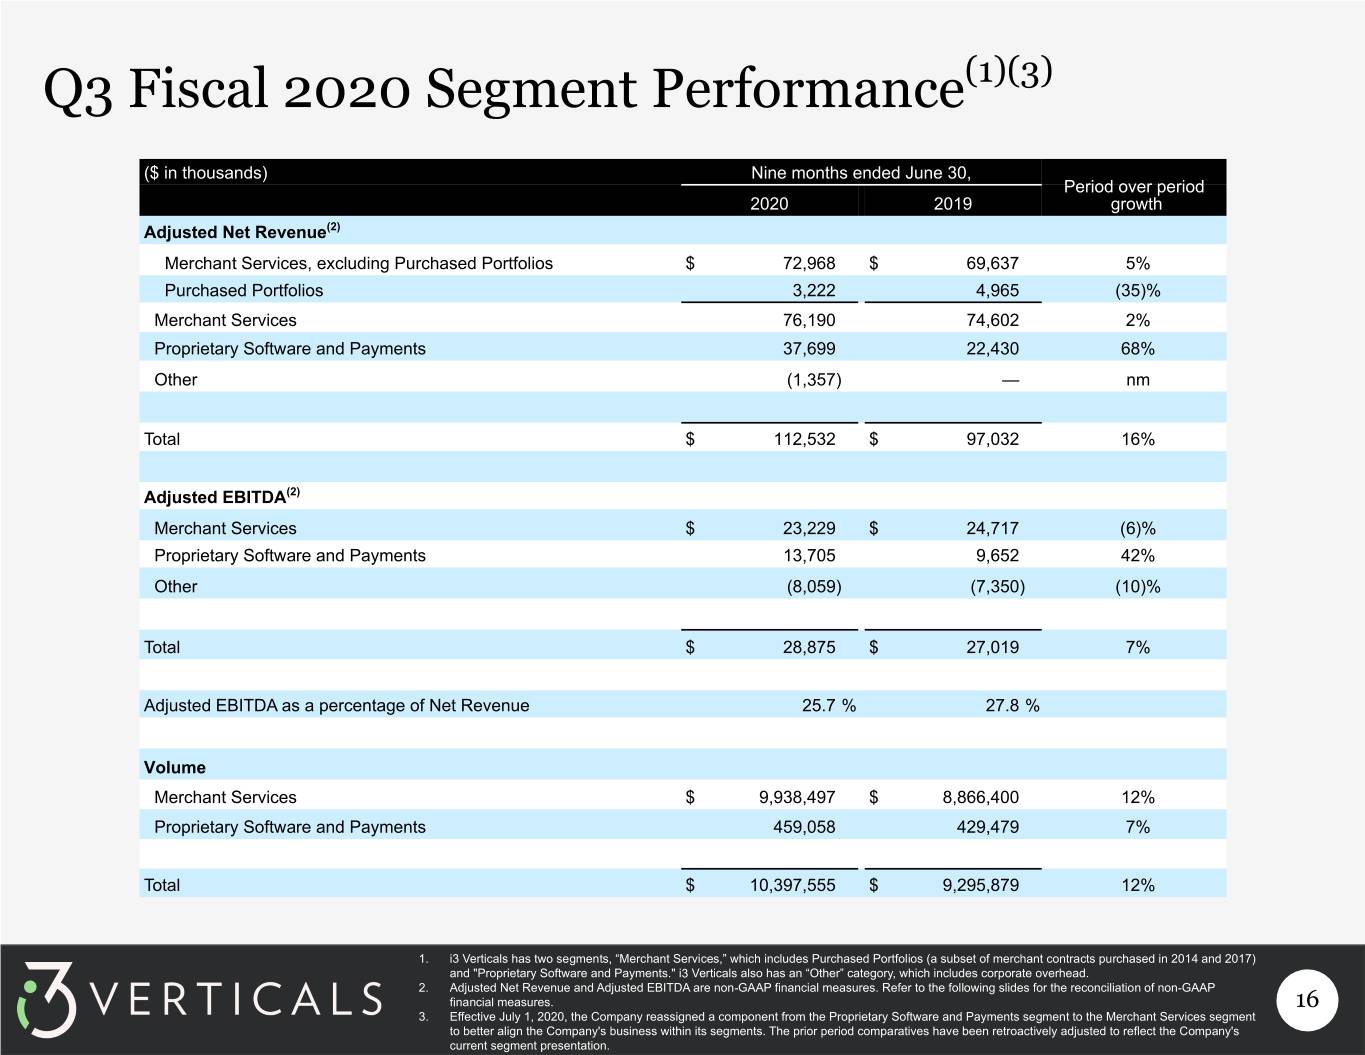
Q3 Fiscal 2020 Segment Performance(1)(3) ($ in thousands) Nine months ended June 30, Period over period 2020 2019 growth Adjusted Net Revenue(2) Merchant Services, excluding Purchased Portfolios $ 72,968 $ 69,637 5% Purchased Portfolios 3,222 4,965 (35)% Merchant Services 76,190 74,602 2% Proprietary Software and Payments 37,699 22,430 68% Other (1,357) — nm Total $ 112,532 $ 97,032 16% Adjusted EBITDA(2) Merchant Services $ 23,229 $ 24,717 (6)% Proprietary Software and Payments 13,705 9,652 42% Other (8,059) (7,350) (10)% Total $ 28,875 $ 27,019 7% Adjusted EBITDA as a percentage of Net Revenue 25.7 % 27.8 % Volume Merchant Services $ 9,938,497 $ 8,866,400 12% Proprietary Software and Payments 459,058 429,479 7% Total $ 10,397,555 $ 9,295,879 12% 1. i3 Verticals has two segments, “Merchant Services,” which includes Purchased Portfolios (a subset of merchant contracts purchased in 2014 and 2017) and "Proprietary Software and Payments." i3 Verticals also has an “Other” category, which includes corporate overhead. 2. Adjusted Net Revenue and Adjusted EBITDA are non-GAAP financial measures. Refer to the following slides for the reconciliation of non-GAAP financial measures. 16 3. Effective July 1, 2020, the Company reassigned a component from the Proprietary Software and Payments segment to the Merchant Services segment to better align the Company's business within its segments. The prior period comparatives have been retroactively adjusted to reflect the Company's current segment presentation.
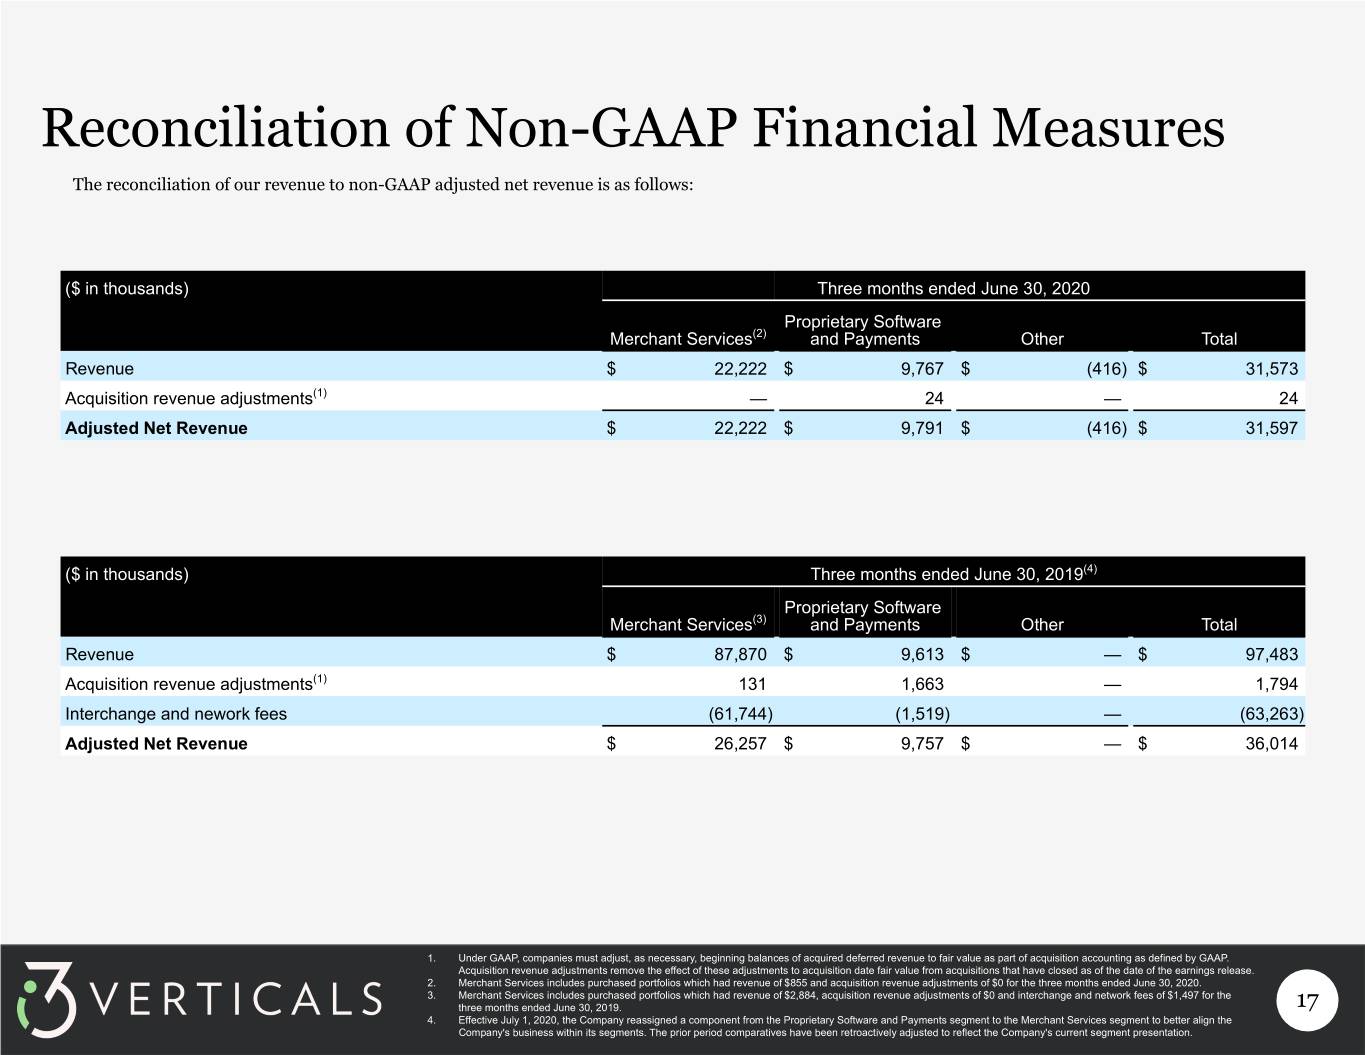
Reconciliation of Non-GAAP Financial Measures The reconciliation of our revenue to non-GAAP adjusted net revenue is as follows: ($ in thousands) Three months ended June 30, 2020 Proprietary Software Merchant Services(2) and Payments Other Total Revenue $ 22,222 $ 9,767 $ (416) $ 31,573 Acquisition revenue adjustments(1) — 24 — 24 Adjusted Net Revenue $ 22,222 $ 9,791 $ (416) $ 31,597 ($ in thousands) Three months ended June 30, 2019(4) Proprietary Software Merchant Services(3) and Payments Other Total Revenue $ 87,870 $ 9,613 $ — $ 97,483 Acquisition revenue adjustments(1) 131 1,663 — 1,794 Interchange and nework fees (61,744) (1,519) — (63,263) Adjusted Net Revenue $ 26,257 $ 9,757 $ — $ 36,014 1. Under GAAP, companies must adjust, as necessary, beginning balances of acquired deferred revenue to fair value as part of acquisition accounting as defined by GAAP. Acquisition revenue adjustments remove the effect of these adjustments to acquisition date fair value from acquisitions that have closed as of the date of the earnings release. 2. Merchant Services includes purchased portfolios which had revenue of $855 and acquisition revenue adjustments of $0 for the three months ended June 30, 2020. 3. Merchant Services includes purchased portfolios which had revenue of $2,884, acquisition revenue adjustments of $0 and interchange and network fees of $1,497 for the three months ended June 30, 2019. 17 4. Effective July 1, 2020, the Company reassigned a component from the Proprietary Software and Payments segment to the Merchant Services segment to better align the Company's business within its segments. The prior period comparatives have been retroactively adjusted to reflect the Company's current segment presentation.
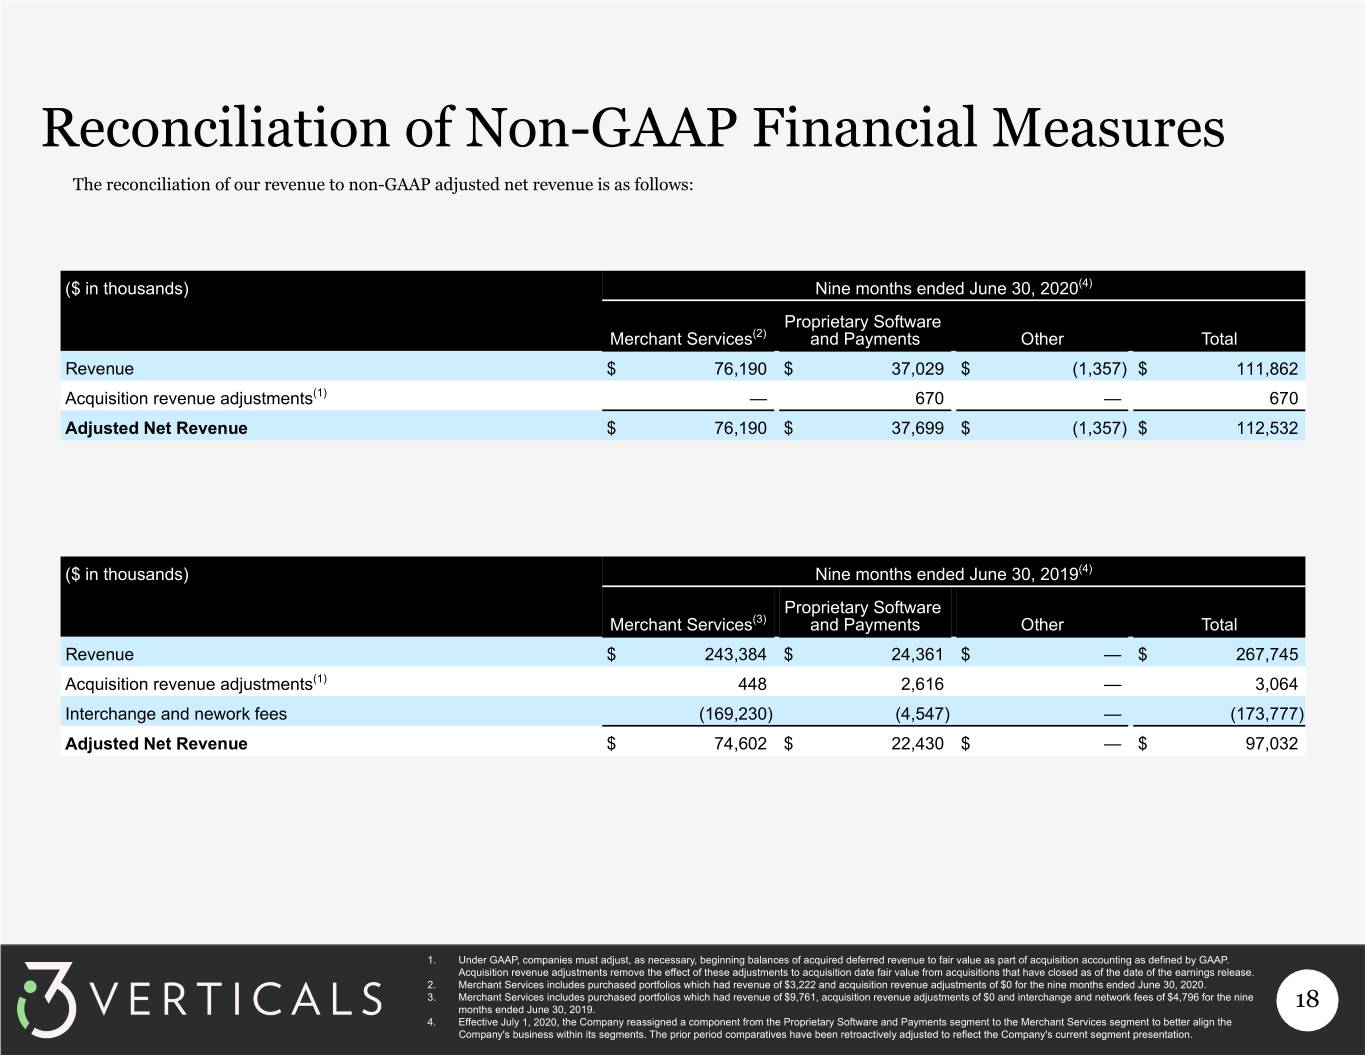
Reconciliation of Non-GAAP Financial Measures The reconciliation of our revenue to non-GAAP adjusted net revenue is as follows: ($ in thousands) Nine months ended June 30, 2020(4) Proprietary Software Merchant Services(2) and Payments Other Total Revenue $ 76,190 $ 37,029 $ (1,357) $ 111,862 Acquisition revenue adjustments(1) — 670 — 670 Adjusted Net Revenue $ 76,190 $ 37,699 $ (1,357) $ 112,532 ($ in thousands) Nine months ended June 30, 2019(4) Proprietary Software Merchant Services(3) and Payments Other Total Revenue $ 243,384 $ 24,361 $ — $ 267,745 Acquisition revenue adjustments(1) 448 2,616 — 3,064 Interchange and nework fees (169,230) (4,547) — (173,777) Adjusted Net Revenue $ 74,602 $ 22,430 $ — $ 97,032 1. Under GAAP, companies must adjust, as necessary, beginning balances of acquired deferred revenue to fair value as part of acquisition accounting as defined by GAAP. Acquisition revenue adjustments remove the effect of these adjustments to acquisition date fair value from acquisitions that have closed as of the date of the earnings release. 2. Merchant Services includes purchased portfolios which had revenue of $3,222 and acquisition revenue adjustments of $0 for the nine months ended June 30, 2020. 3. Merchant Services includes purchased portfolios which had revenue of $9,761, acquisition revenue adjustments of $0 and interchange and network fees of $4,796 for the nine months ended June 30, 2019. 18 4. Effective July 1, 2020, the Company reassigned a component from the Proprietary Software and Payments segment to the Merchant Services segment to better align the Company's business within its segments. The prior period comparatives have been retroactively adjusted to reflect the Company's current segment presentation.
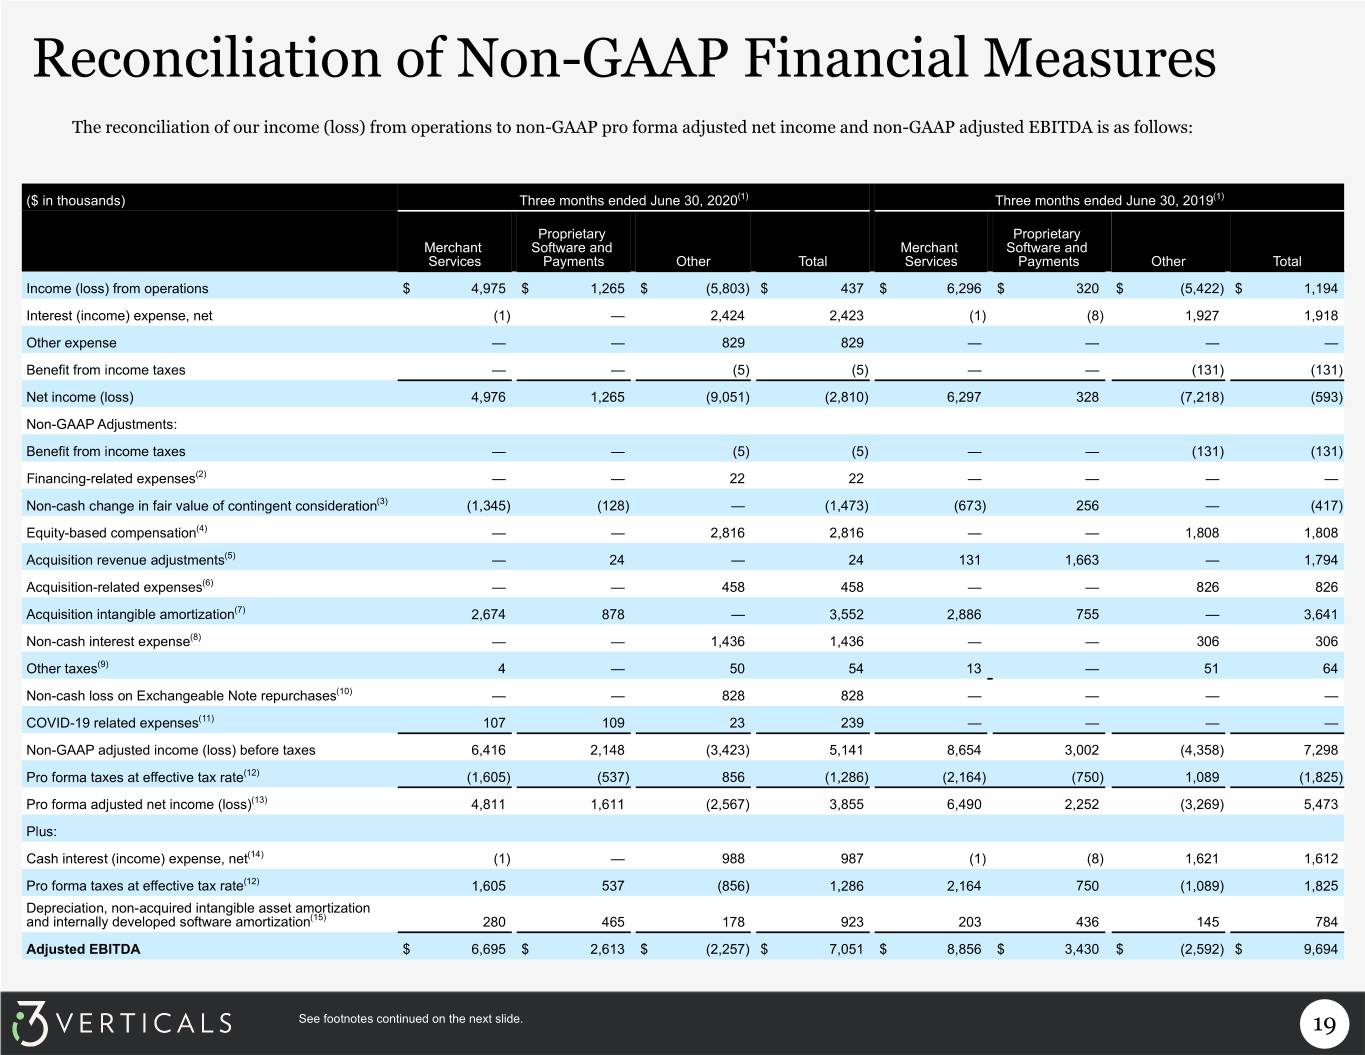
Reconciliation of Non-GAAP Financial Measures The reconciliation of our income (loss) from operations to non-GAAP pro forma adjusted net income and non-GAAP adjusted EBITDA is as follows: ($ in thousands) Three months ended June 30, 2020(1) Three months ended June 30, 2019(1) Proprietary Proprietary Merchant Software and Merchant Software and Services Payments Other Total Services Payments Other Total Income (loss) from operations $ 4,975 $ 1,265 $ (5,803) $ 437 $ 6,296 $ 320 $ (5,422) $ 1,194 Interest (income) expense, net (1) — 2,424 2,423 (1) (8) 1,927 1,918 Other expense — — 829 829 — — — — Benefit from income taxes — — (5) (5) — — (131) (131) Net income (loss) 4,976 1,265 (9,051) (2,810) 6,297 328 (7,218) (593) Non-GAAP Adjustments: Benefit from income taxes — — (5) (5) — — (131) (131) Financing-related expenses(2) — — 22 22 — — — — Non-cash change in fair value of contingent consideration(3) (1,345) (128) — (1,473) (673) 256 — (417) Equity-based compensation(4) — — 2,816 2,816 — — 1,808 1,808 Acquisition revenue adjustments(5) — 24 — 24 131 1,663 — 1,794 Acquisition-related expenses(6) — — 458 458 — — 826 826 Acquisition intangible amortization(7) 2,674 878 — 3,552 2,886 755 — 3,641 Non-cash interest expense(8) — — 1,436 1,436 — — 306 306 Other taxes(9) 4 — 50 54 13 — 51 64 Non-cash loss on Exchangeable Note repurchases(10) — — 828 828 — — — — COVID-19 related expenses(11) 107 109 23 239 — — — — Non-GAAP adjusted income (loss) before taxes 6,416 2,148 (3,423) 5,141 8,654 3,002 (4,358) 7,298 Pro forma taxes at effective tax rate(12) (1,605) (537) 856 (1,286) (2,164) (750) 1,089 (1,825) Pro forma adjusted net income (loss)(13) 4,811 1,611 (2,567) 3,855 6,490 2,252 (3,269) 5,473 Plus: Cash interest (income) expense, net(14) (1) — 988 987 (1) (8) 1,621 1,612 Pro forma taxes at effective tax rate(12) 1,605 537 (856) 1,286 2,164 750 (1,089) 1,825 Depreciation, non-acquired intangible asset amortization and internally developed software amortization(15) 280 465 178 923 203 436 145 784 Adjusted EBITDA $ 6,695 $ 2,613 $ (2,257) $ 7,051 $ 8,856 $ 3,430 $ (2,592) $ 9,694 See footnotes continued on the next slide. 19
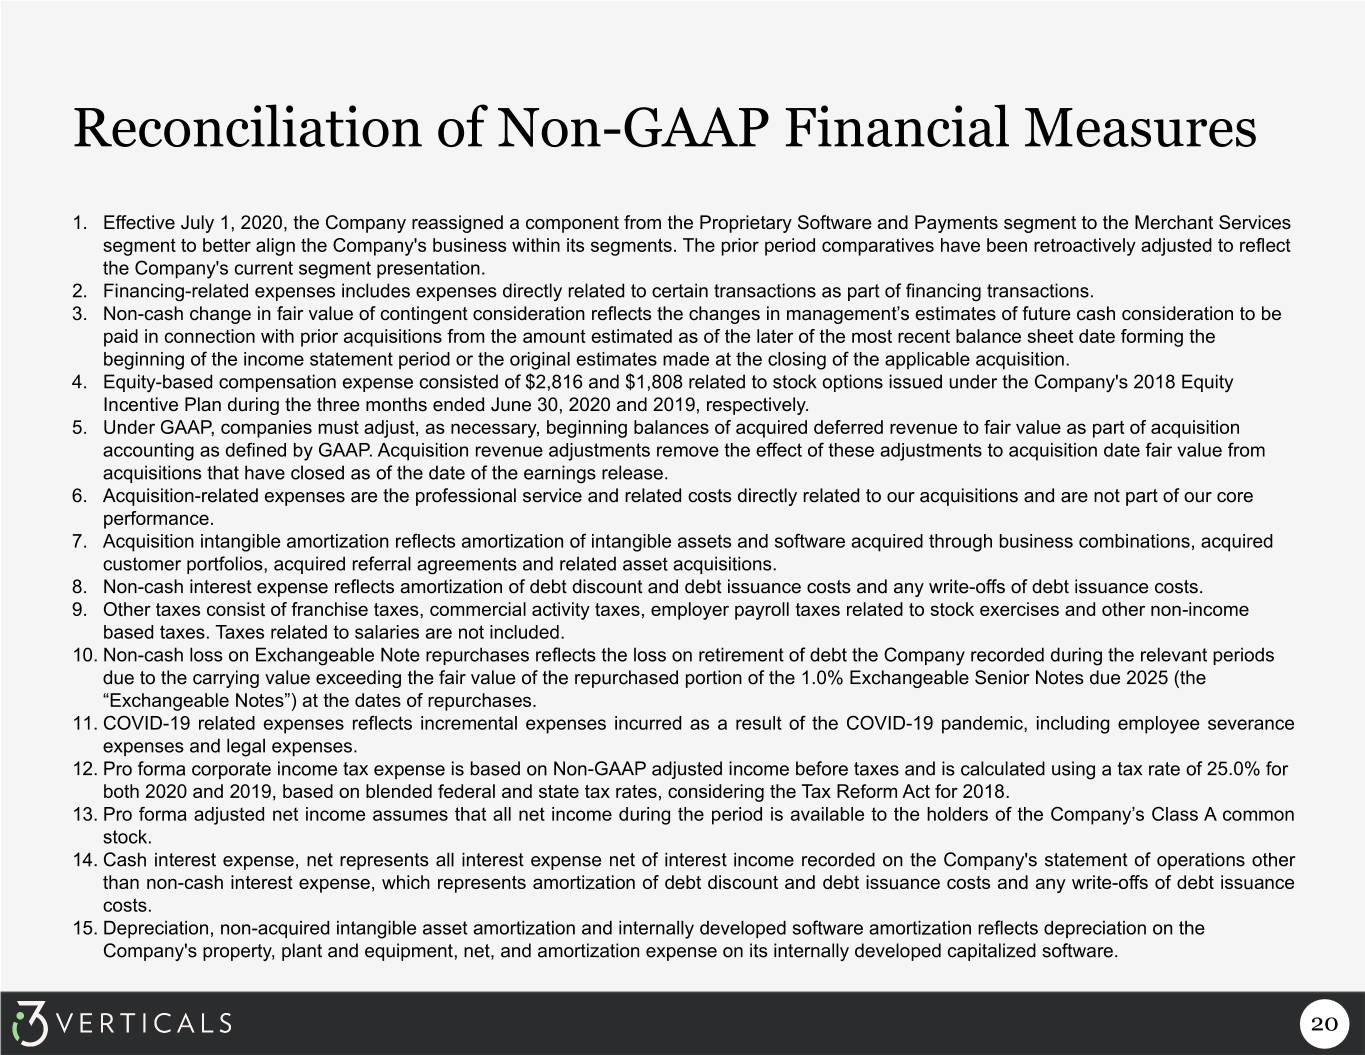
Reconciliation of Non-GAAP Financial Measures 1. Effective July 1, 2020, the Company reassigned a component from the Proprietary Software and Payments segment to the Merchant Services segment to better align the Company's business within its segments. The prior period comparatives have been retroactively adjusted to reflect the Company's current segment presentation. 2. Financing-related expenses includes expenses directly related to certain transactions as part of financing transactions. 3. Non-cash change in fair value of contingent consideration reflects the changes in management’s estimates of future cash consideration to be paid in connection with prior acquisitions from the amount estimated as of the later of the most recent balance sheet date forming the beginning of the income statement period or the original estimates made at the closing of the applicable acquisition. 4. Equity-based compensation expense consisted of $2,816 and $1,808 related to stock options issued under the Company's 2018 Equity Incentive Plan during the three months ended June 30, 2020 and 2019, respectively. 5. Under GAAP, companies must adjust, as necessary, beginning balances of acquired deferred revenue to fair value as part of acquisition accounting as defined by GAAP. Acquisition revenue adjustments remove the effect of these adjustments to acquisition date fair value from acquisitions that have closed as of the date of the earnings release. 6. Acquisition-related expenses are the professional service and related costs directly related to our acquisitions and are not part of our core performance. 7. Acquisition intangible amortization reflects amortization of intangible assets and software acquired through business combinations, acquired customer portfolios, acquired referral agreements and related asset acquisitions. 8. Non-cash interest expense reflects amortization of debt discount and debt issuance costs and any write-offs of debt issuance costs. 9. Other taxes consist of franchise taxes, commercial activity taxes, employer payroll taxes related to stock exercises and other non-income based taxes. Taxes related to salaries are not included. 10. Non-cash loss on Exchangeable Note repurchases reflects the loss on retirement of debt the Company recorded during the relevant periods due to the carrying value exceeding the fair value of the repurchased portion of the 1.0% Exchangeable Senior Notes due 2025 (the “Exchangeable Notes”) at the dates of repurchases. 11. COVID-19 related expenses reflects incremental expenses incurred as a result of the COVID-19 pandemic, including employee severance expenses and legal expenses. 12. Pro forma corporate income tax expense is based on Non-GAAP adjusted income before taxes and is calculated using a tax rate of 25.0% for both 2020 and 2019, based on blended federal and state tax rates, considering the Tax Reform Act for 2018. 13. Pro forma adjusted net income assumes that all net income during the period is available to the holders of the Company’s Class A common stock. 14. Cash interest expense, net represents all interest expense net of interest income recorded on the Company's statement of operations other than non-cash interest expense, which represents amortization of debt discount and debt issuance costs and any write-offs of debt issuance costs. 15. Depreciation, non-acquired intangible asset amortization and internally developed software amortization reflects depreciation on the Company's property, plant and equipment, net, and amortization expense on its internally developed capitalized software. 20
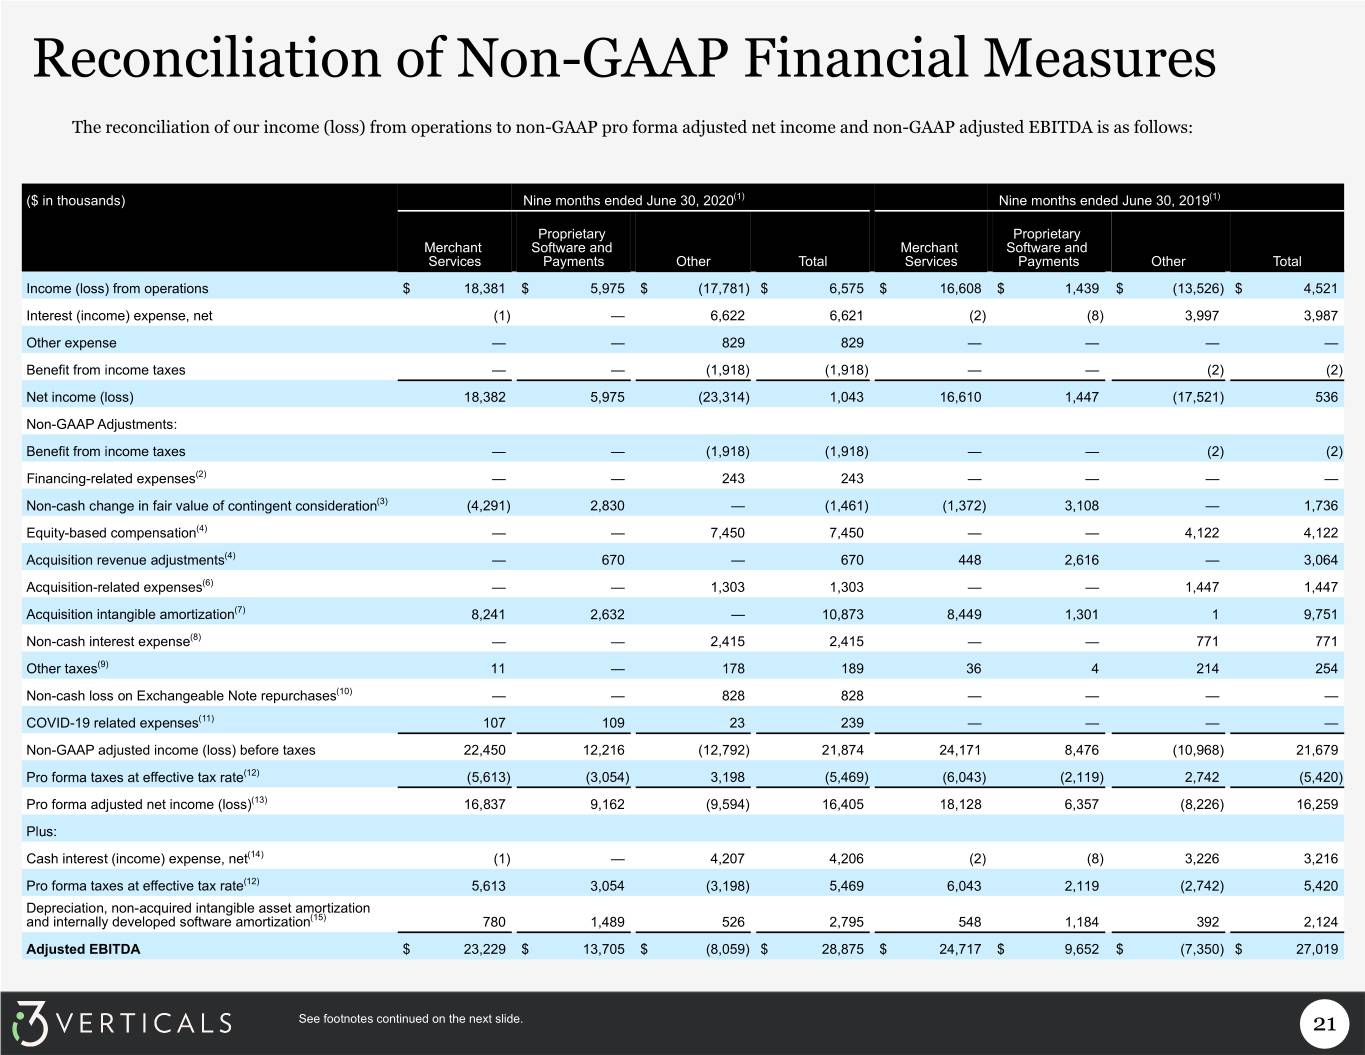
Reconciliation of Non-GAAP Financial Measures The reconciliation of our income (loss) from operations to non-GAAP pro forma adjusted net income and non-GAAP adjusted EBITDA is as follows: ($ in thousands) Nine months ended June 30, 2020(1) Nine months ended June 30, 2019(1) Proprietary Proprietary Merchant Software and Merchant Software and Services Payments Other Total Services Payments Other Total Income (loss) from operations $ 18,381 $ 5,975 $ (17,781) $ 6,575 $ 16,608 $ 1,439 $ (13,526) $ 4,521 Interest (income) expense, net (1) — 6,622 6,621 (2) (8) 3,997 3,987 Other expense — — 829 829 — — — — Benefit from income taxes — — (1,918) (1,918) — — (2) (2) Net income (loss) 18,382 5,975 (23,314) 1,043 16,610 1,447 (17,521) 536 Non-GAAP Adjustments: Benefit from income taxes — — (1,918) (1,918) — — (2) (2) Financing-related expenses(2) — — 243 243 — — — — Non-cash change in fair value of contingent consideration(3) (4,291) 2,830 — (1,461) (1,372) 3,108 — 1,736 Equity-based compensation(4) — — 7,450 7,450 — — 4,122 4,122 Acquisition revenue adjustments(4) — 670 — 670 448 2,616 — 3,064 Acquisition-related expenses(6) — — 1,303 1,303 — — 1,447 1,447 Acquisition intangible amortization(7) 8,241 2,632 — 10,873 8,449 1,301 1 9,751 Non-cash interest expense(8) — — 2,415 2,415 — — 771 771 Other taxes(9) 11 — 178 189 36 4 214 254 Non-cash loss on Exchangeable Note repurchases(10) — — 828 828 — — — — COVID-19 related expenses(11) 107 109 23 239 — — — — Non-GAAP adjusted income (loss) before taxes 22,450 12,216 (12,792) 21,874 24,171 8,476 (10,968) 21,679 Pro forma taxes at effective tax rate(12) (5,613) (3,054) 3,198 (5,469) (6,043) (2,119) 2,742 (5,420) Pro forma adjusted net income (loss)(13) 16,837 9,162 (9,594) 16,405 18,128 6,357 (8,226) 16,259 Plus: Cash interest (income) expense, net(14) (1) — 4,207 4,206 (2) (8) 3,226 3,216 Pro forma taxes at effective tax rate(12) 5,613 3,054 (3,198) 5,469 6,043 2,119 (2,742) 5,420 Depreciation, non-acquired intangible asset amortization and internally developed software amortization(15) 780 1,489 526 2,795 548 1,184 392 2,124 Adjusted EBITDA $ 23,229 $ 13,705 $ (8,059) $ 28,875 $ 24,717 $ 9,652 $ (7,350) $ 27,019 See footnotes continued on the next slide. 21
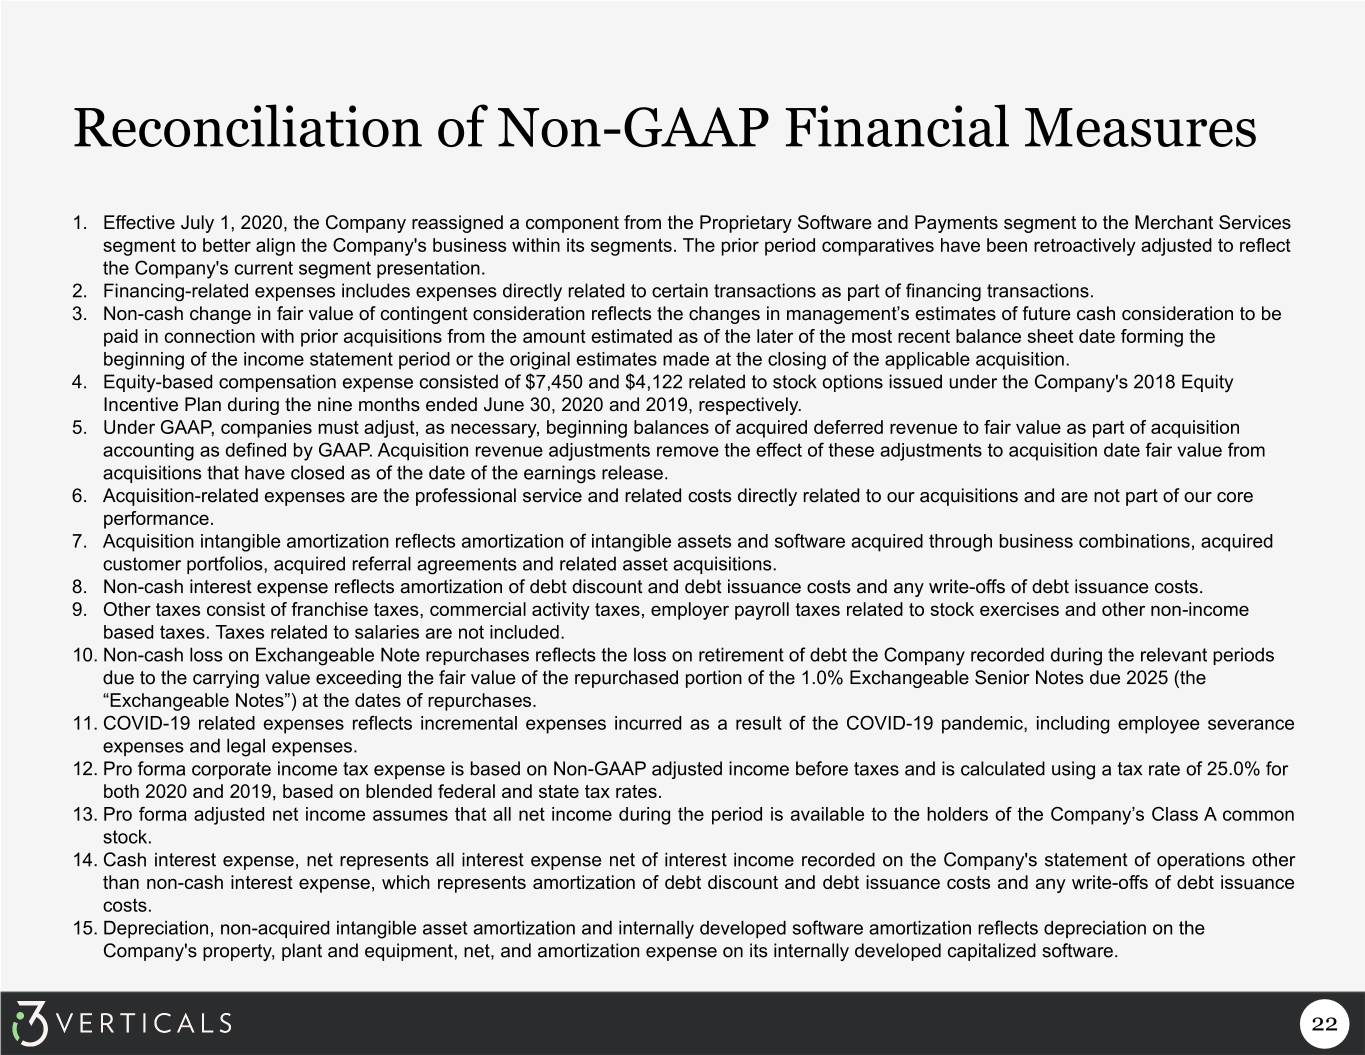
Reconciliation of Non-GAAP Financial Measures 1. Effective July 1, 2020, the Company reassigned a component from the Proprietary Software and Payments segment to the Merchant Services segment to better align the Company's business within its segments. The prior period comparatives have been retroactively adjusted to reflect the Company's current segment presentation. 2. Financing-related expenses includes expenses directly related to certain transactions as part of financing transactions. 3. Non-cash change in fair value of contingent consideration reflects the changes in management’s estimates of future cash consideration to be paid in connection with prior acquisitions from the amount estimated as of the later of the most recent balance sheet date forming the beginning of the income statement period or the original estimates made at the closing of the applicable acquisition. 4. Equity-based compensation expense consisted of $7,450 and $4,122 related to stock options issued under the Company's 2018 Equity Incentive Plan during the nine months ended June 30, 2020 and 2019, respectively. 5. Under GAAP, companies must adjust, as necessary, beginning balances of acquired deferred revenue to fair value as part of acquisition accounting as defined by GAAP. Acquisition revenue adjustments remove the effect of these adjustments to acquisition date fair value from acquisitions that have closed as of the date of the earnings release. 6. Acquisition-related expenses are the professional service and related costs directly related to our acquisitions and are not part of our core performance. 7. Acquisition intangible amortization reflects amortization of intangible assets and software acquired through business combinations, acquired customer portfolios, acquired referral agreements and related asset acquisitions. 8. Non-cash interest expense reflects amortization of debt discount and debt issuance costs and any write-offs of debt issuance costs. 9. Other taxes consist of franchise taxes, commercial activity taxes, employer payroll taxes related to stock exercises and other non-income based taxes. Taxes related to salaries are not included. 10. Non-cash loss on Exchangeable Note repurchases reflects the loss on retirement of debt the Company recorded during the relevant periods due to the carrying value exceeding the fair value of the repurchased portion of the 1.0% Exchangeable Senior Notes due 2025 (the “Exchangeable Notes”) at the dates of repurchases. 11. COVID-19 related expenses reflects incremental expenses incurred as a result of the COVID-19 pandemic, including employee severance expenses and legal expenses. 12. Pro forma corporate income tax expense is based on Non-GAAP adjusted income before taxes and is calculated using a tax rate of 25.0% for both 2020 and 2019, based on blended federal and state tax rates. 13. Pro forma adjusted net income assumes that all net income during the period is available to the holders of the Company’s Class A common stock. 14. Cash interest expense, net represents all interest expense net of interest income recorded on the Company's statement of operations other than non-cash interest expense, which represents amortization of debt discount and debt issuance costs and any write-offs of debt issuance costs. 15. Depreciation, non-acquired intangible asset amortization and internally developed software amortization reflects depreciation on the Company's property, plant and equipment, net, and amortization expense on its internally developed capitalized software. 22
Q2 Fiscal 2020 Supplemental Information
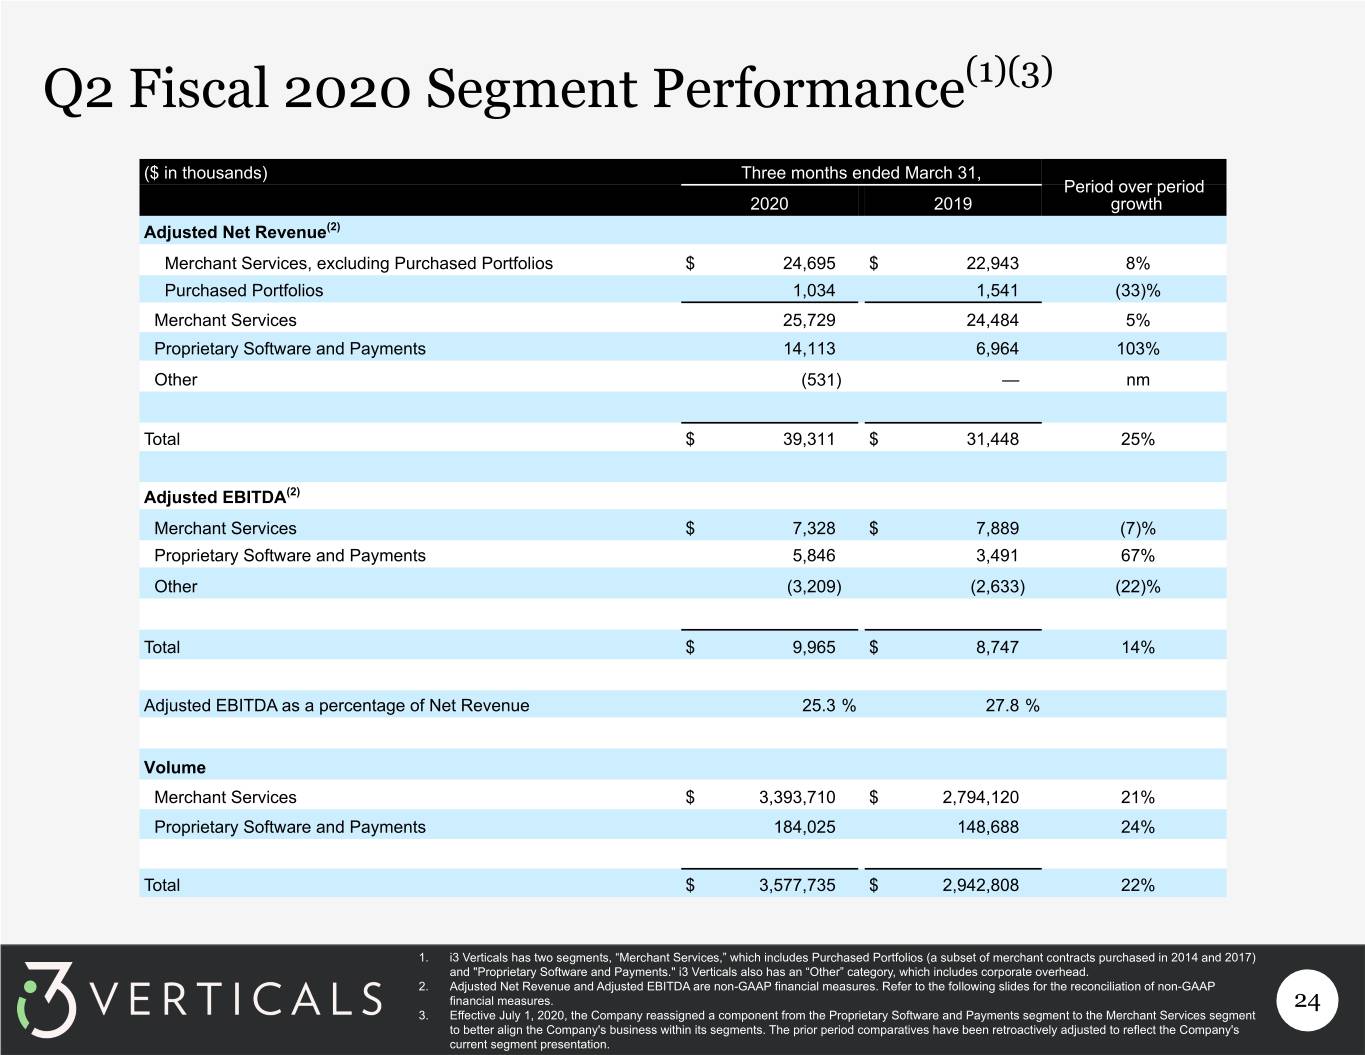
Q2 Fiscal 2020 Segment Performance(1)(3) ($ in thousands) Three months ended March 31, Period over period 2020 2019 growth Adjusted Net Revenue(2) Merchant Services, excluding Purchased Portfolios $ 24,695 $ 22,943 8% Purchased Portfolios 1,034 1,541 (33)% Merchant Services 25,729 24,484 5% Proprietary Software and Payments 14,113 6,964 103% Other (531) — nm Total $ 39,311 $ 31,448 25% Adjusted EBITDA(2) Merchant Services $ 7,328 $ 7,889 (7)% Proprietary Software and Payments 5,846 3,491 67% Other (3,209) (2,633) (22)% Total $ 9,965 $ 8,747 14% Adjusted EBITDA as a percentage of Net Revenue 25.3 % 27.8 % Volume Merchant Services $ 3,393,710 $ 2,794,120 21% Proprietary Software and Payments 184,025 148,688 24% Total $ 3,577,735 $ 2,942,808 22% 1. i3 Verticals has two segments, “Merchant Services,” which includes Purchased Portfolios (a subset of merchant contracts purchased in 2014 and 2017) and "Proprietary Software and Payments." i3 Verticals also has an “Other” category, which includes corporate overhead. 2. Adjusted Net Revenue and Adjusted EBITDA are non-GAAP financial measures. Refer to the following slides for the reconciliation of non-GAAP financial measures. 24 3. Effective July 1, 2020, the Company reassigned a component from the Proprietary Software and Payments segment to the Merchant Services segment to better align the Company's business within its segments. The prior period comparatives have been retroactively adjusted to reflect the Company's current segment presentation.
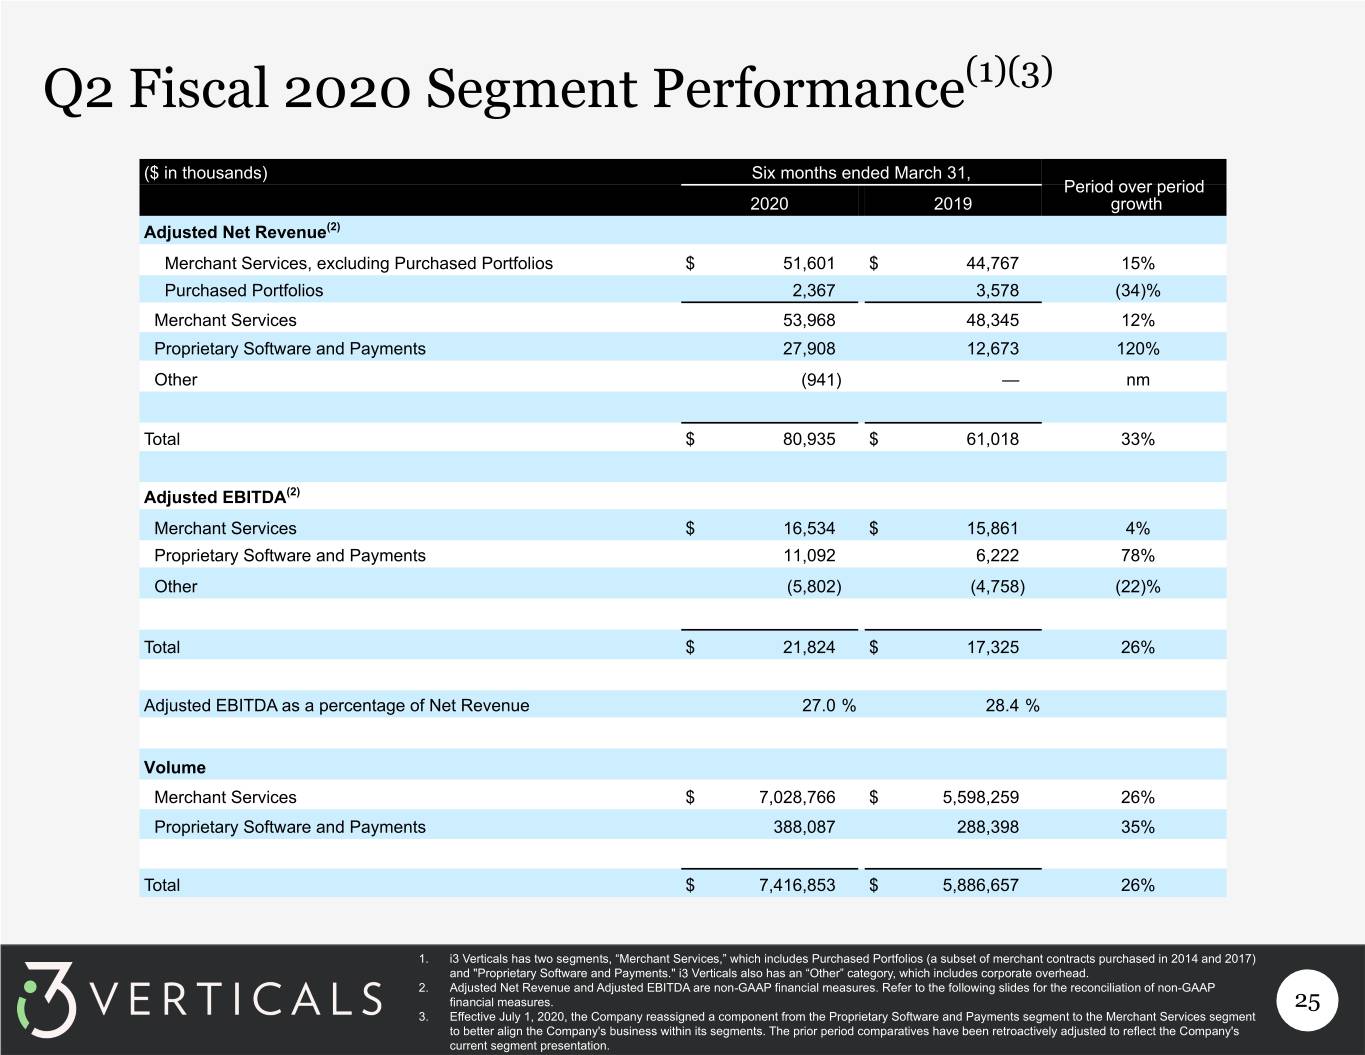
Q2 Fiscal 2020 Segment Performance(1)(3) ($ in thousands) Six months ended March 31, Period over period 2020 2019 growth Adjusted Net Revenue(2) Merchant Services, excluding Purchased Portfolios $ 51,601 $ 44,767 15% Purchased Portfolios 2,367 3,578 (34)% Merchant Services 53,968 48,345 12% Proprietary Software and Payments 27,908 12,673 120% Other (941) — nm Total $ 80,935 $ 61,018 33% Adjusted EBITDA(2) Merchant Services $ 16,534 $ 15,861 4% Proprietary Software and Payments 11,092 6,222 78% Other (5,802) (4,758) (22)% Total $ 21,824 $ 17,325 26% Adjusted EBITDA as a percentage of Net Revenue 27.0 % 28.4 % Volume Merchant Services $ 7,028,766 $ 5,598,259 26% Proprietary Software and Payments 388,087 288,398 35% Total $ 7,416,853 $ 5,886,657 26% 1. i3 Verticals has two segments, “Merchant Services,” which includes Purchased Portfolios (a subset of merchant contracts purchased in 2014 and 2017) and "Proprietary Software and Payments." i3 Verticals also has an “Other” category, which includes corporate overhead. 2. Adjusted Net Revenue and Adjusted EBITDA are non-GAAP financial measures. Refer to the following slides for the reconciliation of non-GAAP financial measures. 25 3. Effective July 1, 2020, the Company reassigned a component from the Proprietary Software and Payments segment to the Merchant Services segment to better align the Company's business within its segments. The prior period comparatives have been retroactively adjusted to reflect the Company's current segment presentation.
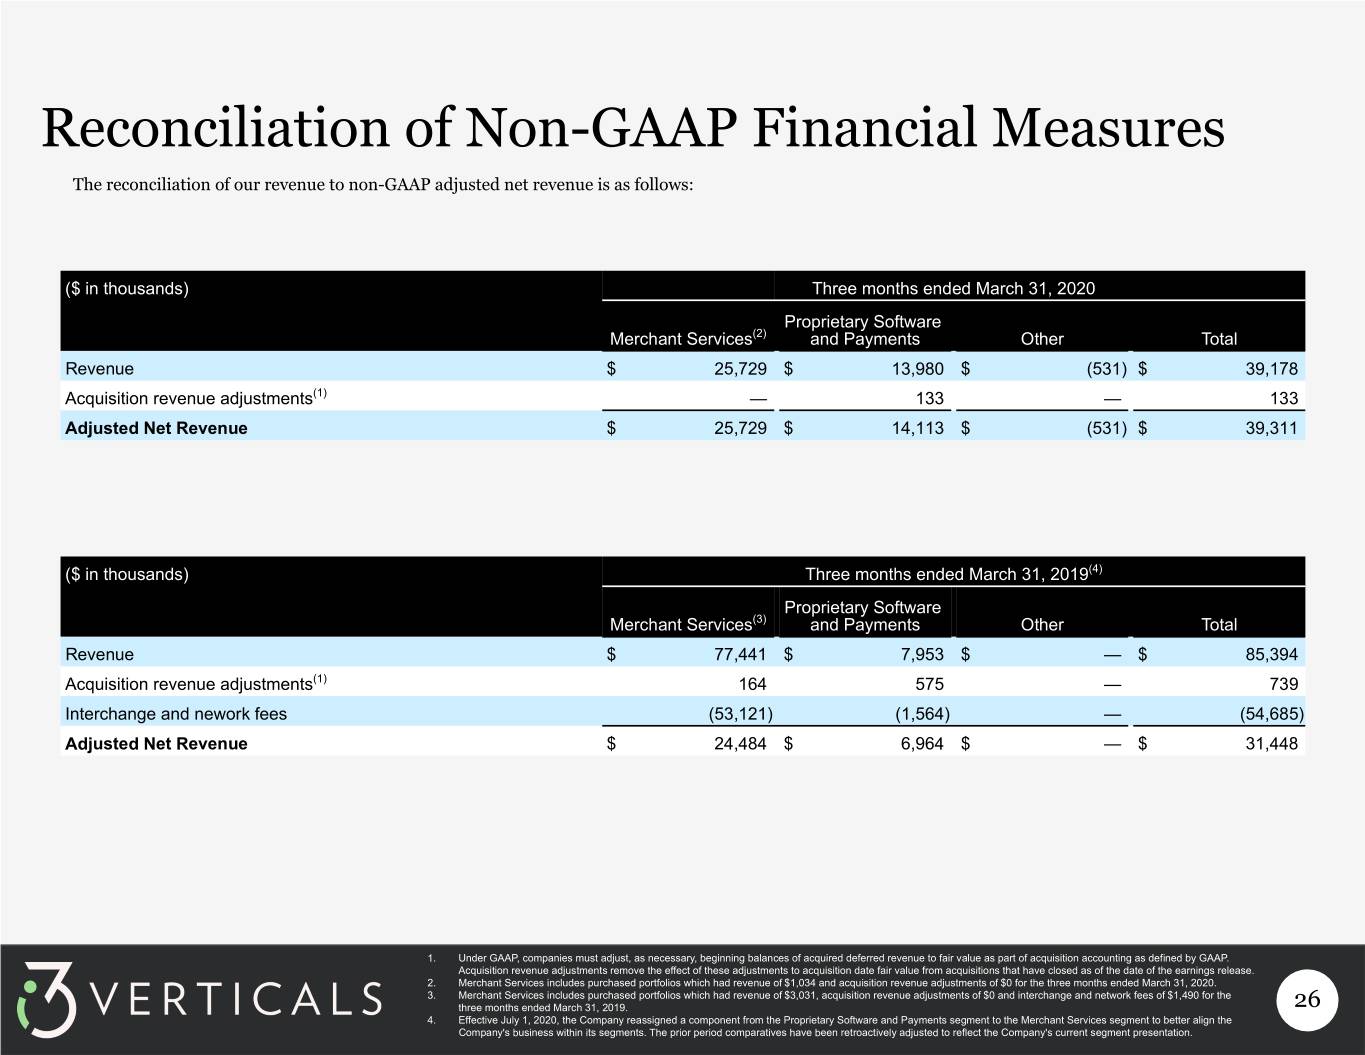
Reconciliation of Non-GAAP Financial Measures The reconciliation of our revenue to non-GAAP adjusted net revenue is as follows: ($ in thousands) Three months ended March 31, 2020 Proprietary Software Merchant Services(2) and Payments Other Total Revenue $ 25,729 $ 13,980 $ (531) $ 39,178 Acquisition revenue adjustments(1) — 133 — 133 Adjusted Net Revenue $ 25,729 $ 14,113 $ (531) $ 39,311 ($ in thousands) Three months ended March 31, 2019(4) Proprietary Software Merchant Services(3) and Payments Other Total Revenue $ 77,441 $ 7,953 $ — $ 85,394 Acquisition revenue adjustments(1) 164 575 — 739 Interchange and nework fees (53,121) (1,564) — (54,685) Adjusted Net Revenue $ 24,484 $ 6,964 $ — $ 31,448 1. Under GAAP, companies must adjust, as necessary, beginning balances of acquired deferred revenue to fair value as part of acquisition accounting as defined by GAAP. Acquisition revenue adjustments remove the effect of these adjustments to acquisition date fair value from acquisitions that have closed as of the date of the earnings release. 2. Merchant Services includes purchased portfolios which had revenue of $1,034 and acquisition revenue adjustments of $0 for the three months ended March 31, 2020. 3. Merchant Services includes purchased portfolios which had revenue of $3,031, acquisition revenue adjustments of $0 and interchange and network fees of $1,490 for the three months ended March 31, 2019. 26 4. Effective July 1, 2020, the Company reassigned a component from the Proprietary Software and Payments segment to the Merchant Services segment to better align the Company's business within its segments. The prior period comparatives have been retroactively adjusted to reflect the Company's current segment presentation.
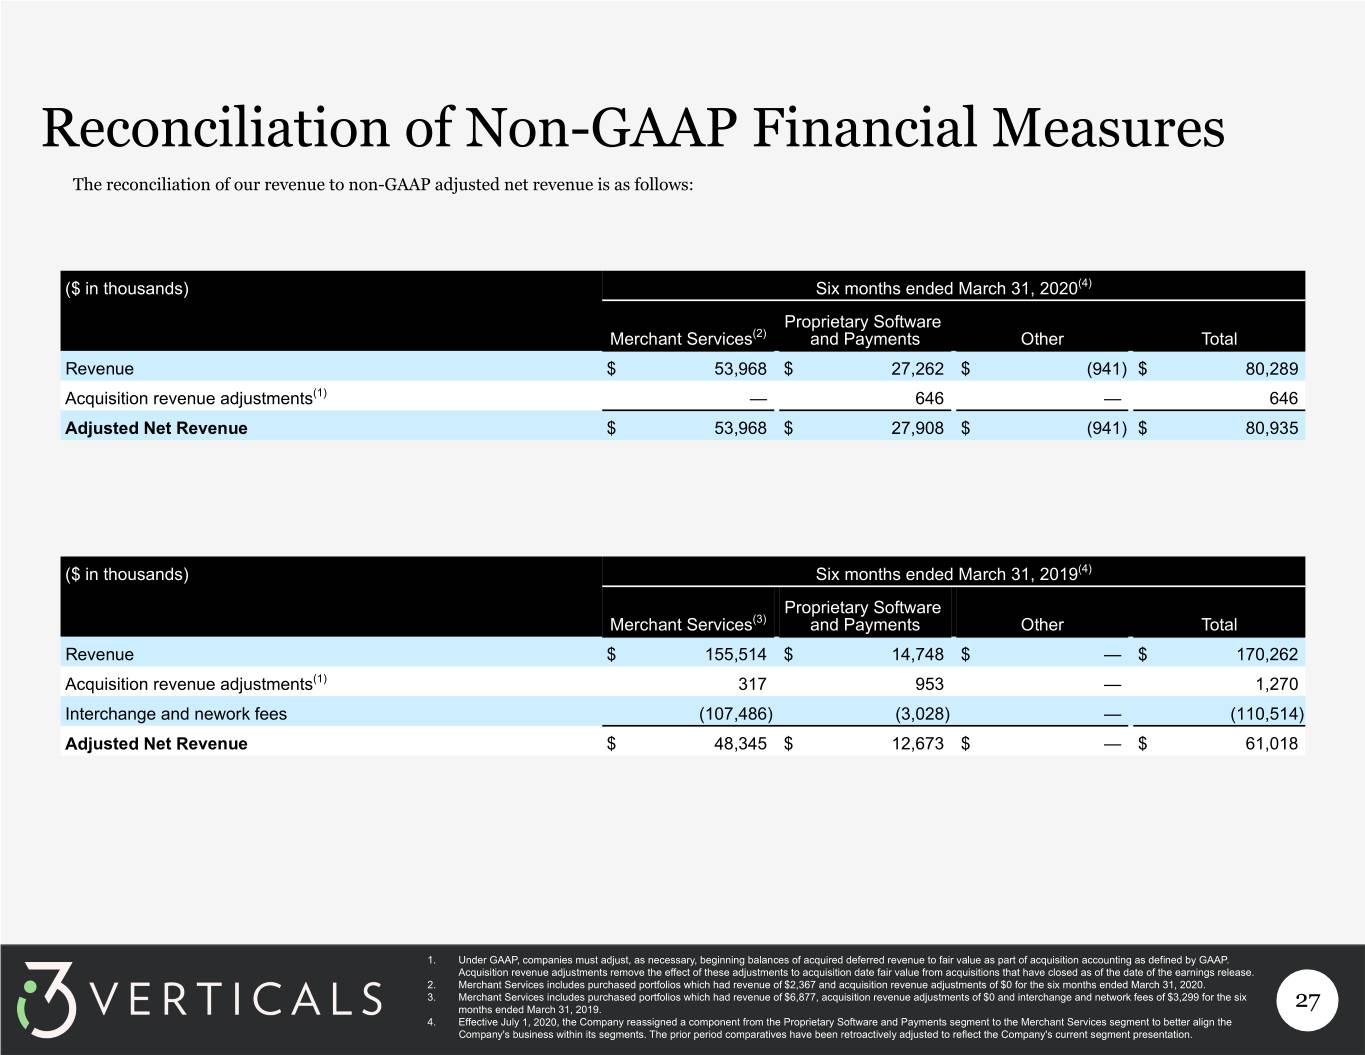
Reconciliation of Non-GAAP Financial Measures The reconciliation of our revenue to non-GAAP adjusted net revenue is as follows: ($ in thousands) Six months ended March 31, 2020(4) Proprietary Software Merchant Services(2) and Payments Other Total Revenue $ 53,968 $ 27,262 $ (941) $ 80,289 Acquisition revenue adjustments(1) — 646 — 646 Adjusted Net Revenue $ 53,968 $ 27,908 $ (941) $ 80,935 ($ in thousands) Six months ended March 31, 2019(4) Proprietary Software Merchant Services(3) and Payments Other Total Revenue $ 155,514 $ 14,748 $ — $ 170,262 Acquisition revenue adjustments(1) 317 953 — 1,270 Interchange and nework fees (107,486) (3,028) — (110,514) Adjusted Net Revenue $ 48,345 $ 12,673 $ — $ 61,018 1. Under GAAP, companies must adjust, as necessary, beginning balances of acquired deferred revenue to fair value as part of acquisition accounting as defined by GAAP. Acquisition revenue adjustments remove the effect of these adjustments to acquisition date fair value from acquisitions that have closed as of the date of the earnings release. 2. Merchant Services includes purchased portfolios which had revenue of $2,367 and acquisition revenue adjustments of $0 for the six months ended March 31, 2020. 3. Merchant Services includes purchased portfolios which had revenue of $6,877, acquisition revenue adjustments of $0 and interchange and network fees of $3,299 for the six months ended March 31, 2019. 27 4. Effective July 1, 2020, the Company reassigned a component from the Proprietary Software and Payments segment to the Merchant Services segment to better align the Company's business within its segments. The prior period comparatives have been retroactively adjusted to reflect the Company's current segment presentation.
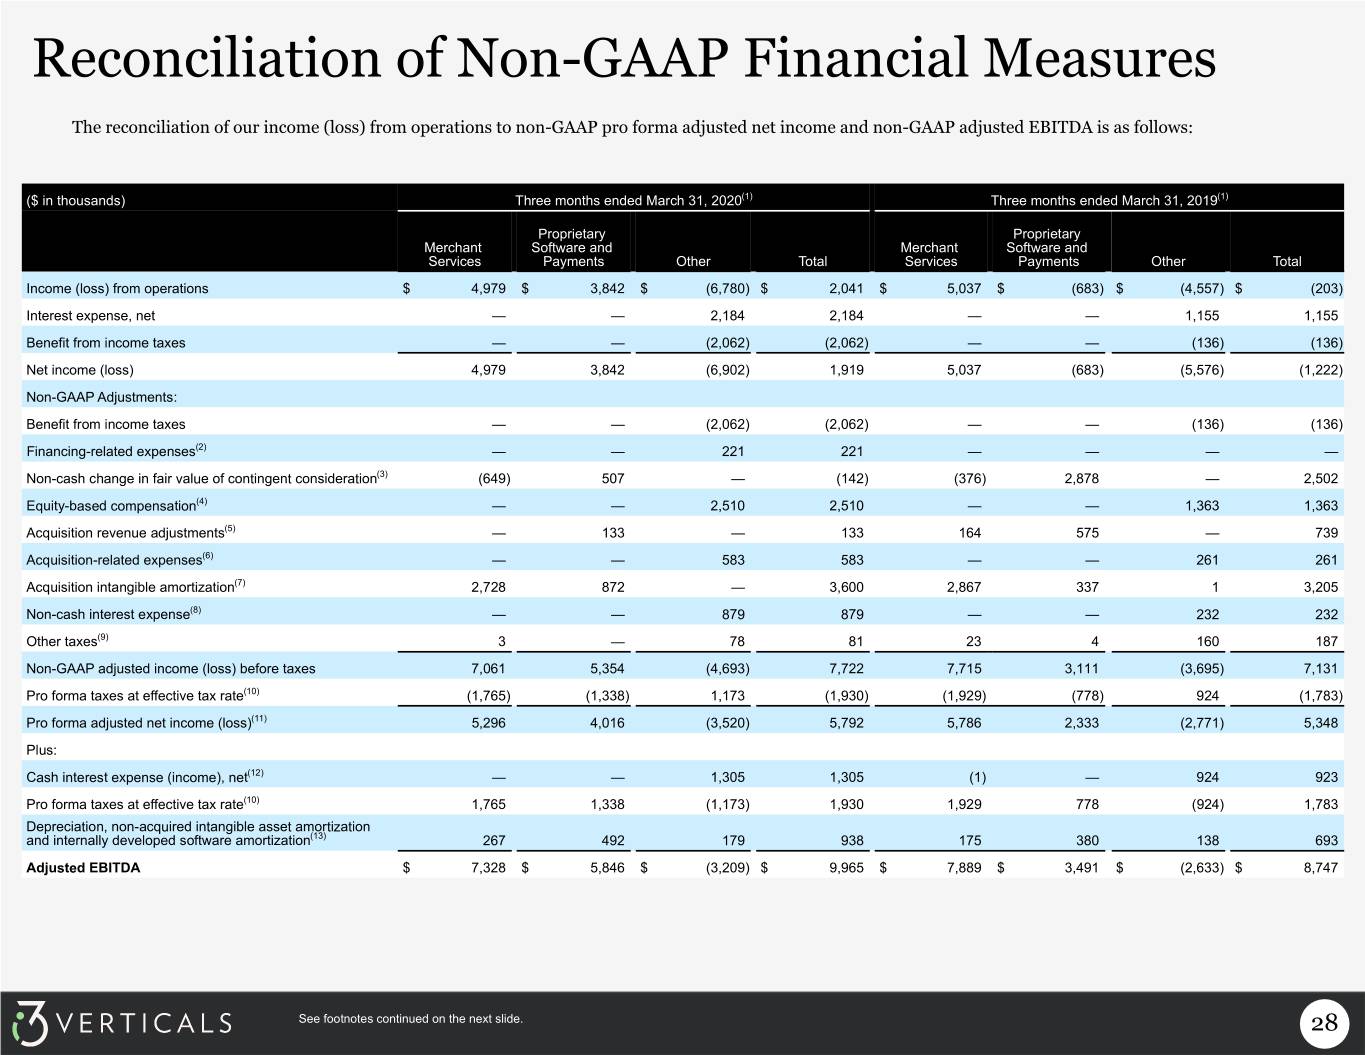
Reconciliation of Non-GAAP Financial Measures The reconciliation of our income (loss) from operations to non-GAAP pro forma adjusted net income and non-GAAP adjusted EBITDA is as follows: ($ in thousands) Three months ended March 31, 2020(1) Three months ended March 31, 2019(1) Proprietary Proprietary Merchant Software and Merchant Software and Services Payments Other Total Services Payments Other Total Income (loss) from operations $ 4,979 $ 3,842 $ (6,780) $ 2,041 $ 5,037 $ (683) $ (4,557) $ (203) Interest expense, net — — 2,184 2,184 — — 1,155 1,155 Benefit from income taxes — — (2,062) (2,062) — — (136) (136) Net income (loss) 4,979 3,842 (6,902) 1,919 5,037 (683) (5,576) (1,222) Non-GAAP Adjustments: Benefit from income taxes — — (2,062) (2,062) — — (136) (136) Financing-related expenses(2) — — 221 221 — — — — Non-cash change in fair value of contingent consideration(3) (649) 507 — (142) (376) 2,878 — 2,502 Equity-based compensation(4) — — 2,510 2,510 — — 1,363 1,363 Acquisition revenue adjustments(5) — 133 — 133 164 575 — 739 Acquisition-related expenses(6) — — 583 583 — — 261 261 Acquisition intangible amortization(7) 2,728 872 — 3,600 2,867 337 1 3,205 Non-cash interest expense(8) — — 879 879 — — 232 232 Other taxes(9) 3 — 78 81 23 4 160 187 Non-GAAP adjusted income (loss) before taxes 7,061 5,354 (4,693) 7,722 7,715 3,111 (3,695) 7,131 Pro forma taxes at effective tax rate(10) (1,765) (1,338) 1,173 (1,930) (1,929) (778) 924 (1,783) Pro forma adjusted net income (loss)(11) 5,296 4,016 (3,520) 5,792 5,786 2,333 (2,771) 5,348 Plus: Cash interest expense (income), net(12) — — 1,305 1,305 (1) — 924 923 Pro forma taxes at effective tax rate(10) 1,765 1,338 (1,173) 1,930 1,929 778 (924) 1,783 Depreciation, non-acquired intangible asset amortization and internally developed software amortization(13) 267 492 179 938 175 380 138 693 Adjusted EBITDA $ 7,328 $ 5,846 $ (3,209) $ 9,965 $ 7,889 $ 3,491 $ (2,633) $ 8,747 See footnotes continued on the next slide. 28
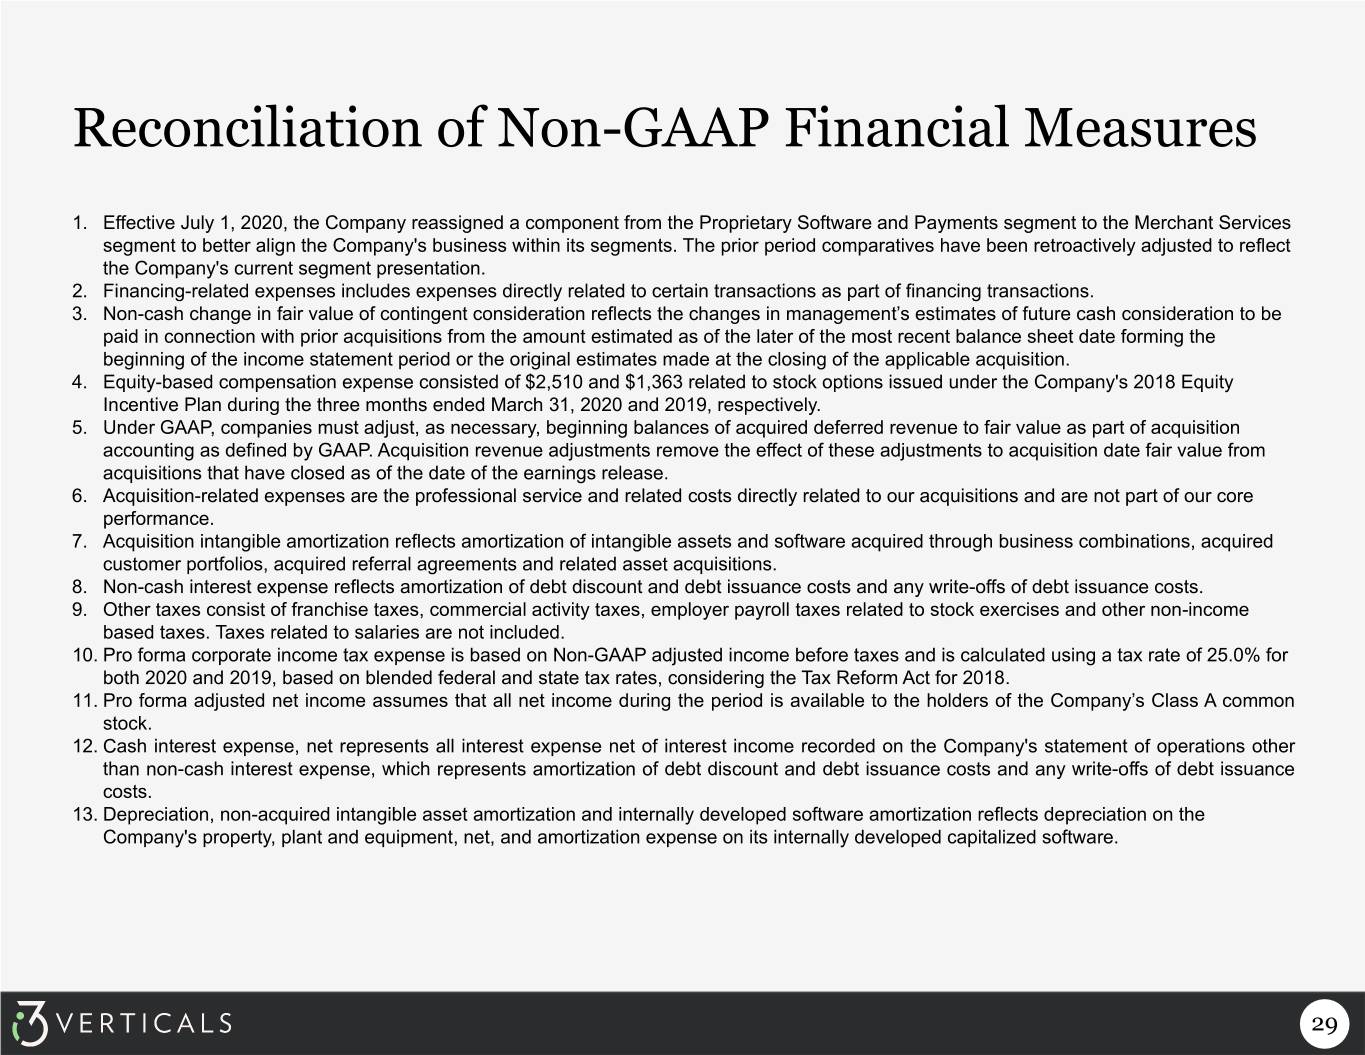
Reconciliation of Non-GAAP Financial Measures 1. Effective July 1, 2020, the Company reassigned a component from the Proprietary Software and Payments segment to the Merchant Services segment to better align the Company's business within its segments. The prior period comparatives have been retroactively adjusted to reflect the Company's current segment presentation. 2. Financing-related expenses includes expenses directly related to certain transactions as part of financing transactions. 3. Non-cash change in fair value of contingent consideration reflects the changes in management’s estimates of future cash consideration to be paid in connection with prior acquisitions from the amount estimated as of the later of the most recent balance sheet date forming the beginning of the income statement period or the original estimates made at the closing of the applicable acquisition. 4. Equity-based compensation expense consisted of $2,510 and $1,363 related to stock options issued under the Company's 2018 Equity Incentive Plan during the three months ended March 31, 2020 and 2019, respectively. 5. Under GAAP, companies must adjust, as necessary, beginning balances of acquired deferred revenue to fair value as part of acquisition accounting as defined by GAAP. Acquisition revenue adjustments remove the effect of these adjustments to acquisition date fair value from acquisitions that have closed as of the date of the earnings release. 6. Acquisition-related expenses are the professional service and related costs directly related to our acquisitions and are not part of our core performance. 7. Acquisition intangible amortization reflects amortization of intangible assets and software acquired through business combinations, acquired customer portfolios, acquired referral agreements and related asset acquisitions. 8. Non-cash interest expense reflects amortization of debt discount and debt issuance costs and any write-offs of debt issuance costs. 9. Other taxes consist of franchise taxes, commercial activity taxes, employer payroll taxes related to stock exercises and other non-income based taxes. Taxes related to salaries are not included. 10. Pro forma corporate income tax expense is based on Non-GAAP adjusted income before taxes and is calculated using a tax rate of 25.0% for both 2020 and 2019, based on blended federal and state tax rates, considering the Tax Reform Act for 2018. 11. Pro forma adjusted net income assumes that all net income during the period is available to the holders of the Company’s Class A common stock. 12. Cash interest expense, net represents all interest expense net of interest income recorded on the Company's statement of operations other than non-cash interest expense, which represents amortization of debt discount and debt issuance costs and any write-offs of debt issuance costs. 13. Depreciation, non-acquired intangible asset amortization and internally developed software amortization reflects depreciation on the Company's property, plant and equipment, net, and amortization expense on its internally developed capitalized software. 29
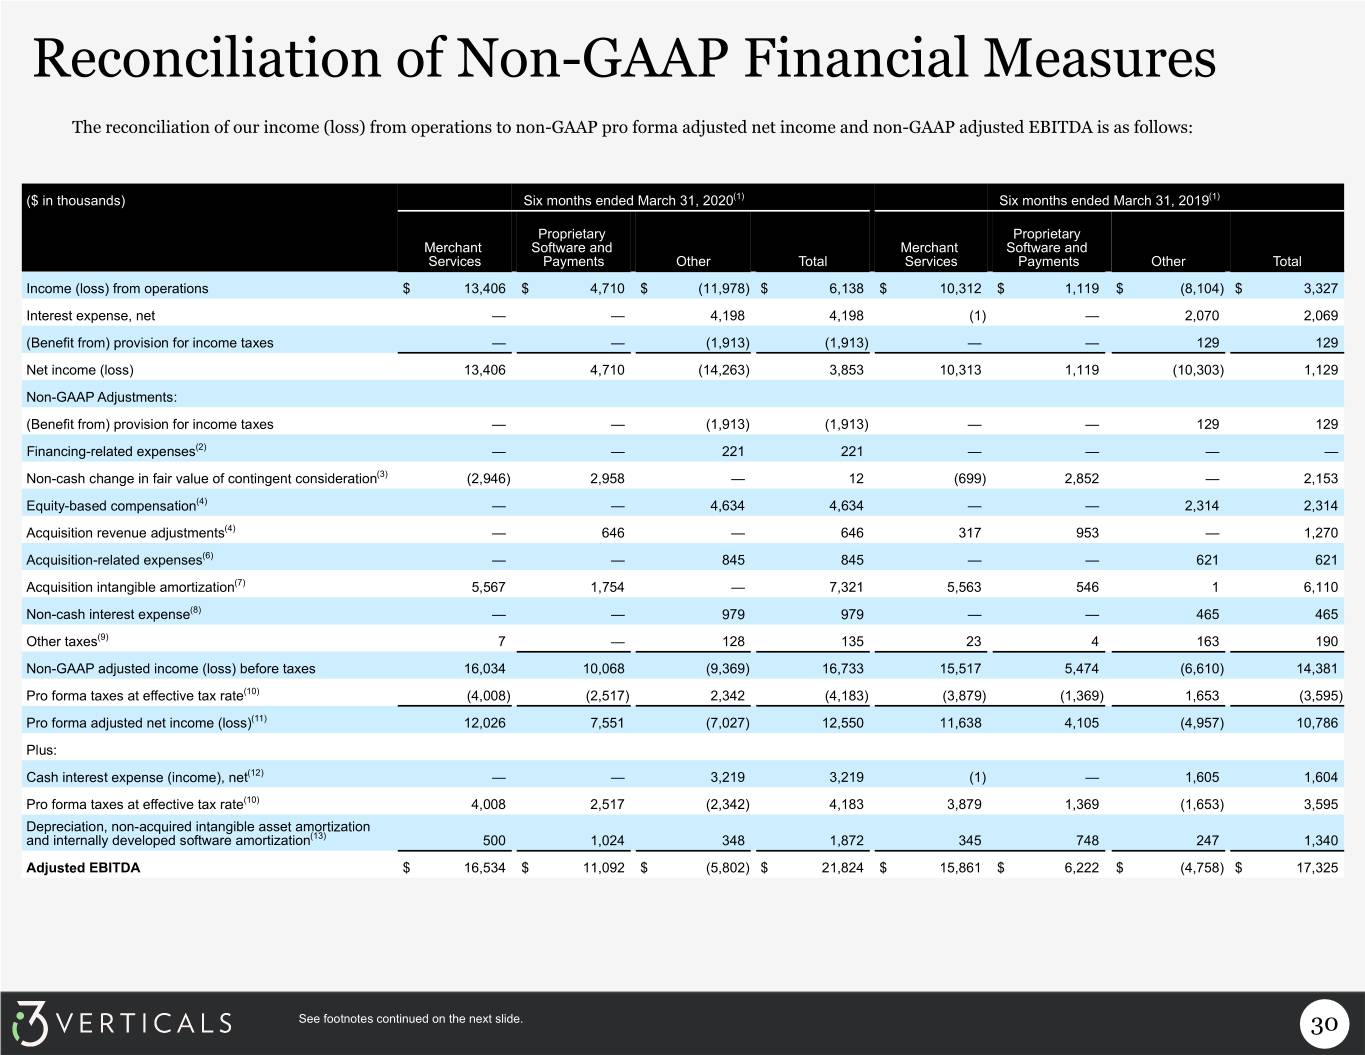
Reconciliation of Non-GAAP Financial Measures The reconciliation of our income (loss) from operations to non-GAAP pro forma adjusted net income and non-GAAP adjusted EBITDA is as follows: ($ in thousands) Six months ended March 31, 2020(1) Six months ended March 31, 2019(1) Proprietary Proprietary Merchant Software and Merchant Software and Services Payments Other Total Services Payments Other Total Income (loss) from operations $ 13,406 $ 4,710 $ (11,978) $ 6,138 $ 10,312 $ 1,119 $ (8,104) $ 3,327 Interest expense, net — — 4,198 4,198 (1) — 2,070 2,069 (Benefit from) provision for income taxes — — (1,913) (1,913) — — 129 129 Net income (loss) 13,406 4,710 (14,263) 3,853 10,313 1,119 (10,303) 1,129 Non-GAAP Adjustments: (Benefit from) provision for income taxes — — (1,913) (1,913) — — 129 129 Financing-related expenses(2) — — 221 221 — — — — Non-cash change in fair value of contingent consideration(3) (2,946) 2,958 — 12 (699) 2,852 — 2,153 Equity-based compensation(4) — — 4,634 4,634 — — 2,314 2,314 Acquisition revenue adjustments(4) — 646 — 646 317 953 — 1,270 Acquisition-related expenses(6) — — 845 845 — — 621 621 Acquisition intangible amortization(7) 5,567 1,754 — 7,321 5,563 546 1 6,110 Non-cash interest expense(8) — — 979 979 — — 465 465 Other taxes(9) 7 — 128 135 23 4 163 190 Non-GAAP adjusted income (loss) before taxes 16,034 10,068 (9,369) 16,733 15,517 5,474 (6,610) 14,381 Pro forma taxes at effective tax rate(10) (4,008) (2,517) 2,342 (4,183) (3,879) (1,369) 1,653 (3,595) Pro forma adjusted net income (loss)(11) 12,026 7,551 (7,027) 12,550 11,638 4,105 (4,957) 10,786 Plus: Cash interest expense (income), net(12) — — 3,219 3,219 (1) — 1,605 1,604 Pro forma taxes at effective tax rate(10) 4,008 2,517 (2,342) 4,183 3,879 1,369 (1,653) 3,595 Depreciation, non-acquired intangible asset amortization and internally developed software amortization(13) 500 1,024 348 1,872 345 748 247 1,340 Adjusted EBITDA $ 16,534 $ 11,092 $ (5,802) $ 21,824 $ 15,861 $ 6,222 $ (4,758) $ 17,325 See footnotes continued on the next slide. 30

Reconciliation of Non-GAAP Financial Measures 1. Effective July 1, 2020, the Company reassigned a component from the Proprietary Software and Payments segment to the Merchant Services segment to better align the Company's business within its segments. The prior period comparatives have been retroactively adjusted to reflect the Company's current segment presentation. 2. Financing-related expenses includes expenses directly related to certain transactions as part of financing transactions. 3. Non-cash change in fair value of contingent consideration reflects the changes in management’s estimates of future cash consideration to be paid in connection with prior acquisitions from the amount estimated as of the later of the most recent balance sheet date forming the beginning of the income statement period or the original estimates made at the closing of the applicable acquisition. 4. Equity-based compensation expense consisted of $4,634 and $2,314 related to stock options issued under the Company's 2018 Equity Incentive Plan during the six months ended March 31, 2020 and 2019, respectively. 5. Under GAAP, companies must adjust, as necessary, beginning balances of acquired deferred revenue to fair value as part of acquisition accounting as defined by GAAP. Acquisition revenue adjustments remove the effect of these adjustments to acquisition date fair value from acquisitions that have closed as of the date of the earnings release. 6. Acquisition-related expenses are the professional service and related costs directly related to our acquisitions and are not part of our core performance. 7. Acquisition intangible amortization reflects amortization of intangible assets and software acquired through business combinations, acquired customer portfolios, acquired referral agreements and related asset acquisitions. 8. Non-cash interest expense reflects amortization of debt discount and debt issuance costs and any write-offs of debt issuance costs. 9. Other taxes consist of franchise taxes, commercial activity taxes, employer payroll taxes related to stock exercises and other non-income based taxes. Taxes related to salaries are not included. 10. Pro forma corporate income tax expense is based on Non-GAAP adjusted income before taxes and is calculated using a tax rate of 25.0% for both 2020 and 2019, based on blended federal and state tax rates. 11. Pro forma adjusted net income assumes that all net income during the period is available to the holders of the Company’s Class A common stock. 12. Cash interest expense, net represents all interest expense net of interest income recorded on the Company's statement of operations other than non-cash interest expense, which represents amortization of debt discount and debt issuance costs and any write-offs of debt issuance costs. 13. Depreciation, non-acquired intangible asset amortization and internally developed software amortization reflects depreciation on the Company's property, plant and equipment, net, and amortization expense on its internally developed capitalized software. 31
Q1 Fiscal 2020 Supplemental Information
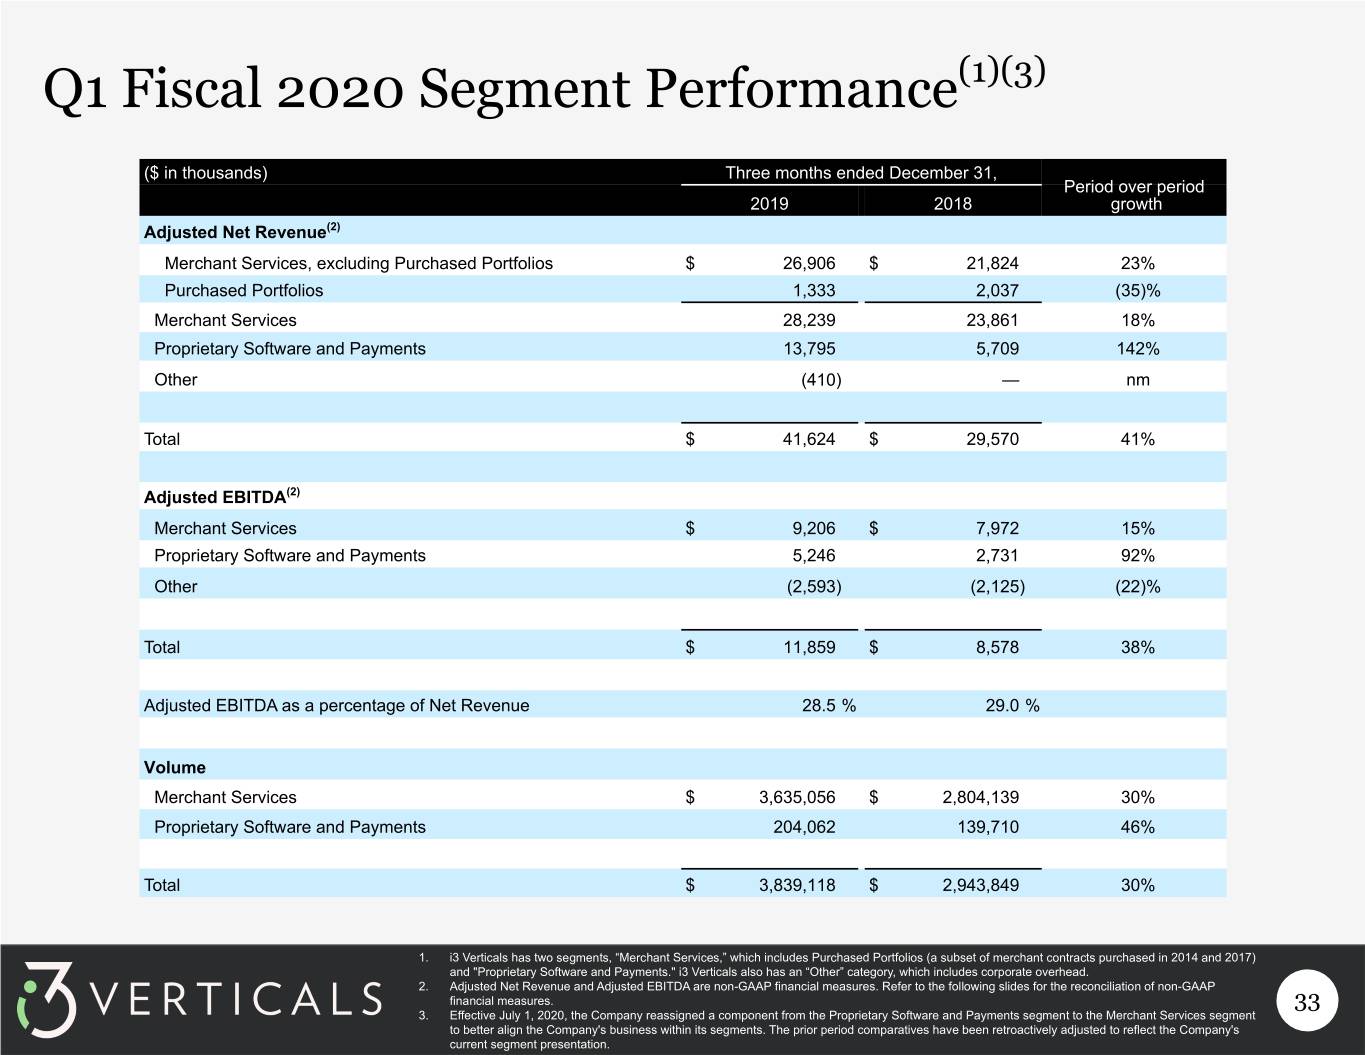
Q1 Fiscal 2020 Segment Performance(1)(3) ($ in thousands) Three months ended December 31, Period over period 2019 2018 growth Adjusted Net Revenue(2) Merchant Services, excluding Purchased Portfolios $ 26,906 $ 21,824 23% Purchased Portfolios 1,333 2,037 (35)% Merchant Services 28,239 23,861 18% Proprietary Software and Payments 13,795 5,709 142% Other (410) — nm Total $ 41,624 $ 29,570 41% Adjusted EBITDA(2) Merchant Services $ 9,206 $ 7,972 15% Proprietary Software and Payments 5,246 2,731 92% Other (2,593) (2,125) (22)% Total $ 11,859 $ 8,578 38% Adjusted EBITDA as a percentage of Net Revenue 28.5 % 29.0 % Volume Merchant Services $ 3,635,056 $ 2,804,139 30% Proprietary Software and Payments 204,062 139,710 46% Total $ 3,839,118 $ 2,943,849 30% 1. i3 Verticals has two segments, “Merchant Services,” which includes Purchased Portfolios (a subset of merchant contracts purchased in 2014 and 2017) and "Proprietary Software and Payments." i3 Verticals also has an “Other” category, which includes corporate overhead. 2. Adjusted Net Revenue and Adjusted EBITDA are non-GAAP financial measures. Refer to the following slides for the reconciliation of non-GAAP financial measures. 33 3. Effective July 1, 2020, the Company reassigned a component from the Proprietary Software and Payments segment to the Merchant Services segment to better align the Company's business within its segments. The prior period comparatives have been retroactively adjusted to reflect the Company's current segment presentation.
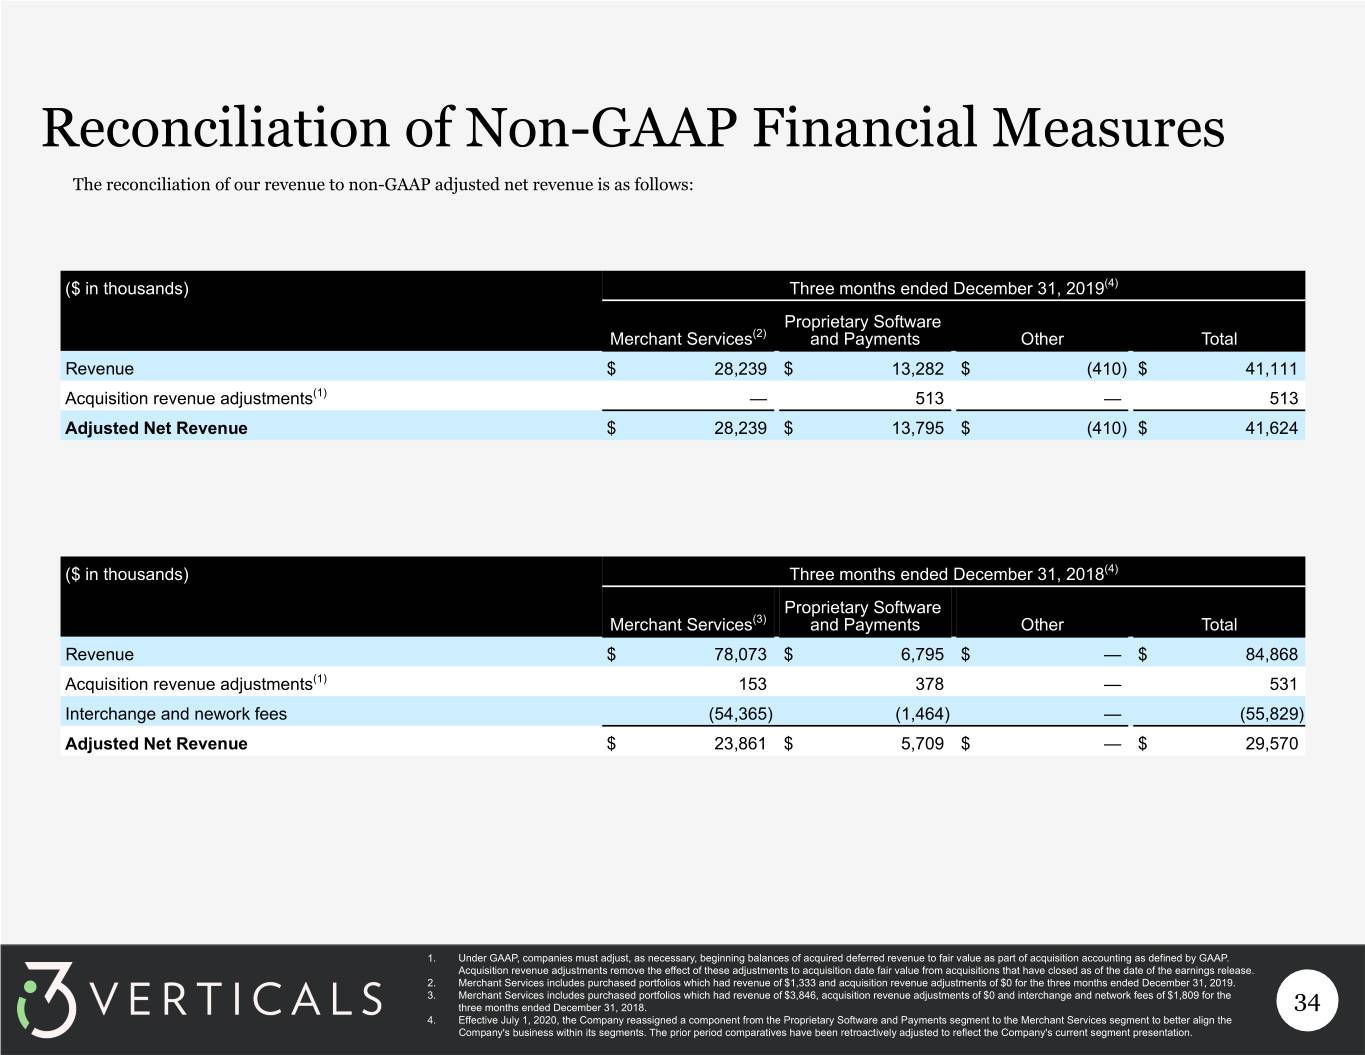
Reconciliation of Non-GAAP Financial Measures The reconciliation of our revenue to non-GAAP adjusted net revenue is as follows: ($ in thousands) Three months ended December 31, 2019(4) Proprietary Software Merchant Services(2) and Payments Other Total Revenue $ 28,239 $ 13,282 $ (410) $ 41,111 Acquisition revenue adjustments(1) — 513 — 513 Adjusted Net Revenue $ 28,239 $ 13,795 $ (410) $ 41,624 ($ in thousands) Three months ended December 31, 2018(4) Proprietary Software Merchant Services(3) and Payments Other Total Revenue $ 78,073 $ 6,795 $ — $ 84,868 Acquisition revenue adjustments(1) 153 378 — 531 Interchange and nework fees (54,365) (1,464) — (55,829) Adjusted Net Revenue $ 23,861 $ 5,709 $ — $ 29,570 1. Under GAAP, companies must adjust, as necessary, beginning balances of acquired deferred revenue to fair value as part of acquisition accounting as defined by GAAP. Acquisition revenue adjustments remove the effect of these adjustments to acquisition date fair value from acquisitions that have closed as of the date of the earnings release. 2. Merchant Services includes purchased portfolios which had revenue of $1,333 and acquisition revenue adjustments of $0 for the three months ended December 31, 2019. 3. Merchant Services includes purchased portfolios which had revenue of $3,846, acquisition revenue adjustments of $0 and interchange and network fees of $1,809 for the three months ended December 31, 2018. 34 4. Effective July 1, 2020, the Company reassigned a component from the Proprietary Software and Payments segment to the Merchant Services segment to better align the Company's business within its segments. The prior period comparatives have been retroactively adjusted to reflect the Company's current segment presentation.
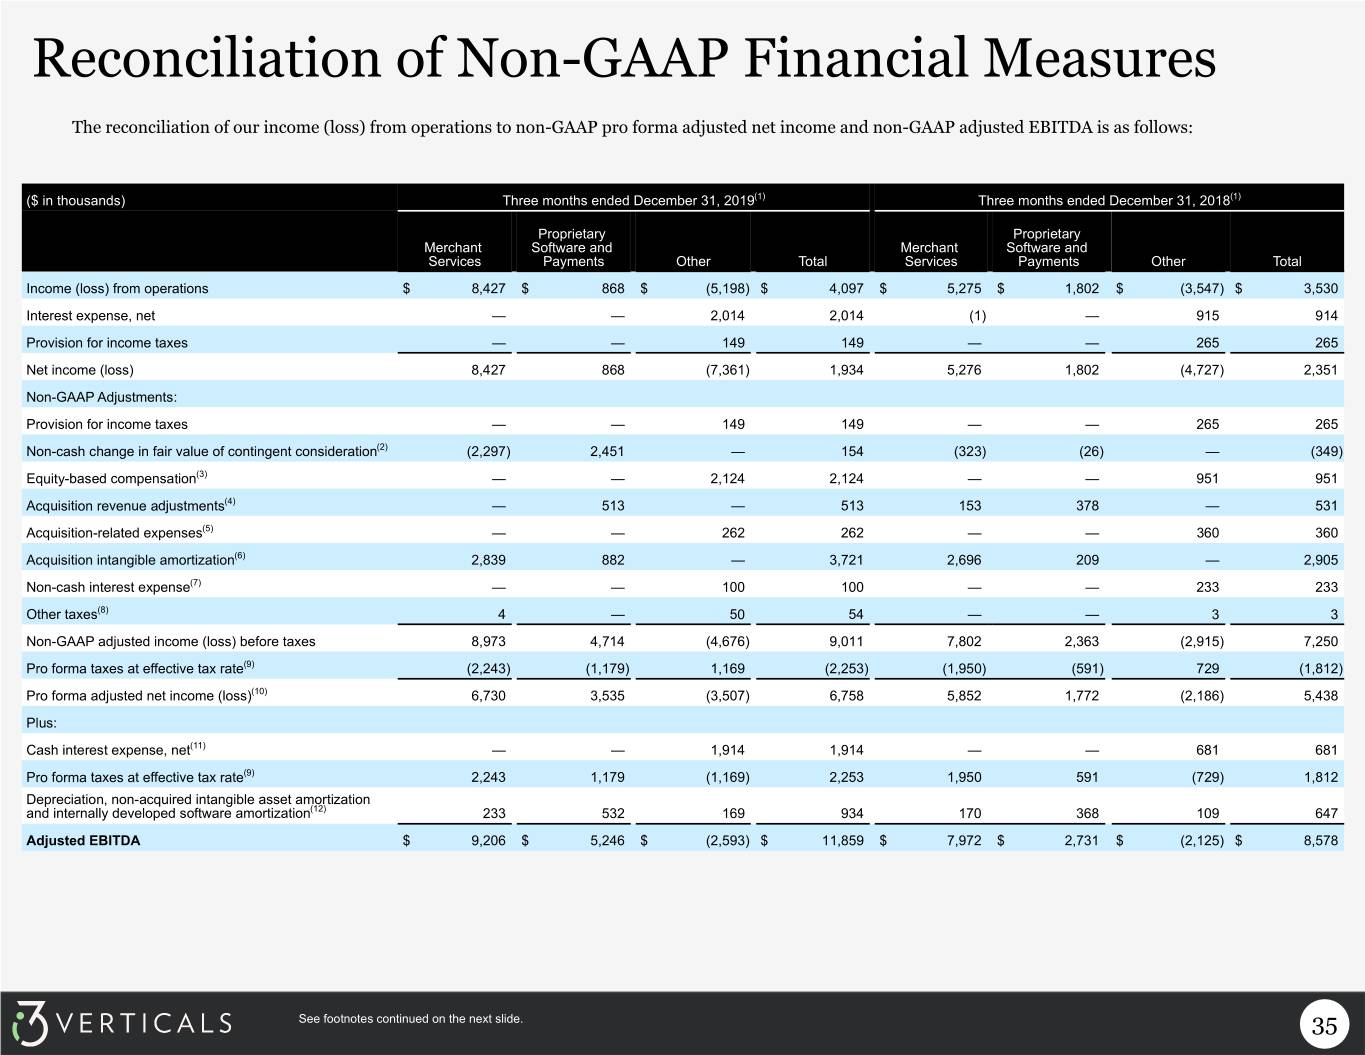
Reconciliation of Non-GAAP Financial Measures The reconciliation of our income (loss) from operations to non-GAAP pro forma adjusted net income and non-GAAP adjusted EBITDA is as follows: ($ in thousands) Three months ended December 31, 2019(1) Three months ended December 31, 2018(1) Proprietary Proprietary Merchant Software and Merchant Software and Services Payments Other Total Services Payments Other Total Income (loss) from operations $ 8,427 $ 868 $ (5,198) $ 4,097 $ 5,275 $ 1,802 $ (3,547) $ 3,530 Interest expense, net — — 2,014 2,014 (1) — 915 914 Provision for income taxes — — 149 149 — — 265 265 Net income (loss) 8,427 868 (7,361) 1,934 5,276 1,802 (4,727) 2,351 Non-GAAP Adjustments: Provision for income taxes — — 149 149 — — 265 265 Non-cash change in fair value of contingent consideration(2) (2,297) 2,451 — 154 (323) (26) — (349) Equity-based compensation(3) — — 2,124 2,124 — — 951 951 Acquisition revenue adjustments(4) — 513 — 513 153 378 — 531 Acquisition-related expenses(5) — — 262 262 — — 360 360 Acquisition intangible amortization(6) 2,839 882 — 3,721 2,696 209 — 2,905 Non-cash interest expense(7) — — 100 100 — — 233 233 Other taxes(8) 4 — 50 54 — — 3 3 Non-GAAP adjusted income (loss) before taxes 8,973 4,714 (4,676) 9,011 7,802 2,363 (2,915) 7,250 Pro forma taxes at effective tax rate(9) (2,243) (1,179) 1,169 (2,253) (1,950) (591) 729 (1,812) Pro forma adjusted net income (loss)(10) 6,730 3,535 (3,507) 6,758 5,852 1,772 (2,186) 5,438 Plus: Cash interest expense, net(11) — — 1,914 1,914 — — 681 681 Pro forma taxes at effective tax rate(9) 2,243 1,179 (1,169) 2,253 1,950 591 (729) 1,812 Depreciation, non-acquired intangible asset amortization and internally developed software amortization(12) 233 532 169 934 170 368 109 647 Adjusted EBITDA $ 9,206 $ 5,246 $ (2,593) $ 11,859 $ 7,972 $ 2,731 $ (2,125) $ 8,578 See footnotes continued on the next slide. 35
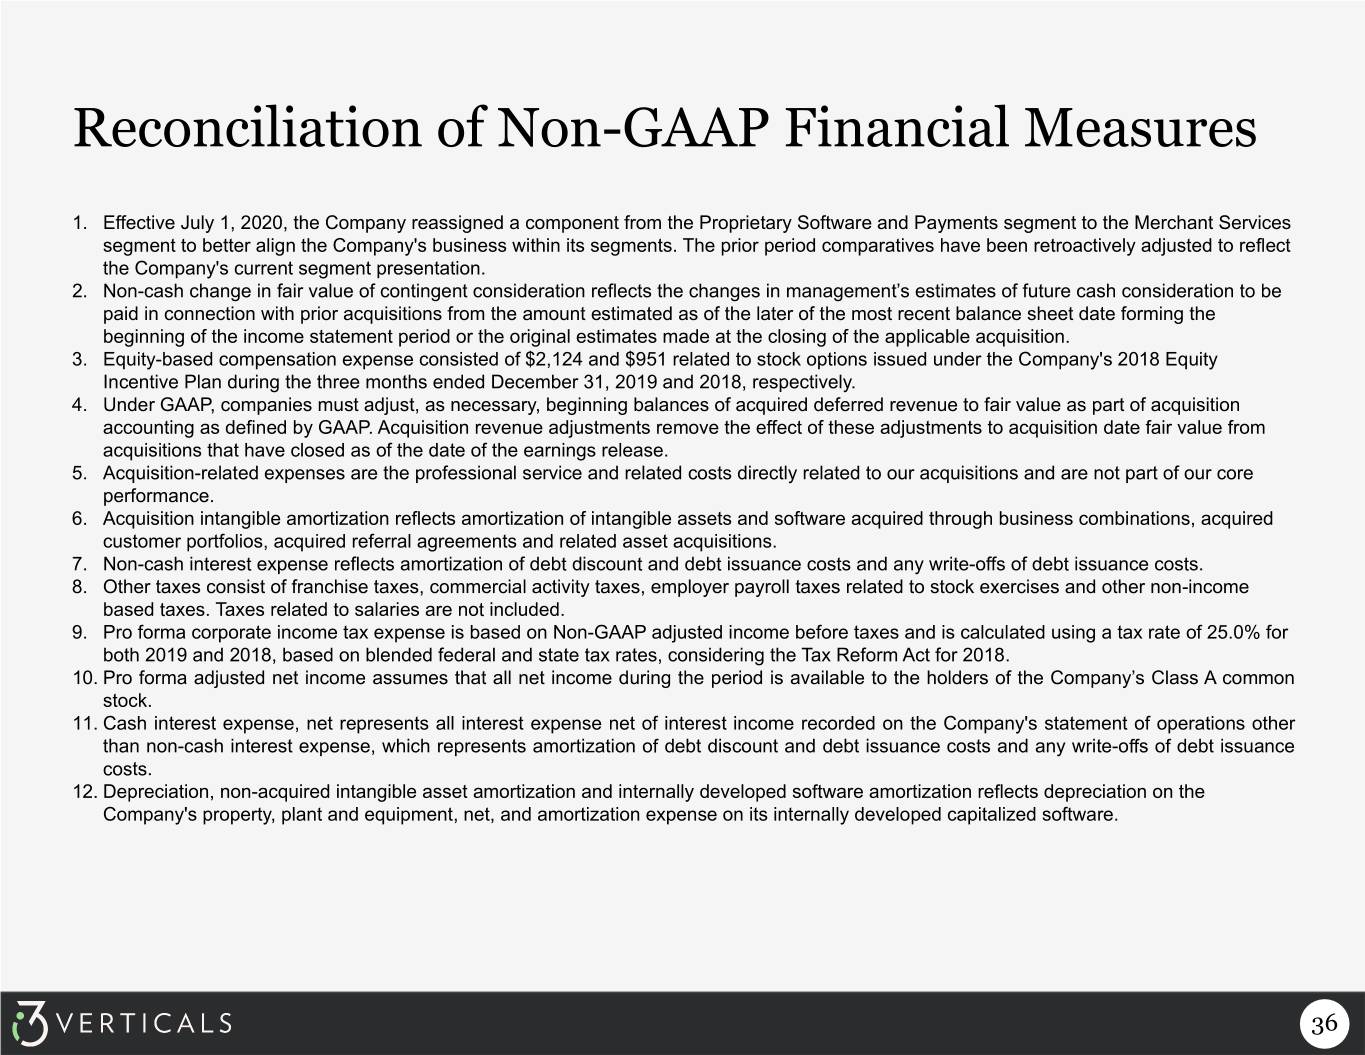
Reconciliation of Non-GAAP Financial Measures 1. Effective July 1, 2020, the Company reassigned a component from the Proprietary Software and Payments segment to the Merchant Services segment to better align the Company's business within its segments. The prior period comparatives have been retroactively adjusted to reflect the Company's current segment presentation. 2. Non-cash change in fair value of contingent consideration reflects the changes in management’s estimates of future cash consideration to be paid in connection with prior acquisitions from the amount estimated as of the later of the most recent balance sheet date forming the beginning of the income statement period or the original estimates made at the closing of the applicable acquisition. 3. Equity-based compensation expense consisted of $2,124 and $951 related to stock options issued under the Company's 2018 Equity Incentive Plan during the three months ended December 31, 2019 and 2018, respectively. 4. Under GAAP, companies must adjust, as necessary, beginning balances of acquired deferred revenue to fair value as part of acquisition accounting as defined by GAAP. Acquisition revenue adjustments remove the effect of these adjustments to acquisition date fair value from acquisitions that have closed as of the date of the earnings release. 5. Acquisition-related expenses are the professional service and related costs directly related to our acquisitions and are not part of our core performance. 6. Acquisition intangible amortization reflects amortization of intangible assets and software acquired through business combinations, acquired customer portfolios, acquired referral agreements and related asset acquisitions. 7. Non-cash interest expense reflects amortization of debt discount and debt issuance costs and any write-offs of debt issuance costs. 8. Other taxes consist of franchise taxes, commercial activity taxes, employer payroll taxes related to stock exercises and other non-income based taxes. Taxes related to salaries are not included. 9. Pro forma corporate income tax expense is based on Non-GAAP adjusted income before taxes and is calculated using a tax rate of 25.0% for both 2019 and 2018, based on blended federal and state tax rates, considering the Tax Reform Act for 2018. 10. Pro forma adjusted net income assumes that all net income during the period is available to the holders of the Company’s Class A common stock. 11. Cash interest expense, net represents all interest expense net of interest income recorded on the Company's statement of operations other than non-cash interest expense, which represents amortization of debt discount and debt issuance costs and any write-offs of debt issuance costs. 12. Depreciation, non-acquired intangible asset amortization and internally developed software amortization reflects depreciation on the Company's property, plant and equipment, net, and amortization expense on its internally developed capitalized software. 36
