Attached files
| file | filename |
|---|---|
| EX-99.1 - EX-99.1 - BEACON ROOFING SUPPLY INC | becn-ex991_7.htm |
| 8-K - 8-K - BEACON ROOFING SUPPLY INC | becn-8k_20201119.htm |

November 19, 2020 2020 4th quarter earnings call Exhibit 99.2
Disclosure notice This presentation contains information about management's view of the Company's future expectations, plans and prospects that constitute forward-looking statements for purposes of the safe harbor provisions under the Private Securities Litigation Reform Act of 1995. Actual results may differ materially from those indicated by such forward-looking statements as a result of various important factors, including, but not limited to, those set forth in the "Risk Factors" section of the Company's Form 10-K for the fiscal year ended September 30, 2019 and Form 10-Q for the quarter ended June 30, 2020. In addition, the forward-looking statements included in this press release represent the Company's views as of the date of this press release and these views could change. However, while the Company may elect to update these forward-looking statements at some point, the Company specifically disclaims any obligation to do so, other than as required by federal securities laws. These forward-looking statements should not be relied upon as representing the Company's views as of any date subsequent to the date of this presentation. This presentation contains references to certain financial measures that are not presented in accordance with United States Generally Accepted Accounting Principles (“GAAP"). The Company uses non-GAAP financial measures to evaluate financial performance, analyze underlying business trends and establish operational goals and forecasts that are used when allocating resources. The Company believes these non-GAAP financial measures permit investors to better understand changes over comparative periods by providing financial results that are unaffected by certain items that are not indicative of ongoing operating performance. While the Company believes these measures are useful to investors when evaluating performance, they are not prepared and presented in accordance with GAAP, and therefore should be considered supplemental in nature. The Company’s non-GAAP financial measures should not be considered in isolation or as a substitute for other financial performance measures presented in accordance with GAAP. These non-GAAP financial measures may have material limitations including, but not limited to, the exclusion of certain costs without a corresponding reduction of net income for the income generated by the assets to which the excluded costs are related. In addition, these non-GAAP financial measures may differ from similarly titled measures presented by other companies. A reconciliation of these non-GAAP financial measures to their most directly comparable GAAP financial measure can be found in the Appendix as well as Company’s latest Form 8-K, filed with the SEC on November 19, 2020.

President & chief executive officer Julian francis
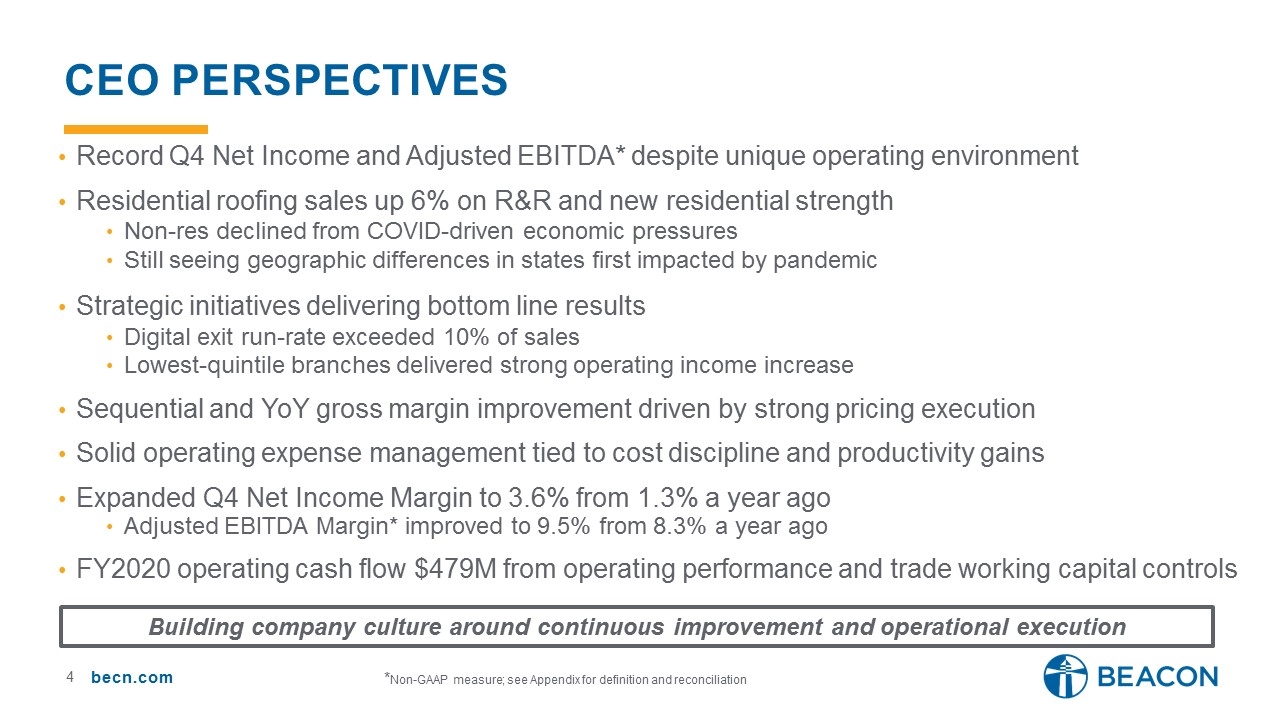
Record Q4 Net Income and Adjusted EBITDA* despite unique operating environment Residential roofing sales up 6% on R&R and new residential strength Non-res declined from COVID-driven economic pressures Still seeing geographic differences in states first impacted by pandemic Strategic initiatives delivering bottom line results Digital exit run-rate exceeded 10% of sales Lowest-quintile branches delivered strong operating income increase Sequential and YoY gross margin improvement driven by strong pricing execution Solid operating expense management tied to cost discipline and productivity gains Expanded Q4 Net Income Margin to 3.6% from 1.3% a year ago Adjusted EBITDA Margin* improved to 9.5% from 8.3% a year ago FY2020 operating cash flow $479M from operating performance and trade working capital controls Ceo perspectiveS *Non-GAAP measure; see Appendix for definition and reconciliation Building company culture around continuous improvement and operational execution
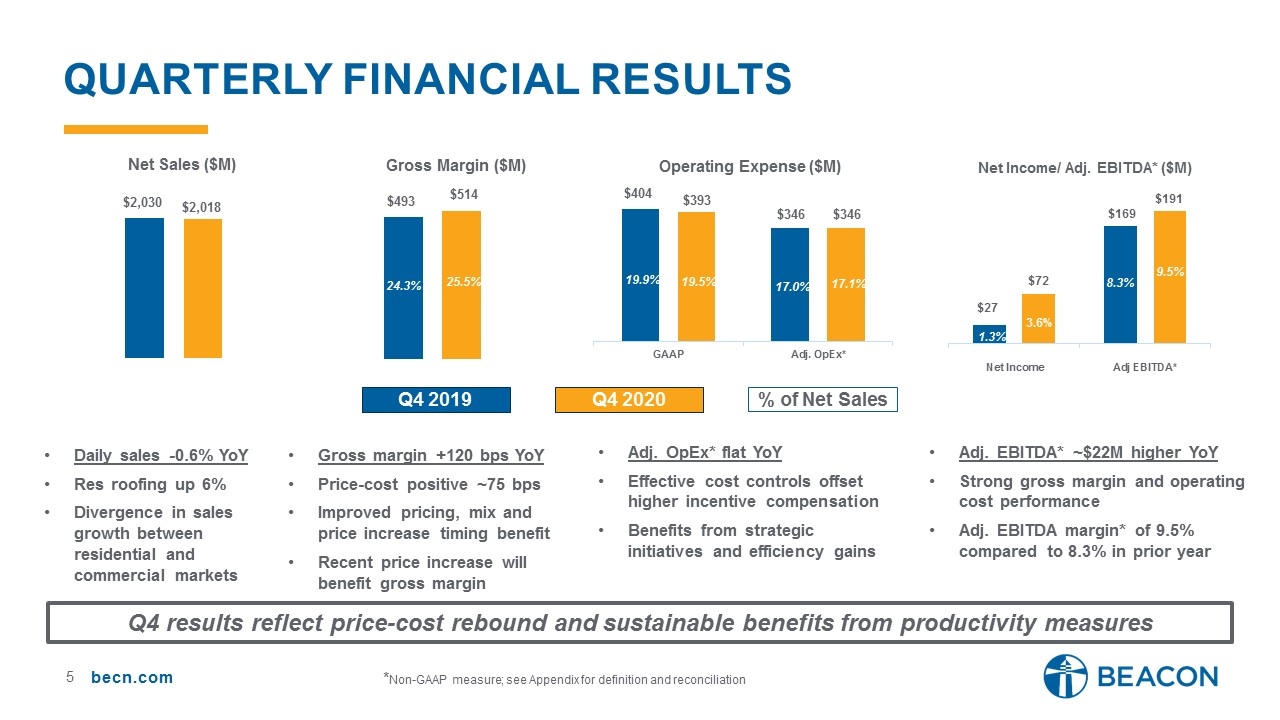
Quarterly Financial results Daily sales -0.6% YoY Res roofing up 6% Divergence in sales growth between residential and commercial markets Gross margin +120 bps YoY Price-cost positive ~75 bps Improved pricing, mix and price increase timing benefit Recent price increase will benefit gross margin Adj. OpEx* flat YoY Effective cost controls offset higher incentive compensation Benefits from strategic initiatives and efficiency gains Adj. EBITDA* ~$22M higher YoY Strong gross margin and operating cost performance Adj. EBITDA margin* of 9.5% compared to 8.3% in prior year Q4 2019 Q4 2020 Q4 results reflect price-cost rebound and sustainable benefits from productivity measures 9.5% % of Net Sales 8.3% *Non-GAAP measure; see Appendix for definition and reconciliation
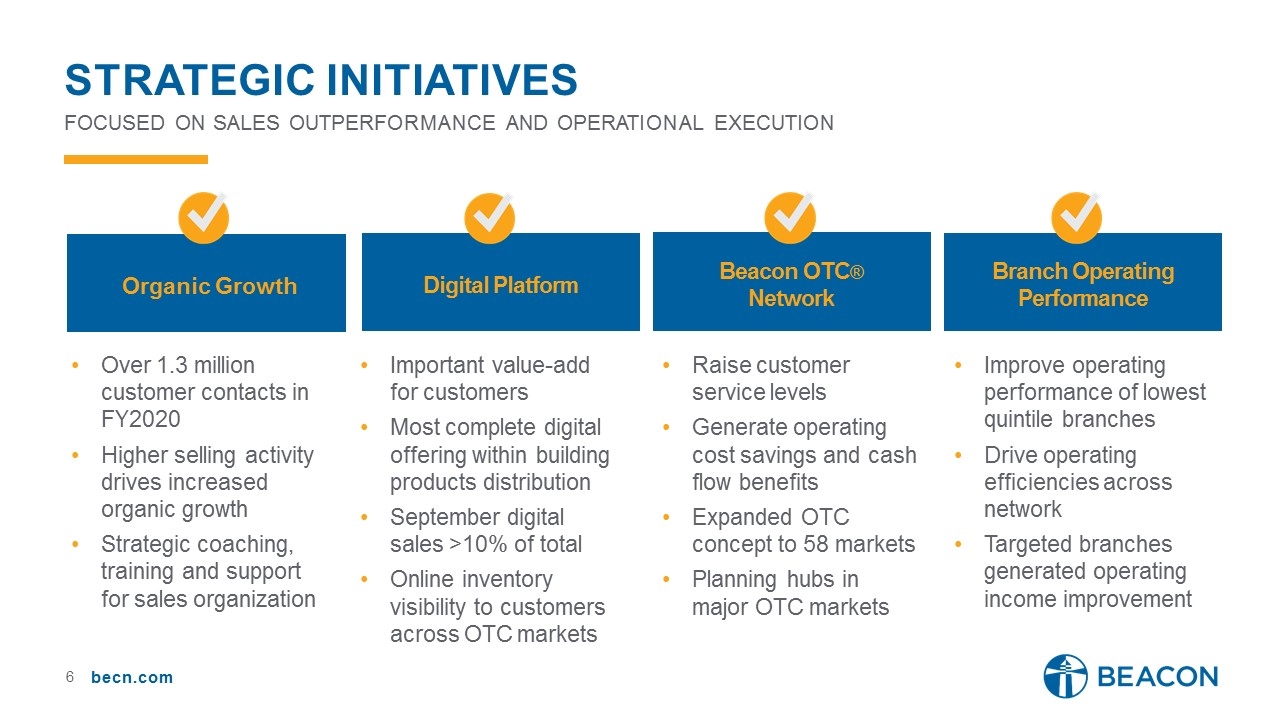
Focused on sales outperformance and operational execution Strategic initiatives Over 1.3 million customer contacts in FY2020 Higher selling activity drives increased organic growth Strategic coaching, training and support for sales organization Organic Growth Branch Operating Performance Improve operating performance of lowest quintile branches Drive operating efficiencies across network Targeted branches generated operating income improvement Raise customer service levels Generate operating cost savings and cash flow benefits Expanded OTC concept to 58 markets Planning hubs in major OTC markets Beacon OTC® Network Important value-add for customers Most complete digital offering within building products distribution September digital sales >10% of total Online inventory visibility to customers across OTC markets Digital Platform

Executive vice president & chief financial officer Frank lonegro
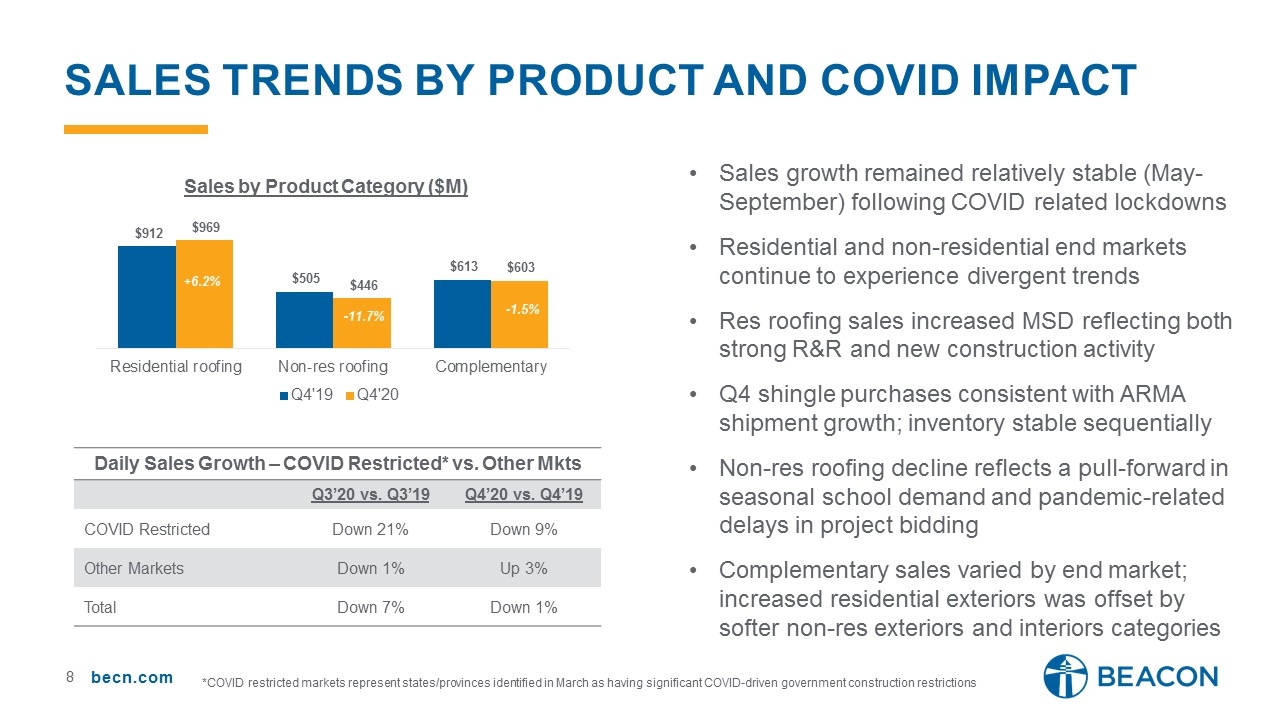
Sales trends by Product and covid impact Sales growth remained relatively stable (May-September) following COVID related lockdowns Residential and non-residential end markets continue to experience divergent trends Res roofing sales increased MSD reflecting both strong R&R and new construction activity Q4 shingle purchases consistent with ARMA shipment growth; inventory stable sequentially Non-res roofing decline reflects a pull-forward in seasonal school demand and pandemic-related delays in project bidding Complementary sales varied by end market; increased residential exteriors was offset by softer non-res exteriors and interiors categories Daily Sales Growth – COVID Restricted* vs. Other Mkts Q3’20 vs. Q3’19 Q4’20 vs. Q4’19 COVID Restricted Down 21% Down 9% Other Markets Down 1% Up 3% Total Down 7% Down 1% *COVID restricted markets represent states/provinces identified in March as having significant COVID-driven government construction restrictions
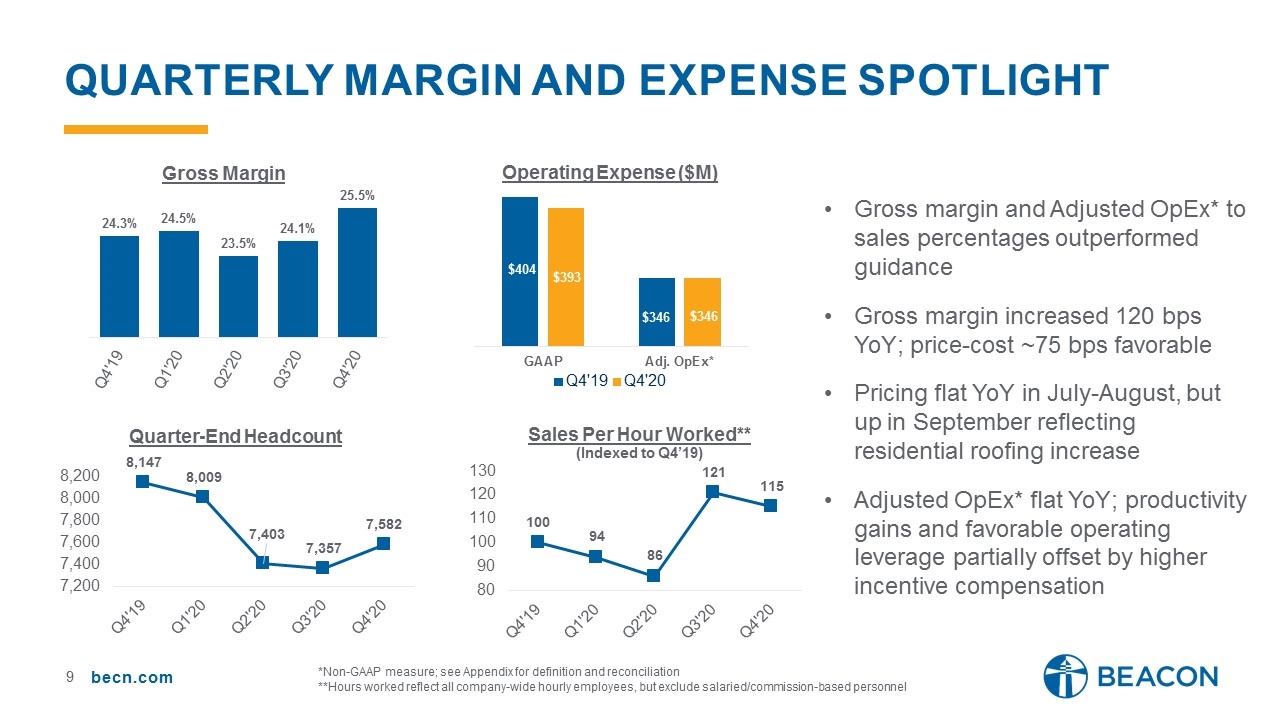
Quarterly Margin and expense spotlight Gross margin and Adjusted OpEx* to sales percentages outperformed guidance Gross margin increased 120 bps YoY; price-cost ~75 bps favorable Pricing flat YoY in July-August, but up in September reflecting residential roofing increase Adjusted OpEx* flat YoY; productivity gains and favorable operating leverage partially offset by higher incentive compensation **Hours worked reflect all company-wide hourly employees, but exclude salaried/commission-based personnel *Non-GAAP measure; see Appendix for definition and reconciliation
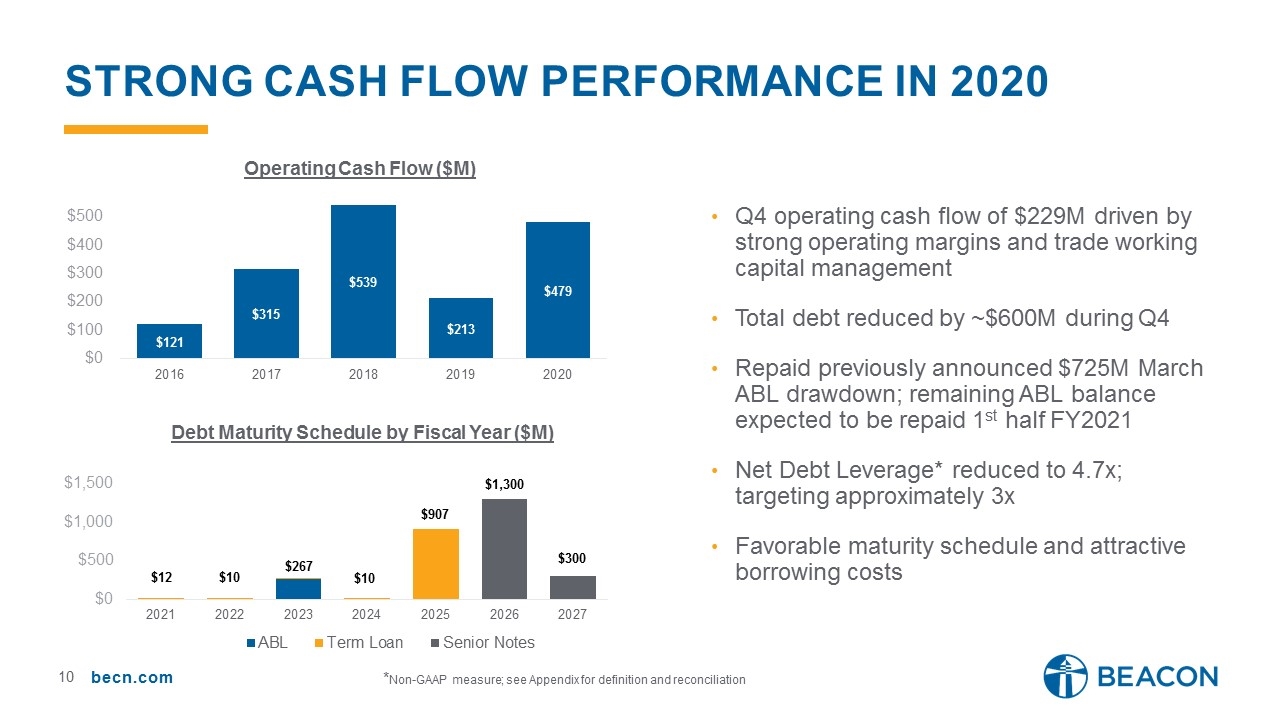
Strong cash flow PERFORMANCE in 2020 Q4 operating cash flow of $229M driven by strong operating margins and trade working capital management Total debt reduced by ~$600M during Q4 Repaid previously announced $725M March ABL drawdown; remaining ABL balance expected to be repaid 1st half FY2021 Net Debt Leverage* reduced to 4.7x; targeting approximately 3x Favorable maturity schedule and attractive borrowing costs *Non-GAAP measure; see Appendix for definition and reconciliation

President & chief executive officer Julian francis
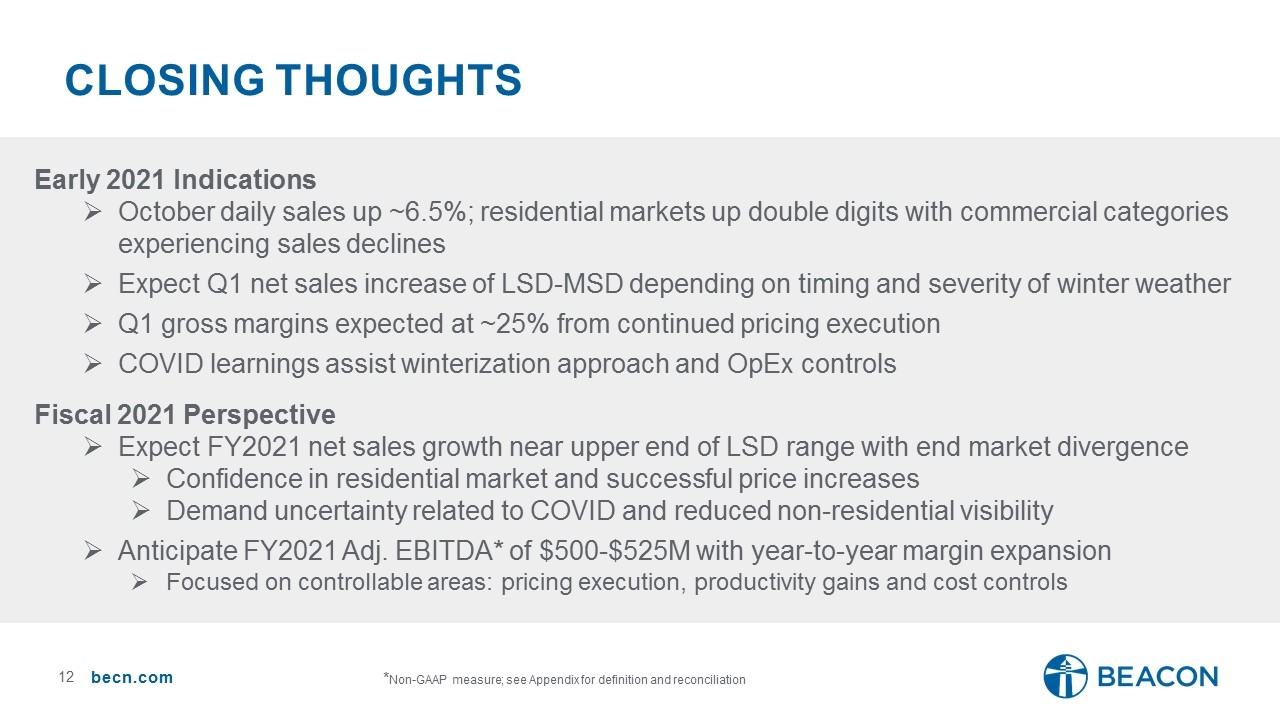
closing thoughts Early 2021 Indications October daily sales up ~6.5%; residential markets up double digits with commercial categories experiencing sales declines Expect Q1 net sales increase of LSD-MSD depending on timing and severity of winter weather Q1 gross margins expected at ~25% from continued pricing execution COVID learnings assist winterization approach and OpEx controls Fiscal 2021 Perspective Expect FY2021 net sales growth near upper end of LSD range with end market divergence Confidence in residential market and successful price increases Demand uncertainty related to COVID and reduced non-residential visibility Anticipate FY2021 Adj. EBITDA* of $500-$525M with year-to-year margin expansion Focused on controllable areas: pricing execution, productivity gains and cost controls *Non-GAAP measure; see Appendix for definition and reconciliation
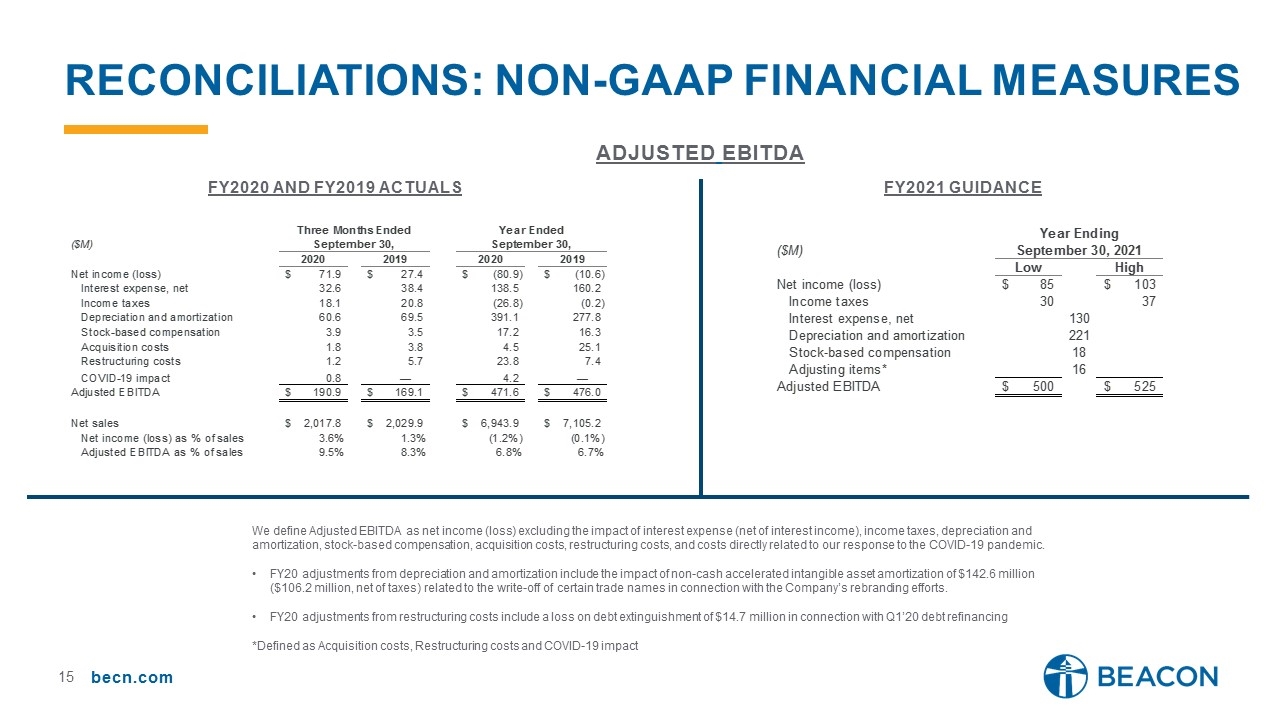
Reconciliations: non-gaap financial measures Adjusted EBITDA We define Adjusted EBITDA as net income (loss) excluding the impact of interest expense (net of interest income), income taxes, depreciation and amortization, stock-based compensation, acquisition costs, restructuring costs, and costs directly related to our response to the COVID-19 pandemic. FY20 adjustments from depreciation and amortization include the impact of non-cash accelerated intangible asset amortization of $142.6 million ($106.2 million, net of taxes) related to the write-off of certain trade names in connection with the Company’s rebranding efforts. FY20 adjustments from restructuring costs include a loss on debt extinguishment of $14.7 million in connection with Q1’20 debt refinancing *Defined as Acquisition costs, Restructuring costs and COVID-19 impact FY2020 and FY2019 actuals FY2021 Guidance
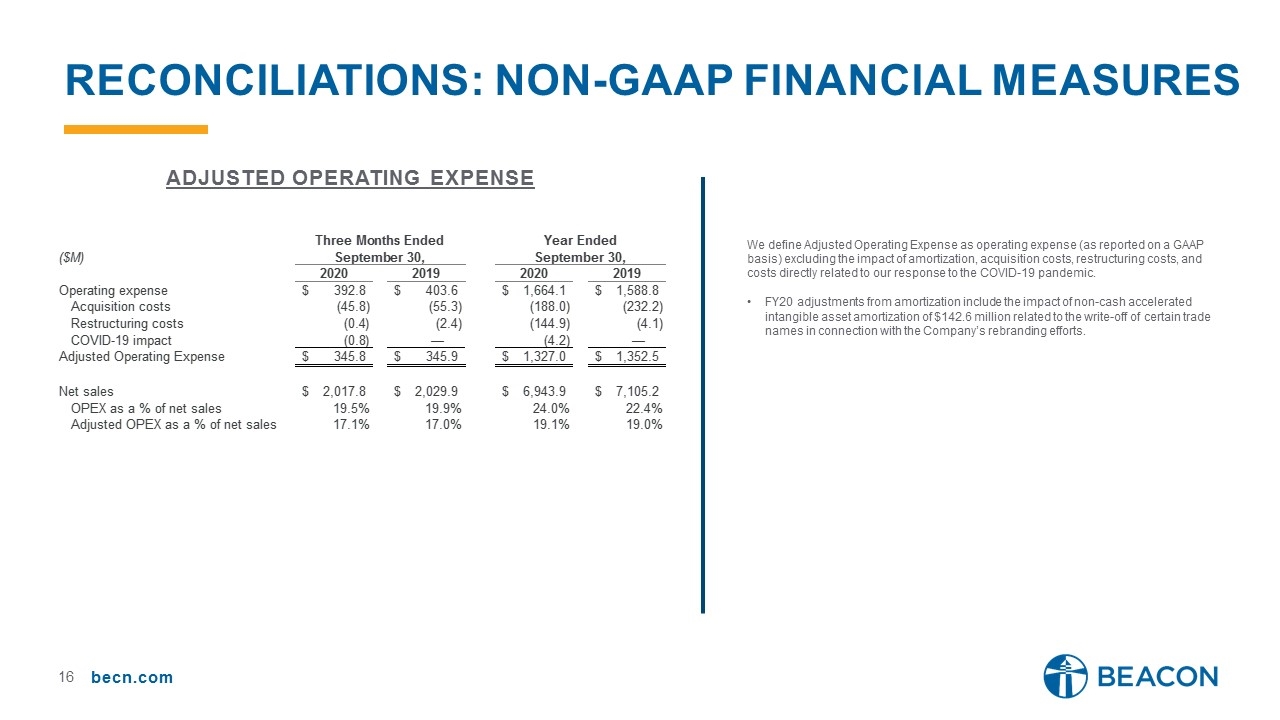
Reconciliations: non-gaap financial measures Adjusted Operating Expense We define Adjusted Operating Expense as operating expense (as reported on a GAAP basis) excluding the impact of amortization, acquisition costs, restructuring costs, and costs directly related to our response to the COVID-19 pandemic. FY20 adjustments from amortization include the impact of non-cash accelerated intangible asset amortization of $142.6 million related to the write-off of certain trade names in connection with the Company’s rebranding efforts.
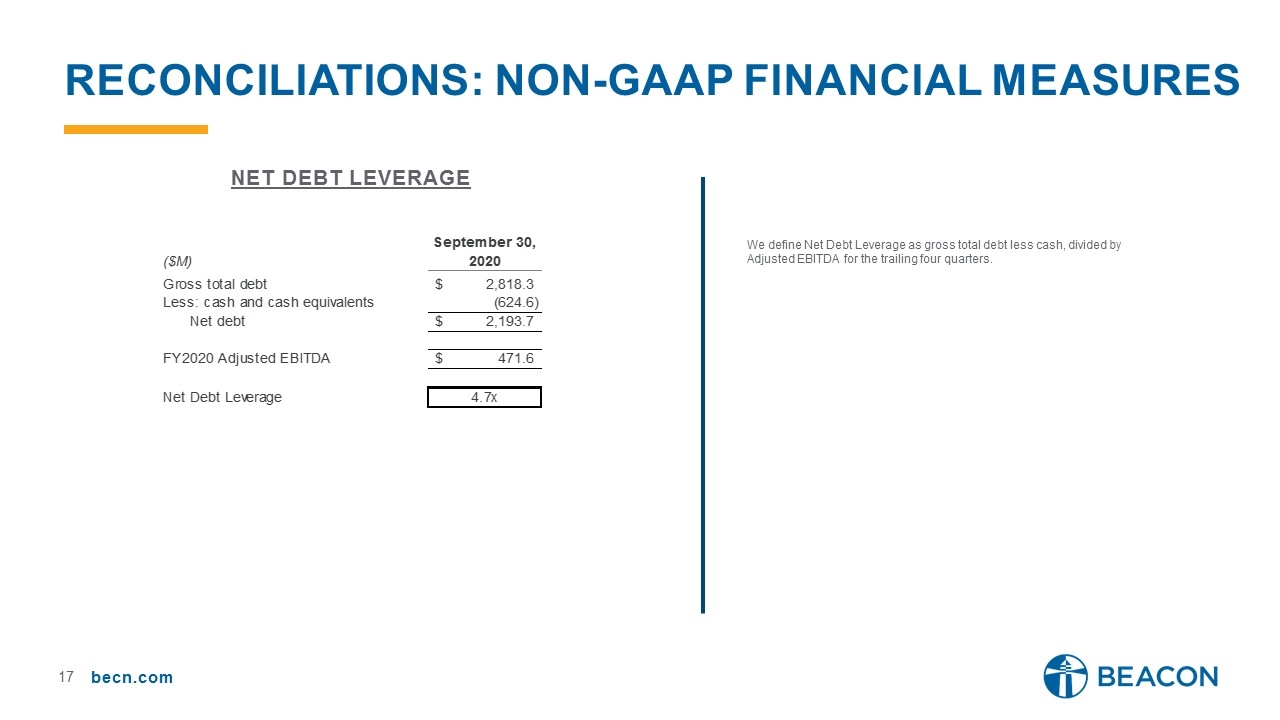
Reconciliations: non-gaap financial measures Net debt leverage We define Net Debt Leverage as gross total debt less cash, divided by Adjusted EBITDA for the trailing four quarters.
