Attached files
| file | filename |
|---|---|
| 8-K - 8-K - Nuance Communications, Inc. | nuanpressrelease093020.htm |
| EX-99.1 - EXHIBIT 99.1 - Nuance Communications, Inc. | ex991pressreleasesepte.htm |
Exhibit 99.2
1 | 2020 Fourth Quarter and Fiscal Year Results |
Prepared Remarks | |
November 18, 2020 | |
Prepared Remarks
Nuance Fourth Quarter and Fiscal Year 2020
Prepared Remarks and Earnings Conference Call
We are providing these prepared remarks, in combination with the press release, to provide additional detail in advance of the quarterly conference call. These prepared remarks will not be read on the call.
The conference call will begin at 5:00 p.m. ET today. To participate, please access the live webcast at http://investors.nuance.com, or by dialing 1-888-317-6003 (US and Canada) or 1-412-317-6061 (international) and referencing code 5887867.
Both these and the quarterly conference call remarks include certain forward-looking statements and non-GAAP financial measures. Please reference the “Safe Harbor and Forward-Looking Statements” section for important caveats with respect to forward-looking information, and the “Discussion of non-GAAP Financial Measures” and related Supplemental Financial Information for more details on our non-GAAP financial measures.
Q4 2020 Summary
The fourth quarter marked another quarter of solid execution and a strong end to our fiscal year. In Q4, we generated revenue and earnings per share at the high end of our guidance range and over-achieved the high end of our Healthcare ARR guidance range. We continued to experience favorable revenue mix shifts, while seeing increased demand for our cloud solutions and advancing our strategic investments. Although our businesses are recovering from the widespread effects of COVID-19, our results were still impacted by disruption in elective procedures and delayed license purchases and project implementations. For the quarter, Healthcare organic revenue declined 10%, as our continued strength in Dragon Medical Cloud, which grew 26% year-over-year, was more than offset by declines in our non-strategic HIM transcription and EHR implementation services businesses, which were exacerbated by the pandemic. Enterprise revenue declined 3%, due to the timing of license revenues and professional services projects. We experienced strong Enterprise license revenue growth in the first half of 2020 in part due to implementations that progressed ahead of our original expectations. As a reminder, our Enterprise business remains subject to fluctuation from period to period related to the timing of license activity, and we encourage investors to assess performance on an annual basis.
FY 2020 Summary
Despite the widespread impacts of an unprecedented pandemic over the last two quarters, we remained focused and completed another transformational year. We launched 20 new products to market, including our Dragon Ambient Experience ("DAX") solution, expanded demand for our Healthcare cloud businesses, delivered our fifth straight year of organic growth for our Enterprise segment, executed on our strategic and financial objectives, and continued to simplify our organization. Key accomplishments include:
• | Continued strong growth of Healthcare Cloud ARR and revenue. Healthcare Cloud ARR ended the year at $385.9 million, up 29% compared to 2019. This not only exceeds the high end of our recent guidance range of $370 million to $380 million but is just below the midpoint of our original pre-COVID guidance. |
• | Dragon Medical Cloud revenue grew significantly to $280.1 million for the year, up 38% compared to 2019 and at the high end of our recent guidance range. Radiology Cloud grew 16% with the initial ramp up of our new PowerScribe One cloud offering. |
 | © 2020 Nuance Communications, Inc. All rights reserved | |
Exhibit 99.2
2 | 2020 Fourth Quarter and Fiscal Year Results |
Prepared Remarks | |
November 18, 2020 | |
• | Delivered our fifth consecutive year of organic growth for our Enterprise segment, which grew 4% for the year. This growth was driven by strength in our Intelligent Engagement offerings, in particular our digital and security and biometric AI offerings. |
• | Expanded our gross margin by 170 basis points and exceeded expectations on our cost savings program, taking $40 million of cost out of the business, allowing further investment in strategic growth initiatives. |
• | Focused on our capital allocation priorities, repurchasing $169.2 million of common stock and retiring $470 million of debt principal value during the first half of the year. |
• | Continued to simplify our organization, aligning our portfolio with key strategic growth areas so that we can reinvest in ourselves and increase our market leadership positions. Consistent with that objective, today we announced our strategic decision to sell our HIM transcription and EHR go-live services businesses to Assured Healthcare Partners (AHP) and Aeries Technology Group. These businesses provide critical support to healthcare organizations, and upon the closing of the sale, Nuance will be both a minority owner and business partner committed to the success of the new business, named DeliverHealth Solutions. |
| © 2020 Nuance Communications, Inc. All rights reserved | |
Exhibit 99.2
3 | 2020 Fourth Quarter and Fiscal Year Results |
Prepared Remarks | |
November 18, 2020 | |
Q4 2020 Summary of GAAP and Non-GAAP Financial Results
Q4 2020 Detailed Financial Results
($ in millions except earnings per share) | Q1 2019 | Q2 2019 | Q3 2019 | Q4 2019 | 2019 | Q1 2020 | Q2 2020 | Q3 2020 | Q4 2020 | 2020 | ||
GAAP Revenue | $419.7 | $336.6 | $377.4 | $387.6 | $1,521.3 | $418.2 | $369.3 | $338.4 | $352.9 | $1,478.9 | ||
GAAP Gross Profit | $235.6 | $177.3 | $205.7 | $219.2 | $837.8 | $233.8 | $212.2 | $194.2 | $199.7 | $840.0 | ||
GAAP Gross Margin % | 56.1% | 52.7% | 54.5% | 56.6% | 55.1% | 55.9% | 57.5% | 57.4% | 56.6% | 56.8% | ||
GAAP Operating Income | $46.8 | -$1.7 | $31.3 | $30.8 | $107.2 | $52.1 | $25.1 | $22.4 | $12.9 | $112.6 | ||
GAAP Operating Margin | 11.1% | (0.5)% | 8.3% | 7.9% | 7.0% | 12.5% | 6.8% | 6.6% | 3.7% | 7.6% | ||
GAAP Interest Expense | $32.3 | $31.2 | $28.4 | $28.3 | $120.1 | $23.8 | $23.6 | $23.7 | $22.8 | $94.0 | ||
GAAP Taxes | $2.0 | -$0.6 | $10.7 | $0.0 | $12.1 | -$36.4 | $21.3 | -$16.7 | $13.0 | -$18.8 | ||
GAAP Net Income (Loss) | $13.9 | -$28.4 | -$0.7 | $3.0 | -$12.2 | $54.9 | -$20.0 | $16.7 | -$22.8 | $28.8 | ||
GAAP Diluted EPS | $0.05 | -$0.10 | $0.00 | $0.01 | -$0.04 | $0.19 | -$0.07 | $0.06 | -$0.08 | $0.10 | ||
Non-GAAP Revenue | $420.0 | $336.9 | $378.1 | $387.8 | $1,522.8 | $418.3 | $369.5 | $338.4 | $352.9 | $1,479.2 | ||
Non-GAAP Gross Profit | $250.7 | $189.6 | $220.6 | $235.0 | $895.9 | $246.7 | $226.1 | $207.3 | $215.0 | $895.1 | ||
Non-GAAP Gross Margin % | 59.7% | 56.3% | 58.4% | 60.6% | 58.8% | 59.0% | 61.2% | 61.3% | 60.9% | 60.5% | ||
Non-GAAP Operating Income | $119.8 | $57.3 | $91.8 | $94.1 | $363.0 | $110.7 | $83.9 | $78.4 | $76.3 | $349.4 | ||
Non-GAAP Operating Margin | 28.5% | 17.0% | 24.3% | 24.3% | 23.8% | 26.5% | 22.7% | 23.2% | 21.6% | 23.6% | ||
Depreciation | $12.8 | $12.5 | $11.0 | $10.3 | $46.6 | $10.2 | $9.0 | $8.8 | $9.8 | $37.8 | ||
Non-GAAP EBITDA | $132.6 | $69.8 | $102.8 | $104.5 | $409.6 | $120.9 | $92.9 | $87.2 | $86.1 | $387.2 | ||
Non-GAAP Interest Expense | $20.0 | $18.8 | $16.0 | $15.8 | $70.6 | $11.4 | $11.3 | $11.7 | $10.7 | $45.2 | ||
Non-GAAP Taxes | $23.1 | $12.7 | $23.6 | $17.5 | $76.9 | $25.7 | $16.7 | $15.5 | $11.6 | $69.6 | ||
Non-GAAP Effective Tax Rate | 22.7% | 29.2% | 29.2% | 21.0% | 24.9% | 24.7% | 21.9% | 23.4% | 17.6% | 22.2% | ||
Cash Taxes | $4.3 | $6.9 | $1.5 | $12.0 | $24.8 | $0.8 | $14.2 | $5.9 | $0.2 | $21.2 | ||
Cash Tax Rate | 4.3% | 16.0% | 1.9% | 14.4% | 8.0% | 0.8% | 18.7% | 8.9% | 0.3% | 6.8% | ||
Non-GAAP Net Income | $78.5 | $30.8 | $57.2 | $65.9 | $232.5 | $78.6 | $59.7 | $51.0 | $54.2 | $243.4 | ||
Non-GAAP Diluted EPS | $0.27 | $0.11 | $0.20 | $0.23 | $0.80 | $0.27 | $0.21 | $0.18 | $0.18 | $0.83 | ||
Hosting Revenue | $186.8 | $179.5 | $188.2 | $194.9 | $749.4 | $195.0 | $198.1 | $191.8 | $199.5 | $784.4 | ||
Maintenance & Support Revenue | $76.2 | $60.9 | $66.4 | $65.7 | $269.3 | $62.6 | $64.2 | $64.4 | $65.6 | $256.7 | ||
Product and Licensing Revenue | $115.9 | $58.3 | $78.7 | $86.4 | $339.4 | $125.2 | $69.6 | $48.7 | $52.6 | $296.1 | ||
Professional Services Revenue | $41.1 | $38.2 | $44.8 | $40.7 | $164.8 | $35.5 | $37.7 | $33.5 | $35.3 | $142.0 | ||
Total Non-GAAP Revenue | $420.0 | $336.9 | $378.1 | $387.8 | $1,522.8 | $418.3 | $369.5 | $338.4 | $352.9 | $1,479.2 | ||
(*) Change in dollars, percentage, and basis points calculated using actual results. May not add due to rounding for table presentation purposes
• | Q4 20 GAAP revenue decreased $34.6 million year-over-year, while FY 20 GAAP revenue decreased $42.4 million year-over-year. |
| © 2020 Nuance Communications, Inc. All rights reserved | |
Exhibit 99.2
4 | 2020 Fourth Quarter and Fiscal Year Results |
Prepared Remarks | |
November 18, 2020 | |
• | Q4 20 non-GAAP revenue of $352.9 million declined 9% on an organic basis due to COVID-related declines in our non-strategic HIM and EHR implementation services businesses. Our performance was also impacted by lower license revenue from Dragon Medical and our PowerScribe radiology reporting business, partially offset by growth in our cloud-based offerings as we continue to convert our on-premise customers to the cloud. |
• | FY 20 non-GAAP revenue declined 2% on an organic basis compared to 2019, predominately due to declines in our non-strategic HIM and EHR implementation services businesses, which were exacerbated by the impact of COVID-19. |
• | Despite significant COVID-19 headwinds and ongoing declines in our HIM transcription business, our Q4 Hosting revenue grew year-over-year for the sixth consecutive quarter to $199.5 million as we continue to shift our Healthcare on-premise licensing business to cloud services. For the year, Hosting revenue increased 4.7% to $784.4 million driven by strength in Dragon Medical Cloud. |
• | Product & Licensing revenue declined $33.8 million and $43.2 million for the quarter and fiscal year respectively, due to the combined impacts of our shifting revenue mix towards cloud and the near-term impacts from COVID-19, which delayed certain projects. |
• | GAAP gross margin for the quarter was 56.6% and for the year was 56.8%. |
• | Non-GAAP gross margin for the quarter was 60.9%, an increase of 30 basis points, and non-GAAP gross margin for the year was 60.5%, an increase of 170 basis over 2019. These increases compared to the prior year period were a result of favorable revenue mix-shifts towards higher margin cloud revenue and away from our low margin HIM transcription and EHR implementation services. |
• | Q4 20 GAAP operating margin decreased 4.3% year-over year and GAAP operating margin for the year increased 60 basis points compared to 2019. Q4 20 non-GAAP operating margin decreased 2.6% year-over-year and for the year decreased 20 basis points compared to 2019, both due to the near-term COVID-19 impacts on revenue and the continued ramp of our strategic investments in R&D and Sales. |
| © 2020 Nuance Communications, Inc. All rights reserved | |
Exhibit 99.2
5 | 2020 Fourth Quarter and Fiscal Year Results |
Prepared Remarks | |
November 18, 2020 | |
Liquidity and Capital
($ in millions except earnings per share) | Q1 2019 | Q2 2019 | Q3 2019 | Q4 2019 | 2019 | Q1 2020 | Q2 2020 | Q3 2020 | Q4 2020 | 2020 | ||
Cash & Marketable Securities | $449.6 | $633.1 | $686.2 | $764.8 | $764.8 | $510.0 | $526.2 | $312.8 | $372.3 | $372.3 | ||
Cash Flow from Continuing Operations | $72.7 | $79.5 | $73.2 | $79.3 | $304.6 | $66.9 | $87.9 | $32.3 | $80.9 | $267.9 | ||
Days Sales Outstanding (DSO) | 57 | 60 | 58 | 56 | 57 | 56 | 54 | 57 | 51 | 55 | ||
Debt Maturity Value | $2,437.0 | $2,137.0 | $2,137.0 | $2,137.0 | $2,137.0 | $1,837.0 | $1,896.5 | $1,666.5 | $1,666.5 | $1,666.5 | ||
Gross Debt Leverage Ratio | 5.2 | 5.2 | 4.6 | 4.5 | 4.1 | 4.3 | 4.3 | |||||
Net Debt Leverage Ratio | 3.4 | 3.4 | 3.3 | 3.3 | 3.3 | 3.3 | 3.3 | |||||
Shares Repurchased | 4.9 | 1.2 | 1.7 | 0.4 | 8.2 | 5.7 | 3.8 | — | — | 9.5 | ||
Shares Repurchase Average Price | $15.36 | $13.81 | $17.36 | $15.34 | $15.55 | $16.24 | $20.40 | $— | $— | $17.89 | ||
Shares Repurchased Consideration | $75.2 | $16.2 | $29.6 | $6.0 | $126.9 | $92.4 | $76.8 | $— | $— | $169.2 | ||
6.00% High Yield Bond due 2024 | $300.0 | $300.0 | $300.0 | $300.0 | $300.0 | $— | $— | $— | $— | $— | ||
5.625% High Yield Bond due 2026 | $500.0 | $500.0 | $500.0 | $500.0 | $500.0 | $500.0 | $500.0 | $500.0 | $500.0 | $500.0 | ||
5.375% High Yield Bond due 2020 | $300.0 | $— | $— | $— | $— | $— | $— | $— | $— | $— | ||
2.750% Convertible puttable 2021 | $46.6 | $46.6 | $46.6 | $46.6 | $46.6 | $46.6 | $— | $— | $— | $— | ||
1.50% Convertible puttable 2021 | $263.9 | $263.9 | $263.9 | $263.9 | $263.9 | $263.9 | $227.4 | $227.4 | $227.4 | $227.4 | ||
1.25% Convertible due 2025 | $350.0 | $350.0 | $350.0 | $350.0 | $350.0 | $350.0 | $262.7 | $262.7 | $262.7 | $262.7 | ||
1.00% Convertible puttable 2022 | $676.5 | $676.5 | $676.5 | $676.5 | $676.5 | $676.5 | $676.5 | $676.5 | $676.5 | $676.5 | ||
LIBOR + 1.75% Revolver due 2021 | $— | $— | $— | $— | $— | $— | $230.0 | $— | $— | $— | ||
Total Debt Maturity Value | $2,437.0 | $2,137.0 | $2,137.0 | $2,137.0 | $2,137.0 | $1,837.0 | $1,896.5 | $1,666.5 | $1,666.5 | $1,666.5 | ||
• | Total Cash Flow from Continuing Operations increased slightly for the quarter, up $1.6 million compared to Q4 19. Full year Cash Flow from Continuing Operations decreased $36.7 million year-over-year due to COVID-19 impacts on revenue and billings. |
• | We ended the quarter with a cash and marketable securities balance of $372.3 million, above our minimum cash balance target range of $250 million to $350 million. |
• | We continued our focus on capital allocation activities in fiscal year 2020. In the first quarter, we paid down $300 million in high-yield bonds. Throughout the second quarter, we used $200 million of cash to retire $170 million of convertible bond principal value, including $47 million on a debt call for the same amount of debt principal, and $154 million to retire $124 million convertible bond principal value in the open market. Additionally, throughout the first half of the year we repurchased 9.5 million shares for total consideration of $169.2 million, at an average price of $17.89. We have $261.2 million remaining under our share repurchase board authorization. |
| © 2020 Nuance Communications, Inc. All rights reserved | |
Exhibit 99.2
6 | 2020 Fourth Quarter and Fiscal Year Results |
Prepared Remarks | |
November 18, 2020 | |
Discussion of Segments
Table: Segment Revenue, Segment Profit and Margin
($ in millions) | Q1 2019 | Q2 2019 | Q3 2019 | Q4 2019 | 2019 | Q1 2020 | Q2 2020 | Q3 2020 | Q4 2020 | 2020 | ||
Healthcare Revenue | $272.0 | $204.5 | $228.4 | $245.7 | $950.6 | $270.5 | $224.4 | $199.9 | $220.5 | $915.3 | ||
Organic Revenue Growth | (1)% | 10% | (13)% | (10)% | (4)% | |||||||
Healthcare Segment Profit | $102.6 | $62.3 | $79.3 | $89.3 | $333.5 | $93.3 | $71.7 | $62.9 | $70.9 | $298.8 | ||
Healthcare Segment Profit Margin | 37.7% | 30.5% | 34.7% | 36.3% | 35.1% | 34.5% | 31.9% | 31.5% | 32.2% | 32.6% | ||
Enterprise Revenue | $129.7 | $115.6 | $137.9 | $127.5 | $510.8 | $138.5 | $137.4 | $130.4 | $123.7 | $530.0 | ||
Organic Revenue Growth | 7% | 19% | (5)% | (3)% | 4% | |||||||
Enterprise Segment Profit | $42.3 | $20.3 | $38.7 | $29.8 | $131.2 | $42.5 | $38.7 | $37.0 | $28.7 | $146.9 | ||
Enterprise Segment Profit Margin | 32.6% | 17.6% | 28.1% | 23.4% | 25.7% | 30.7% | 28.2% | 28.4% | 23.2% | 27.7% | ||
Strategic Revenue | $401.7 | $320.2 | $366.3 | $373.2 | $1,461.3 | $409.0 | $361.8 | $330.3 | $344.2 | $1,445.3 | ||
Organic Revenue Growth | 2% | 13% | (10)% | (8)% | (1)% | |||||||
Strategic Segment Profit | $144.8 | $82.6 | $118.1 | $119.1 | $464.7 | $135.8 | $110.4 | $99.9 | $99.6 | $445.7 | ||
Strategic Segment Profit Margin | 36.1% | 25.8% | 32.2% | 31.9% | 31.8% | 33.2% | 30.5% | 30.2% | 28.9% | 30.8% | ||
Other Revenue | $18.4 | $16.7 | $11.8 | $14.6 | $61.5 | $9.3 | $7.7 | $8.1 | $8.7 | $33.9 | ||
Organic Revenue Growth | (33)% | (29)% | (26)% | (37)% | (32)% | |||||||
Other Segment Profit | $5.3 | $5.0 | $3.0 | $6.1 | $19.6 | $5.1 | $3.8 | $5.0 | $5.7 | $19.7 | ||
Other Segment Profit Margin | 29.1% | 30.1% | 25.8% | 42.1% | 31.8% | 55.1% | 49.9% | 62.0% | 65.4% | 58.2% | ||
Total Nuance Revenue | $420.0 | $336.9 | $378.1 | $387.8 | $1,522.8 | $418.3 | $369.5 | $338.4 | $352.9 | $1,479.2 | ||
Organic Revenue Growth | 1% | 11% | (11)% | (9)% | (2)% | |||||||
Total Nuance Segment Profit | $150.2 | $87.7 | $121.1 | $125.3 | $484.2 | $140.9 | $114.3 | $104.9 | $105.3 | $465.4 | ||
Total Nuance Segment Profit Margin | 35.8% | 26.0% | 32.0% | 32.3% | 31.8% | 33.7% | 30.9% | 31.0% | 29.8% | 31.5% | ||
| © 2020 Nuance Communications, Inc. All rights reserved | |
Exhibit 99.2
7 | 2020 Fourth Quarter and Fiscal Year Results |
Prepared Remarks | |
November 18, 2020 | |
Table: Healthcare Non-GAAP Revenue Detail
($ in millions) | Q1 2019 | Q2 2019 | Q3 2019 | Q4 2019 | 2019 | Q1 2020 | Q2 2020 | Q3 2020 | Q4 2020 | 2020 | ||
Clinical Documentation Capture | $133.6 | $124.3 | $126.9 | $151.2 | $535.9 | $134.3 | $135.0 | $127.1 | $137.8 | $534.2 | ||
Yr/yr As Reported Growth | 1% | 9% | —% | (9)% | —% | |||||||
Dragon Medical Cloud | $43.5 | $46.4 | $53.3 | $59.8 | $202.9 | $65.8 | $67.6 | $71.4 | $75.3 | $280.1 | ||
Yr/yr As Reported Growth | 51% | 46% | 34% | 26% | 38% | |||||||
Dragon Medical M&S | $14.4 | $10.9 | $12.1 | $12.1 | $49.5 | $6.8 | $7.9 | $7.3 | $7.6 | $29.6 | ||
Yr/yr As Reported Growth | (53)% | (28)% | (40)% | (37)% | (40)% | |||||||
Dragon Medical Product & Licensing | $18.6 | $12.7 | $10.2 | $26.7 | $68.2 | $13.0 | $13.3 | $10.6 | $13.1 | $50.0 | ||
Yr/yr As Reported Growth | (30)% | 5% | 4% | (51)% | (27)% | |||||||
HIM (Hosting and M&S) | $57.1 | $54.3 | $51.2 | $52.7 | $215.2 | $48.8 | $46.2 | $37.9 | $41.6 | $174.4 | ||
Yr/yr As Reported Growth | (15)% | (15)% | (26)% | (21)% | (19)% | |||||||
Radiology & Other | $91.4 | $37.2 | $55.7 | $49.7 | $234.1 | $93.8 | $48.1 | $37.7 | $42.8 | $222.5 | ||
Yr/yr As Reported Growth | 3% | 29% | (32)% | (14)% | (5)% | |||||||
Professional Services | $16.4 | $17.3 | $20.9 | $19.1 | $73.8 | $15.6 | $15.2 | $8.0 | $13.5 | $52.2 | ||
Yr/yr As Reported Growth | (5)% | (12)% | (62)% | (30)% | (29)% | |||||||
Other Maintenance & Support | $30.6 | $25.7 | $24.9 | $25.7 | $106.8 | $26.8 | $26.1 | $27.1 | $26.5 | $106.5 | ||
Yr/yr As Reported Growth | (12)% | 2% | 9% | 3% | —% | |||||||
Total Healthcare Revenues | $272.0 | $204.5 | $228.4 | $245.7 | $950.6 | $270.5 | $224.4 | $199.9 | $220.5 | $915.3 | ||
Yr/yr As Reported Growth | (1)% | 10% | (12)% | (10)% | (4)% | |||||||
Yr/yr Organic Growth | (1)% | 10% | (13)% | (10)% | (4)% | |||||||
• | In Q4, our Healthcare revenue declined 10% year-over-year compared to Q4 19, with fiscal year revenue down 4% compared to 2019. These declines were largely driven by COVID-19 impacts, particularly within our non-strategic HIM and EHR implementation services businesses. We also experienced expected headwinds to our license and M&S revenue as we continued to shift customers from on-premise to cloud offerings, which will result in a more ratable, recurring revenue model within the segment. Despite COVID-19, our strategic cloud transition in Healthcare continues to show durability, with strong growth in our Dragon Medical Cloud and Radiology Cloud offerings. |
• | Radiology & Other experienced declines in both Q4 and FY 20, decreasing 14% and 5% respectively when compared to the prior year periods due to several factors. First, COVID-19 impacts led to lower license revenue. Second, as we often note, this revenue category is subject to fluctuation due to the timing of multi-year term licenses. And finally, we had planned a near-term impact due to the ongoing migration of our CDI on-premise install base to our CDE One cloud offering. As we discussed last quarter, due to the ASC 606 accounting standard for revenue recognition, this conversion from term license to cloud services in the middle of a multi-year term license agreement results in a non-cash revenue reduction, which totaled $2.3 million in Q4, in exchange for ratable and recurring cloud services revenue that will be recognized on the hosting revenue line as the services are performed. This migration remains strategically important, and we will continue to aggressively look |
| © 2020 Nuance Communications, Inc. All rights reserved | |
Exhibit 99.2
8 | 2020 Fourth Quarter and Fiscal Year Results |
Prepared Remarks | |
November 18, 2020 | |
for opportunities to convert current term license customers to our cloud offerings as fast as possible.
• | While our Enterprise business declined 3% in Q4 compared to Q4 19, the segment grew 4% for the full year. This full year growth was driven by strong performance in our Intelligent Engagement offerings, in both our digital solutions and our security and biometric offerings. As a reminder, Enterprise revenues, and the subsequent segment margins, remain subject to fluctuation from period-to-period due to the timing of license activity, and we always encourage investors to analyze our Enterprise segment performance on an annual basis. |
Beginning in Q1 2021 we will replace the above Healthcare non-GAAP Revenue Detail table with the following two new tables. The new tables provide investors greater visibility into our total Healthcare cloud business, which grew 37% in 2020 compared to 2019, and the ongoing shift to cloud within our Radiology business.
Table: Healthcare Non-GAAP Cloud Revenue Detail
($ in millions) | FY 2019 | Q1 2020 | Q2 2020 | Q3 2020 | Q4 2020 | FY 2020 | ||
Dragon Medical Cloud | $202.9 | $65.8 | $67.6 | $71.4 | $75.3 | $280.1 | ||
year-over-year | 38% | |||||||
Radiology Cloud | $27.5 | $7.3 | $7.8 | $8.0 | $8.8 | $31.9 | ||
year-over-year | 16% | |||||||
Non-Clinical Cloud | $26.3 | $7.7 | $10.3 | $9.9 | $11.7 | $39.6 | ||
year-over-year | 51% | |||||||
Healthcare Cloud | $256.7 | $80.8 | $85.7 | $89.3 | $95.8 | $351.7 | ||
year-over-year | 37% | |||||||
| © 2020 Nuance Communications, Inc. All rights reserved | |
Exhibit 99.2
9 | 2020 Fourth Quarter and Fiscal Year Results |
Prepared Remarks | |
November 18, 2020 | |
Table: Healthcare Non-GAAP Cloud Revenue Detail
($ in millions) | FY 2019 | Q1 2020 | Q2 2020 | Q3 2020 | Q4 2020 | FY 2020 | ||
Dragon Medical Cloud | $202.9 | $65.8 | $67.6 | $71.4 | $75.3 | $280.1 | ||
year-over-year | 38% | |||||||
Dragon Medical Product & Licensing | $68.2 | $13.0 | $13.3 | $10.6 | $13.1 | $50.0 | ||
year-over-year | (27)% | |||||||
Dragon Medical M&S | $49.5 | $6.8 | $7.9 | $7.3 | $7.6 | $29.6 | ||
year-over-year | (40)% | |||||||
Dragon Medical | $320.7 | $85.6 | $88.8 | $89.2 | $96.1 | $359.7 | ||
year-over-year | 12% | |||||||
Radiology Cloud | $27.5 | $7.3 | $7.8 | $8.0 | $8.8 | $31.9 | ||
year-over-year | 16% | |||||||
Radiology Product & Licensing | $60.8 | $14.4 | $13.0 | $10.9 | $8.8 | $47.1 | ||
year-over-year | (23)% | |||||||
Radiology M&S | $59.3 | $15.7 | $14.9 | $15.9 | $15.4 | $61.9 | ||
year-over-year | 4% | |||||||
Radiology PS | $13.2 | $3.3 | $3.1 | $2.6 | $3.7 | $12.7 | ||
year-over-year | (4)% | |||||||
Radiology | $160.8 | $40.7 | $38.7 | $37.4 | $36.7 | $153.5 | ||
year-over-year | (5)% | |||||||
Other | $219.0 | $87.5 | $43.4 | $33.2 | $42.5 | $206.6 | ||
year-over-year | (6)% | |||||||
Healthcare excluding HIM and EHR Services | $700.5 | $213.8 | $171.0 | $159.8 | $175.4 | $719.9 | ||
year-over-year | 3% | |||||||
EHR Services | $34.9 | $8.0 | $7.3 | $2.2 | $3.5 | $21.0 | ||
year-over-year | (40)% | |||||||
HIM | $215.2 | $48.8 | $46.2 | $37.9 | $41.6 | $174.4 | ||
(19)% | ||||||||
Total Healthcare Revenues | $950.6 | $270.5 | $224.4 | $199.9 | $220.5 | $915.3 | ||
year-over-year | (4)% | |||||||
| © 2020 Nuance Communications, Inc. All rights reserved | |
Exhibit 99.2
10 | 2020 Fourth Quarter and Fiscal Year Results |
Prepared Remarks | |
November 18, 2020 | |
Guidance Introduction
With the expected close of the HIM transcription and EHR go-live services businesses (DeliverHealth Solutions) to Assured Healthcare Partners (AHP) and Aeries Technology Group, our 2021 guidance is provided on a continuing operations basis only, which excludes these businesses. Since our historical results provided in this document include these businesses, our 2021 financial guidance, when compared to our 2020 actual results, will reflect changes due to (i) the impact of the DeliverHealth Solutions pending divestment and (ii) the normal operations of the remaining segments. To help investors assess the magnitude of each change, we are providing preliminary estimates and commentary below related to these items. During Q1 2021, we will provide both our actual and previous historical results on a continuing operations basis, reclassified for and excluding the discontinued operations of DeliverHealth Solutions.
The guidance sections that follow include our usual guidance metrics for the upcoming fiscal year and first quarter. We are also providing bridges to explain some important strategic shifts happening within our business. We have built a strong foundation for growth and margin expansion over the last few years and are pleased that our 2021 Guidance reflects the following:
• | Unlocking high-single-digit to double-digit organic revenue growth and accelerating Cloud ARR for Healthcare due to the divestment of non-strategic, lower margin businesses and with continued expansion of our market share across a broad portfolio of products and new product launches. |
• | Continuing our organic revenue growth streak in Enterprise for a sixth straight year. |
• | Significantly expanding margins due to cloud growth, favorable revenue mix shifts and continued portfolio simplification, while also increasing our investments in R&D. |
Fiscal 2021 Revenue Guidance
For the fiscal year 2021, we expect an acceleration of revenue growth as we experience the benefits of our strategic investments, progress further through the transition of our Healthcare business from on-premise to cloud subscription and continue to grow our footprint and market share across our expanding portfolio of products. We expect total non-GAAP revenue between $1,327 million and $1,367 million, representing organic growth between 3% and 7%. For our strategic Enterprise and Healthcare segments, we expect combined non-GAAP revenue between $1,305 million and $1,343 million, representing organic growth between 4% and 7%.
This growth is in spite of the expected loss of a non-strategic government contract in our legacy Coding business that did not renew after 5 years. We anticipate that the loss of this contract will result in approximately a $40 million headwind in 2021, the majority of which will occur in the first quarter. Our Investor Day mid-term outlook had already contemplated this loss, but over a multi-year period versus largely in Q1 of this FY.
| © 2020 Nuance Communications, Inc. All rights reserved | |
Exhibit 99.2
11 | 2020 Fourth Quarter and Fiscal Year Results |
Prepared Remarks | |
November 18, 2020 | |
Table: Fiscal 2021 Segment Revenue Guidance
FY2021 Segment Revenue Guidance ($ in millions) | FY 2020 | FY2020 Excluding HIM and EHR | FY 2021 LOW | FY 2021 HIGH | Organic Growth % | |
Healthcare | $915.3 | $719.9 | $767.0 | $787.0 | 7% - 9% | |
Enterprise | $530.0 | $530.0 | $538.0 | $556.0 | 2% - 5% | |
Strategic | $1,445.3 | $1,249.9 | $1,305.0 | $1,343.0 | 4% - 7% | |
Other | $33.9 | $33.9 | $22.0 | $24.0 | (33%) - (27%) | |
Total Nuance Guidance | $1,479.2 | $1,283.8 | $1,327.0 | $1,367.0 | 3% - 7% | |
Fiscal 2021 P&L Guidance
Before diving into the remaining 2021 guidance metrics, it is important to understand a few factors impacting our gross and operating margins. As represented in the waterfall charts below, our gross and operating margins are impacted by the following in 2021:
• | Our margins continue to expand favorably as our revenue mix shifts from lower margin, non-strategic offerings to high growth, high margin cloud offerings. We also continue to achieve scale in our business. The combination of these factors improves our gross and operating margins by 190 and 320 basis points, respectively. |
• | We also continue to invest in R&D and Sales to support our growth initiatives, which partially offsets the margin improvements above. |
• | Finally, while the above dynamics were considered in our December 2019 Analyst Day commitment to improve our Operating Margin by ~100 basis points each year, the DeliverHealth Solutions transaction allows for an additional 100 basis points of improvement in 2021. |
| © 2020 Nuance Communications, Inc. All rights reserved | |
Exhibit 99.2
12 | 2020 Fourth Quarter and Fiscal Year Results |
Prepared Remarks | |
November 18, 2020 | |
Chart: FY 2020 to FY2021 Non-GAAP Gross and Operating Margin Guidance Bridge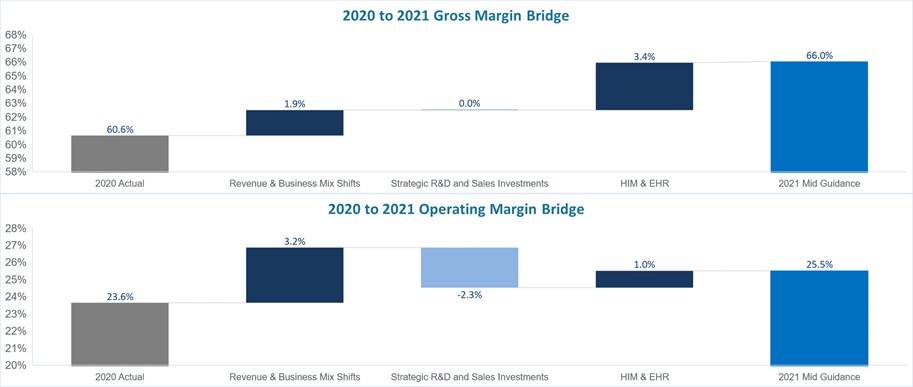
Reflecting all of the factors outlined above, we are providing guidance for fiscal year 2021 as follows:
Table: Fiscal 2021 Guidance Summary
($ in millions except earnings per share) | 2021 Guidance | ||
LOW | HIGH | ||
Total GAAP Revenue | $1,327 | $1,367 | |
Total Non-GAAP Revenue | $1,327 | $1,367 | |
Non-GAAP Gross Margin | ~ 66% | ||
Non-GAAP Operating Margin | 25.0% | 26.0% | |
Non-GAAP Net Interest & Other | $40 | $45 | |
Non-GAAP Tax Rate | 23.0% | 24.0% | |
Cash Taxes | $20 | $25 | |
Diluted Share Count | 313.0 | 313.0 | |
GAAP EPS | $0.00 | $0.08 | |
Non-GAAP Diluted EPS | $0.71 | $0.77 | |
Depreciation | $35 | $37 | |
Cash Flow From Operations (CFFO) | $270 | $310 | |
Capital Expenditures | $55 | $60 | |
Free Cash Flow (FCF) | $215 | $250 | |
Healthcare ARR | $510 | $540 | |
| © 2020 Nuance Communications, Inc. All rights reserved | |
Exhibit 99.2
13 | 2020 Fourth Quarter and Fiscal Year Results |
Prepared Remarks | |
November 18, 2020 | |
Table: Fiscal 2021 Segment Guidance
($ in millions) | 2021 Segment Guidance | ||
LOW | HIGH | ||
Healthcare Revenue | $767 | $787 | |
Organic Revenue Growth | 7% | 9% | |
Healthcare Segment Profit Margin | 33% | 34% | |
Enterprise Revenue | $538 | $556 | |
Organic Revenue Growth | 2% | 5% | |
Enterprise Segment Profit Margin | 29% | 30% | |
Strategic Revenue | $1,305 | $1,343 | |
Organic Revenue Growth | 4% | 7% | |
Other Revenue | $22 | $24 | |
Organic Revenue Growth | (33%) | (27%) | |
Other Segment Profit Margin | 61% | 62% | |
Total Nuance Revenue | $1,327 | $1,367 | |
Organic Revenue Growth | 3% | 7% | |
Table: Fiscal 2021 Healthcare Cloud Revenue Detail Guidance
($ in millions) | 2021 Healthcare Cloud Revenue Guidance | ||
LOW | HIGH | ||
Dragon Medical + DAX Cloud | $356 | $362 | |
Organic Revenue Growth | 27% | 29% | |
Radiology Cloud | $48 | $52 | |
Organic Revenue Growth | 51% | 64% | |
Non-Clinical Cloud | $50 | $52 | |
Organic Revenue Growth | 27% | 32% | |
Total Healthcare Cloud | $454 | $466 | |
Organic Revenue Growth | 29% | 33% | |
Q1 2021 Guidance
We are providing the following guidance for our first quarter of fiscal year 2021:
Table: Q1 2021 Guidance
($ in millions except earnings per share) | Q1 2021 LOW Guidance | Q1 2021 HIGH Guidance | |
GAAP Revenue | $325 | $343 | |
Non-GAAP Revenue | $325 | $343 | |
GAAP EPS | ($0.05) | $0.01 | |
Non-GAAP Diluted EPS | $0.15 | $0.19 | |
| © 2020 Nuance Communications, Inc. All rights reserved | |
Exhibit 99.2
14 | 2020 Fourth Quarter and Fiscal Year Results |
Prepared Remarks | |
November 18, 2020 | |
About Nuance Communications, Inc.
Nuance Communications, Inc. (NASDAQ: NUAN) is a technology pioneer with market leadership in conversational AI and ambient intelligence. A full-service partner trusted by 90 percent of U.S. hospitals and 85 percent of the Fortune 100 across the globe, we create intuitive solutions that amplify people’s ability to help others.
Trademark reference: Nuance and the Nuance logo are registered trademarks or trademarks of Nuance Communications, Inc. or its affiliates in the United States and/or other countries. All other trademarks referenced herein are the property of their respective owners.
Safe Harbor and Forward-Looking Statements
Statements in this document regarding future performance and our management’s future expectations, beliefs, goals, plans or prospects constitute forward-looking statements within the meaning of the Private Securities Litigation Reform Act of 1995. Any statements that are not statements of historical fact (including statements containing the words “believes,” “plans,” “anticipates,” “expects,” "intends" or “estimates” or similar expressions) should also be considered to be forward-looking statements. There are a number of important factors that could cause actual results or events to differ materially from those indicated by such forward-looking statements, including but not limited to: the impact of the COVID-19 pandemic; the effects of competition, including pricing pressure, and changing business models in the markets and industries in which we operate; fluctuations in demand for our existing and future products; changes to economic, political, and regulatory conditions in the United States and internationally; our ability to attract and retain key personnel; our ability to control and successfully manage our expenses and cash position; cybersecurity and data privacy incidents or breaches, and related remediation and investigation; our ability to comply with applicable domestic and international laws and policies; fluctuating currency rates; possible quality issues in our products and technologies; our ability to realize anticipated synergies from acquired businesses, to cut stranded costs related to divested businesses, and to capture the expected value from strategic transactions; and the other factors described in our most recent Form 10-K, Form 10-Q and other filings with the Securities and Exchange Commission. We disclaim any obligation to update any forward- looking statements as a result of developments occurring after the date of this document.
Definitions
Certain supplemental data provided in the prepared call remarks above are based upon internal Nuance definitions that are important for the reader to understand.
Non-GAAP Organic Revenue Growth. Organic revenue growth is calculated by comparing current period non-GAAP (“Generally Accepted Accounting Principles”) revenue to non-GAAP revenue from the corresponding prior-year period. For purposes of this calculation, prior period non-GAAP revenue is adjusted to include revenue from companies acquired as if we had owned the business in all periods presented, and similarly exclude revenue from business dispositions as if we had not owned the disposed business in all periods presented. Non-GAAP organic revenue growth on a constant currency basis is calculated using current period non-GAAP revenue for entities reporting in currencies other than United States dollars, excluding United States dollar-denominated transactions recorded in those entities, converted into United States dollars using the average exchange rates from the prior-year period rather than the actual exchange rates in effect during the current period.
| © 2020 Nuance Communications, Inc. All rights reserved | |
Exhibit 99.2
15 | 2020 Fourth Quarter and Fiscal Year Results |
Prepared Remarks | |
November 18, 2020 | |
Gross Debt Leverage Ratio. Gross Debt Leverage Ratio represents the ratio of the total debt principal outstanding as of the end of the reporting period to the trailing-twelve-month EBITDA (as defined below) from continuing operations.
Net Debt Leverage Ratio. Net Debt Leverage Ratio represents the ratio of the total debt principal outstanding, net of total cash and marketable securities, as of the end of the reporting period, to the trailing-twelve-month EBITDA from continuing operations.
Segment Profit. Segment profit reflects the direct controllable costs of each Segment together with an allocation of sales and corporate marketing expenses, and certain research and development project costs that benefit multiple product offerings. Segment profit represents income from operations excluding stock-based compensation, amortization of intangible assets, acquisition-related costs, net, restructuring and other charges, net, costs associated with intellectual property collaboration agreements, other income (expense), net and certain unallocated corporate expenses.
Discussion of non-GAAP Financial Measures
We believe that providing the non-GAAP information to investors, in addition to the GAAP presentation, allows investors to view the financial results in the way management views the operating results. We further believe that providing this information allows investors to not only better understand our financial performance, but more importantly, to evaluate the efficacy of the methodology and information used by management to evaluate and measure such performance. The non- GAAP information included in this press release should not be considered superior to, or a substitute for, financial statements prepared in accordance with GAAP.
We utilize a number of different financial measures, both GAAP and non-GAAP, in analyzing and assessing the overall performance of the business, for making operating decisions and for forecasting and planning for future periods. Our annual financial plan is prepared both on a GAAP and non-GAAP basis, and the non- GAAP annual financial plan is approved by our board of directors. Continuous budgeting and forecasting for revenue and expenses are conducted on a consistent non-GAAP basis (in addition to GAAP) and actual results on a non-GAAP basis are assessed against the non-GAAP annual financial plan. The board of directors and management utilize these non-GAAP measures and results (in addition to the GAAP results) to determine our allocation of resources. In addition, and as a consequence of the importance of these measures in managing the business, we use non-GAAP measures and results in the evaluation process to establish management’s compensation. For example, our annual bonus program payments are based upon the achievement of consolidated non-GAAP revenue and consolidated non-GAAP earnings per share financial targets. We consider the use of non-GAAP revenue helpful in understanding the performance of our business, as it excludes the purchase accounting impact on acquired deferred revenue and other acquisition- related adjustments to revenue. We also consider the use of non-GAAP earnings per share helpful in assessing the organic performance of the continuing operations of our business. By organic performance we mean performance as if we had owned an acquired business in the same period a year ago. By constant currency organic performance, we mean performance excluding the effect of current foreign currency rate fluctuations. By continuing operations, we mean the ongoing results of the business excluding certain unplanned costs. While our management uses these non-GAAP financial measures as a tool to enhance their understanding of certain aspects of our financial performance, our management does not consider these measures to be a substitute for, or superior to, the information provided by GAAP financial statements.
| © 2020 Nuance Communications, Inc. All rights reserved | |
Exhibit 99.2
16 | 2020 Fourth Quarter and Fiscal Year Results |
Prepared Remarks | |
November 18, 2020 | |
Consistent with this approach, we believe that disclosing non-GAAP financial measures to the readers of our financial statements provides such readers with useful supplemental data that, while not a substitute for GAAP financial statements, allows for greater transparency in the review of our financial and operational performance. In assessing the overall health of the business during the three months ended September 30, 2020 and 2019, our management has either included or excluded items in seven general categories, each of which is described below.
Acquisition-related revenue and cost of revenue.
We provide supplementary non-GAAP financial measures of revenue that include revenue that we would have recognized but for the purchase accounting treatment of acquisition transactions. Non-GAAP revenue also includes revenue that we would have recognized had we not acquired intellectual property and other assets from the same customer. Because GAAP accounting requires the elimination of this revenue, GAAP results alone do not fully capture all of our economic activities. These non-GAAP adjustments are intended to reflect the full amount of such revenue. We include non-GAAP revenue and cost of revenue to allow for more complete comparisons to the financial results of historical operations, forward-looking guidance and the financial results of peer companies. We believe these adjustments are useful to management and investors as a measure of the ongoing performance of the business because, although we cannot be certain that customers will renew their contracts, we have historically experienced high renewal rates on maintenance and support agreements and other customer contracts. Additionally, although acquisition-related revenue adjustments are non-recurring with respect to past acquisitions, we generally will incur these adjustments in connection with any future acquisitions.
Restructuring and other costs, net.
Restructuring and other charges, net include restructuring expenses as well as other charges that are unusual in nature, are the result of unplanned events, and arise outside the ordinary course of our business. Restructuring expenses consist of employee severance costs, charges for the closure of excess facilities and other contract termination costs. Other charges include litigation contingency reserves, costs related to the transition agreement of our former CEO, asset impairment charges, expenses associated with the malware incident that occurred in the third quarter of fiscal year 2017 (the "2017 Malware Incident") and gains or losses on the sale or disposition of certain non-strategic assets or product lines.
Acquisition-related costs, net.
In recent years, we have completed a number of acquisitions, which result in operating expenses, which would not otherwise have been incurred. We provide supplementary non-GAAP financial measures, which exclude certain transition, integration and other acquisition-related expense items resulting from acquisitions, to allow more accurate comparisons of the financial results to historical operations, forward looking guidance and the financial results of less acquisitive peer companies. We consider these types of costs and adjustments, to a great extent, to be unpredictable and dependent on a significant number of factors that are outside of our control. Furthermore, we do not consider these acquisition-related costs and adjustments to be related to the organic continuing operations of the acquired businesses and are generally not relevant to assessing or estimating the long-term performance of the acquired assets. In addition, the size, complexity and/or volume of past acquisitions, which often drives the magnitude of acquisition related costs, may not be indicative of the size, complexity and/or volume of future acquisitions. By excluding acquisition-related costs and adjustments from our non-GAAP measures, management is better able to evaluate our ability to utilize our existing assets and estimate the long-term value that acquired assets will generate for us. We believe that providing a supplemental non-GAAP measure, which excludes these items allows management and investors to consider the ongoing operations of the business both with, and without, such expenses.
| © 2020 Nuance Communications, Inc. All rights reserved | |
Exhibit 99.2
17 | 2020 Fourth Quarter and Fiscal Year Results |
Prepared Remarks | |
November 18, 2020 | |
These acquisition-related costs fall into the following categories: (i) transition and integration costs; (ii) professional service fees and expenses; and (iii) acquisition-related adjustments. Although these expenses are not recurring with respect to past acquisitions, we generally will incur these expenses in connection with any future acquisitions. These categories are further discussed as follows:
(i) | Transition and integration costs. Transition and integration costs include retention payments, transitional employee costs, and earn-out payments treated as compensation expense, as well as the costs of integration-related activities, including services provided by third-parties. |
(ii) | Professional service fees and expenses. Professional service fees and expenses include financial advisory, legal, accounting and other outside services incurred in connection with acquisition activities, and disputes and regulatory matters related to acquired entities. |
(iii) | Acquisition-related adjustments. Acquisition-related adjustments include adjustments to acquisition-related items that are required to be marked to fair value each reporting period, such as contingent consideration, and other items related to acquisitions for which the measurement period has ended, such as gains or losses on settlements of pre-acquisition contingencies. |
Amortization of acquired intangible assets.
We exclude the amortization of acquired intangible assets from non-GAAP expense and income measures. These amounts are inconsistent in amount and frequency and are significantly impacted by the timing and size of acquisitions. Providing a supplemental measure which excludes these charges allows management and investors to evaluate results “as-if” the acquired intangible assets had been developed internally rather than acquired and, therefore, provides a supplemental measure of performance in which our acquired intellectual property is treated in a comparable manner to our internally developed intellectual property. Although we exclude amortization of acquired intangible assets from our non-GAAP expenses, we believe that it is important for investors to understand that such intangible assets contribute to revenue generation. Amortization of intangible assets that relate to past acquisitions will recur in future periods until such intangible assets have been fully amortized. Future acquisitions may result in the amortization of additional intangible assets.
Non-cash expenses.
We provide non-GAAP information relative to the following non-cash expenses: (i) stock-based compensation; and (ii) non-cash interest. These items are further discussed as follows:
(i) | Stock-based compensation. Because of varying valuation methodologies, subjective assumptions and the variety of award types, we believe that excluding stock-based compensation allows for more accurate comparisons of operating results to peer companies, as well as to times in our history when stock-based compensation was more or less significant as a portion of overall compensation than in the current period. We evaluate performance both with and without these measures because compensation expense related to stock-based compensation is typically non-cash and the options and restricted awards granted are influenced by the Company’s stock price and other factors such as volatility that are beyond our control. The expense related to stock-based awards is generally not controllable in the short-term and can vary significantly based on the timing, size and nature of awards granted. As such, we do not include such charges in operating plans. Stock-based compensation will continue in future periods. |
(ii) | Non-cash interest. We exclude non-cash interest because we believe that excluding this expense provides senior management, as well as other users of the financial statements, with a valuable perspective on the cash-based performance and health of the business, including the current |
| © 2020 Nuance Communications, Inc. All rights reserved | |
Exhibit 99.2
18 | 2020 Fourth Quarter and Fiscal Year Results |
Prepared Remarks | |
November 18, 2020 | |
near-term projected liquidity. Non-cash interest expense will continue in future periods.
Other expenses.
We exclude certain other expenses that result from unplanned events outside the ordinary course of continuing operations, in order to measure operating performance and current and future liquidity both with and without these expenses. By providing this information, we believe management and the users of the financial statements are better able to understand the financial results of what we consider to be our organic, continuing operations. Included in these expenses are items such as restructuring charges, asset impairments and other charges (credits), net, and losses from extinguishing our convertible debt. Other items such as consulting and professional services fees related to assessing strategic alternatives and our transformation programs, implementation of the new revenue recognition standard (ASC 606), and expenses associated with the malware incident and remediation thereof are also excluded.
Non-GAAP Operating Income and Non-GAAP EBITDA.
Our non-GAAP operating income includes acquisition-related revenue adjustments but excludes non-GAAP expenses such as stock compensation, amortization of intangible assets, restructuring and other costs, net, acquisition-related costs, net, and certain other expenses that result from unplanned events outside the ordinary course of continuing operations. Our non-GAAP EBITDA represents our non-GAAP operating income, adding back depreciation expense.
Non-GAAP income tax provision.
Our non-GAAP income tax provision is determined based on our non-GAAP pre-tax income. The tax effect of each non-GAAP adjustment, if applicable, is computed based on the statutory tax rate of the jurisdiction to which the adjustment relates. Additionally, as our non-GAAP profitability is higher based on the non-GAAP adjustments, we adjust the GAAP tax provision to remove valuation allowances and related effects based on the higher level of reported non-GAAP profitability. We also exclude from our non-GAAP tax provision certain discrete tax items as they occur.
Financial Tables Follow
| © 2020 Nuance Communications, Inc. All rights reserved | |
Exhibit 99.2
19 | 2020 Fourth Quarter and Fiscal Year Results |
Prepared Remarks | |
November 18, 2020 | |
Nuance Communications, Inc.
Condensed Consolidated Statements of Operations
(in thousands, except per share amounts)
Unaudited
Three Months Ended September 30, | Twelve Months Ended September 30, | ||||||||||||||
2020 | 2019 | 2020 | 2019 | ||||||||||||
Revenues: | |||||||||||||||
Hosting and professional services | $ | 234,749 | $ | 235,539 | $ | 926,044 | $ | 913,643 | |||||||
Product and licensing | 52,626 | 86,394 | 296,127 | 338,693 | |||||||||||
Maintenance and support | 65,556 | 65,642 | 256,728 | 268,935 | |||||||||||
Total revenues | 352,931 | 387,575 | 1,478,899 | 1,521,271 | |||||||||||
Cost of revenues: | |||||||||||||||
Hosting and professional services | 129,362 | 142,160 | 518,145 | 551,419 | |||||||||||
Product and licensing | 7,829 | 10,809 | 61,995 | 71,280 | |||||||||||
Maintenance and support | 7,952 | 8,556 | 30,989 | 33,369 | |||||||||||
Amortization of intangible assets | 8,132 | 6,810 | 27,810 | 27,416 | |||||||||||
Total cost of revenues | 153,275 | 168,335 | 638,939 | 683,484 | |||||||||||
Gross profit | 199,656 | 219,240 | 839,960 | 837,787 | |||||||||||
Operating expenses: | |||||||||||||||
Research and development | 56,535 | 52,935 | 226,234 | 192,633 | |||||||||||
Sales and marketing | 71,477 | 73,647 | 273,324 | 274,031 | |||||||||||
General and administrative | 41,998 | 43,481 | 156,353 | 172,638 | |||||||||||
Amortization of intangible assets | 14,682 | 13,176 | 50,897 | 54,206 | |||||||||||
Acquisition-related costs, net | (721 | ) | 2,525 | 2,884 | 7,965 | ||||||||||
Restructuring and other charges, net | 2,748 | 2,701 | 17,680 | 29,147 | |||||||||||
Total operating expenses | 186,719 | 188,465 | 727,372 | 730,620 | |||||||||||
Income from operations | 12,937 | 30,775 | 112,588 | 107,167 | |||||||||||
Other expenses, net | (22,646 | ) | (27,794 | ) | (102,558 | ) | (107,260 | ) | |||||||
(Loss) income before income taxes | (9,709 | ) | 2,981 | 10,030 | (93 | ) | |||||||||
Provision (benefit) for income taxes | 13,042 | (24 | ) | (18,752 | ) | 12,105 | |||||||||
Net (loss) income from continuing operations | (22,751 | ) | 3,005 | 28,782 | (12,198 | ) | |||||||||
Net (loss) income from discontinued operations | (1,194 | ) | 105,124 | (7,386 | ) | 226,008 | |||||||||
Net (loss) income | $ | (23,945 | ) | $ | 108,129 | $ | 21,396 | $ | 213,810 | ||||||
Net (loss) income per common share - basic: | |||||||||||||||
Continuing operations | $ | (0.08 | ) | $ | 0.01 | $ | 0.10 | $ | (0.04 | ) | |||||
Discontinued operations | — | 0.37 | (0.02 | ) | 0.79 | ||||||||||
Total net (loss) income per basic common share | $ | (0.08 | ) | $ | 0.38 | $ | 0.08 | $ | 0.75 | ||||||
Net (loss) income per common share - diluted: | |||||||||||||||
Continuing operations | $ | (0.08 | ) | $ | 0.01 | $ | 0.10 | $ | (0.04 | ) | |||||
Discontinued operations | — | 0.36 | (0.03 | ) | 0.79 | ||||||||||
Total net (loss) income per diluted common share | $ | (0.08 | ) | $ | 0.37 | $ | 0.07 | $ | 0.75 | ||||||
Weighted average common shares outstanding: | |||||||||||||||
Basic | 282,556 | 285,754 | 282,644 | 286,347 | |||||||||||
Diluted | 282,556 | 291,598 | 291,994 | 286,347 | |||||||||||
| © 2020 Nuance Communications, Inc. All rights reserved | |
Exhibit 99.2
20 | 2020 Fourth Quarter and Fiscal Year Results |
Prepared Remarks | |
November 18, 2020 | |
Nuance Communications, Inc.
Condensed Consolidated Balance Sheets
(in thousands)
September 30, 2020 | September 30, 2019 | |||||||
Unaudited | ||||||||
ASSETS | ||||||||
Current assets: | ||||||||
Cash and cash equivalents | $ | 301,233 | $ | 560,961 | ||||
Marketable securities | 71,114 | 186,555 | ||||||
Accounts receivable, net | 200,576 | 240,673 | ||||||
Prepaid expenses and other current assets | 163,062 | 175,166 | ||||||
Current assets of discontinued operations | — | 91,858 | ||||||
Total current assets | 735,985 | 1,255,213 | ||||||
Marketable securities | — | 17,287 | ||||||
Land, building and equipment, net | 143,428 | 121,203 | ||||||
Goodwill | 2,133,712 | 2,127,896 | ||||||
Intangible assets, net | 213,484 | 291,371 | ||||||
Right-of-use assets | 110,276 | — | ||||||
Other assets | 256,447 | 316,215 | ||||||
Long-term assets of discontinued operations | — | 1,236,608 | ||||||
Total assets | $ | 3,593,332 | $ | 5,365,793 | ||||
LIABILITIES AND STOCKHOLDERS' EQUITY | ||||||||
Current liabilities: | ||||||||
Current portion of long-term debt | $ | 432,209 | $ | 1,142,870 | ||||
Contingent and deferred acquisition payments | 4,224 | 17,470 | ||||||
Accounts payable | 75,122 | 90,826 | ||||||
Accrued expenses and other current liabilities | 213,264 | 249,570 | ||||||
Deferred revenue | 261,323 | 214,223 | ||||||
Current liabilities of discontinued operations | — | 130,117 | ||||||
Total current liabilities | 986,142 | 1,845,076 | ||||||
Long-term debt | 1,104,464 | 793,536 | ||||||
Deferred revenue, net of current portion | 104,309 | 133,783 | ||||||
Deferred tax liability | 70,116 | 54,216 | ||||||
Operating lease liabilities | 107,621 | — | ||||||
Other liabilities | 76,747 | 79,378 | ||||||
Long-term liabilities of discontinued operations | — | 286,654 | ||||||
Total liabilities | 2,449,399 | 3,192,643 | ||||||
Stockholders' equity | 1,143,933 | 2,173,150 | ||||||
Total liabilities and stockholders' equity | $ | 3,593,332 | $ | 5,365,793 | ||||
| © 2020 Nuance Communications, Inc. All rights reserved | |
Exhibit 99.2
21 | 2020 Fourth Quarter and Fiscal Year Results |
Prepared Remarks | |
November 18, 2020 | |
Nuance Communications, Inc.
Consolidated Statements of Cash Flows
(in thousands)
Unaudited
Three Months Ended September 30, | Twelve Months Ended September 30, | ||||||||||||||
2020 | 2019 | 2020 | 2019 | ||||||||||||
Cash flows from operating activities: | |||||||||||||||
Net (loss) income from continuing operations | $ | (22,751 | ) | $ | 3,005 | $ | 28,782 | $ | (12,198 | ) | |||||
Adjustments to reconcile net (loss) income to net cash provided by operating activities: | |||||||||||||||
Depreciation | 9,782 | 10,300 | 37,772 | 47,417 | |||||||||||
Amortization | 22,814 | 19,986 | 78,707 | 81,622 | |||||||||||
Stock-based compensation | 35,264 | 34,779 | 133,294 | 119,255 | |||||||||||
Non-cash interest expense | 12,171 | 12,477 | 49,440 | 49,488 | |||||||||||
Deferred tax provision (benefit) | 15,689 | (7,311 | ) | (39,937 | ) | (12,437 | ) | ||||||||
Loss on extinguishment of debt | — | — | 18,656 | 910 | |||||||||||
Other | (169 | ) | 5,113 | 2,736 | 4,462 | ||||||||||
Changes in operating assets and liabilities, excluding effects of acquisitions: | |||||||||||||||
Accounts receivable | 15,811 | (8,952 | ) | 42,075 | 3,366 | ||||||||||
Prepaid expenses and other assets | (12,289 | ) | (6,303 | ) | (7,259 | ) | (21,063 | ) | |||||||
Accounts payable | 7,695 | 3,853 | (8,173 | ) | 12,122 | ||||||||||
Accrued expenses and other liabilities | 686 | 24,568 | (84,076 | ) | 27,415 | ||||||||||
Deferred revenue | (3,852 | ) | (12,221 | ) | 15,854 | 4,227 | |||||||||
Net cash provided by operating activities - continuing operations | 80,851 | 79,294 | 267,871 | 304,586 | |||||||||||
Net cash provided by (used in) operating activities - discontinued operations | — | 24,869 | (13,307 | ) | 96,771 | ||||||||||
Net cash provided by operating activities | 80,851 | 104,163 | 254,564 | 401,357 | |||||||||||
Cash flows from investing activities: | |||||||||||||||
Capital expenditures | (15,747 | ) | (11,942 | ) | (61,297 | ) | (44,185 | ) | |||||||
Proceeds from disposition of a business, net of transaction fees | 150 | — | 150 | 407,043 | |||||||||||
Purchases of marketable securities and other investments | (22,029 | ) | (92,793 | ) | (180,005 | ) | (349,125 | ) | |||||||
Proceeds from sales and maturities of marketable securities and other investments | 23,150 | 40,257 | 313,734 | 303,171 | |||||||||||
Payments for business and asset acquisitions, net of cash acquired | (1,000 | ) | (17,771 | ) | (1,000 | ) | (20,873 | ) | |||||||
Other | (227 | ) | — | 1,147 | — | ||||||||||
Net cash (used in) provided by investing activities | (15,703 | ) | (82,249 | ) | 72,729 | 296,031 | |||||||||
Cash flows from financing activities: | |||||||||||||||
Repurchase and redemption of debt | — | — | (513,642 | ) | (300,000 | ) | |||||||||
Net distribution from Cerence upon the spin-off | — | — | 139,090 | — | |||||||||||
Payments for repurchase of common stock | — | (6,003 | ) | (169,217 | ) | (126,938 | ) | ||||||||
Proceeds from issuance of common stock from employee stock plans | 7,636 | 7,954 | 14,840 | 16,597 | |||||||||||
Proceeds from the revolving credit facility | — | — | 230,000 | — | |||||||||||
Repayment of the revolving credit facility | — | — | (230,000 | ) | — | ||||||||||
Payments for taxes related to net share settlement of equity awards | (14,088 | ) | (6,866 | ) | (54,056 | ) | (49,428 | ) | |||||||
Proceeds from sale of noncontrolling interests in a subsidiary | — | 9,863 | — | 9,863 | |||||||||||
Other financing activities | (381 | ) | (689 | ) | (3,222 | ) | (2,131 | ) | |||||||
Net cash (used in) provided by financing activities | (6,833 | ) | 4,259 | (586,207 | ) | (452,037 | ) | ||||||||
Effects of exchange rate changes on cash and cash equivalents | 2,363 | (1,589 | ) | (814 | ) | (353 | ) | ||||||||
Net increase (decrease) in cash and cash equivalents | 60,678 | 24,584 | (259,728 | ) | 244,998 | ||||||||||
Cash and cash equivalents at beginning of period | 240,555 | 536,377 | 560,961 | 315,963 | |||||||||||
Cash and cash equivalents at end of period | $ | 301,233 | $ | 560,961 | $ | 301,233 | $ | 560,961 | |||||||
| © 2020 Nuance Communications, Inc. All rights reserved | |
Exhibit 99.2
22 | 2020 Fourth Quarter and Fiscal Year Results |
Prepared Remarks | |
November 18, 2020 | |
| © 2020 Nuance Communications, Inc. All rights reserved | |
Exhibit 99.2
23 | 2020 Fourth Quarter and Fiscal Year Results |
Prepared Remarks | |
November 18, 2020 | |
Nuance Communications, Inc.
Supplemental Financial Information – GAAP to Non-GAAP Reconciliations
(in millions)
Unaudited
Q1 | Q2 | Q3 | Q4 | FY | Q1 | Q2 | Q3 | Q4 | FY | ||||||||||||||||||||||||||||||
2019 | 2019 | 2019 | 2019 | 2019 | 2020 | 2020 | 2020 | 2020 | 2020 | ||||||||||||||||||||||||||||||
GAAP revenue | $ | 419.7 | $ | 336.6 | $ | 377.4 | $ | 387.6 | $ | 1,521.3 | $ | 418.2 | $ | 369.3 | $ | 338.4 | $ | 352.9 | $ | 1,478.9 | |||||||||||||||||||
Acquisition-related revenue adjustments | 0.4 | 0.4 | 0.6 | 0.2 | 1.5 | 0.1 | 0.2 | — | — | 0.3 | |||||||||||||||||||||||||||||
Other | (0.1 | ) | (0.1 | ) | 0.1 | — | — | — | — | — | — | — | |||||||||||||||||||||||||||
Non-GAAP revenue | $ | 420.0 | $ | 336.9 | $ | 378.1 | $ | 387.8 | $ | 1,522.8 | $ | 418.3 | $ | 369.5 | $ | 338.4 | $ | 352.9 | $ | 1,479.2 | |||||||||||||||||||
GAAP gross profit | $ | 235.6 | $ | 177.3 | $ | 205.7 | $ | 219.2 | $ | 837.8 | $ | 233.8 | $ | 212.2 | $ | 194.2 | $ | 199.7 | $ | 840.0 | |||||||||||||||||||
Acquisition-related revenue adjustments | 0.4 | 0.4 | 0.6 | 0.2 | 1.5 | 0.1 | 0.2 | — | — | 0.3 | |||||||||||||||||||||||||||||
Amortization of intangible assets (1) | 7.4 | 6.7 | 6.6 | 6.8 | 27.4 | 6.6 | 6.6 | 6.4 | 8.1 | 27.8 | |||||||||||||||||||||||||||||
Stock-based compensation (2) | 7.0 | 5.2 | 7.7 | 8.8 | 28.9 | 6.1 | 7.1 | 6.7 | 7.2 | 27.1 | |||||||||||||||||||||||||||||
Other | 0.3 | — | — | — | 0.3 | 0.1 | — | — | — | — | |||||||||||||||||||||||||||||
Non-GAAP gross profit | $ | 250.7 | $ | 189.6 | $ | 220.6 | $ | 235.0 | $ | 895.9 | $ | 246.7 | $ | 226.1 | $ | 207.3 | $ | 215.0 | $ | 895.1 | |||||||||||||||||||
GAAP income (loss) from operations | $ | 46.8 | $ | (1.7 | ) | $ | 31.3 | $ | 30.8 | $ | 107.2 | $ | 52.1 | $ | 25.1 | $ | 22.4 | $ | 12.9 | $ | 112.6 | ||||||||||||||||||
Acquisition-related revenue adjustments | 0.4 | 0.4 | 0.6 | 0.2 | 1.5 | 0.1 | 0.2 | — | — | 0.3 | |||||||||||||||||||||||||||||
Amortization of intangible assets (1) | 21.2 | 20.5 | 19.9 | 20.0 | 81.6 | 19.2 | 18.4 | 18.3 | 22.8 | 78.7 | |||||||||||||||||||||||||||||
Stock-based compensation (2) | 29.5 | 24.8 | 30.2 | 34.8 | 119.3 | 31.2 | 33.7 | 33.1 | 35.3 | 133.3 | |||||||||||||||||||||||||||||
Acquisition-related costs, net | 2.6 | 2.1 | 0.8 | 2.5 | 8.0 | 1.2 | 1.7 | 0.8 | (0.7 | ) | 2.9 | ||||||||||||||||||||||||||||
Restructuring and other costs, net | 14.6 | 9.9 | 1.9 | 2.7 | 29.1 | 6.7 | 6.3 | 1.9 | 2.7 | 17.7 | |||||||||||||||||||||||||||||
Other | 4.7 | 1.3 | 7.1 | 3.1 | 16.3 | 0.2 | (1.5 | ) | 1.9 | 3.3 | 3.9 | ||||||||||||||||||||||||||||
Non-GAAP income from operations | $ | 119.8 | $ | 57.3 | $ | 91.8 | $ | 94.1 | $ | 363.0 | $ | 110.7 | $ | 83.9 | $ | 78.4 | $ | 76.3 | $ | 349.4 | |||||||||||||||||||
GAAP net income (loss) | $ | 13.9 | $ | (28.4 | ) | $ | (0.7 | ) | $ | 3.0 | $ | (12.2 | ) | $ | 54.9 | $ | (20.0 | ) | $ | 16.7 | $ | (22.8 | ) | $ | 28.8 | ||||||||||||||
Provision (benefit) for income taxes | 2.0 | (0.6 | ) | 10.7 | — | 12.1 | (36.4 | ) | 21.3 | (16.7 | ) | 13.0 | (18.8 | ) | |||||||||||||||||||||||||
Other expense, net | 30.9 | 27.3 | 21.3 | 27.8 | 107.3 | 33.7 | 23.8 | 22.4 | 22.6 | 102.6 | |||||||||||||||||||||||||||||
Acquisition-related revenue adjustments | 0.4 | 0.4 | 0.6 | 0.2 | 1.5 | 0.1 | 0.2 | — | — | 0.3 | |||||||||||||||||||||||||||||
Amortization of intangible assets (1) | 21.2 | 20.5 | 19.9 | 20.0 | 81.6 | 19.2 | 18.4 | 18.3 | 22.8 | 78.7 | |||||||||||||||||||||||||||||
Stock-based compensation (2) | 29.5 | 24.8 | 30.2 | 34.8 | 119.3 | 31.2 | 33.7 | 33.1 | 35.3 | 133.3 | |||||||||||||||||||||||||||||
Acquisition-related costs, net | 2.6 | 2.1 | 0.8 | 2.5 | 8.0 | 1.2 | 1.7 | 0.8 | (0.7 | ) | 2.9 | ||||||||||||||||||||||||||||
Restructuring and other costs, net | 14.6 | 9.9 | 1.9 | 2.7 | 29.1 | 6.7 | 6.3 | 1.9 | 2.7 | 17.7 | |||||||||||||||||||||||||||||
Depreciation expense | 12.8 | 12.5 | 11.0 | 10.3 | 46.6 | 10.2 | 9.0 | 8.8 | 9.8 | 37.8 | |||||||||||||||||||||||||||||
Other | 4.7 | 1.3 | 7.1 | 3.1 | 16.3 | 0.2 | (1.5 | ) | 1.9 | 3.3 | 3.9 | ||||||||||||||||||||||||||||
Non-GAAP EBITDA | $ | 132.6 | $ | 69.8 | $ | 102.8 | $ | 104.5 | $ | 409.6 | $ | 120.9 | $ | 92.9 | $ | 87.2 | $ | 86.1 | $ | 387.2 | |||||||||||||||||||
Schedules may not add due to rounding.
| © 2020 Nuance Communications, Inc. All rights reserved | |
Exhibit 99.2
24 | 2020 Fourth Quarter and Fiscal Year Results |
Prepared Remarks | |
November 18, 2020 | |
Nuance Communications, Inc.
Supplemental Financial Information – GAAP to Non-GAAP Reconciliations, continued
(in millions, except per share amounts)
Unaudited
Q1 | Q2 | Q3 | Q4 | FY | Q1 | Q2 | Q3 | Q4 | FY | ||||||||||||||||||||||||||||||
2019 | 2019 | 2019 | 2019 | 2019 | 2020 | 2020 | 2020 | 2020 | 2020 | ||||||||||||||||||||||||||||||
GAAP net income (loss) from continuing operations | $ | 13.9 | $ | (28.4 | ) | $ | (0.7 | ) | $ | 3.0 | $ | (12.2 | ) | $ | 54.9 | $ | (20.0 | ) | $ | 16.7 | $ | (22.8 | ) | $ | 28.8 | ||||||||||||||
Acquisition-related revenue adjustments | 0.4 | 0.4 | 0.6 | 0.2 | 1.5 | 0.1 | 0.2 | — | — | 0.3 | |||||||||||||||||||||||||||||
Amortization of intangible assets (1) | 21.2 | 20.5 | 19.9 | 20.0 | 81.6 | 19.2 | 18.4 | 18.3 | 22.8 | 78.7 | |||||||||||||||||||||||||||||
Stock-based compensation (2) | 29.5 | 24.8 | 30.2 | 34.8 | 119.3 | 31.2 | 33.7 | 33.1 | 35.3 | 133.3 | |||||||||||||||||||||||||||||
Acquisition-related costs, net | 2.6 | 2.1 | 0.8 | 2.5 | 8.0 | 1.2 | 1.7 | 0.8 | (0.7 | ) | 2.9 | ||||||||||||||||||||||||||||
Restructuring and other costs, net | 14.6 | 9.9 | 1.9 | 2.7 | 29.1 | 6.7 | 6.3 | 1.9 | 2.7 | 17.7 | |||||||||||||||||||||||||||||
Non-cash interest expense | 12.3 | 12.4 | 12.4 | 12.5 | 49.5 | 12.4 | 12.3 | 12.0 | 12.2 | 48.8 | |||||||||||||||||||||||||||||
Loss on extinguishment of debt | — | 0.9 | — | — | 0.9 | 14.7 | 3.6 | — | — | 18.3 | |||||||||||||||||||||||||||||
Non-GAAP tax adjustments | (21.1 | ) | (13.4 | ) | (12.9 | ) | (17.6 | ) | (64.8 | ) | (62.2 | ) | 4.7 | (32.2 | ) | 1.4 | (88.3 | ) | |||||||||||||||||||||
Other | 5.1 | 1.6 | 5.0 | 7.8 | 19.6 | 0.4 | (1.2 | ) | 0.4 | 3.3 | 2.9 | ||||||||||||||||||||||||||||
Non-GAAP net income | $ | 78.5 | $ | 30.8 | $ | 57.2 | $ | 65.9 | $ | 232.5 | $ | 78.6 | $ | 59.7 | $ | 51.0 | $ | 54.2 | $ | 243.4 | |||||||||||||||||||
GAAP diluted net income (loss) per share | $ | 0.05 | $ | (0.10 | ) | $ | — | $ | 0.01 | $ | (0.04 | ) | $ | 0.19 | $ | (0.07 | ) | $ | 0.06 | $ | (0.08 | ) | $ | 0.10 | |||||||||||||||
Acquisition-related revenue adjustments | — | — | — | — | — | — | — | — | — | — | |||||||||||||||||||||||||||||
Amortization of intangible assets (1) | 0.07 | 0.07 | 0.07 | 0.07 | 0.28 | 0.07 | 0.06 | 0.06 | 0.08 | 0.27 | |||||||||||||||||||||||||||||
Stock-based compensation (2) | 0.10 | 0.09 | 0.10 | 0.12 | 0.41 | 0.11 | 0.12 | 0.11 | 0.12 | 0.46 | |||||||||||||||||||||||||||||
Acquisition-related costs, net | 0.01 | 0.01 | — | 0.01 | 0.03 | — | 0.01 | — | — | 0.01 | |||||||||||||||||||||||||||||
Restructuring and other costs, net | 0.05 | 0.03 | 0.01 | 0.01 | 0.10 | 0.02 | 0.02 | 0.01 | 0.01 | 0.06 | |||||||||||||||||||||||||||||
Non-cash interest expense | 0.04 | 0.04 | 0.04 | 0.04 | 0.17 | 0.04 | 0.04 | 0.04 | 0.04 | 0.17 | |||||||||||||||||||||||||||||
Loss on extinguishment of debt | — | — | — | — | — | 0.05 | 0.01 | — | — | 0.06 | |||||||||||||||||||||||||||||
Non-GAAP tax adjustments | (0.07 | ) | (0.05 | ) | (0.04 | ) | (0.06 | ) | (0.22 | ) | (0.21 | ) | 0.02 | (0.11 | ) | — | (0.30 | ) | |||||||||||||||||||||
Other | 0.02 | 0.02 | 0.02 | 0.03 | 0.07 | — | — | 0.01 | 0.01 | — | |||||||||||||||||||||||||||||
Non-GAAP diluted net income per share | $ | 0.27 | $ | 0.11 | $ | 0.20 | $ | 0.23 | $ | 0.80 | $ | 0.27 | $ | 0.21 | $ | 0.18 | $ | 0.18 | $ | 0.83 | |||||||||||||||||||
Diluted weighted average shares outstanding | 292,359 | 287,866 | 288,648 | 291,598 | 290,125 | 289,453 | 286,949 | 287,852 | 303,689 | 291,994 | |||||||||||||||||||||||||||||
GAAP provision (benefit) for income taxes | $ | 2.0 | $ | (0.6 | ) | $ | 10.7 | $ | — | $ | 12.1 | $ | (36.4 | ) | $ | 21.3 | $ | (16.7 | ) | $ | 13.0 | $ | (18.8 | ) | |||||||||||||||
Income tax effect of non-GAAP adjustments | 25.8 | 28.6 | 18.6 | 190.4 | 263.3 | 20.7 | 10.1 | 14.7 | 13.3 | 58.8 | |||||||||||||||||||||||||||||
Removal of valuation allowance and other items | (6.0 | ) | (15.2 | ) | (5.4 | ) | (193.9 | ) | (220.5 | ) | 41.5 | (7.5 | ) | 2.7 | (9.9 | ) | 26.9 | ||||||||||||||||||||||
Removal of discrete items | 1.3 | — | (0.3 | ) | 21.1 | 22.0 | — | (7.3 | ) | 14.8 | (4.8 | ) | 2.7 | ||||||||||||||||||||||||||
Non-GAAP provision for income taxes | $ | 23.1 | $ | 12.7 | $ | 23.6 | $ | 17.5 | $ | 76.9 | $ | 25.7 | $ | 16.7 | $ | 15.5 | $ | 11.6 | $ | 69.6 | |||||||||||||||||||
GAAP interest expense | $ | 32.3 | $ | 31.2 | $ | 28.4 | $ | 28.3 | $ | 120.1 | $ | 23.8 | $ | 23.6 | $ | 23.7 | $ | 22.8 | $ | 94.0 | |||||||||||||||||||
Non-cash interest expense | (12.3 | ) | (12.4 | ) | (12.4 | ) | (12.5 | ) | (49.5 | ) | (12.4 | ) | (12.3 | ) | (12.0 | ) | (12.2 | ) | (48.8 | ) | |||||||||||||||||||
Non-GAAP interest expense | $ | 20.0 | $ | 18.8 | $ | 16.0 | $ | 15.8 | $ | 70.6 | $ | 11.4 | $ | 11.3 | $ | 11.7 | $ | 10.7 | $ | 45.2 | |||||||||||||||||||
Schedules may not add due to rounding.
| © 2020 Nuance Communications, Inc. All rights reserved | |
Exhibit 99.2
25 | 2020 Fourth Quarter and Fiscal Year Results |
Prepared Remarks | |
November 18, 2020 | |
Nuance Communications, Inc.
Supplemental Financial Information – GAAP to Non-GAAP Reconciliations, continued
(in millions)
Unaudited
Q1 | Q2 | Q3 | Q4 | FY | Q1 | Q2 | Q3 | Q4 | FY | ||||||||||||||||||||||||||||||
2019 | 2019 | 2019 | 2019 | 2019 | 2020 | 2020 | 2020 | 2020 | 2020 | ||||||||||||||||||||||||||||||
(1) Amortization of intangible assets | |||||||||||||||||||||||||||||||||||||||
Amortization of intangible assets - Costs | $ | 7.4 | $ | 6.7 | $ | 6.6 | $ | 6.8 | $ | 27.4 | $ | 6.6 | $ | 6.6 | $ | 6.4 | $ | 8.1 | $ | 27.8 | |||||||||||||||||||
Amortization of intangible assets - Operating expenses | 13.8 | 13.8 | 13.4 | 13.2 | 54.2 | 12.5 | 11.8 | 11.8 | 14.7 | 50.9 | |||||||||||||||||||||||||||||
Total | $ | 21.2 | $ | 20.5 | $ | 19.9 | $ | 20.0 | $ | 81.6 | $ | 19.2 | $ | 18.4 | $ | 18.3 | $ | 22.8 | $ | 78.7 | |||||||||||||||||||
(2) Stock-based compensation | |||||||||||||||||||||||||||||||||||||||
Cost of hosting and professional services | $ | 7.0 | $ | 4.7 | $ | 7.0 | $ | 8.0 | $ | 26.7 | $ | 5.5 | $ | 6.5 | $ | 6.2 | $ | 6.6 | $ | 24.9 | |||||||||||||||||||
Cost of product and licensing | 0.3 | 0.1 | 0.2 | 0.3 | 0.9 | 0.1 | 0.1 | 0.1 | 0.1 | 0.5 | |||||||||||||||||||||||||||||
Cost of maintenance and support | (0.2 | ) | 0.4 | 0.6 | 0.6 | 1.3 | 0.4 | 0.5 | 0.4 | 0.5 | 1.7 | ||||||||||||||||||||||||||||
Research and development | 5.4 | 4.5 | 5.7 | 6.9 | 22.5 | 8.7 | 8.7 | 8.7 | 8.8 | 34.9 | |||||||||||||||||||||||||||||
Sales and marketing | 8.2 | 6.6 | 6.8 | 8.8 | 30.3 | 7.0 | 8.0 | 8.0 | 9.0 | 32.0 | |||||||||||||||||||||||||||||
General and administrative | 8.9 | 8.4 | 10.0 | 10.2 | 37.6 | 9.4 | 9.9 | 9.7 | 10.2 | 39.3 | |||||||||||||||||||||||||||||
Total | $ | 29.5 | $ | 24.8 | $ | 30.2 | $ | 34.8 | $ | 119.3 | $ | 31.2 | $ | 33.7 | $ | 33.1 | $ | 35.3 | $ | 133.3 | |||||||||||||||||||
Schedules may not add due to rounding.
| © 2020 Nuance Communications, Inc. All rights reserved | |
Exhibit 99.2
26 | 2020 Fourth Quarter and Fiscal Year Results |
Prepared Remarks | |
November 18, 2020 | |
Nuance Communications, Inc.
Supplemental Financial Information – GAAP to Non-GAAP Reconciliations, continued
(in millions)
Unaudited
Total Revenues from Continuing Operations | Q1 | Q2 | Q3 | Q4 | FY | Q1 | Q2 | Q3 | Q4 | FY | |||||||||||||||||||||||||||||
2019 | 2019 | 2019 | 2019 | 2019 | 2020 | 2020 | 2020 | 2020 | 2020 | ||||||||||||||||||||||||||||||
GAAP Revenues | $ | 419.7 | $ | 336.6 | $ | 377.4 | $ | 387.6 | $ | 1,521.3 | $ | 418.2 | $ | 369.3 | $ | 338.4 | $ | 352.9 | $ | 1,478.9 | |||||||||||||||||||
Adjustment | 0.4 | 0.4 | 0.6 | 0.2 | 1.5 | 0.1 | 0.2 | — | — | 0.3 | |||||||||||||||||||||||||||||
Non-GAAP Revenues | $ | 420.0 | $ | 336.9 | $ | 378.1 | $ | 387.8 | $ | 1,522.8 | $ | 418.3 | $ | 369.5 | $ | 338.4 | $ | 352.9 | $ | 1,479.2 | |||||||||||||||||||
Healthcare | Q1 | Q2 | Q3 | Q4 | FY | Q1 | Q2 | Q3 | Q4 | FY | |||||||||||||||||||||||||||||
2019 | 2019 | 2019 | 2019 | 2019 | 2020 | 2020 | 2020 | 2020 | 2020 | ||||||||||||||||||||||||||||||
GAAP Revenues | $ | 271.9 | $ | 204.4 | $ | 227.9 | $ | 245.6 | $ | 949.7 | $ | 270.5 | $ | 224.4 | $ | 199.9 | $ | 220.5 | $ | 915.3 | |||||||||||||||||||
Adjustment | 0.1 | 0.2 | 0.5 | 0.1 | 0.9 | — | — | — | — | — | |||||||||||||||||||||||||||||
Non-GAAP Revenues | $ | 272.0 | $ | 204.6 | $ | 228.4 | $ | 245.7 | $ | 950.6 | $ | 270.5 | $ | 224.4 | $ | 199.9 | $ | 220.5 | $ | 915.3 | |||||||||||||||||||
Enterprise | Q1 | Q2 | Q3 | Q4 | FY | Q1 | Q2 | Q3 | Q4 | FY | |||||||||||||||||||||||||||||
2019 | 2019 | 2019 | 2019 | 2019 | 2020 | 2020 | 2020 | 2020 | 2020 | ||||||||||||||||||||||||||||||
GAAP Revenues | $ | 129.5 | $ | 115.4 | $ | 137.8 | $ | 127.4 | $ | 510.2 | $ | 138.4 | $ | 137.2 | $ | 130.4 | $ | 123.7 | $ | 529.7 | |||||||||||||||||||
Adjustment | 0.2 | 0.2 | 0.1 | 0.1 | 0.6 | 0.1 | 0.2 | — | — | 0.3 | |||||||||||||||||||||||||||||
Non-GAAP Revenues | $ | 129.7 | $ | 115.6 | $ | 137.9 | $ | 127.5 | $ | 510.8 | $ | 138.5 | $ | 137.4 | $ | 130.4 | $ | 123.7 | $ | 530.0 | |||||||||||||||||||
Other | Q1 | Q2 | Q3 | Q4 | FY | Q1 | Q2 | Q3 | Q4 | FY | |||||||||||||||||||||||||||||
2019 | 2019 | 2019 | 2019 | 2019 | 2020 | 2020 | 2020 | 2020 | 2020 | ||||||||||||||||||||||||||||||
GAAP Revenues | $ | 18.4 | $ | 16.7 | $ | 11.8 | $ | 14.6 | $ | 61.5 | $ | 9.3 | $ | 7.7 | $ | 8.1 | $ | 8.7 | $ | 33.9 | |||||||||||||||||||
Adjustment | — | — | — | — | — | — | — | — | — | — | |||||||||||||||||||||||||||||
Non-GAAP Revenues | $ | 18.4 | $ | 16.7 | $ | 11.8 | $ | 14.6 | $ | 61.5 | $ | 9.3 | $ | 7.7 | $ | 8.1 | $ | 8.7 | $ | 33.9 | |||||||||||||||||||
Schedules may not add due to rounding.
| © 2020 Nuance Communications, Inc. All rights reserved | |
Exhibit 99.2
27 | 2020 Fourth Quarter and Fiscal Year Results |
Prepared Remarks | |
November 18, 2020 | |
Nuance Communications, Inc.
Supplemental Financial Information - GAAP to Non-GAAP Reconciliations, continued
(in millions)
Unaudited
Q1 | Q2 | Q3 | Q4 | FY | Q1 | Q2 | Q3 | Q4 | FY | ||||||||||||||||||||||||||||||
2019 | 2019 | 2019 | 2019 | 2019 | 2020 | 2020 | 2020 | 2020 | 2020 | ||||||||||||||||||||||||||||||
Total segment revenues | $ | 420.0 | $ | 336.9 | $ | 378.1 | $ | 387.8 | $ | 1,522.8 | $ | 418.3 | $ | 369.5 | $ | 338.4 | $ | 352.9 | $ | 1,479.2 | |||||||||||||||||||
Acquisition-related revenue adjustments | (0.4 | ) | (0.4 | ) | (0.6 | ) | (0.2 | ) | (1.5 | ) | (0.1 | ) | (0.2 | ) | — | — | (0.3 | ) | |||||||||||||||||||||
Total consolidated revenues | $ | 419.7 | $ | 336.6 | $ | 377.4 | $ | 387.6 | $ | 1,521.3 | $ | 418.2 | $ | 369.3 | $ | 338.4 | $ | 352.9 | $ | 1,478.9 | |||||||||||||||||||
Total segment profit | $ | 150.2 | $ | 87.7 | $ | 121.1 | $ | 125.3 | $ | 484.3 | $ | 140.9 | $ | 114.3 | $ | 104.9 | $ | 105.3 | $ | 465.4 | |||||||||||||||||||
Corporate expenses and other, net | (35.1 | ) | (31.8 | ) | (36.3 | ) | (34.3 | ) | (137.6 | ) | (30.5 | ) | (28.8 | ) | (28.4 | ) | (32.2 | ) | (119.9 | ) | |||||||||||||||||||
Acquisition-related revenues | (0.4 | ) | (0.3 | ) | (0.6 | ) | (0.2 | ) | (1.5 | ) | (0.1 | ) | (0.2 | ) | — | — | (0.3 | ) | |||||||||||||||||||||
Stock-based compensation | (29.5 | ) | (24.8 | ) | (30.2 | ) | (34.8 | ) | (119.3 | ) | (31.2 | ) | (33.7 | ) | (33.1 | ) | (35.3 | ) | (133.3 | ) | |||||||||||||||||||
Amortization of intangible assets | (21.2 | ) | (20.5 | ) | (19.9 | ) | (20.0 | ) | (81.6 | ) | (19.2 | ) | (18.4 | ) | (18.3 | ) | (22.8 | ) | (78.7 | ) | |||||||||||||||||||
Acquisition-related costs, net | (2.6 | ) | (2.1 | ) | (0.8 | ) | (2.5 | ) | (8.0 | ) | (1.2 | ) | (1.7 | ) | (0.8 | ) | 0.7 | (2.9 | ) | ||||||||||||||||||||
Restructuring and other charges, net | (14.6 | ) | (9.9 | ) | (1.9 | ) | (2.7 | ) | (29.1 | ) | (6.7 | ) | (6.3 | ) | (1.9 | ) | (2.7 | ) | (17.7 | ) | |||||||||||||||||||
Other expenses, net | (30.9 | ) | (27.3 | ) | (21.3 | ) | (27.8 | ) | (107.3 | ) | (33.7 | ) | (23.8 | ) | (22.4 | ) | (22.6 | ) | (102.6 | ) | |||||||||||||||||||
Income (loss) before income taxes | $ | 15.9 | $ | (29.0 | ) | $ | 10.0 | $ | 3.0 | $ | (0.1 | ) | $ | 18.4 | $ | 1.3 | $ | — | $ | (9.7 | ) | $ | 10.0 | ||||||||||||||||
Schedules may not add due to rounding.
| © 2020 Nuance Communications, Inc. All rights reserved | |
Exhibit 99.2
28 | 2020 Fourth Quarter and Fiscal Year Results |
Prepared Remarks | |
November 18, 2020 | |
Nuance Communications, Inc.
Reconciliation of Supplemental Financial Information
GAAP and non-GAAP Revenue and Net Income per Share Guidance
(in thousands, except per share amounts)
Unaudited
Three Months Ended December 31, 2020 | |||||||
Low | High | ||||||
GAAP revenue | $ | 325,000 | $ | 343,000 | |||
Acquisition-related adjustment - revenue | — | — | |||||
Non-GAAP revenue | $ | 325,000 | $ | 343,000 | |||
GAAP net (loss) income per share | $ | (0.05 | ) | $ | 0.01 | ||
Acquisition-related adjustment - revenue | — | — | |||||
Acquisition-related costs, net | — | — | |||||
Amortization of intangible assets | 0.04 | 0.04 | |||||
Non-cash stock-based compensation | 0.12 | 0.11 | |||||
Non-cash interest expense | 0.04 | 0.04 | |||||
Adjustment to income tax expense | (0.04 | ) | (0.05 | ) | |||
Restructuring and other charges, net | 0.04 | 0.04 | |||||
Other | — | — | |||||
Non-GAAP net income per share | $ | 0.15 | $ | 0.19 | |||
Shares used in computing GAAP and non-GAAP net income per share: | |||||||
Weighted average common shares: basic | 284,000 | 284,000 | |||||
Weighted average common shares: diluted | 312,000 | 312,000 | |||||
| © 2020 Nuance Communications, Inc. All rights reserved | |
Exhibit 99.2
29 | 2020 Fourth Quarter and Fiscal Year Results |
Prepared Remarks | |
November 18, 2020 | |
Nuance Communications, Inc.
Reconciliation of Supplemental Financial Information
GAAP and non-GAAP Revenue and Net Income per Share Guidance
(in thousands, except per share amounts)
Unaudited
Twelve Months Ended September 30, 2021 | |||||||
Low | High | ||||||
GAAP revenue | $ | 1,327,000 | $ | 1,367,000 | |||
Acquisition-related adjustment - revenue | — | — | |||||
Non-GAAP revenue | $ | 1,327,000 | $ | 1,367,000 | |||
GAAP net income per share | $ | — | $ | 0.08 | |||
Acquisition-related adjustment - revenue | — | — | |||||
Acquisition-related costs, net | — | — | |||||
Amortization of intangible assets | 0.16 | 0.16 | |||||
Non-cash stock-based compensation | 0.48 | 0.47 | |||||
Non-cash interest expense | 0.16 | 0.16 | |||||
Adjustment to income tax expense | (0.13 | ) | (0.14 | ) | |||
Restructuring and other charges, net | 0.04 | 0.04 | |||||
Loss on debt extinguishment | — | — | |||||
Other | — | — | |||||
Non-GAAP net income per share | $ | 0.71 | $ | 0.77 | |||
Shares used in computing GAAP and non-GAAP net income per share: | |||||||
Weighted average common shares: basic | 286,000 | 286,000 | |||||
Weighted average common shares: diluted | 313,000 | 313,000 | |||||
| © 2020 Nuance Communications, Inc. All rights reserved | |