Attached files
| file | filename |
|---|---|
| EX-32.2 - EX-32.2 - KURA SUSHI USA, INC. | krus-ex322_7.htm |
| EX-32.1 - EX-32.1 - KURA SUSHI USA, INC. | krus-ex321_6.htm |
| EX-31.2 - EX-31.2 - KURA SUSHI USA, INC. | krus-ex312_8.htm |
| EX-31.1 - EX-31.1 - KURA SUSHI USA, INC. | krus-ex311_9.htm |
| EX-23.2 - EX-23.2 - KURA SUSHI USA, INC. | krus-ex232_99.htm |
| EX-23.1 - EX-23.1 - KURA SUSHI USA, INC. | krus-ex231_10.htm |
| EX-4.2 - EX-4.2 - KURA SUSHI USA, INC. | krus-ex42_304.htm |
UNITED STATES
SECURITIES AND EXCHANGE COMMISSION
Washington, D.C. 20549
Form 10-K
|
☒ |
ANNUAL REPORT PURSUANT TO SECTION 13 OR 15(d) OF THE SECURITIES EXCHANGE ACT OF 1934 |
For the fiscal year ended August 31, 2020
OR
|
☐ |
TRANSITION REPORT PURSUANT TO SECTION 13 OR 15(d) OF THE SECURITIES EXCHANGE ACT OF 1934 |
For the transition period from to
COMMISSION FILE NO.: 001-39012
KURA SUSHI USA, INC.
(Exact name of registrant as specified in its charter)
|
Delaware |
26-3808434 |
|
(State or other jurisdiction of incorporation or organization) |
(I.R.S. Employer Identification Number) |
17461 Derian Avenue, Suite 200, Irvine, California 92614
(Address of principal executive offices and zip code)
(657) 333-4100
(Registrant’s telephone number, including area code)
Securities registered pursuant to Section 12(b) of the Act:
|
Title of Each Class |
|
Trading Symbol(s) |
|
Name of Each Exchange On Which Registered |
|
Class A Common Stock, $0.001 par value per share |
|
KRUS |
|
Nasdaq Global Market |
Securities registered pursuant to Section 12(g) of the Act: None
Indicate by check mark if the registrant is a well-known seasoned issuer, as defined in Rule 405 of the Securities Act. Yes ☐ No ☒
Indicate by check mark if the registrant is not required to file reports pursuant to Section 13 or Section 15(d) of the Act. Yes ☐ No ☒
Indicate by check mark whether the registrant (1) has filed all reports required to be filed by Section 13 or 15(d) of the Securities Exchange Act of 1934 during the preceding 12 months (or for such shorter period that the registrant was required to file such reports), and (2) has been subject to such filing requirements for the past 90 days. Yes ☒ No ☐
Indicate by check mark whether the Registrant has submitted electronically every Interactive Data File required to be submitted pursuant to Rule 405 of Regulation S-T (§232.405 of this chapter) during the preceding 12 months (or for such shorter period that the Registrant was required to submit such files). Yes ☒ No ☐
Indicate by check mark whether the registrant is a large accelerated filer, an accelerated filer, a non-accelerated filer, a smaller reporting, or an emerging growth company. See the definitions of “large accelerated filer,” “accelerated filer,” “smaller reporting company,” and “emerging growth company” in Rule 12b-2 of the Exchange Act.
|
Large Accelerated Filer |
☐ |
Accelerated Filer |
☐ |
|
Non-Accelerated Filer |
☒ |
Smaller Reporting Company |
☐ |
|
Emerging Growth Company |
☒ |
|
|
If an emerging growth company, indicate by check mark if the registrant has elected not to use the extended transition period for complying with any new or revised financial accounting standards provided pursuant to Section 13(a) of the Exchange Act. ☒
Indicate by check mark whether the registrant has filed a report on and attestation to its management’s assessment of the effectiveness of its internal control over financial reporting under Section 404(b) of the Sarbanes-Oxley Act (15 U.S.C. 7262(b)) by the registered public accounting firm that prepared or issued its audit report. ☐
Indicate by check mark whether the registrant is a shell company (as defined in Rule 12b-2 of the Exchange Act). Yes ☐ No ☒
As of February 29, 2020, the last business day of the registrant’s most recently completed second fiscal quarter, the aggregate market value of the registrant’s common stock held by non-affiliates of the registrant was $62 million, based on the closing sale price as reported on the Nasdaq Global Market.
As of November 11, 2020, the registrant had 7,342,272 shares of Class A common stock outstanding and 1,000,050 shares of Class B common stock outstanding.
DOCUMENTS INCORPORATED BY REFERENCE
The information required by Part III of this Form 10-K, to the extent not set forth herein, is incorporated by reference from the registrant’s definitive proxy statement for the 2021 annual meeting of stockholders, which will be filed no later than 120 days after the close of the registrant’s fiscal year ended August 31, 2020.
|
|
|
Page |
|
|
|
|
|
|
|
|
|
|
|
|
|
Item 1. |
5 |
|
|
|
|
|
|
Item 1A. |
15 |
|
|
|
|
|
|
Item 1B. |
38 |
|
|
|
|
|
|
Item 2. |
39 |
|
|
|
|
|
|
Item 3. |
39 |
|
|
|
|
|
|
Item 4. |
39 |
|
|
|
|
|
|
|
|
|
|
|
|
|
|
Item 5. |
40 |
|
|
|
|
|
|
Item 6. |
42 |
|
|
|
|
|
|
Item 7. |
Management’s Discussion and Analysis of Financial Condition and Results of Operations |
44 |
|
|
|
|
|
Item 7A. |
58 |
|
|
|
|
|
|
Item 8. |
59 |
|
|
|
|
|
|
Item 9. |
Changes in and Disagreements with Accountant on Accounting and Financial Disclosure |
88 |
|
|
|
|
|
Item 9A. |
88 |
|
|
|
|
|
|
Item 9B. |
88 |
|
|
|
|
|
|
|
|
|
|
|
|
|
|
Item 10. |
Directors, Executive Officers and Corporate Governance |
|
|
|
|
|
|
Item 11. |
Executive Compensation |
|
|
|
|
|
|
Item 12. |
Security Ownership of Certain Beneficial Owners and Management and Related Stockholder Matters |
|
|
|
|
|
|
Item 13. |
Certain Relationships and Related Transactions, and Director Independence |
|
|
|
|
|
|
Item 14. |
Principal Accountant Fees and Services |
|
|
|
|
|
|
|
|
|
|
|
|
|
|
Item 15. |
90 |
|
|
|
|
|
|
Item 16. |
92 |
SPECIAL NOTE REGARDING FORWARD-LOOKING STATEMENTS
This Annual Report on Form 10-K contains forward-looking statements within the meaning of the Private Securities Litigation Reform Act of 1995. All statements contained in this Annual Report on Form 10-K other than statements of historical fact, including statements regarding our future results of operations and financial position, our business strategy and plans, and our objectives for future operations, are forward-looking statements. The terms such as “target,” “may,” “might,” “will,” “objective,” “intend,” “should,” “could,” “can,” “would,” “expect,” “believe,” “design,” “estimate,” “continue,” “predict,” “potential,” “plan,” “anticipate” or the negative of these terms, and similar expressions are intended to identify forward-looking statements. We have based these forward-looking statements largely on our current expectations and projections about future events and trends that we believe may affect our financial condition, results of operations, business strategy, short-term and long-term business operations and objectives, and financial needs. These forward-looking statements are subject to a number of risks, uncertainties and assumptions, including but are not limited to:
|
|
• |
the impact and duration of the COVID-19 pandemic; |
|
|
• |
our ability to successfully maintain increases in our comparable restaurant sales and average unit volumes (“AUVs”); |
|
|
• |
our ability to successfully execute our growth strategy and open new restaurants that are profitable; |
|
|
• |
our ability to expand in existing and new markets; |
|
|
• |
our projected growth in the number of our restaurants; |
|
|
• |
macroeconomic conditions and other economic factors; |
|
|
• |
our ability to compete with many other restaurants; |
|
|
• |
our reliance on vendors, suppliers and distributors, including our parent company Kura Sushi, Inc.; |
|
|
• |
concerns regarding food safety and foodborne illness; |
|
|
• |
changes in consumer preferences and the level of acceptance of our restaurant concept in new markets; |
|
|
• |
minimum wage increases and mandated employee benefits that could cause a significant increase in our labor costs; |
|
|
• |
the failure of our automated equipment or information technology systems or the breach of our network security; |
|
|
• |
the loss of key members of our management team; |
|
|
• |
the impact of governmental laws and regulations; |
|
|
• |
volatility in the price of our common stock; |
|
|
• |
those other risk factors described in Part I, Item 1A, “Risk Factors” in this Annual Report on Form 10-K. |
Moreover, we operate in a very competitive and rapidly changing environment. New risks emerge from time to time. It is not possible for our management to predict all risks, nor can we assess the impact of all factors on our business or the extent to which any factor, or combination of factors, may cause actual results to differ materially from those contained in any forward-looking statements we may make. In light of these risks, uncertainties and assumptions, the future events and trends discussed in this Annual Report on Form 10-K may not occur and actual results could differ materially and adversely from those anticipated or implied in the forward-looking statements.
We undertake no obligation to revise or publicly release the results of any revision to these forward-looking statements, except as required by law. Given these risks and uncertainties, readers are cautioned not to place undue reliance on such forward-looking statements.
3
TRADEMARKS, SERVICE MARKS AND TRADE NAMES
We own or have rights to various trademarks, service marks and trade names that we use in connection with the operation of our business. This report may also contain trademarks, service marks and trade names of third parties, which are the property of their respective owners. Our use or display of third parties’ trademarks, service marks, trade names or food products in this report is not intended to imply a relationship with, or endorsement or sponsorship by, these other parties. Solely for convenience, the trademarks, service marks and trade names referred to in this report may appear without the ®, TM or SM symbols, but such references are not intended to indicate, in any way, that we will not assert, to the fullest extent under applicable law, our rights or the rights of the applicable licensor to these trademarks, service marks and trade names.
BASIS OF PRESENTATION
“Kura Sushi USA,” “Kura Sushi,” “Kura,” “we,” “us,” “our,” “our company” and the “Company” refer to Kura Sushi USA, Inc. unless expressly indicated or the context otherwise requires.
We refer to our Class A common stock as “common stock,” unless the context otherwise requires. We sometimes refer to our Class A common stock and Class B common stock as “equity interests” when described on an aggregate basis.
The Company’s fiscal year begins on September 1 and ends on August 31. We refer to our last three completed fiscal years as “fiscal year 2020,” “fiscal year 2019” and “fiscal year 2018.”
4
Company Overview
Kura Sushi USA, Inc. (“Kura Sushi”) is a technology-enabled Japanese restaurant concept that provides guests with a distinctive dining experience by serving authentic Japanese cuisine through an engaging revolving sushi service model, which we refer to as the “Kura Experience”. We encourage healthy lifestyles by serving freshly prepared Japanese cuisine using high-quality ingredients that are free from artificial seasonings, sweeteners, colorings, and preservatives. We aim to make quality Japanese cuisine accessible to our guests across the United States through affordable prices and an inviting atmosphere.
Kura Sushi is headquartered in Irvine, California and was established in 2008 as a subsidiary of Kura Sushi, Inc. (“Kura Japan”), a Japan-based revolving sushi chain with over 450 restaurants and 35 years of brand history. Kura Sushi opened its first restaurant in Irvine, California in 2009, and currently operates 28 restaurants across six states.
Effects of COVID-19 on Our Business
The negative effects of the COVID-19 pandemic on our business have been significant. In March 2020, the World Health Organization declared the novel strain of coronavirus COVID-19 a global pandemic. This contagious virus, which has continued to spread, has adversely affected workforces, customers, economies and financial markets globally. In response to this outbreak, many state and local authorities mandated the temporary closure of non-essential businesses and dine-in restaurant activity. COVID-19 and the government measures taken to control it have caused a significant disruption to our business operation. On March 18, 2020, we announced the temporary closure of all of our 25 restaurants located across five states at that time and had since furloughed certain of our employees. As restrictions lifted, we were able to reopen certain restaurants at reduced indoor dining capacities. We have also started offering outdoor dining at certain restaurants. As of the filing date of this Annual Report on Form 10-K, we have 28 restaurants with 12 restaurants operating with indoor dining at reduced capacities of 25% to 75% and 15 restaurants operating with outdoor dining or takeout only, depending on local requirements, and one restaurant temporarily closed.
To support our employees during this challenging time, we had maintained payroll for all employees through April 5, 2020 and all kitchen employees through May 9, 2020. We continued to maintain payroll for store managers and key kitchen staff during the time when their respective restaurants were temporarily closed. We also continued to pay our employee’s portion of health insurance for all furloughed employees through July 31, 2020. As our restaurants reopened, we were able to bring back certain furloughed employees.
In response to the ongoing COVID-19 pandemic, we have prioritized taking steps to protect the health and safety of our employees and customers. Currently, due to local government restrictions, the California restaurants are not utilizing the revolving conveyor belt. All food is ordered from the tableside touchscreen and delivered to the customers’ tables by the restaurant employees for indoor dining. For outdoor dining, food is ordered and delivered by the restaurant employees. We have also increased cleaning and sanitizing protocols of our restaurants and have implemented additional training and operational manuals for our restaurant employees, as well as increased handwashing procedures. We also provide each restaurant employee with face masks and gloves, and require each employee to pass a health screening process, which includes a temperature check, before the start of each shift.
The temporary restaurant closures and the reduced capacities at the reopened restaurants have caused a substantial decline in our sales in the most recently completed fiscal year. In light of the challenges posed by the COVID-19 pandemic, we are focused on maximizing our in-restaurant dining capacity as permitted by the jurisdictions where we operate, continuing to provide a safe environment for our employees and customers, maintaining our operational efficiencies as much as possible and preserving our liquidity. In line with our long-term growth strategy, we expect to continue to open new restaurants at locations where we believe they have the potential to achieve profitability. The future sales levels of our restaurants and our ability to implement our growth strategy, however, remain highly uncertain, as the full impact and duration of the COVID-19 pandemic continues to evolve as of the date of this Annual Report on Form 10-K. Please see “Item 7. Management’s Discussion and Analysis of
5
Financial Condition and Results of Operations and Note 1 – Organization and Description of Business” in this Annual Report on Form 10-K for additional information, including “Recent Events Concerning Our Financial Position”.
Corporate Overview
In November 2008, our parent company, Kura Japan, organized our predecessor, Kula West Irvine, Inc., a California corporation, as a wholly-owned subsidiary of Kura Japan. In June 2011, Kula West Irvine, Inc. changed its name to Kula Sushi USA, Inc., or “Kula Sushi”. In October 2017, Kula Sushi reincorporated to Delaware through a merger with a newly-formed wholly-owned Delaware subsidiary of Kura Japan named “Kura Sushi USA, Inc.” with a dual class structure.
Following the closing of our initial public offering (“IPO”) and after giving effect to a 1-for-2 reverse stock split of our Class A common stock and Class B common stock in 2019, Kura Japan currently owns all of our Class B common stock and 4,000,000 shares of our Class A common stock, representing approximately 81% of the combined voting power of our equity interests. As a result, we are a “controlled company” within the meaning of the corporate governance rules of the Nasdaq Stock Market, and Kura Japan can exert significant voting influence over fundamental and significant corporate matters and transactions and may have interests that differ from yours. See “Item 1A. Risk Factors—Risks Related to Our Organizational Structure.”
Our Strengths
Authentic Japanese Cuisine—A Tribute to Our Roots. We provide our guests with a Kura Experience that is uniquely Japanese and is based on the legacy built by Kura Japan. Kura Japan opened its first revolving sushi restaurant in 1984 and was among the pioneers of the revolving sushi restaurant model. Our various sushi items are made fresh using high-quality fish and certified 100% organic rice. Our vinegar, made using old-world methods, is sourced from Japan. Our broths are made in-house daily using ingredients that impart complex umami flavors. To complement our sushi selection, we offer a variety of side dishes and desserts including gyoza, tempura, soups, ramen, ojyu boxes, mochi, and cheesecake. In our commitment to our Japanese heritage and traditional cooking methods, we have prepared our food without artificial sweeteners, seasonings, colorings, or preservatives since our formation.
“Revolutionary” and Engaging Dining Experience. The Kura Experience is a multi-sensory experience for our guests comprised of the sight of our beautifully crafted cuisine weaving through our restaurants, the motion of dishes zipping by tables on the express belt, the sound of anime videos playing on tableside touch screens, the thrill of being rewarded for achieving dining milestones, and the flavor of authentic Japanese dishes, which collectively creates a highly entertaining and engaging environment for our guests. Our revolving conveyor belt service model offers a steady stream of dishes which feature a spiral green design and continuous service which we believe builds anticipation and a sense of discovery among our guests. To simplify the guest experience, all plates on the revolving conveyor belt are the same price within a restaurant. In addition, items ordered on our on-demand screen arrive on the express belt in a theatrical fashion, which we believe our guests find entertaining and also adds to the sense of constant motion in our restaurants. Our menu of small plates allows our guests to sample a variety of dishes, and with over 140 items on our menu, there is always something new to enjoy when our guests return. We also seek to delight and reward our guests for achieving dining milestones with short anime videos and a rotating selection of small toys from our Bikkura-Pon rewards machines. For every five spiral green plates placed into the plate slot, the tableside touch screen plays a short anime video, and for every 15 plates, our proprietary tableside Bikkura-Pon rewards machine dispenses a toy. We believe our Bikkura-Pon rewards machines encourage guests to consume a greater quantity of plates as they work towards achieving the next dining milestone. Our continuous service model creates an atmosphere of active participation where food is at the center of the conversation, and we believe it also creates a memorable and shareable experience for our guests. Due to local restrictions imposed as a result of the COVID-19 pandemic, the California restaurants have temporarily halted utilizing the revolving conveyor belt and all food is delivered by the restaurant employees.
Compelling Value Proposition with Broad Appeal. Our service model allows our guests to control their dining experience, from food variety to time spent on a meal, and from portions to check size. With instant access to food on the revolving conveyor belt, our guests can drop in for a quick meal or stay longer for a more relaxed dining
6
experience. Our guests can enjoy high-quality dishes at affordable prices as a result of our efficient kitchen operations and low front-of-house labor needs. The majority of our menu items is priced below $3.00, which appeals to guests with appetites and budgets both large and small. We believe that our authentic approach to a popular cuisine and unique and flexible dining experience appeal to a wide range of demographics. In addition, we believe our commitment to high-quality and non-artificial ingredients in our food is at the forefront of current dining trends as consumers continue to seek healthy and natural food options.
Highly Attractive Restaurant-Level Economics. At Kura Sushi, we leverage the disciplined operational expertise honed over the 35-year history of Kura Japan to help us achieve strong restaurant-level economics. We believe our results are driven by our high-volume restaurants, intelligent and efficient operations, and flexible real estate model:
|
|
• |
High-Volume Restaurants: We believe the combination of authentic Japanese cuisine at an accessible price point and a service model that promotes discovery, fun, and optionality for guests creates a highly differentiated dining experience that drives traffic and robust sales in our restaurants; |
|
|
• |
Intelligent and Efficient Operations: Our revolving conveyor belt, express belt, and touch screen menu enable self-service dining and reduce our need for service staff, though some of these equipment are currently suspended in our California restaurants to comply with local restrictions imposed as a result of the COVID-19 pandemic. Due to the COVID-19 pandemic, we began offering outdoor dining in certain of our restaurants in California. With outdoor dining, food is ordered with and delivered by our restaurant employees and therefore, staff costs are greater compared to indoor dining. In addition, our use of sushi robots, vinegar mixing machines, and automatic rice washers in our kitchens eliminates the need for highly trained and expensive sushi chefs. The proprietary technology deployed in our kitchens allows us to collect real-time data on food consumption and guest preferences which we analyze to further optimize our restaurants and enhance the dining experience; and |
|
|
• |
Flexible Real Estate: We have a flexible restaurant model which has allowed us to open restaurants as small as 1,600 square feet and as large as 6,800 square feet. We believe this allows us to maximize our sales per square foot. |
Our Growth Strategies
Pursue New Restaurant Development. We have pursued a disciplined new unit growth strategy having expanded our concept and operating model across varying restaurant sizes and geographies. We plan to leverage our expertise opening new restaurants to fill in existing markets and expand into new geographies with the same careful planning as we have demonstrated in the past. See also our real estate strategy under “Site Development and Expansion – Site Selection Process”. We believe that we have the potential to become a national Japanese restaurant brand, with a long-term total restaurant potential in the United States for over 290 restaurants, and we aim to achieve a 20% average annual restaurant growth rate over the next five years. While we currently aim to achieve a 20% average annual unit growth rate over the next five years, we cannot predict the time period of which we can achieve any level of restaurant growth or whether we will achieve this level of growth at all. Our ability to achieve new restaurant growth is impacted by a number of risks and uncertainties beyond our control, including those described under the caption “Risk Factors.”
Deliver Consistent Comparable Restaurant Sales Growth. We believe we will be able to generate comparable restaurant sales growth by growing traffic through increased brand awareness, consistent delivery of a unique and engaging dining experience, new menu offerings, and restaurant renovations. We will continue to manage our menu and pricing as part of our overall strategy to drive traffic and increase average check. We are also exploring initiatives to grow sales of alcoholic beverages at our restaurants, increase off-premises sales, enhance our rewards program, and improve our mobile application. Our rewards program has been rolled out across our entire restaurant base, tracks participants’ spending and provides a discount voucher if a spending threshold is achieved. To participate, guests sign up with their email addresses, download a virtual rewards card which is stored on their phones, and display the rewards card in the restaurant when paying the bill. To meet our customers’ growing demand for ordering food online and having food delivered to their home under the COVID-19 pandemic, we have implemented online and mobile ordering for takeout and third-party delivery.
7
Increase Profitability. During our expansion, we have invested in our infrastructure and personnel, which we believe positions us to continue to scale our business operations. As we continue to grow, we expect to drive higher profitability both at a restaurant-level and corporate-level by taking advantage of our increasing buying power with suppliers and leveraging our existing support infrastructure. Additionally, we believe we will be able to optimize labor costs at existing restaurants as our restaurant base matures and AUVs increase. We believe that as our restaurant base grows, our general and administrative costs will increase at a slower rate than our sales.
Heighten Brand Awareness. We intend to continue to pursue targeted local marketing efforts and plan to increase our investment in advertising while managing margins. We intend to continue to promote limited time offerings to build guest loyalty and brand awareness.
Site Development and Expansion
Site Selection Process
We consider site selection and real estate development to be critical to our success. As part of our strategic site selection process, our primary broker receives potential site locations from networks of local brokers, which are then reviewed by our store development and senior management teams. This review includes site visits and analyses of the profitability of proposed properties.
Our current real estate strategy focuses on high-traffic retail centers in markets with a diverse population and above-average household income. In site selection, we also consider factors such as residential and commercial population density, restaurant visibility, traffic patterns, accessibility, availability of suitable parking, proximity to highways, universities, shopping areas and office parks, the degree of competition within the market area, and general availability of restaurant-level employees. We also invest in site analytics tools for demographic analysis and data collection for both existing and new market areas, which we believe allows us to further understand the market area and determine whether to open new restaurants in that location.
Our flexible physical footprint allows us to open in-line and end-cap restaurant formats at strip malls and shopping centers and penetrate markets in both suburban and urban areas. We believe we have the ability to open additional restaurants in our existing metropolitan areas. We also believe there is significant opportunity to employ this strategy in new markets with similar demographics and retail environments.
Expansion Strategy
We plan to pursue a two-pronged expansion strategy by opening new restaurants in both new and existing markets. We believe this expansion will be crucial to executing our growth strategy and building awareness of Kura Sushi as a national Japanese casual dining brand. Expansion into new markets occurs in parallel with ongoing evaluation of existing markets, with the goal of maintaining a pipeline of top-tier development opportunities.
Upon selecting a new market, we typically build one restaurant to prove concept viability in that market. We have developed a remote management system whereby our operations team is able to monitor restaurants in real-time from our headquarters using approximately 20 to 30 cameras installed in each restaurant. We utilize this remote management system to maintain operational quality while minimizing inefficiencies caused by a lack of economies of scale in new markets.
Due to our relatively small restaurant count, new restaurants have an outsized impact on our financial performance. In order to mitigate risk, we look to expand simultaneously in new and existing markets. We base our site selection on our most successful existing restaurants and frequently reevaluate our strategy, pacing and markets.
Restaurant Design
Restaurant design is handled by our in-house real estate team in conjunction with outsourced vendor relationships. Our restaurant size currently averages approximately 3,400 square feet. Seating in our restaurant is comprised of a combination of booths and bar seats with an average seating capacity of approximately 120 guests. Our restaurant layout evokes a Japanese dining experience characterized by wooden booths and wood paneling to
8
house the revolving conveyor belt and the Bikkura-Pon rewards machines. To protect the safety of our customers and employees dining or working in our restaurants under the COVID-19 pandemic, we are installing booth dividers in all of our existing and new restaurants.
Construction of a new restaurant takes approximately four to five months. We oversee and coordinate engagement with our preferred general contractors for the restaurant construction process. On average, our restaurants opened since fiscal year 2019 required a cash build-out cost of approximately $1.8 million per restaurant, net of landlord tenant improvement allowances, but this figure could be materially higher or lower depending on the market, restaurant size, and condition of the premises upon landlord delivery.
Restaurant Management and Operations
Restaurant Management and Employees
Our restaurants typically employ one restaurant manager, two to four assistant managers, and approximately 30 to 70 additional team members depending on the store size. Managers, assistant managers and management trainees are cross-trained throughout the restaurant in order to create competency across critical restaurant functions, both in the dining area and in the kitchen.
In addition, our operations team monitors restaurants in real-time from our headquarters using our remote management system of approximately 20 to 30 cameras installed in each restaurant. These team members are responsible for different components of the restaurant: cleanliness, service, and food quality. We believe that establishing the operations team has enabled our restaurant managers to focus on guest service and efficient operations in our restaurants, and has eliminated the need for a regional management structure.
Training and Employee Programs
We devote significant resources to identifying, selecting, and training all employees. Restaurant management trainees undergo training in order to develop a deep understanding of our operations. In addition, we have extensive training manuals that cover all aspects of restaurant-level operations. In response to the COVID-19 pandemic, we have implemented additional training and operational manuals for our restaurant employees to provide a safe and sanitary environment for our customers and employees.
Our traveling “opening team” provides training to team members in advance of opening a new restaurant. We believe the opening team facilitates a smooth opening process and efficient restaurant operations from the first day a restaurant opens to the public. The opening team is typically on-site at new restaurants from two weeks before opening to four weeks after opening.
Food Preparation, Quality and Safety
Food safety is essential to our success and we have established procedures to help ensure that our guests enjoy safe, quality food. We require each employee to complete food handler safety certification upon hiring. We have taken various additional steps to mitigate food quality and safety risks, including the following:
|
|
• |
HACCP. To minimize the risk of food-borne illness, we have implemented a Hazard Analysis and Critical Control Points (“HACCP”) system for managing food safety and quality for sushi rice and other foods which require time and temperature control for safety; |
|
|
• |
Mr. Fresh. We use the proprietary Mr. Fresh dome, developed by Kura Japan, to protect each plate on the revolving conveyor belt. The Mr. Fresh dome is a plastic cover that opens when a guest selects the plate beneath the dome; |
|
|
• |
Revolving Conveyor Belt Time Limit. We limit the amount of time that our dishes remain on the revolving conveyor belt to two hours, which is shorter than the time required by local health authorities where we operate our restaurants. Once the RFID tag on Mr. Fresh registers over two hours, a robotic arm in our kitchen automatically removes the plate from the revolving conveyor belt; |
9
Shared Services Agreement with Kura Japan
Kura Sushi operates independently from Kura Japan but does utilize Kura Japan for certain services. On August 5, 2019, we entered into a Shared Services Agreement with Kura Japan, pursuant to which Kura Japan will provide us with certain strategic, operational and other support services, including assigning certain employees to work for us as expatriates to provide support to our operations, sending its employees to us on a short-term basis to provide support for the opening of new restaurants or renovation of existing restaurants, and providing us with certain supplies, parts and equipment for use in our restaurants. In addition, we have agreed to continue to provide Kura Japan with certain translational support services and market research analyses. In exchange for such services, supplies, parts and equipment, the parties will pay fees to each other as set forth under the Shared Services Agreement. The Shared Services Agreement may be modified or supplemented to include additional services under terms and conditions to be mutually agreed upon in good faith by the parties. The fees for additional services shall be mutually agreed upon by the parties.
Marketing and Advertising
We use a variety of marketing and advertising channels to build brand awareness, attract new guests, increase dining frequency, support new restaurant openings, and promote Kura Sushi as an authentic Japanese restaurant with high-quality cuisine and a distinctive dining experience. Our primary advertising channels include digital, social, and print. Our Bikkura-Pon rewards machine prizes are an additional form of marketing that we believe differentiates the Kura brand.
We maintain a presence on several social media platforms allowing us to regularly communicate with guests, alert guests of new offerings, and conduct promotions. Our dining experience is built to provide our guests social media shareable moments, which we believe extends our advertising reach.
We focus advertising efforts on new menu offerings to broaden our appeal to guests and drive traffic. Periodically, our menu changes to introduce new items and remove underperforming items. We promote these new menu additions through various social media platforms, our website and in-restaurant signage.
Periodically, we offer guests our limited-time offer promotions during which our restaurants feature premium, seasonal, and limited-availability ingredients from Japan. Most premium items are priced the same as standard menu items, thereby offering significant value to our guests.
Suppliers
We carefully select suppliers based on product quality and authenticity and their understanding of our brand, and we seek to develop long-term relationships with them. We identify and procure high-quality ingredients at competitive prices. We make a portion of our purchases annually in bulk at fixed prices, and we do not engage in any hedging agreements to manage our exposure to fluctuations in the price of seafood or other food commodities.
We source through the following two major Japanese-related distributors: JFC International Inc. (“JFC”), a subsidiary of Kikkoman Corporation, and Wismettac Asian Foods, Inc. (formerly Nishimoto Trading Co., Ltd.) (“Wismettac”), a subsidiary of Nishimoto Co., Ltd. Our spend with JFC accounted for approximately 59%, 55%,
10
and 47% of total food and beverage costs for fiscal years 2020, 2019, and 2018, respectively. Our spend with Wismettac was approximately 27% of our total food and beverage cost for fiscal year 2020 and was 28% of our total food and beverage costs for fiscal years 2019 and 2018. Our relationships with both Wismettac and JFC have been in place since 2009. We also source from other distributors. Our suppliers deliver to our restaurants approximately three times per week. If we are no longer able to source through any of our suppliers, we intend to replace the supplier with a different source, but there can be no assurance that any such replacement will provide goods at the prices and level of quality of our current suppliers.
Management Information Systems
All of our restaurants use computerized management information systems, which we believe are scalable to support our future growth plans. We use proprietary technology developed by Kura Japan to record a table’s food consumption. Our point of sales system is used to tally food consumption, produce the final bill, and process credit cards. Transaction data is used to generate customizable reports that our restaurant managers, operations team, and senior management use to analyze sales, product mix, and average check.
We use a proprietary kitchen and in-restaurant back office computer system designed to assist in the management of our restaurants and provide labor and food cost management tools. Our systems analyze customer traffic, order demand, timestamps on Mr. Fresh RFID tags for plates on the revolving conveyor belt, and plate classification and quantities on the revolving conveyor belt. Our systems communicate restaurant-level data to our corporate headquarters to track and manage inventory and labor at the restaurant-level and generate reports for our management team to track performance.
Competition
The restaurant industry is divided into several primary categories, including limited-service and full-service restaurants, which are generally categorized by price, quality of food, service, and location. The Kura model sits at the intersection of these two categories offering the experience and food quality of a full-service restaurant and the speed of service of a limited-service restaurant. We primarily compete with other full-service restaurants.
We face significant competition from a variety of locally owned restaurants and national chain restaurants offering both Asian and non-Asian cuisine, as well as takeaway options from grocery stores. We believe that we compete primarily based on product quality, dining experience, ambience, location, convenience, value perception, and price. Our competition continues to intensify as competitors increase the breadth and depth of their product offerings and open new restaurants.
Seasonality
Seasonal factors and the timing of holidays cause our sales to fluctuate from quarter to quarter. As we expand by opening more restaurants in cold weather climates, the seasonality impact may be amplified. Adverse weather conditions may also affect guest traffic. As a result of these factors, our financial results for any single quarter or for periods less than a year are not necessarily indicative of the results that may be achieved for a full fiscal year.
Human Capital Resources
As of August 31, 2020, we had approximately 1,030 employees, of whom 75 were exempt employees and the remainder were non-exempt employees. As a result of the temporarily closure of all of our restaurants on March 18, 2020 to comply with government ordinances implemented at the outbreak of the COVID-19 pandemic, we had furloughed certain of our employees in the third quarter of fiscal year 2020. As our restaurants reopened, we were able to bring back certain furloughed employees. None of our employees are unionized or covered by collective bargaining agreements, and we consider our current employee relations to be good.
11
Our human capital objectives include attracting, developing, motivating, rewarding and retaining our existing and new employees. We offer our employees online training courses and on-the-job training. Restaurant management trainees undergo training in order to understand all aspects of the restaurant operations. We provide our employees with cash-based performance bonus awards and we also have an equity incentive compensation plan to provide certain management-level or other key employees with stock-based awards. We monitor our progress with metrics such as employee performance measures, turnover rates and restaurant customer surveys.
The health and safety of our employees is our high priority and in particular, in our re-opened restaurants under the COVID-19 pandemic. In protecting our employees’ safety, we have invested in creating safe work environment for our employees by taking additional measures. For our office employees, we have added work from home flexibility. For our restaurant employees, we have increased cleaning protocols, implemented temperature screenings and provided additional personal protective equipment and cleaning supplies. For all employees, we have required masks to be worn in all restaurants and offices where allowed by local law and provide regular communication regarding impacts of the COVID-19 pandemic, including health and safety protocols and procedures.
Government Regulation and Environmental Matters
We are subject to extensive and varied federal, state and local government regulation, including regulations relating, among others, to public and occupational health and safety, nutritional menu labeling, healthcare, the environment, sanitation and fire prevention. We operate each of our restaurants in accordance with standards and procedures designed to comply with applicable codes and regulations. However, an inability to obtain or retain health department or other licenses would adversely affect our operations. Although we have not experienced, and do not anticipate, any significant difficulties, delays or failures in obtaining required licenses, permits or approvals, any such problem could delay or prevent the opening of, or adversely impact the viability of, a particular restaurant or group of restaurants. Additionally, difficulties, delays or failure to retain or renew licenses, permits or approvals, or increased compliance costs due to changed regulations, could adversely affect operations at existing restaurants.
In addition, in order to develop and construct restaurants, we must comply with applicable zoning, land use and environmental regulations. Federal and state environmental regulations have not had a material effect on our operations to date, but more stringent and varied requirements of local governmental bodies with respect to zoning, land use and environmental factors could delay or even prevent construction and increase development costs for new restaurants. We are also required to comply with the accessibility standards mandated by the U.S. Americans with Disabilities Act, which generally prohibits discrimination in accommodation or employment based on disability. We may in the future have to modify restaurants, for example, by adding access ramps or redesigning certain architectural fixtures, to provide service to or make reasonable accommodations for disabled persons. While these expenses could be material, our current expectation is that any such actions will not require us to expend substantial funds.
A small amount of our sales is attributable to the sale of alcoholic beverages. Alcoholic beverage control regulations require each of our restaurants to apply to a state authority and, in certain locations, county or municipal authorities for a license that must be renewed annually and may be revoked or suspended for cause at any time. Alcoholic beverage control regulations relate to numerous aspects of daily operations of our restaurants, including minimum age of patrons and employees, hours of operation, advertising, trade practices, wholesale purchasing, other relationships with alcohol manufacturers, wholesalers and distributors, inventory control and handling, storage and dispensing of alcoholic beverages. We are also subject in certain states to “dram shop” statutes, which generally provide a person injured by an intoxicated person the right to recover damages from an establishment that wrongfully served alcoholic beverages to the intoxicated person. We carry liquor liability coverage as part of our existing comprehensive general liability insurance. Currently, one of our restaurants does not have a liquor license. We may decide not to obtain liquor licenses in certain jurisdictions due to the high costs associated with obtaining liquor licenses in such jurisdictions.
Further, we are subject to the U.S. Fair Labor Standards Act, the U.S. Immigration Reform and Control Act of 1986, the Occupational Safety and Health Act and various other federal and state laws governing similar matters including minimum wages, overtime, workplace safety and other working conditions. Significant numbers of our food service and preparation personnel are paid at rates related to the applicable minimum wage, and further increases in
12
the minimum wage or other changes in these laws could increase our labor costs. Our ability to respond to minimum wage increases by increasing menu prices will depend on the responses of our competitors and guests. Our distributors and suppliers also may be affected by higher minimum wage and benefit standards, which could result in higher costs of goods and services supplied by us. We may also be subject to lawsuits from our employees, the U.S. Equal Employment Opportunity Commission or others alleging violations of federal and state laws regarding workplace and employment matters, discrimination and similar matters.
There has been increased regulation of certain food establishments in the United States, such as the requirements to maintain a HACCP system. HACCP refers to a management system in which food safety is addressed through the analysis and control of potential hazards from production, procurement and handling, to manufacturing, distribution and consumption of the finished product. Many states have required restaurants to develop and implement HACCP systems and the U.S. government continues to expand the sectors of the food industry that must adopt and implement HACCP programs. Although we have implemented a HACCP system for managing food safety and quality at our restaurants for sushi rice and other foods which require time and temperature control for safety, we cannot assure you that we will not have to expend additional time and resources to comply with new food safety requirements either required by current or future federal food safety regulation or legislation. Additionally, our suppliers may initiate or otherwise be subject to food recalls that may impact the availability of certain products, result in adverse publicity or require us to take actions that could be costly for us or otherwise harm our business.
A number of states, counties and cities have enacted menu labeling laws requiring multi-unit restaurant operators to disclose to consumers certain nutritional information, or have enacted legislation restricting the use of certain types of ingredients in restaurants. Many of these requirements are inconsistent or interpreted differently from one jurisdiction to another. These requirements may be different or inconsistent with requirements that we are subject to under the Patient Protection and Affordable Care Act of 2010, as amended by the Health Care and Education Reconciliation Act (collectively, the “ACA”), which establishes a uniform, federal requirement for certain restaurants to post nutritional information on their menus. Specifically, the ACA requires chain restaurants with 20 or more locations in the United States operating under the same name and offering substantially the same menus to publish the total number of calories of standard menu items on menus and menu boards, along with a statement that puts this calorie information in the context of a total daily calorie intake. The ACA also requires covered restaurants to provide to consumers, upon request, a written summary of detailed nutritional information for each standard menu item, and to provide a statement on menus and menu boards about the availability of this information upon request. While our ability to adapt to consumer preferences is a strength of our concepts, the effect of such labeling requirements on consumer choices, if any, is unclear at this time.
We are subject to federal, state and local environmental laws and regulations concerning waste disposal, pollution, protection of the environment, and the presence, discharge, storage, handling, release and disposal of, or exposure to, hazardous or toxic substances (“environmental laws”). These environmental laws can provide for significant fines and penalties for non-compliance and liabilities for remediation, sometimes without regard to whether the owner or operator of the property knew of, or was responsible for, the release or presence of the hazardous or toxic substances. Third parties may also make claims against owners or operators of properties for personal injuries and property damage associated with releases of, or actual or alleged exposure to, such substances. We are not aware of any environmental laws that will materially affect our earnings or competitive position, or result in material capital expenditures relating to our restaurants. However, we cannot predict what environmental laws will be enacted in the future, how existing or future environmental laws will be administered, interpreted or enforced, or the amount of future expenditures that we may need to make to comply with, or to satisfy claims relating to, environmental laws. It is possible that we will become subject to environmental liabilities at our properties, and any such liabilities could materially affect our business, financial condition or results of operations.
We are also subject to laws and regulations relating to information security, privacy, cashless payments, gift cards and consumer credit, protection and fraud, and any failure or perceived failure to comply with these laws could harm our reputation or lead to litigation, which could adversely affect our business, financial condition or results of operations.
Furthermore, we are subject to import laws and tariffs which could impact our ability to source and secure food products, other supplies and equipment necessary to operate our restaurants.
13
The COVID-19 pandemic has caused new federal, state and local government regulations affecting our business to be issued and frequently revised on a daily and/or weekly basis beginning in March 2020 and continuing through the date of this Annual Report on Form 10-K. Regulations relating to employee sick leave, opening and closing of restaurants and dining rooms, business hours, sanitation practices, guest spacing within dining rooms and other social distancing practices and personal protective equipment usage by both our employees and guests have materially affected the way we operate our business and serve our customers.
For a discussion of the various risks we face from regulation and compliance matters, see “Item 1A. Risk Factors.”
Intellectual Property and Trademarks
Kura Japan owns a number of patents, trademarks and service marks registered or pending with the U.S. Patent and Trademark Office (“PTO”). Kura Japan has registered the following patents and marks with the PTO: Food Management System (Patent No.: US 9,193,535 B2), Food Plate Carrier (Patent No.: US 8,550,229 B2) which is known to us as Mr. Fresh, “Kura Sushi” (Trademark Reg. No 5,460,596) and “Kura Revolving Sushi Bar” (Trademark Reg. No. 5,557,000). The first of these patents is set to expire on approximately August 2032. In addition, we have registered the Internet domain name www.kurasushi.com. The information on, or that can be accessed through, our website is not part of this report.
We license certain intellectual property critical to our business from Kura Japan, including, but not limited to, the trademarks “Kura Sushi” and “Kura Revolving Sushi Bar,” and patents for a food management system and Mr. Fresh dome. Any termination or limitation of, or loss of exclusivity under, our exclusive license agreement would have a material adverse effect on us and could adversely affect our business, financial condition or results of operations. On August 5, 2019, we entered into an amended and restated exclusive license agreement with regard to the intellectual property we license from Kura Japan.
We believe that the trademarks, service marks and other intellectual property rights that we license from Kura Japan have significant value and are important to the marketing and reputation of our brand. It is our policy to pursue registration of our intellectual property whenever possible and to oppose vigorously any infringement thereof. However, we cannot predict whether steps taken to protect such rights will be adequate or whether Kura Japan will take steps to enforce such rights with regard to any intellectual property that we license from them. See “Item 1A. Risk Factors—Risks Related to Our Business and Industry—We may become involved in lawsuits involving Kura Japan as the owner of intellectual property, or us as a licensee of intellectual property from Kura Japan, to protect or enforce our intellectual property rights, which could be expensive, time consuming, and unsuccessful.” We are aware of third-party restaurants with names similar to our restaurant name in certain limited geographical areas. However, we believe such uses will not adversely affect us.
Available Information
Our website is located at www.kurasushi.com, including an investor relations section at ir.kurausa.com in which we routinely post important information, such as webcasts of quarterly calls and other investor events in which we participate or host, and any related materials.
Our Annual Reports on Form 10-K, Quarterly Reports on Form 10-Q, Current Reports on Form 8-K, and amendments to reports filed pursuant to Sections 13(a) and 15(d) of the Securities Exchange Act of 1934, as amended (“Exchange Act”) are filed with the U.S. Securities and Exchange Commission (“SEC”). We are subject to the informational requirements of the Exchange Act and file or furnish reports, proxy statements, and other information with the SEC. Such reports and other information filed by the Company with the SEC are available free of charge on our website at www.kurasushi.com when such reports are available on the SEC’s website.
The contents of our website referred to above are not incorporated into this report. Further, any references to our website are intended to be inactive textual references only.
14
Summary Risk Factors
The Company is subject to a number of risks that if realized could affect its business, financial condition, results of operations, cash flows and access to liquidity materially. The Company’s business is subject to uncertainties and risks including:
|
|
• |
Impact and Duration of the COVID-19 Pandemic. The ongoing COVID-19 pandemic and restrictions adopted by governments in response to the pandemic have adversely affected, and will continue to adversely affect, our business, financial condition, liquidity and financial results. |
|
|
• |
Ability to Execute Our Growth Strategy and Grow Sales and Profitability of Our Restaurants. Our long-term success is highly dependent on our ability to successfully implement our growth strategy and to grow sales and profitability of our restaurants, which are subject to various risks including whether we may be able to identify and secure appropriate sites and timely develop and expand our operations in existing and new markets. |
|
|
• |
Geographical Concentration. Our restaurants are concentrated in California and Texas and in retail centers and shopping malls and could be negatively affected by conditions specific to these states and locations. |
|
|
• |
Reliance on Kura Japan. We rely on our parent company Kura Japan in strategic, operational and financial respects. Such reliance could subject us to risks including difficulty replacing certain services, supplies and financial assistance provided by Kura Japan. |
|
|
• |
Reliance on Certain Vendors and Suppliers. We reply significantly on certain vendors and suppliers. Their failure to provide deliveries or services at the quantity, quality or cost level acceptable to us could harm our business, financial position and results of operations. |
|
|
• |
Competition. We face significant competition from a variety of restaurants offering both Asian and non-Asian cuisine, as well as takeout offerings from grocery stores and other outlets where Asian food is sold. |
|
|
• |
Changes in Macro Economic and Societal Conditions. As a consumer-based business, certain changes in macroeconomic and societal conditions including an economic slowdown, changing consumer preferences, food safety and foodborne illness concerns as well as outbreaks of flu, viruses or other diseases transmitted by human contact could adversely affect our business, financial position and results of operations. |
|
|
• |
Use of Technologies. We use revolving and express conveyor belts, other automated equipment and other technologies including information technology in our operations. Failure of such technologies could prevent us from effectively operating our business. |
|
|
• |
Marketing and Public Relations. Our business depends on customer goodwill. If we fail to conduct successful marketing programs and effectively manage our public image, our business will suffer. |
|
|
• |
Lease Management. We are subject to all of the risks associated with leasing space subject to long-term non-cancelable leases. |
|
|
• |
Capital Need. We may need capital in the future, and we may not be able to raise that capital on favorable terms. |
|
|
• |
Human Capital Management. We depend on our senior management team and other key employees. In addition, we need to recruit and retain sufficient qualified employees for our restaurants at reasonable costs. Loss of management members and key employees, labor shortages, increased labor costs, unionization activates or labor disputes could adversely affect our business, financial position and results of operations. |
15
|
|
• |
Litigations. We could be party to litigation that could adversely affect us by distracting management, increasing our expenses or subjecting us to material money damages and other remedies. Our current insurance may not provide adequate levels of coverage against claims. |
|
|
• |
Internal Controls. As a public company, we are required to establish and maintain effective internal controls pursuant to the Sarbanes-Oxley Act. Failure to do so could adversely affect our business and stock price. |
Your ownership of our Class A common stock is subject to risks including:
|
|
• |
Dual-Class Stock Structure. The disparate voting rights of our Class A common stock and our Class B common stock could adversely affect the value and liquidity of our Class A common stock. |
|
|
• |
Our Quarterly Operating Results and Broad Market Fluctuations. Our quarterly operating results may fluctuate significantly and other factors outside our control may cause broad fluctuations of the stock market, which could cause the market price of our common stock to fluctuate. |
|
|
• |
Future Sales of Our Class A Common Stock. Future sales of our common stock, or the perception that such sales may occur, could depress our common stock price. |
|
|
• |
Dividend Policy. We do not intend to pay dividends for the foreseeable future, which could reduce your chance of receiving any return on an investment in our common stock. |
|
|
• |
Certain Provisions in Our Charter Documents. Our charter documents contain certain provisions which make it more difficult for a third party to acquire control of us without Board approval and for a stockholder to bring claims in a judicial forum that it finds favorable for disputes with us. |
|
|
• |
Our Status Being an “Emerging Growth Company”. We are an “emerging growth company,” and we cannot be certain if the reduced reporting and disclosure requirements applicable to emerging growth companies will make our common stock less attractive to investors. |
Your interest as an investor in the Company is also subject to risks relating to our organizational structure including:
|
|
• |
Our Status Being a “Controlled Company”. As a “controlled company”, we may rely on exemptions from certain corporate governance requirements required under the Nasdaq listing standards and you will not have the same protections afforded to stockholders of companies that are subject to such requirements. |
|
|
• |
Potential Conflict of Interests. We are controlled by Kura Japan whose interests may conflict with ours or yours. Future sales of our shares by Kura Japan could also depress our Class A common stock price. |
16
The following are the material risk factors that affect the Company and its stock price. Any one or more of these could have a material adverse impact on the Company’s business, financial condition, results of operations, or cash flows, in addition to presenting other possible adverse consequences, many of which are described below. These risk factors and other risks we may face are also discussed further in other sections of this Annual Report on Form 10-K.
Risks Related to the COVID-19 Pandemic
The ongoing COVID-19 pandemic has adversely affected, and will continue to adversely affect, our operations and measures that limit our ability to operate will continue to adversely affect our business, financial condition, liquidity and financial results.
Our business has been significantly adversely affected by the COVID-19 outbreak in the United States. In March 2020, the World Health Organization declared COVID-19 a global pandemic. This contagious virus, which has continued to spread, has adversely affected workforces, customers, economies and financial markets globally as well as the markets in which we operate. It has also disrupted the normal operations of many businesses, including ours. In response to this outbreak, many state and local authorities in the markets in which we operate have either mandated the temporary closure or imposed capacity limits to non-essential businesses and dine-in restaurant activity. On March 18, 2020, the Company announced the temporary closure of all of its 25 restaurants located across five states at that time and has since furloughed certain of its employees. As restrictions lifted, we were able to reopen certain restaurants at reduced indoor dining capacities. We have also started offering outdoor dining at certain restaurants. As of the filing date of this Annual Report on Form 10-K, we have 28 restaurants with 12 restaurants operating with indoor dining at reduced capacities of 25% to 75% and 15 restaurants operating with outdoor dining or takeout only, depending on local requirements, and one restaurant temporarily closed.
Approximately 85% of our restaurants are located in California and Texas. As a result of our concentration in these markets, we may be disproportionately affected by any increased severity of the pandemic and heightened regulatory measures in either of these states compared to other chain restaurants with a national footprint. For example, the COVID-19 cases in California have caused nine of our restaurants in California to suspend dine-in service due government restrictions on indoor dining.
The COVID-19 pandemic has had an adverse impact on the number of restaurant openings in fiscal year 2020. The temporary restaurant closure and the reduced capacities at the reopened restaurants have caused a substantial decline in the Company’s sales in the most recent fiscal year and we expect will continue to result in substantial declines in sales for so long as the pandemic continues to impact the communities in which we operate. The future sales levels of our restaurants and our ability to implement our growth strategy is highly uncertain, and it will continue to adversely impact our future sales growth as the full impact and duration of the COVID-19 pandemic continues to evolve. Management expects the current restaurant sales levels and ongoing length and severity of the economic downturn caused by the pandemic will continue to have a material adverse impact on our future business, financial condition, liquidity and financial results.
A prolonged occurrence of COVID-19 may result in restaurant re-closures, prohibition on indoor dining, as well as further restrictions, including possible travel restrictions and additional restrictions on the restaurant industry. Our efforts to mitigate the effect of COVID-19 on our business or the economic downturn may be unsuccessful, and we may not be able to commence operations in a timeframe that is sufficient or otherwise take actions in response to developments with regard to the pandemic. To date these events have resulted in a sustained, significant drop in restaurant traffic and are likely to continue to occur during this pandemic, which will continue to have a material adverse effect on our business, financial condition, liquidity and financial results.
17
Social distancing measures and changes in consumer behavior as a result of COVID-19 have affected and may materially and adversely affect our business.
Social distancing measures due to the COVID-19 pandemic has impacted our current service and business models, as customers choose to avoid public gathering places, which actions could result in a loss of sales and profit. Additionally, consumer behavior has changed and may fundamentally change as a result of COVID-19 in both the near and long term and such change may pose significant challenges to our current service and business models. The regulatory authorities in California have caused us to suspend one of our hallmark service features, the revolving conveyor belt. Traffic in restaurants, including ours, has been affected and may be materially and adversely affected with more consumers relying on off-premises orders. Consumer spending has also been and may continue to be negatively impacted by general macroeconomic conditions and consumer confidence, including the impacts of economic downturns, resulting from the COVID-19 pandemic. All of this could materially and adversely impact sales at our restaurants and our growth prospects. We have made adjustments to our restaurant operations due to the COVID-19 pandemic and may have to re-design our service and business models to accommodate consumers’ changed behavior pattern. Any such attempted effort could result in capital expenditures, business disruption, lower margin sales and may not be successful in growing our profitability.
Risks Related to Our Growth Strategy and Restaurant Expansion
Our long-term success is highly dependent on our ability to successfully identify and secure appropriate sites and timely develop and expand our operations in existing and new markets.
One of the key means of achieving our growth strategies will be through opening and operating new restaurants on a profitable basis for the foreseeable future. We opened four new restaurants in fiscal year 2018, six new restaurants in fiscal year 2019, and two new restaurants in fiscal year 2020. We identify target markets where we can enter or expand, taking into account numerous factors such as the locations of our current restaurants, demographics, traffic patterns and information gathered from various sources. We may not be able to open our planned new restaurants within budget or on a timely basis, if at all, given the uncertainty of these factors, which could adversely affect our business, financial condition and results of operations. As we operate more restaurants, our rate of expansion relative to the size of our restaurant base will eventually decline.
The number and timing of new restaurants opened during any given period may be negatively impacted by a number of factors including, without limitation:
|
|
• |
Duration and severity of the COVID-19 pandemic and the restrictive measures adopted by governments to contain the pandemic; |
|
|
• |
identification and availability of locations with the appropriate size, traffic patterns, local retail and business attractions and infrastructure that will drive high levels of guest traffic and sales per unit; |
|
|
• |
competition in existing and new markets, including competition for restaurant sites; |
|
|
• |
the ability to negotiate suitable lease terms; |
|
|
• |
the lack of development and overall decrease in commercial real estate due to a macroeconomic downturn; |
|
|
• |
recruitment and training of qualified personnel in the local market; |
|
|
• |
our ability to obtain all required governmental permits, including zonal approvals, on a timely basis; |
|
|
• |
our ability to control construction and development costs of new restaurants; |
|
|
• |
landlord delays; |
|
|
• |
the proximity of potential sites to an existing restaurant, and the impact of cannibalization on future growth; |
|
|
• |
anticipated commercial, residential and infrastructure development near our new restaurants; and |
|
|
• |
the cost and availability of capital to fund construction costs and pre-opening costs. |
18
Accordingly, we cannot assure you that we will be able to successfully expand as we may not correctly analyze the suitability of a location or anticipate all of the challenges imposed by expanding our operations. Our growth strategy, and the substantial investment associated with the development of each new restaurant, may cause our operating results to fluctuate and be unpredictable or adversely affect our business, financial condition or results of operations. If we are unable to expand in existing markets or penetrate new markets, our ability to increase our sales and profitability may be materially harmed or we may face losses.
In addition, our restaurant count potential based on our current whitespace analysis may change in the future, or we may conduct future analyses that yield results inconsistent with our earlier analysis.
Our expansion into new markets may present increased risks due in part to our unfamiliarity with the areas and also due to consumer unfamiliarity with our revolving sushi bar concept and may make our future results unpredictable.
As of August 31, 2020, we operate our restaurants in five states: California, Texas, Georgia, Illinois, and Nevada. We opened two new restaurants in fiscal year 2020, and we plan to continue to increase the number of our restaurants in the next several years as part of our expansion strategy. We may in the future open restaurants in markets where we have little or no operating experience. This growth strategy and the substantial investment associated with the development of each new restaurant may cause our operating results to fluctuate and be unpredictable or adversely affect our business, financial condition or results of operations. Restaurants we open in new markets may take longer to reach expected sales and profit levels on a consistent basis and may have higher construction, occupancy or operating costs than restaurants we open in existing markets, thereby affecting our overall profitability. New markets may have competitive conditions, consumer tastes and discretionary spending patterns that are more difficult to predict or satisfy than our existing markets and there may be little or no market awareness of our brand or revolving sushi bar concept in these new markets. We may need to make greater investments than we originally planned in advertising and promotional activity in new markets to build brand awareness. We also may find it more difficult in new markets to hire, motivate and keep qualified employees who share our vision, passion and business culture. If we do not successfully execute our plans to enter new markets, our business, financial condition or results of operations could be materially adversely affected.
Opening new restaurants in existing markets may negatively affect sales at our existing restaurants.
The consumer target area of our restaurants varies by location, depending on a number of factors, including population density, other local retail and business attractions, area demographics and geography. As a result, the opening of a new restaurant in or near markets in which we already have restaurants could adversely affect the sales of these existing restaurants and thereby adversely affect our business, financial condition or results of operations. Existing restaurants could also make it more difficult to build our consumer base for a new restaurant in the same market. Our core business strategy does not entail opening new restaurants that we believe will materially affect sales at our existing restaurants, but we may selectively open new restaurants in and around areas of existing restaurants that are operating at or near capacity to effectively serve our guests. Sales cannibalization between our restaurants may become significant in the future as we continue to expand our operations and could affect our sales growth, which could, in turn, materially adversely affect our business, financial condition or results of operations.
New restaurants, once opened, may not be profitable, and the increases in average restaurant sales and comparable restaurant sales that we have experienced in the past may not be indicative of future results.
Our new restaurants have historically opened with above-average volumes, which then decline after the initial sales surge that comes with interest in a new restaurant opening. New restaurants may not be profitable and their sales performance may not follow historical patterns. In addition, our average restaurant sales and comparable restaurant sales may not increase at the rates achieved over the past several years. Our ability to operate new restaurants profitably and increase average restaurant sales and comparable restaurant sales will depend on many factors, some of which are beyond our control, including:
|
|
• |
consumer awareness and understanding of our brand and our revolving sushi bar concept; |
19
|
|
• |
general economic conditions, which can affect restaurant traffic, local labor costs and prices we pay for the food products and other supplies we use; |
|
|
• |
changes in consumer preferences and discretionary spending; |
|
|
• |
competition, either from our competitors in the restaurant industry or our own restaurants; |
|
|
• |
temporary and permanent site characteristics of new restaurants; and |
|
|
• |
changes in government regulation. |
If our new restaurants do not perform as planned, our business and future prospects could be harmed. In addition, if we are unable to achieve our expected average restaurant sales, our business, financial condition or results of operations could be adversely affected.
Our sales and profit growth could be adversely affected if comparable restaurant sales are less than we expect.
The level of comparable restaurant sales growth, which represents the change in year-over-year sales for restaurants open for at least 18 months, could affect our sales growth. Our ability to increase comparable restaurant sales depends in part on our ability to successfully implement our initiatives to build sales. It is possible such initiatives will not be successful, that we will not achieve our target comparable restaurant sales growth or that the change in comparable restaurant sales could be negative, which may cause a decrease in our profitability and would materially adversely affect our business, financial condition or results of operations. See “Item 7. Management’s Discussion and Analysis of Financial Condition and Results of Operations—Comparable Restaurant Sales Growth.”
Our failure to manage our growth effectively could harm our business and operating results.
Our growth plan includes opening new restaurants. Our existing restaurant management systems, financial and management controls and information systems may be inadequate to support our planned expansion. Managing our growth effectively will require us to continue to enhance these systems, procedures and controls and to hire, train and retain managers and team members. We may not respond quickly enough to the changing demands that our expansion will impose on our management, restaurant teams and existing infrastructure which could harm our business, financial condition or results of operations.
Our limited number of restaurants, the significant expense associated with opening new restaurants, and the unit volumes of our new restaurants makes us susceptible to significant fluctuations in our results of operations.
As of August 31, 2020, we operated 25 restaurants. We opened four new restaurants in fiscal year 2018, six new restaurants in fiscal year 2019 and opened two new restaurants in fiscal year 2020. The capital resources required to develop each new restaurant are significant. On average, our restaurants opened since fiscal year 2019 required a cash build-out cost of approximately $1.8 million per restaurant, net of landlord tenant improvement allowances and assuming that we do not purchase the underlying real estate. Actual costs may vary significantly depending upon a variety of factors, including the site and size of the restaurant and conditions in the local real estate and labor markets. The combination of our relatively small number of existing restaurants, the significant investment associated with each new restaurant, variance in the operating results in any one restaurant, or a delay or cancellation in the planned opening of a restaurant could materially affect our business, financial condition or results of operations.
Our restaurant base is geographically concentrated in California and Texas, and we could be negatively affected by conditions specific to these states.
Approximately 85% of our restaurants are located in California and Texas. Adverse changes in demographic, unemployment, economic, regulatory or weather conditions in California and Texas have had, and may continue to have, material adverse effects on our business, financial condition or results of operations. As a result of our concentration in these markets, we have been, and in the future may be, disproportionately affected by adverse conditions in either of these markets compared to other chain restaurants with a national footprint.
20
A decline in visitors to any of the retail centers, shopping malls, lifestyle centers, or entertainment centers where our restaurants are located could negatively affect our restaurant sales.
Our restaurants are primarily located in high-activity areas such as retail centers, shopping malls, lifestyle centers, and entertainment centers. We depend on high visitor rates at these centers to attract guests to our restaurants. Factors that may result in declining visitor rates include public health pandemic such as the COVID-19 break-out, economic or political conditions, anchor tenants closing in retail centers or shopping malls in which we operate, changes in consumer preferences or shopping patterns, changes in discretionary consumer spending, increasing petroleum prices, or other factors, which may adversely affect our business, financial condition or results of operations.
Risks Related to Our Relationships with Kura Japan and Other Key Suppliers
We have historically received strategic, operational and financial support from Kura Japan, and as we increase our independence from Kura Japan, we may face difficulties replacing certain services, supplies and financial assistance Kura Japan has provided to us.
We have been a subsidiary of Kura Japan since 2008 and have benefited from our relationship as a consolidated and wholly-owned subsidiary. As a result of the IPO, we are a majority owned subsidiary of Kura Japan and we utilize Kura Japan for certain strategic, operational and financial support. We currently have a $35 million revolving credit facility with Kura Japan. Our future results depend on various factors, including those identified in these risk factors.
For example, Kura Japan provides us from time to time with employees from its operations in Japan to assist us with meeting our workforce requirements and opening new restaurants. Our President and Chief Executive Officer was previously employed by Kura Japan and was appointed to his position by Kura Japan to lead the development and operation of our business in the United States. We also benefit from our relationship with Kura Japan and the intellectual property that we license from Kura Japan in the operation of our business. As of the date of this report, Kura Japan owns approximately 81% of the combined voting power of our equity interests. Future sales of our shares by Kura Japan could depress our Class A common stock price. If Kura Japan’s ownership interest in our company declines significantly in the future, this may affect our ongoing relationship. We have a shared services agreement and an amended and restated exclusive license agreement with Kura Japan, to clarify and memorialize our existing business relationship. Although we expect Kura Japan to continue providing services to us, Kura Japan does not have any contractual obligation to provide strategic, operational or other support to us except as required under our shared services agreement and amended and restated exclusive license agreement with them. See “Note 5. Related Party Transactions” to our audited financial statements included in “Item 8. Financial Statements and Supplementary Data” in this Annual Report on Form 10-K for additional information.
As an additional example, we from time to time purchase certain supplies, parts and equipment for use in our restaurants from Kura Japan. We believe that Kura Japan obtains these supplies, parts and equipment at a discounted price due to Kura Japan’s higher purchasing power with suppliers. If Kura Japan’s ownership interest in our company declines significantly in the future, this may also affect their provision of supplies, parts and equipment to us. Kura Japan has no contractual obligation to continue providing us with such supplies, parts and equipment except as required under our shared services agreement with them. See “Note 5. Related Party Transactions” to our audited financial statements included in “Item 8. Financial Statements and Supplementary Data” in this Annual Report on Form 10-K for additional information.
As a final example, historically, we have relied on financial support from Kura Japan, including capital contributions by Kura Japan of $5.0 million to the Company in fiscal year 2018. There is no guarantee that if we need to raise any additional capital, we will receive additional capital contributions from Kura Japan.
Our indebtedness to Kura Japan may limit our ability to be acquired by a third party or acquire a third party.
Our Revolving Credit Agreement (“Credit Facility”) with Kura Japan dated April 10, 2020 and amended on September 2, 2020, provides for a $35 million revolving credit line. During fiscal year 2020, we did not draw down on the Credit Facility and as of August 31, 2020, we had $35 million available under our Credit Facility. In the future, we may, from time to time, incur additional indebtedness under our Credit Facility, up to the aggregate principal amount of $35 million. Subsequent to August 31, 2020 and through the date of the filing of this Annual Report on Form 10-K, we borrowed $3 million on the Credit Facility.
21
Our Credit Facility places certain limitations on, among other items, our ability to merge or consolidate with or into or acquire any other business organization or sell substantially all of our assets. Failure to comply with certain covenants could result in the acceleration of our obligations under the Credit Facility, which would have an adverse effect on our liquidity, capital resources and results of operations.
We have licensed certain intellectual property critical to our business from Kura Japan. Any events or circumstances that result in the termination or limitation of our rights under our agreement between us and Kura Japan of our intellectual property could have a material adverse effect on our business, financial condition or results of operations.
The intellectual property that is critical to our business has been licensed to us by Kura Japan, which owns approximately 81% of the combined voting power of our equity interests. Any termination or limitation of, or loss of exclusivity under, our exclusive license agreement with Kura Japan would have a material adverse effect on our business, financial condition or results of operations. We have entered into an amended and restated exclusive license agreement with regard to the intellectual property we license from Kura Japan. See “Note 5. Related Party Transactions” to our audited financial statements included in “Item 8. Financial Statements and Supplementary Data” in this Annual Report on Form 10-K for additional information.
We may become involved in lawsuits involving Kura Japan as the owner of intellectual property, or us as a licensee of intellectual property from Kura Japan, to protect or enforce intellectual property rights, which could be expensive, time consuming, and unsuccessful.
Third parties may sue Kura Japan or us for alleged infringement of their proprietary rights. The party claiming infringement might have greater resources than we do to pursue its claims, and we could be forced to incur substantial costs and devote significant management resources to defend against such litigation, even if the claims are meritless and even if we ultimately prevail. If the party claiming infringement were to prevail, we could be forced to pay significant damages, or enter into expensive royalty or licensing arrangements with the prevailing party. In addition, any payments we are required to make, and any injunction we are required to comply with as a result of such infringement, could harm our reputation and our business, financial condition or results of operations.
Infringements on Kura Japan’s intellectual property rights, including Kura Japan’s service marks and trade secrets, could result in additional expense and could devalue our brand equity, as well as substantially affect our business, financial condition or results of operations.
Other parties may infringe on our intellectual property rights, including those which we develop or otherwise license to use, and may thereby dilute our brand in the marketplace. Any such infringement of our intellectual property rights would also likely result in a commitment of our time and resources to protect these rights through litigation or otherwise.
Our business prospects depend in part on our ability to develop favorable consumer recognition of the Kura Sushi name. Although “Kura Sushi” and “Kura Revolving Sushi Bar” are federally registered service marks owned by Kura Japan, such marks could be imitated in ways that we or Kura Japan cannot prevent. Alternatively, third parties may attempt to cause us to change our name or not operate in a certain geographic region if our name is confusingly similar to their name. In addition, we rely on trade secrets, proprietary know-how, concepts, and recipes, some of which we license from Kura Japan. Our methods or Kura Japan’s methods of protecting this information may not be adequate. Moreover, we or Kura Japan may face claims of misappropriation or infringement of third parties’ rights that could interfere with our use of this information. Defending these claims may be costly and, if unsuccessful, may prevent us from continuing to use this proprietary information in the future, and may result in a judgment or monetary damages. We do not maintain confidentiality and non-competition agreements with all of our executives, key personnel, or suppliers. If competitors independently develop or otherwise obtain access to the trade secrets, proprietary know-how, concepts, or recipes we rely upon to operate our restaurants, some of which we license from Kura Japan, the appeal of our restaurants could be significantly reduced and our business, financial condition or results of operations could be adversely affected.
22
We rely significantly on certain vendors and suppliers, which could adversely affect our business, financial condition or results of operations.
Our ability to maintain consistent price and quality throughout our restaurants depends in part upon our ability to acquire specified food products and supplies in sufficient quantities from third-party vendors and suppliers at a reasonable cost. In addition, we are dependent upon a few suppliers for certain specialized equipment utilized in our restaurants, such as our conveyor belts and other parts of our proprietary system. We rely on JFC International Inc. (“JFC”), a subsidiary of Kikkoman Corporation, as one of our primary suppliers. JFC provided us with food products and supplies equaling approximately 59%, 55%, and 47% of our total food and beverage costs in fiscal years 2020, 2019, and 2018 respectively. We also rely on Wismettac Asian Foods, Inc. (formerly Nishimoto Trading Co., Ltd.) (“Wismettac”), a subsidiary of Nishimoto Co., Ltd., which provided us with food products and supplies equaling approximately 27% of our total food and beverage costs in fiscal year 2020 and was 28% of our total food and beverage costs in fiscal years 2019 and 2018. We do not control the businesses of our vendors and suppliers and our efforts to specify and monitor the standards under which they perform may not be successful. Furthermore, certain food items are perishable, and we have limited control over whether these items will be delivered to us in appropriate condition for use in our restaurants. If any of our vendors or other suppliers are unable to fulfill their obligations to our standards, or if we are unable to find replacement providers in the event of a supply or service disruption, we could encounter supply shortages and incur higher costs to secure adequate supplies, which could materially adversely affect our business, financial condition or results of operations.
In addition, we use various third-party vendors to provide, support and maintain most of our management information systems. We also outsource certain accounting, payroll and human resource functions to business process service providers. The failure of such vendors to fulfill their obligations could disrupt our operations. Additionally, any changes we may make to the services we obtain from our vendors, or new vendors we employ, may disrupt our operations. These disruptions could materially adversely affect our business, financial condition or results of operations.
Changes in food and supply costs could adversely affect our business, financial condition or results of operations.
Our profitability depends in part on our ability to anticipate and react to changes in food and supply costs. Shortages or interruptions in the availability of certain supplies caused by unanticipated demand, problems in production or distribution, food contamination, inclement weather or other conditions could adversely affect the availability, quality and cost of our ingredients, which could harm our operations. Any increase in the prices of the food products most critical to our menu, such as rice, fish and other seafood, as well as fresh vegetables, could adversely affect our business, financial condition or results from operations. Although we try to manage the impact that these fluctuations have on our operating results, we remain susceptible to increases in food costs as a result of factors beyond our control, such as general economic conditions, seasonal fluctuations, weather conditions, demand, food safety concerns, generalized infectious diseases, product recalls and government regulations.
If any of our distributors or suppliers performs inadequately, or our distribution or supply relationships are disrupted for any reason, our business, financial condition, results of operations or cash flows could be adversely affected. If we cannot replace or engage distributors or suppliers who meet our specifications in a short period of time, that could increase our expenses and cause shortages of food and other items at our restaurants, which could cause a restaurant to remove items from its menu. If that were to happen, affected restaurants could experience significant reductions in sales during the shortage or thereafter, if guests change their dining habits as a result. In addition, because we provide moderately priced food, we may choose not to, or may be unable to, pass along commodity price increases to consumers. These potential changes in food and supply costs could materially adversely affect our business, financial condition or results of operations.
23
Failure to receive frequent deliveries of fresh food ingredients and other supplies could harm our business, financial condition or results of operations.
Our ability to maintain our menu depends in part on our ability to acquire ingredients that meet our specifications from reliable suppliers, including, but not limited to, rice vinegar from Kura Japan, which owns the recipe of such rice vinegar and is our sole supplier of rice vinegar. Shortages or interruptions in the supply of ingredients caused by unanticipated demand, problems in production or distribution, food contamination, inclement weather or other conditions could adversely affect the availability, quality and cost of our ingredients, which could harm our business, financial condition or results of operations. If any of our distributors or suppliers performs inadequately, or our distribution or supply relationships are disrupted for any reason, our business, financial condition or results of operations could be adversely affected. If we cannot replace or engage distributors or suppliers who meet our specifications in a short period of time, that could increase our expenses and cause shortages of food and other items at our restaurants, which could cause a restaurant to remove items from its menu. If that were to happen, affected restaurants could experience significant reductions in sales during the shortage or thereafter, if guests change their dining habits as a result. This reduction in sales could materially adversely affect our business, financial condition or results of operations.
In addition, our approach to competing in the restaurant industry depends in large part on our continued ability to provide authentic and traditional Japanese cuisine that is free from artificial ingredients. As we increase our use of these ingredients, the ability of our suppliers to expand output or otherwise increase their supplies to meet our needs may be constrained. We could face difficulties to obtain a sufficient and consistent supply of these ingredients on a cost-effective basis.
Other Commercial, Operational, Financial and Regulatory Risks
Operating results at our restaurants could be significantly affected by competition in the restaurant industry in general and, in particular, within the dining segments of the restaurant industry in which we compete.
We face significant competition from a variety of restaurants offering both Asian and non-Asian cuisine, as well as takeout offerings from grocery stores and other outlets where Asian food is sold. These segments are highly competitive with respect to, among other things, product quality, dining experience, ambience, location, convenience, value perception, and price. Our competition continues to intensify as competitors increase the breadth and depth of their product offerings and open new locations. These competitors may have, among other things, chefs who are widely known to the public that may generate more notoriety for those competitors as compared to our brand. We also compete with many restaurant and retail establishments for site locations and restaurant-level employees.
Several of our competitors offering Asian and related choices may look to compete with us on price, quality and service. Any of these competitive factors may materially adversely affect our business, financial condition or results of operations.
Changes in economic conditions could materially affect our ability to maintain or increase sales at our restaurants or open new restaurants.
The restaurant industry depends on consumer discretionary spending. The United States in general or the specific markets in which we operate may suffer from depressed economic activity, recessionary economic cycles, higher fuel or energy costs, low consumer confidence, high levels of unemployment, reduced home values, increases in home foreclosures, investment losses, personal bankruptcies, reduced access to credit or other economic factors that may affect consumers’ discretionary spending. Sales in our restaurants could decline if consumers choose to dine out less frequently or reduce the amount they spend on meals while dining out. Negative economic conditions might cause consumers to make long-term changes to their discretionary spending behavior, including dining out less frequently on a permanent basis. If restaurant sales decrease, our profitability could decline as we spread fixed costs across a lower level of sales. Reductions in staff levels, asset impairment charges and potential restaurant closures could result from prolonged negative restaurant sales, which could materially adversely affect our business, financial condition or results of operations.
24
Food safety and foodborne illness concerns as well as outbreaks of flu, viruses or other diseases could have an adverse effect on our business, financial condition or results of operations.
We cannot guarantee that our internal controls and training will be fully effective in preventing all food safety issues at our restaurants, including any occurrences of foodborne illnesses such as salmonella, E. coli and hepatitis A. In addition, there is no guarantee that our restaurant locations will maintain the high levels of internal controls and training we require at our restaurants. Furthermore, we rely on third-party vendors, making it difficult to monitor food safety compliance and increasing the risk that foodborne illness would affect multiple locations rather than a single restaurant. Some foodborne illness incidents could be caused by third-party vendors and transporters outside of our control. New illnesses resistant to our current precautions may develop in the future, or diseases with long incubation periods could arise, that could give rise to claims or allegations on a retroactive basis. One or more instances of foodborne illness in any of our restaurants or markets or related to food products we sell could negatively affect our restaurant sales nationwide if highly publicized on national media outlets or through social media. This risk exists even if it were later determined that the illness was wrongly attributed to us or one of our restaurants. A number of other restaurant chains have experienced incidents related to foodborne illnesses that have had a material adverse effect on their operations. The occurrence of a similar incident at one or more of our restaurants, or negative publicity or public speculation about an incident, could materially adversely affect our business, financial condition or results of operations.
If a virus is transmitted by human contact or respiratory transmission, our employees or guests could become infected, or could choose, or be advised, to avoid gathering in public places, any of which could adversely affect our restaurant guest traffic and our ability to adequately staff our restaurants, receive deliveries on a timely basis or perform functions at the corporate level. Additionally, jurisdictions in which we have restaurants may impose mandatory closures, seek voluntary closures or impose restrictions on operations. Even if such measures are not implemented and a virus or other disease does not spread significantly, the perceived risk of infection or significant health risk may cause guests to choose other alternatives to dining out in our restaurants which may adversely affect our business.
New information or attitudes regarding diet and health could result in changes in regulations and consumer consumption habits that could adversely affect our business, financial condition or results of operations.
Changes in attitudes regarding diet and health or new information regarding the adverse health effects of consuming certain foods could result in changes in government regulation and consumer eating habits that may impact our business, financial condition or results of operations. These changes have resulted in, and may continue to result in, laws and regulations requiring us to disclose the nutritional content of our food offerings, and they have resulted in, and may continue to result in, laws and regulations affecting permissible ingredients and menu offerings. For example, a number of jurisdictions have enacted menu labeling laws requiring multi-unit restaurant operators to disclose to consumers certain nutritional information, or have enacted legislation restricting the use of certain types of ingredients in restaurants. These requirements may be different or inconsistent with requirements we are subject to under the Patient Protection and Affordable Care Act of 2010, as amended by the Health Care and Education Reconciliation Act, collectively, the “ACA,” which establishes a uniform, federal requirement for certain restaurants to post nutritional information on their menus. Specifically, the ACA requires chain restaurants with 20 or more locations operating under the same name and offering substantially the same menus to publish the total number of calories of standard menu items on menus and menu boards, along with a statement that puts this calorie information in the context of a total daily calorie intake. The ACA also requires covered restaurants to provide to consumers, upon request, a written summary of detailed nutritional information for each standard menu item, and to provide a statement on menus and menu boards about the availability of this information upon request. Unfavorable publicity about, or guests’ reactions to, our menu ingredients, the size of our portions or the nutritional content of our menu items could negatively influence the demand for our offerings, thereby adversely affecting our business, financial condition or results of operations.
Compliance with current and future laws and regulations regarding the ingredients and nutritional content of our menu items may be costly and time-consuming. Additionally, if consumer health regulations or consumer eating habits change significantly, we may be required to modify or discontinue certain menu items, and we may experience higher costs associated with the implementation of those changes, as well as adversely affect the attractiveness of our restaurants to new or returning guests. We cannot predict the impact of any new nutrition
25
labeling requirements. The risks and costs associated with nutritional disclosures on our menus could also impact our operations, particularly given differences among applicable legal requirements and practices within the restaurant industry with respect to testing and disclosure, ordinary variations in food preparation among our own restaurants, and the need to rely on the accuracy and completeness of nutritional information obtained from third-party suppliers.
We may not be able to effectively respond to changes in consumer health perceptions or successfully implement the nutrient content disclosure requirements and to adapt our menu offerings to trends in eating habits. The imposition of menu labeling laws and an inability to keep up with consumer eating habits could materially adversely affect our business, financial condition or results of operations, as well as our position within the restaurant industry in general.
We rely significantly on the operation of our revolving and express conveyor belts, sushi robots and other automated equipment, and any mechanical failure could prevent us from effectively operating our restaurants.
The operation of our restaurants relies on technology and equipment such as our revolving and express conveyor belts, the Bikkura-Pon rewards machine and touch screen menus. In our kitchens, we use automated equipment and systems such as sushi robots, RFID readers, robotic arms, vinegar mixing machines, rice washers and dishwashers. Our ability to safely, efficiently and effectively manage our restaurants depends significantly on the reliability and capacity of these systems. Mechanical failures and our inability to service such equipment in a timely manner could result in delays in customer service and reduce efficiency of our restaurant operations, including a loss of sales. Remediation of such problems could result in significant, unplanned capital investments and any equipment failure may have an adverse effect on our business, financial condition or results of operations due to our reliance on such equipment.
We rely significantly on information technology, and any material failure, weakness, interruption or breach of security could prevent us from effectively operating our business.
We rely significantly on information systems, including point-of-sale processing in our restaurants for management of our supply chain, payment of obligations, collection of cash, credit and debit card transactions and other processes and procedures. We also operate tableside access to touch screen ordering systems to allow guests to place special orders. Our ability to efficiently and effectively manage our business depends significantly on the reliability and capacity of these systems. Failures of these systems to operate effectively, maintenance problems, upgrading or transitioning to new platforms, or a breach in security of these systems could result in delays in customer service and reduce efficiency in our operations. Remediation of such problems could result in significant, unplanned capital investments.
A breach of security of confidential consumer information related to our electronic processing of credit and debit card transactions, as well as a breach of security of our employee information, could substantially affect our reputation, business, financial condition of results of operations.
The majority of our restaurant sales are by credit or debit cards. Other restaurants and retailers have experienced security breaches in which credit and debit card information has been stolen. We may in the future become subject to claims for purportedly fraudulent transactions arising out of the actual or alleged theft of credit or debit card information, and we may also be subject to lawsuits or other proceedings relating to these types of incidents. We may ultimately be held liable for the unauthorized use of a cardholder’s card number in an illegal activity and be required by card issuers to pay charge-back fees. In addition, most states have enacted legislation requiring notification of security breaches involving personal information, including credit and debit card information. Any such claim or proceeding could cause us to incur significant unplanned expenses, which could have an adverse impact on our business, financial condition or results of operations. Further, adverse publicity resulting from these allegations may have a material adverse effect on us and could substantially affect our reputation and business, financial condition or results of operations.
In addition, our business requires the collection, transmission and retention of large volumes of guest and employee data, including personally identifiable information, in various information technology systems that we maintain and in those maintained by third parties with whom we contract to provide services. The collection and use
26
of such information is regulated at the federal and state levels, as well as at the international level, in which regulatory requirements have been increasing. As our environment continues to evolve in the digital age and reliance upon new technologies becomes more prevalent, it is imperative we secure the privacy and sensitive information we collect. Failure to do so, whether through fault of our own information systems or those of outsourced third-party providers, could not only cause us to fail to comply with these laws and regulations, but also could cause us to face litigation and penalties that could adversely affect our business, financial condition or results of operations. Our brand’s reputation and image as an employer could also be harmed by these types of security breaches or regulatory violations.
Our marketing programs may not be successful, and our new menu items, advertising campaigns and restaurant designs and remodels may not generate increased sales or profits.
We incur costs and expend other resources in our marketing efforts on new menu items, advertising campaigns and restaurant designs and remodels to raise brand awareness and attract and retain guests. These initiatives may not be successful, resulting in expenses incurred without the benefit of higher sales. Additionally, some of our competitors have greater financial resources, which enable them to spend significantly more on marketing and advertising and other initiatives than we are able to. Should our competitors increase spending on marketing and advertising and other initiatives or our marketing funds decrease for any reason, or should our advertising, promotions, new menu items and restaurant designs and remodels be less effective than our competitors, there could be a material adverse effect on our business, financial condition or results of operations.
Our inability or failure to recognize, respond to and effectively manage the accelerated impact of social media could materially adversely impact our business, financial condition or results of operations.
Our marketing efforts rely heavily on the use of social media. In recent years, there has been a marked increase in the use of social media platforms, including weblogs (blogs), mini-blogs, chat platforms, social media websites, and other forms of Internet-based communications which allow individuals access to a broad audience of consumers and other interested persons. Many of our competitors are expanding their use of social media, and new social media platforms are rapidly being developed, potentially making more traditional social media platforms obsolete. As a result, we need to continuously innovate and develop our social media strategies in order to maintain broad appeal with guests and brand relevance. We also continue to invest in other digital marketing initiatives that allow us to reach our guests across multiple digital channels and build their awareness of, engagement with, and loyalty to our brand. These initiatives may not be successful, resulting in expenses incurred without the benefit of higher sales or increased brand recognition.
Negative publicity relating to one of our restaurants could reduce sales at some or all of our other restaurants.
Our success is dependent in part upon our ability to maintain and enhance the value of our brand and consumers’ connection to our brand. We may, from time to time, be faced with negative publicity relating to food quality, restaurant facilities, guest complaints or litigation alleging illness or injury, health inspection scores, integrity of our or our suppliers’ food processing, employee relationships or other matters, regardless of whether the allegations are valid or whether we are held to be responsible. The negative impact of adverse publicity relating to one restaurant may extend far beyond the restaurant involved to affect some or all of our other restaurants, thereby causing an adverse effect on our business, financial condition or results of operations. A similar risk exists with respect to unrelated food service businesses, if consumers associate those businesses with our own operations.
The considerable expansion in the use of social media over recent years can further amplify any negative publicity that could be generated by such incidents. Many social media platforms immediately publish the content their subscribers and participants post, often without filters or checks on accuracy of the content posted. Information posted on such platforms may be adverse to our interests and/or may be inaccurate. The dissemination of inaccurate or irresponsible information online could harm our business, reputation, prospects, financial condition, or results of operations, regardless of the information’s accuracy. The damage may be immediate without affording us an opportunity for redress or correction.
27
Additionally, employee claims against us based on, among other things, wage and hour violations, discrimination, harassment or wrongful termination may also create negative publicity that could adversely affect us and divert our financial and management resources that would otherwise be used to benefit the future performance of our operations. A significant increase in the number of these claims or an increase in the number of successful claims could materially adversely affect our business, financial condition or results of operations. Consumer demand for our restaurants and our brand’s value could diminish significantly if any such incidents or other matters create negative publicity or otherwise erode consumer confidence in us or our restaurants, which would likely result in lower sales and could materially adversely affect our business, financial condition or results of operations.
We are subject to all of the risks associated with leasing space subject to long-term non-cancelable leases.
We do not own any real property. Payments under our operating leases account for a significant portion of our operating expenses and we expect the new restaurants we open in the future will similarly be leased. The majority of our operating leases have lease terms of twenty years, inclusive of customary extensions which are at the option of the Company. Most of our leases require a fixed annual rent which generally increases each year, and some require the payment of additional rent if restaurant sales exceed a negotiated amount. Generally, our leases are “net” leases, which require us to pay all of the cost of insurance, taxes, maintenance and utilities. We generally cannot cancel these leases. Additional sites that we lease are likely to be subject to similar long-term non-cancelable leases. If an existing or future restaurant is not profitable, and we decide to close it, we may nonetheless be committed to perform our obligations under the applicable lease including, among other things, paying the base rent for the balance of the lease term. In addition, as each of our leases expires, we may fail to negotiate renewals, either on commercially acceptable terms or at all, which could cause us to pay increased occupancy costs or to close restaurants in desirable locations. If we fail to negotiate renewals, we may have to dispose of assets at such restaurant locations and incur closure costs as well as impairment of property and equipment. Furthermore, if we fail to negotiate renewals, we may incur additional costs associated with moving transferable furniture, fixtures and equipment. These potential increased occupancy and moving costs, as well as closures of restaurants, could materially adversely affect our business, financial condition or results of operations.
Macroeconomic conditions, including economic downturns, may cause landlords of our leases to be unable to obtain financing or remain in good standing under their existing financing arrangements, resulting in failures to pay required tenant improvement allowances or satisfy other lease covenants to us. In addition, tenants at shopping centers in which we are located or have executed leases, or to which our locations are near, may fail to open or may cease operations. Decreases in total tenant occupancy in shopping centers in which we are located, or to which our locations are near, may affect traffic at our restaurants. All of these factors could have a material adverse impact on our business, financial condition or results of operations.
We may need capital in the future, and we may not be able to raise that capital on favorable terms.
Developing our business will require significant capital in the future. Historically, we have relied on financial support from Kura Japan, including capital contributions by Kura Japan of $5.0 million to the Company in the fiscal year 2018. There is no guarantee that if we need to raise any additional capital, we will receive additional capital contributions from Kura Japan. To meet our capital needs, we expect to rely on our cash flows from operations, borrowings under our existing Credit Facility, future offerings and other third-party financing. Third-party financing in the future may not, however, be available on terms favorable to us, or at all. Our ability to obtain additional funding will be subject to various factors, including market conditions, our operating performance, lender sentiment and our ability to incur additional debt in compliance with other contractual restrictions under our Credit Facility, term loans or other debt documents we may enter into. These factors may make the timing, amount, or terms and conditions of additional financings unattractive. Our inability to raise capital could impede our growth and could materially adversely affect our business, financial condition or results of operations.
28
We depend on our senior management team and other key employees, and the loss of one or more key personnel or an inability to attract, hire, integrate and retain highly skilled personnel could have an adverse effect on our business, financial condition or results of operations.
Our success depends largely upon the continued services of our key executives. We also rely on our leadership team in setting our strategic direction, operating our business, identifying, recruiting and training key personnel, identifying expansion opportunities, arranging necessary financing, and for general and administrative functions. From time to time, there may be changes in our executive management team resulting from the hiring or departure of executives, which could disrupt our business. In addition, a small portion of our workforce is Japanese expatriates whose services we have secured from Kura Japan. Our former Chief Operating Officer, who is currently employed by Kura Japan and who was appointed to his position by Kura Japan to assist in the operation of our business in the United States, was recalled to Kura Japan at Kura Japan’s option and resigned from his position as Chief Operating Officer on August 26, 2020. Effective August 26, 2020, our board of directors appointed our Chief Executive Officer to also serve as interim Chief Operating Officer in addition to his role as Chief Executive Officer. The loss or replacement of one or more of our executive officers or other key employees could have a serious adverse effect on our business, financial condition or results of operations.
To continue to execute our growth strategy, we also must identify, hire and retain highly skilled personnel, which may include the services of personnel who are Japanese expatriates whose services we secure due to our relationship with Kura Japan. We might not be successful in continuing to attract and retain qualified personnel. Failure to identify, hire and retain necessary key personnel could have a material adverse effect on our business, financial condition or results of operations.
If we face labor shortages, increased labor costs or unionization activities, our growth, business, financial condition and operating results could be adversely affected.
Labor is a primary component in the cost of operating our restaurants. If we face labor shortages or increased labor costs because of increased competition for employees, higher employee turnover rates, increases in federal, state or local minimum wage rates or other employee benefits costs (including costs associated with health insurance coverage), our operating expenses could increase and our growth could be adversely affected. In addition, our success depends in part upon our ability to attract, motivate and retain a sufficient number of well-qualified restaurant operators and management personnel, as well as a sufficient number of other qualified employees, to keep pace with our expansion schedule. Qualified individuals needed to fill these positions are in short supply in some geographic areas. In addition, restaurants have traditionally experienced relatively high employee turnover rates. Personal or public health concerns related to COVID-19 might make some existing employees or potential candidates reluctant to work in enclosed restaurant environments. Our failure to recruit and retain such individuals may delay the planned openings of new restaurants or result in higher employee turnover in existing restaurants, which could have a material adverse effect on our business, financial condition or results of operations.
If we are unable to continue to recruit and retain sufficiently qualified individuals, our business and our growth could be adversely affected, thereby adversely affecting or business, financial condition or results of operations. Competition for these employees could require us to pay higher wages, which could result in higher labor costs. In addition, increases in the minimum wage would increase our labor costs. Additionally, costs associated with workers’ compensation are rising, and these costs may continue to rise in the future. We may be unable to increase our menu prices in order to pass these increased labor costs on to consumers, in which case our margins would be negatively affected, which could materially adversely affect our business, financial condition or results of operations.
Although none of our employees are currently covered under collective bargaining agreements, our employees may elect to be represented by labor unions in the future. If a significant number of our employees were to become unionized and collective bargaining agreement terms were significantly different from our current compensation arrangements, it could adversely affect our business, financial condition or results of operations.
29
Our business could be adversely affected by a failure to obtain visas or work permits or to properly verify the employment eligibility of our employees.
Some of our corporate employees’ ability to work in the United States depends on obtaining and maintaining necessary visas and work permits. On certain occasions we have been, and in the future we may be, unable to obtain visas or work permits to bring necessary employees to the United States for any number of reasons including, among others, limits set by the U.S. Department of Homeland Security or the U.S. Department of State.
Although we require all workers to provide us with government-specified documentation evidencing their employment eligibility, some of our employees may, without our knowledge, be unauthorized workers. We currently participate in the “E-Verify” program, an Internet-based, free program run by the U.S. government to verify employment eligibility, in states in which participation is required, and we plan to introduce its use across all our restaurants. However, use of the “E-Verify” program does not guarantee that we will properly identify all applicants who are ineligible for employment. Unauthorized workers are subject to deportation and may subject us to fines or penalties, and if any of our workers are found to be unauthorized, we could experience adverse publicity that may negatively impact our brand and may make it more difficult to hire and keep qualified employees. Termination of a significant number of employees who are unauthorized employees may disrupt our operations, cause temporary increases in our labor costs as we train new employees and result in adverse publicity. We could also become subject to fines, penalties and other costs related to claims that we did not fully comply with all recordkeeping obligations of federal and state immigration compliance laws. These factors could materially adversely affect our business, financial condition or results of operations.
Labor disputes may disrupt our operations and affect our profitability, thereby causing a material adverse effect on our business, financial condition or results of operations.
As an employer, we are presently, and may in the future be, subject to various employment-related claims, such as individual or class actions or government enforcement actions relating to alleged employment discrimination, employee classification and related withholding, wage-hour, labor standards or healthcare and benefit issues. On May 31, 2019, a putative class action complaint was filed in Los Angeles County Superior Court, alleging violations of California wage and hour laws. This action, or any future actions if brought against us and successful in whole or in part, may affect our ability to compete or could materially adversely affect our business, financial condition or results of operations.
The minimum wage, particularly in California, continues to increase and is subject to factors outside of our control.
We have a substantial number of hourly employees who are paid wage rates based on the applicable federal or state minimum wage. Since January 1, 2019, the State of California has a minimum wage of $12.00 per hour. Moreover, municipalities may set minimum wages above the applicable state standards. The federal minimum wage has been $7.25 per hour since July 24, 2009. Any of federally-mandated, state-mandated or municipality-mandated minimum wages may be raised in the future which could have a materially adverse effect on our business, financial condition or results of operations. If menu prices are increased by us to cover increased labor costs, the higher prices could adversely affect sales and thereby reduce our margins and adversely affect our business, financial condition or results of operations.
Changes in employment laws may adversely affect our business, financial condition, results of operations or cash flow.
Various federal and state labor laws govern the relationship with our employees and affect operating costs. These laws include employee classification as exempt/non-exempt for overtime and other purposes, minimum wage requirements, tips and gratuity payments, unemployment tax rates, workers’ compensation rates, immigration status and other wage and benefit requirements. Significant additional government-imposed increases in the following areas could materially affect our business, financial condition, operating results or cash flow:
|
|
• |
minimum wages; |
30
|
|
• |
mandatory health benefits; |
|
|
• |
vacation accruals; |
|
|
• |
paid leaves of absence, including paid sick leave; and |
|
|
• |
tax reporting. |
Failure to obtain and maintain required licenses and permits or to comply with alcoholic beverage or food control regulations could lead to the loss of our liquor and food service licenses and, thereby, harm our business, financial condition or results of operations.
The restaurant industry is subject to various federal, state and local government regulations, including those relating to the sale of food and alcoholic beverages. Such regulations are subject to change from time to time. The failure to obtain and maintain licenses, permits and approvals relating to such regulations could adversely affect our business, financial condition or results of operations. Typically, licenses must be renewed annually and may be revoked, suspended or denied renewal for cause at any time if governmental authorities determine that our conduct violates applicable regulations. Difficulties or failure to maintain or obtain the required licenses and approvals could adversely affect our existing restaurants and delay or result in our decision to cancel the opening of new restaurants, which would adversely affect our business, financial condition or results of operations.
Alcoholic beverage control regulations generally require our restaurants to apply to a state authority and, in certain locations, county or municipal authorities for a license that must be renewed annually and may be revoked or suspended for cause at any time. Alcoholic beverage control regulations relate to numerous aspects of daily operations of our restaurants, including minimum age of patrons and employees, hours of operation, advertising, trade practices, wholesale purchasing, other relationships with alcohol manufacturers, wholesalers and distributors, inventory control and handling, storage and dispensing of alcoholic beverages. Any future failure to comply with these regulations and obtain or retain liquor licenses could adversely affect our business, financial condition or results of operations.
Governmental regulation may adversely affect our ability to open new restaurants or otherwise adversely affect our business, financial condition or results of operations.
We are subject to various federal, state and local regulations. Our restaurants are subject to state and local licensing and regulation by health, alcoholic beverage, sanitation, food and occupational safety and other agencies. We may experience material difficulties or failures in obtaining the necessary licenses, approvals or permits for our restaurants, which could delay planned restaurant openings or affect the operations at our existing restaurants. In addition, stringent and varied requirements of local regulators with respect to zoning, land use and environmental factors could delay or prevent development of new restaurants in particular locations. An array of new government regulations in response to COVID-19 have restricted our ability to operate our restaurants in their full capacities and could continue to adversely affect our sales and profits.
We are subject to the U.S. Americans with Disabilities Act and similar state laws that give civil rights protections to individuals with disabilities in the context of employment, public accommodations and other areas, including our restaurants. We may in the future have to modify restaurants, for example, by adding access ramps or redesigning certain architectural fixtures, to provide service to or make reasonable accommodations for disabled persons. The expenses associated with these modifications could be material.
Our operations are also subject to the U.S. Occupational Safety and Health Act, which governs worker health and safety, the U.S. Fair Labor Standards Act, which governs such matters as minimum wages and overtime, and a variety of similar federal, state and local laws that govern these and other employment law matters. In addition, federal, state and local proposals related to paid sick leave or similar matters could, if implemented, materially adversely affect our business, financial condition or results of operations.
31
Compliance with environmental laws may negatively affect our business.
We are subject to federal, state and local laws and regulations concerning waste disposal, pollution, protection of the environment, and the presence, discharge, storage, handling, release and disposal of, and exposure to, hazardous or toxic substances. These environmental laws provide for significant fines and penalties for noncompliance and liabilities for remediation, sometimes without regard to whether the owner or operator of the property knew of, or was responsible for, the release or presence of hazardous toxic substances. Third parties may also make claims against owners or operators of properties for personal injuries and property damage associated with releases of, or actual or alleged exposure to, such hazardous or toxic substances at, on or from our restaurants. Environmental conditions relating to releases of hazardous substances at prior, existing or future restaurant sites could materially adversely affect our business, financial condition or results of operations. Further, environmental laws, and the administration, interpretation and enforcement thereof, are subject to change and may become more stringent in the future, each of which could materially adversely affect our business, financial condition or results of operations.
Failure to comply with antibribery or anticorruption laws could adversely affect our reputation, business, financial condition or results of operations.
The U.S. Foreign Corrupt Practices Act and other similar applicable laws prohibiting bribery of government officials and other corrupt practices are the subject of increasing emphasis and enforcement around the world. Although we have implemented policies and procedures designed to promote compliance with these laws, there can be no assurance that our employees, contractors, agents, or other third parties will not take actions in violation of our policies or applicable law. Any such violations or suspected violations could subject us to civil or criminal penalties, including substantial fines and significant investigation costs, and could also materially damage our reputation, brands, international expansion efforts and growth prospects, business, financial condition and results of operations. Publicity relating to any noncompliance or alleged noncompliance could also harm our reputation and adversely affect our business, financial condition or results of operations.
We could be party to litigation that could adversely affect us by distracting management, increasing our expenses or subjecting us to material money damages and other remedies.
Our guests may file complaints or lawsuits against us alleging we caused an illness or injury they suffered at or after a visit to our restaurants, or that we have problems with food quality or operations. We are also subject to a variety of other claims arising in the ordinary course of our business, including personal injury claims, contract claims and claims alleging violations of federal and state law regarding workplace and employment matters, equal opportunity, discrimination and similar matters, and we are presently subject to class action and other lawsuits with regard to certain of these matters and could become subject to additional class action or other lawsuits related to these or different matters in the future. Regardless of whether any claims against us are valid, or whether we are ultimately held liable, claims may be expensive to defend and may divert time and money away from our operations and hurt our performance. A judgment in excess of our insurance coverage for any claims could materially and adversely affect our business, financial condition or results of operations. Any adverse publicity resulting from these allegations may also materially and adversely affect our reputation or prospects, which in turn could materially adversely affect our business, financial condition or results of operations.
We are subject to state and local “dram shop” statutes, which may subject us to uninsured liabilities. These statutes generally allow a person injured by an intoxicated person to recover damages from an establishment that wrongfully served alcoholic beverages to the intoxicated person. Because a plaintiff may seek punitive damages, which may not be fully covered by insurance, this type of action could have an adverse impact on our business, financial condition or results of operations. A judgment in such an action significantly in excess of, or not covered by, our insurance coverage could adversely affect our business, financial condition or results of operations. Further, adverse publicity resulting from any such allegations may adversely affect our business, financial condition or results of operations.
32
Our current insurance may not provide adequate levels of coverage against claims.
There are types of losses we may incur that cannot be insured against or that we believe are not economically reasonable to insure. Such losses could have a material adverse effect on our business, financial condition or results of operations. In addition, our current insurance policies may not be adequate to protect us from liabilities that we incur in our business in areas such as workers’ compensation, general liability, auto and property. In the future, our insurance premiums may increase, and we may not be able to obtain similar levels of insurance on reasonable terms, or at all. Any substantial inadequacy of, or inability to obtain, insurance coverage could materially adversely affect our business, financial condition and results of operations. Failure to maintain adequate directors’ and officers’ insurance would likely adversely affect our ability to attract and retain qualified officers and directors.
Changes to accounting rules or regulations may adversely affect our business, financial condition or results of operations.
Changes to existing accounting rules or regulations may impact our business, financial condition or results of operations. Other new accounting rules or regulations and varying interpretations of existing accounting rules or regulations have occurred and may occur in the future. For instance, accounting regulatory authorities have recently issued new accounting rules which require lessees to capitalize operating leases in their financial statements. When adopted, such change would require us to record significant operating lease obligations on our balance sheet and make other changes to our financial statements. This and other future changes to accounting rules or regulations could materially adversely affect our business, financial condition or results of operations.
Failure to establish and maintain effective internal controls in accordance with Section 404 of the Sarbanes-Oxley Act could have a material adverse effect on our business and stock price.
As a publicly traded company, we are required to comply with the SEC’s rules implementing Section 302 and 404 of the Sarbanes-Oxley Act, which requires management to certify financial and other information in our quarterly and annual reports and provide an annual management report on the effectiveness of internal controls over financial reporting. Pursuant to the JOBS Act, our independent registered public accounting firm will not be required to attest to the effectiveness of our internal control over financial reporting until the date we are no longer an emerging growth company, which may be up to five full fiscal years following our IPO.
To comply with the requirements of being a public company, we may need to undertake various actions, such as implementing new internal controls and procedures and hiring additional accounting or internal audit staff. In addition, we may identify material weaknesses in our internal control over financial reporting that we may not be able to remediate in time to meet the applicable deadline imposed upon us for compliance with the requirements of Section 404.
If we identify weaknesses in our internal control over financial reporting, are unable to comply with the requirements of Section 404 in a timely manner or to assert that our internal control over financial reporting is effective, or if our independent registered public accounting firm is unable to express an opinion as to the effectiveness of our internal control over financial reporting, investors may lose confidence in the accuracy and completeness of our financial reports and the market price of our common stock could be negatively affected, and we could become subject to investigations by the SEC or other regulatory authorities, which could require additional financial and management resources.
Our management has limited experience managing a U.S. public company and our current resources may not be sufficient to fulfill our public company obligations.
As a newly public company, we are subject to various new regulatory requirements, including those of the SEC and Nasdaq Stock Market. These requirements include recordkeeping, financial reporting and corporate governance rules and regulations. Our management team has limited experience in managing a U.S. public company and historically, has not had the resources typically found in a public company. Our internal infrastructure may not be adequate to support our increased reporting obligations and we may be unable to hire, train or retain necessary staff and may be reliant on engaging outside consultants or professionals to overcome our lack of experience or employees. Our business, financial condition or results of operations could be adversely affected if our internal infrastructure is inadequate, including if we are unable to engage outside consultants or are otherwise unable to fulfill our public company obligations.
33
Risks Related to Ownership of Our Class A Common Stock
There may be an adverse effect on the value and liquidity of our Class A common stock due to the disparate voting rights of our Class A common stock and our Class B common stock.
With the exception of voting rights and certain conversion rights for the Class B common stock, holders of our Class A common stock and Class B common stock have identical rights. On all matters to be voted on by stockholders, holders of our Class A common stock are entitled to one vote per share while holders of our Class B common stock are entitled to 10 votes per share. The difference in the voting rights of our Class A common stock and Class B common stock could adversely affect the value of the Class A common stock to the extent that any investor or potential future purchaser of our Class A common stock ascribes value to the superior voting rights of our Class B common stock. The existence of two separate classes of common stock could result in less liquidity for our Class A common stock than if there were only one class of our common stock. In addition, if we issue additional shares of Class B common stock in the future, there will be further dilution to investors or potential future purchasers of our Class A common stock.
Our quarterly operating results may fluctuate significantly and could fall below the expectations of securities analysts and investors due to seasonality and other factors, some of which are beyond our control, resulting in a decline in our stock price.
Our quarterly operating results may fluctuate significantly because of several factors, including:
|
|
• |
duration and severity of the COVID-19 pandemic and the restrictive measures adopted by governments to contain the pandemic; |
|
|
• |
the timing of new restaurant openings and related expense; |
|
|
• |
restaurant operating costs for our newly-opened restaurants, which are often materially greater during the first several months of operation than thereafter; |
|
|
• |
labor availability and costs for hourly and management personnel; |
|
|
• |
profitability of our restaurants, especially in new markets; |
|
|
• |
changes in interest rates; |
|
|
• |
increases and decreases in AUVs and comparable restaurant sales; |
|
|
• |
impairment of long-lived assets and any loss on restaurant closures; |
|
|
• |
macroeconomic conditions, both nationally and locally; |
|
|
• |
negative publicity relating to the consumption of seafood or other food products we serve; |
|
|
• |
changes in consumer preferences and competitive conditions; |
|
|
• |
expansion in existing and new markets; |
|
|
• |
increases in infrastructure costs; and |
|
|
• |
fluctuations in commodity prices. |
Seasonal factors and the timing of holidays also cause our sales to fluctuate from quarter to quarter. As a result of these factors, our quarterly and annual operating results and comparable restaurant sales may fluctuate significantly. Accordingly, results for any one quarter are not necessarily indicative of results to be expected for any other quarter or for any year and comparable restaurant sales for any particular future period may decrease. In addition, as we expand by opening more restaurants in cold weather climates, the seasonality of our business may be amplified. In the future, operating results may fall below the expectations of securities analysts and investors. In that event, the price of our common stock could be adversely impacted.
34
The price of our common stock may be volatile and you may lose all or part of your investment.
The market price of our common stock could fluctuate significantly, and you may not be able to resell your shares at or above the purchase price. Those fluctuations could be based on various factors in addition to those otherwise described in this report, including those described under “—Risks Related to Our Business and Industry” and the following:
|
|
• |
our operating performance and the performance of our competitors or restaurant companies in general; |
|
|
• |
the public’s reaction to our press releases, our other public announcements and our filings with the SEC; |
|
|
• |
changes in earnings estimates or recommendations by research analysts who follow us or other companies in our industry; |
|
|
• |
global, national or local economic, legal and regulatory factors unrelated to our performance; |
|
|
• |
future sales of our common stock or our equity interests by our officers, directors and significant stockholders; |
|
|
• |
the arrival or departure of key personnel; and |
|
|
• |
other developments affecting us, our industry or our competitors. |
For example, the U.S. stock market has experienced significant price and volume fluctuations due to the COVID-19 pandemic and the recessionary cycle affecting the U.S. economy. These broad market fluctuations have affected the market price of our common stock and could adversely impact our common stock price.
Future sales of our common stock, or the perception that such sales may occur, could depress our common stock price.
Sales of a substantial number of shares of our common stock in the public market, or the perception that such sales may occur, could depress the market price of our common stock. This would include sales by Kura Japan, as detailed below under “—Risks Related to Our Organizational Structure—Future sales of our shares by Kura Japan could depress our Class A common stock price.”
Our amended and restated certificate of incorporation authorize us to issue up to 50,000,000 shares of Class A common stock and 10,000,100 shares of Class B common stock, of which, as of August 31, 2020, 7,342,012 shares of Class A common stock and 1,000,050 shares of Class B common stock are outstanding, and 531,747 shares of Class A common stock will be issuable upon the exercise of outstanding stock options. The shares of Class A common stock offered are freely tradable without restriction under the Securities Act, except for any shares of our common stock that is held by our directors, executive officers and other affiliates, as that term is defined in the Securities Act, which will be restricted securities under the Securities Act. Restricted securities may not be sold in the public market unless the sale is registered under the Securities Act or an exemption from registration is available.
Shares of our Class A common stock and Class B common stock held by our affiliates are subject to the volume and other restrictions of Rule 144 under the Securities Act.
In addition, we filed a registration statement on Form S-8 registering under the Securities Act 700,000 shares of Class A common stock reserved for issuance under our 2018 Incentive Compensation Plan.
In the future, we may also issue common stock or other securities. The number of new shares of our common stock issued in connection with raising additional capital could constitute a material portion of the then outstanding shares of our common stock and dilute our current stockholders.
If securities or industry analysts do not publish research or publish inaccurate or unfavorable research about our business, our stock price and trading volume could decline.
The trading market for our common stock will depend in part on the research and reports that securities or industry analysts publish about us or our business. If one or more of the analysts who cover us downgrades our
35
common stock or publishes inaccurate or unfavorable research about our business, our stock price would likely decline. If one or more of these analysts ceases coverage of us or fails to publish reports on us regularly, demand for our common stock could decrease, which could cause our stock prices and trading volume to decline.
We do not intend to pay dividends for the foreseeable future.
We may retain future earnings, if any, for future operations, expansion and debt repayment and have no current plans to pay any cash dividends for the foreseeable future. Any future determination to declare and pay cash dividends will be at the discretion of our board of directors and will depend on, among other things, our financial condition, results of operations, cash requirements, contractual restrictions and such other factors as our board of directors deems relevant. Our ability to pay dividends may also be limited by covenants under our Credit Facility, terms loans or of any future outstanding indebtedness we, our subsidiaries or affiliates (including Kura Japan) incur. As a result, you may not receive any return on an investment in our common stock unless you sell our common stock for a price greater than that which you paid for it.
Provisions in our charter documents and Delaware law may delay or prevent our acquisition by a third party.
Our amended and restated certificate of incorporation and amended and restated bylaws, and Delaware law, contain several provisions that may make it more difficult for a third party to acquire control of us without the approval of our board of directors. These provisions may make it more difficult or expensive for a third party to acquire a majority of our outstanding equity interests. These provisions also may delay, prevent or deter a merger, acquisition, tender offer, proxy contest or other transaction that might otherwise result in our stockholders receiving a premium over the market price for their common stock.
Our amended and restated certificate of incorporation and amended and restated bylaws each contain an exclusive forum provision, which could limit a stockholder’s ability to obtain a favorable judicial forum for disputes with us or our directors, officers or other employees.
Our amended and restated certificate of incorporation and amended and restated bylaws each contain an exclusive forum provision providing that the Court of Chancery of the State of Delaware will be the sole and exclusive forum for: (i) any derivative action or proceeding brought on our behalf, (ii) any action asserting a claim of breach of a fiduciary duty owed by, or other wrongdoing by, any of our directors, officers, employees, agents or stockholders, (iii) any action asserting a claim arising pursuant to any provision of the Delaware General Corporation Law, our amended and restated certificate of incorporation or our amended and restated bylaws, or (iv) any action asserting a claim that is governed by the internal affairs doctrine. However, Section 27 of the Exchange Act creates exclusive federal jurisdiction over all suits brought to enforce any duty or liability created by the Exchange Act or the rules and regulations thereunder. As a result, the exclusive forum provision will not apply to suits brought to enforce any duty or liability created by the Exchange Act or any other claim for which the federal courts have exclusive jurisdiction. In addition, Section 22 of the Securities Act creates concurrent jurisdiction for federal and state courts over all suits brought to enforce any duty or liability created by the Securities Act or the rules and regulations thereunder. As a result, the exclusive forum provisions will not apply to suits brought to enforce any duty or liability created by the Securities Act or any other claim for which the federal and state courts have concurrent jurisdiction, and our stockholders will not be deemed to have waived our compliance with the federal securities laws and the rules and regulations thereunder.
Any person purchasing or otherwise acquiring any interest in any shares of our capital stock shall be deemed to have notice of and to have consented to this provision of our amended and restated certificate of incorporation and our amended and restated bylaws. The exclusive forum provisions, if enforced, may limit a stockholder’s ability to bring a claim in a judicial forum that it finds favorable for disputes with us or our directors, officers or other employees, which may discourage such lawsuits. Alternatively, if a court were to find the exclusive forum provisions to be inapplicable or unenforceable in an action, we may incur additional costs associated with resolving such action in other jurisdictions, which could have a material adverse effect on our business, financial condition, results of operations and growth prospects. For example, the Court of Chancery of the State of Delaware recently determined that a provision stating that U.S. federal district courts are the exclusive forum for resolving any complaint asserting a cause of action arising under the Securities Act is not enforceable.
36
Risks Related to Our Organizational Structure
We are controlled by Kura Japan, whose interests may differ from those of our other stockholders.
As of the date of this report, Kura Japan controls approximately 81% of the combined voting power of our equity interests through their ownership of both Class A common stock and Class B common stock. Kura Japan will, for the foreseeable future, have significant influence over corporate management and affairs, and will be able to control virtually all matters requiring stockholder approval so long as Kura Japan owns a majority of the combined voting power of our outstanding equity interests. Kura Japan currently owns 4,000,000 shares of Class A common stock and 1,000,050 shares of Class B common stock and a majority of the combined voting power of our outstanding equity interests, and effectively control the outcome of matters submitted to stockholders that require a majority vote based on our outstanding equity interests. Kura Japan is able to, subject to applicable law, elect a majority of the members of our board of directors and control actions to be taken by us and our board of directors, including amendments to our certificate of incorporation and bylaws and approval of significant corporate transactions, including, among other matters, mergers and sales of substantially all of our assets, as well as incurrence of indebtedness by us. The directors so elected will have the authority, subject to the terms of our indebtedness and applicable rules and regulations, to issue additional stock, implement stock repurchase programs, declare dividends and make other decisions. It is possible that the interests of Kura Japan may in some circumstances conflict with our interests and the interests of our other stockholders, including you. For example, Kura Japan may have different tax positions from us that could influence their decisions regarding whether and when to dispose of assets and whether and when to incur new or refinance existing indebtedness. Such indebtedness could contain covenants that prevent us from declaring dividends to stockholders. In addition, the determination of future tax reporting positions and the structuring of future transactions may take into consideration Kura Japan’s tax or other considerations, which may differ from our considerations or our other stockholders. For additional information about our relationships with Kura Japan, you should read the information under “Note 5. Related Party Transactions” to our audited financial statements included in “Item 8. Financial Statements and Supplementary Data” in this Annual Report on Form 10-K for additional information.
We are a “controlled company” within the meaning of the Nasdaq listing standards and, as a result, will qualify for, and may rely on, exemptions from certain corporate governance requirements. You will not have the same protections afforded to stockholders of companies that are subject to such requirements.
As of the date of this report, Kura Japan controls approximately 81% of the combined voting power of our equity interests through their ownership of both Class A common stock and Class B common stock. Because of the voting power of Kura Japan, we are considered a “controlled company” for the purposes of the Nasdaq Stock Market. As such, we are exempt from certain corporate governance requirements of the Nasdaq Stock Market, including (i) the requirement that a majority of the board of directors consist of independent directors, (ii) the requirement that we have a Nominating and Corporate Governance Committee that is composed entirely of independent directors and (iii) the requirement that we have a Compensation Committee that is composed entirely of independent directors. We may rely on the above-stated exemptions so long as we are considered a “controlled company” under the Nasdaq Stock Market requirements. Accordingly, you will not have the same protections afforded to stockholders of companies that are subject to all of the corporate governance requirements of the Nasdaq Stock Market. We currently have a board composed of a majority of independent directors and our Compensation Committee is composed entirely of independent directors but we do not have a Nominating and Corporate Governance Committee.
The interests of Kura Japan may conflict with ours or yours in the future.
Various conflicts of interest between Kura Japan and us could arise. Ownership interests of directors or officers of Kura Japan in our common stock, or a person’s service as either a director or officer of both companies, could create or appear to create potential conflicts of interest when those directors and officers are faced with decisions that could have different implications for Kura Japan and Kura Sushi USA. These decisions could, for example, relate to:
|
|
• |
disagreement over corporate opportunities; |
|
|
• |
management stock ownership; |
37
|
|
• |
our dividend policy; and |
|
|
• |
the services and arrangements from which we benefit as a result of its relationship with Kura Japan. |
Potential conflicts of interest could also arise if we enter into any new commercial arrangements with Kura Japan in the future. Our directors and officers who have interests in both Kura Japan and us may also face conflicts of interest with regard to the allocation of their time between Kura Japan and Kura Sushi USA.
The corporate opportunity provisions in our amended and restated certificate of incorporation could enable Kura Japan to benefit from corporate opportunities that might otherwise be available to Kura Sushi USA.
Our amended and restated certificate of incorporation contains provisions related to corporate opportunities that may be of interest to both Kura Japan and us. It provides that if a corporate opportunity is offered to:
|
|
• |
one of our officers or employees who is also a director (but not an officer or employee) of Kura Japan, that opportunity will belong to us unless expressly offered to that person primarily in his or her capacity as a director of Kura Japan, in which case it will belong to Kura Japan; |
|
|
• |
one of our directors who is also an officer or employee of Kura Japan, that opportunity will belong to Kura Japan unless expressly offered to that person primarily in his or her capacity as our director, in which case it will belong to us; and |
|
|
• |
any person who is either (1) an officer or employee of both us and Kura Japan or (2) a director of both us and Kura Japan (but not an officer or employee of either one), that opportunity will belong to Kura Japan unless expressly offered to that person primarily in his or her capacity as our director, in which case such opportunity shall belong to us. |
Hiroyuki Okamoto, a member of our board of directors, is also an employee of Kura Japan, but none of our other officers or directors are also an officer, employee or director of Kura Japan. A very small number of our non-officer employees are both employees of our company and Kura Japan. Accordingly, no officers of the Company fit the description of the first and third bullets above, and only Mr. Okamoto fits the description of personnel described in the second bullet above given his roles at our company and Kura Japan.
In following these procedures, any person who is offered a corporate opportunity will have satisfied his or her fiduciary duties to our stockholders and us. In addition, our amended and restated certificate of incorporation provides that any corporate opportunity that belongs to Kura Japan or to us, as the case may be, may not be pursued by the other, unless and until the party to whom the opportunity belongs determines not to pursue the opportunity and so informs the other party. Furthermore, so long as the material facts of any transaction between us and Kura Japan have been disclosed to or are known by our board of directors or relevant board committee, and the board or such committee (which may, for quorum purposes, include directors who are directors or officers of Kura Japan) authorizes the transaction by an affirmative vote of a majority of the disinterested directors, then Kura Japan will have satisfied its fiduciary duties and will not be liable to us or our stockholders for any breach of fiduciary duty or duty of loyalty relating to that transaction. These provisions create the possibility that a corporate opportunity that may be pertinent to us may be used for the benefit of Kura Japan.
Future sales of our shares by Kura Japan could depress our Class A common stock price.
Kura Japan may sell all or a portion of the shares of our Class A common stock and Class B common stock that it owns (which shares of Class B common stock would be converted automatically into Class A shares in connection with any sale). Sales by Kura Japan in the public market could depress our Class A common stock price. Kura Japan is not subject to any contractual obligation to maintain its ownership position in our shares.
None.
38
As of August 31, 2020, we operate 25 restaurants in five states. We operate a variety of restaurant formats, including in-line and end-cap restaurants located in retail centers of varying sizes. Our restaurants range in size from 1,600 to 6,800 square feet, with an average of approximately 3,400 square feet. We lease the property for our corporate offices located in Irvine, California and all of the properties on which we operate our restaurants.
The table below shows the locations of our restaurants as of August 31, 2020:
|
City |
|
State |
|
Opened |
|
City |
|
State |
|
Opened |
|
Irvine |
|
California |
|
Sep-2009 |
|
Sugar Land |
|
Texas |
|
Jan-2018 |
|
Los Angeles (Little Tokyo) |
|
California |
|
Jan-2012 |
|
Houston (Midtown) |
|
Texas |
|
Mar-2018 |
|
Torrance |
|
California |
|
Apr-2012 |
|
Pleasanton |
|
California |
|
Apr-2018 |
|
Brea |
|
California |
|
May-2012 |
|
Frisco |
|
Texas |
|
May-2018 |
|
Rancho Cucamonga |
|
California |
|
Aug-2012 |
|
Cerritos |
|
California |
|
Oct-2018 |
|
Los Angeles (Sawtelle) |
|
California |
|
Aug-2013 |
|
Schaumburg |
|
Illinois |
|
Nov-2018 |
|
San Diego |
|
California |
|
Mar-2015 |
|
Cypress |
|
California |
|
Jan-2019 |
|
Cupertino |
|
California |
|
Feb-2016 |
|
Sacramento |
|
California |
|
Mar-2019 |
|
Plano |
|
Texas |
|
May-2016 |
|
Las Vegas |
|
Nevada |
|
Jul-2019 |
|
Carrollton |
|
Texas |
|
Jul-2016 |
|
Garden Grove |
|
California |
|
Aug-2019 |
|
Austin |
|
Texas |
|
May-2017 |
|
Katy |
|
Texas |
|
Dec-2019 |
|
Doraville |
|
Georgia |
|
Jul-2017 |
|
Glendale |
|
California |
|
Feb-2020 |
|
Houston (Westheimer) |
|
Texas |
|
Aug-2017 |
|
|
|
|
|
|
We are obligated under non-cancelable leases for the majority of our restaurants, as well as our corporate offices. The majority of our restaurant leases have lease terms of twenty years, inclusive of customary extensions which are at the option of the Company. Our restaurant leases generally require us to pay a proportionate share of real estate taxes, insurance, common area maintenance charges, and other operating costs. Some restaurant leases provide for contingent rental payments based on sales thresholds, although we generally do not expect to pay significant rent on these properties based on the thresholds in those leases.
For a description of our legal proceedings, see Part II, Item 8, Note 9 – Commitments and Contingencies, of the Notes to Financial Statements of this Annual Report on Form 10-K, which is incorporated herein by reference.
Not applicable.
39
|
Item 5. |
Market for Registrant’s Common Equity, Related Stockholder Matters and Issuer Purchases of Equity Securities |
Market Information for Common Stock
Our common stock has traded on the Nasdaq Global Market under the symbol “KRUS” since it began trading on August 1, 2019. Before then, there was no public market for our common stock.
Holders of Record
As of November 11, 2020, we had 3 holders of record of our Class A common stock and one holder of our Class B common stock. The number of holders of record is based upon the actual number of holders registered as of such date and does not include holders of shares in “street name” or persons, partnerships, associates, corporations or other entities in security position listings maintained by depositories.
Dividends
We have not declared, and currently do not plan to declare in the foreseeable future, dividends on our common stock. Instead, we anticipate that all our earnings in the foreseeable future, if any, will be used for the operation and growth of our business. Any future determination to pay dividends on our common stock will be at the discretion of our board of directors and will depend upon many factors, including our financial condition, our results of operations, our liquidity, legal requirements, restrictions that may be imposed by the terms of current and future financing instruments and other factors deemed relevant by our board of directors.
Stock Performance Graph
The following graph presents a comparison from August 1, 2019 through August 31, 2020 of the cumulative return of our common stock, the Nasdaq Composite Index and the S&P 600 Restaurants Index. The graph assumes investment of $100 on August 1, 2019 in our common stock and in each of the two indices and the reinvestment of dividends. This graph is furnished and not “filed” with the SEC or “soliciting material” under the Exchange Act and shall not be incorporated by reference into any such filings, irrespective of any general incorporation contained in such filing.
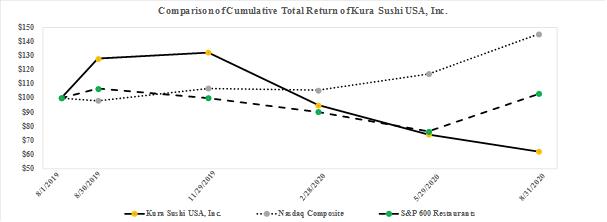
40
|
|
|
8/1/2019 |
|
|
8/31/2020 |
|
||
|
Kura Sushi USA, Inc. |
|
$ |
100.00 |
|
|
$ |
62.32 |
|
|
Nasdaq Composite |
|
$ |
100.00 |
|
|
$ |
145.18 |
|
|
S&P 600 Restaurants Index |
|
$ |
100.00 |
|
|
$ |
103.04 |
|
Use of Proceeds from Initial Public Offering of Class A Common Stock
On July 31, 2019, we priced the initial public offering of our Class A common stock pursuant to a registration statement (File No. 333-232551), that was declared effective on July 31, 2019. The offering closed on August 5, 2019 after all of the securities registered in the registration statement were sold.
Under the registration statement, we sold an aggregate of 3,335,000 of Class A common stock at a price of $14.00 per share. This included 435,000 shares issued and sold by us pursuant to the exercise of the underwriters’ option to purchase additional shares. The shares were sold to the underwriters at the IPO price of $14.00 per share less an underwriting discount of $0.98 per share. BMO Capital Markets Corp. and Stephens Inc. acted as representatives of the underwriters for the offering. We received aggregate net proceeds of approximately $39 million after deducting the underwriting discounts and commissions and estimated offering expenses payable by us. We used a portion of the net proceeds to repay all of the approximately $3.1 million borrowings outstanding under our credit facility with Bank of the West, with the remaining proceeds used to support new unit growth, for working capital and general corporate purposes. No payments were made by us to directors, officers or persons owning 10% or more of our common stock or to their associates, or to our affiliates.
Recent Sales of Unregistered Securities
During fiscal year 2020, we did not sell any securities without registration under the Securities Act of 1933.
Issuer Purchases of Equity Securities
We did not repurchase any of our equity securities during fiscal year 2020.
Equity Compensation Plan Information
For equity compensation plan information, refer to “Part III, Item 12. Security Ownership of Certain Beneficial Owners and Management and Related Stockholder Matters” of this Annual Report on Form 10-K.
41
The following tables set forth selected historical financial data, for the periods and as of the dates indicated, derived from our audited financial statements included elsewhere in this Annual Report on Form 10-K and from our Annual Report on Form 10-K for fiscal year 2019 as filed with the SEC on November 26, 2019. These tables should be read in conjunction with “Item 1A. Risk Factors,” “Item 7. Management’s Discussion and Analysis of Financial Condition and Results of Operations,” and our financial statements and notes thereto included in “Item 8. Financial Statements and Supplementary Data,” of this report. Our historical results are not necessarily indicative of future results.
|
|
|
Fiscal Years Ended August 31, |
|
|||||||||||||
|
|
|
2020 |
|
|
2019 |
|
|
2018 |
|
|
2017 |
|
||||
|
|
|
(amounts in thousands, except per share data) |
|
|||||||||||||
|
Statements of Operations Data: |
|
|
|
|
|
|
|
|
|
|
|
|
|
|
|
|
|
Sales |
|
$ |
45,168 |
|
|
$ |
64,245 |
|
|
$ |
51,744 |
|
|
$ |
37,251 |
|
|
Restaurant operating costs: |
|
|
|
|
|
|
|
|
|
|
|
|
|
|
|
|
|
Food and beverage costs |
|
|
14,709 |
|
|
|
21,048 |
|
|
|
17,594 |
|
|
|
13,389 |
|
|
Labor and related costs |
|
|
18,669 |
|
|
|
19,942 |
|
|
|
15,994 |
|
|
|
12,117 |
|
|
Occupancy and related expenses |
|
|
6,359 |
|
|
|
4,593 |
|
|
|
3,013 |
|
|
|
2,077 |
|
|
Depreciation and amortization expenses |
|
|
2,980 |
|
|
|
2,055 |
|
|
|
1,624 |
|
|
|
1,345 |
|
|
Other costs |
|
|
6,705 |
|
|
|
7,088 |
|
|
|
5,404 |
|
|
|
3,907 |
|
|
Total restaurant operating costs |
|
|
49,422 |
|
|
|
54,726 |
|
|
|
43,629 |
|
|
|
32,835 |
|
|
General and administrative expenses |
|
|
12,064 |
|
|
|
7,748 |
|
|
|
5,965 |
|
|
|
3,364 |
|
|
Depreciation and amortization expenses |
|
|
180 |
|
|
|
110 |
|
|
|
51 |
|
|
|
25 |
|
|
Impairment of long-lived assets, net |
|
|
— |
|
|
|
— |
|
|
|
236 |
|
|
|
— |
|
|
Total operating expenses |
|
|
61,666 |
|
|
|
62,584 |
|
|
|
49,881 |
|
|
|
36,224 |
|
|
Operating income (loss) |
|
|
(16,498 |
) |
|
|
1,661 |
|
|
|
1,863 |
|
|
|
1,027 |
|
|
Other expense (income): |
|
|
|
|
|
|
|
|
|
|
|
|
|
|
|
|
|
Interest expense |
|
|
136 |
|
|
|
188 |
|
|
|
128 |
|
|
|
85 |
|
|
Interest income |
|
|
(450 |
) |
|
|
(51 |
) |
|
|
(12 |
) |
|
|
(5 |
) |
|
Income (loss) before income taxes |
|
|
(16,184 |
) |
|
|
1,524 |
|
|
|
1,747 |
|
|
|
947 |
|
|
Income tax expense |
|
|
1,174 |
|
|
|
68 |
|
|
|
5 |
|
|
|
240 |
|
|
Net income (loss) |
|
$ |
(17,358 |
) |
|
$ |
1,456 |
|
|
$ |
1,742 |
|
|
$ |
707 |
|
|
Net income (loss) per share attributable to Class A and Class B common stockholders |
|
|
|
|
|
|
|
|
|
|
|
|
|
|
|
|
|
Basic |
|
$ |
(2.08 |
) |
|
$ |
0.28 |
|
|
$ |
0.35 |
|
|
$ |
0.14 |
|
|
Diluted |
|
$ |
(2.08 |
) |
|
$ |
0.26 |
|
|
$ |
0.34 |
|
|
$ |
0.14 |
|
|
Weighted average shares used to compute net income (loss) per share attributable to Class A and Class B common stockholders |
|
|
|
|
|
|
|
|
|
|
|
|
|
|
|
|
|
Basic |
|
|
8,338 |
|
|
|
5,283 |
|
|
|
5,000 |
|
|
|
5,000 |
|
|
Diluted |
|
|
8,338 |
|
|
|
5,512 |
|
|
|
5,050 |
|
|
|
5,000 |
|
|
|
|
As of August 31, |
|
|||||||||||||
|
|
|
2020 |
|
|
2019 |
|
|
2018 |
|
|
2017 |
|
||||
|
|
|
(amounts in thousands) |
|
|||||||||||||
|
Balance Sheet Data: |
|
|
|
|
|
|
|
|
|
|
|
|
|
|
|
|
|
Cash and cash equivalents |
|
$ |
9,259 |
|
|
$ |
38,044 |
|
|
$ |
5,711 |
|
|
$ |
2,882 |
|
|
Total assets |
|
|
118,379 |
|
|
|
76,410 |
|
|
|
32,069 |
|
|
|
23,160 |
|
|
Finance leases liabilities - non-current |
|
|
1,481 |
|
|
|
2,424 |
|
|
|
3,443 |
|
|
|
2,878 |
|
|
Operating leases liabilities - non-current |
|
|
56,918 |
|
|
|
— |
|
|
|
— |
|
|
|
— |
|
|
Total liabilities |
|
|
72,666 |
|
|
|
14,229 |
|
|
|
10,564 |
|
|
|
8,502 |
|
|
Total stockholders' equity |
|
|
45,713 |
|
|
|
62,181 |
|
|
|
21,505 |
|
|
|
14,658 |
|
42
|
|
|
Fiscal Years Ended August 31, |
|
|||||||||||||
|
|
|
2020 |
|
|
2019 |
|
|
2018 |
|
|
2017 |
|
||||
|
|
|
(dollar amounts in thousands) |
|
|||||||||||||
|
Key Financial and Operational Metrics: |
|
|
|
|
|
|
|
|
|
|
|
|
|
|
|
|
|
Restaurants at the end of period |
|
|
25 |
|
|
|
23 |
|
|
|
17 |
|
|
|
14 |
|
|
Average Unit Volumes(a) |
|
$ |
1,942 |
|
|
$ |
3,498 |
|
|
$ |
3,457 |
|
|
$ |
3,358 |
|
|
Comparable restaurant sales growth(b) |
|
|
(37.8 |
)% |
|
|
6.2 |
% |
|
|
2.9 |
% |
|
|
34.8 |
% |
|
EBITDA(c) |
|
$ |
(13,338 |
) |
|
$ |
3,826 |
|
|
$ |
3,538 |
|
|
$ |
2,397 |
|
|
Adjusted EBITDA(c) |
|
$ |
(12,995 |
) |
|
$ |
5,195 |
|
|
$ |
4,284 |
|
|
$ |
2,615 |
|
|
as a percentage of sales |
|
|
(28.8 |
)% |
|
|
8.1 |
% |
|
|
8.3 |
% |
|
|
7.0 |
% |
|
Operating income (loss) |
|
$ |
(16,498 |
) |
|
$ |
1,661 |
|
|
$ |
1,863 |
|
|
$ |
1,027 |
|
|
Operating profit margin |
|
|
(36.5 |
)% |
|
|
2.6 |
% |
|
|
3.6 |
% |
|
|
2.8 |
% |
|
Restaurant-level operating profit(c) |
|
$ |
(733 |
) |
|
$ |
12,945 |
|
|
$ |
10,380 |
|
|
$ |
6,471 |
|
|
Restaurant-level operating profit margin(c) |
|
|
(1.6 |
)% |
|
|
20.1 |
% |
|
|
20.1 |
% |
|
|
17.4 |
% |
|
(a) |
Average Unit Volumes (“AUVs”) consist of the average annual sales of all restaurants that have been open for 18 months or longer at the end of the fiscal year presented. The AUVs measure is calculated excluding the Laguna Hills, California restaurant, which closed in fiscal year 2018, and has also been adjusted for restaurants that were not open for the entire fiscal year presented (such as a restaurant closed for renovation) to annualize sales for such period of time. No adjustments were made for the temporary restaurant closures due to COVID-19 during fiscal year 2020. See “Item 7. Management’s Discussion and Analysis of Financial Condition and Results of Operations” for the definition of AUVs. |
|
(b) |
Comparable restaurant sales growth represents the change in year-over-year sales for restaurants open for at least 18 months prior to the start of the accounting period presented, including those temporarily closed for renovations during the year. No adjustments were made for the temporary restaurant closures due to COVID-19 during fiscal year 2020. The comparable restaurant sales growth measure is calculated excluding the Laguna Hills, California restaurant, which closed in fiscal year 2018. |
|
(c) |
EBITDA, Adjusted EBITDA, Restaurant-level Operating Profit and Restaurant-level Operating Profit margin are non-GAAP measures that are neither required by, nor presented in accordance with, accounting principles generally accepted in the United States of America (“GAAP”). We are presenting EBITDA, Adjusted EBITDA, Restaurant-level Operating Profit and Restaurant-level Operating Profit margin because we believe that they provide useful information to management and investors regarding certain financial and business trends relating to our financial condition and operating results. Additionally, we present Restaurant-level Operating Profit because it excludes the impact of general and administrative expenses which are not incurred at the restaurant-level. We also use Restaurant-level Operating Profit to measure operating performance and returns from opening new restaurants. See “Item 7. Management’s Discussion and Analysis of Financial Condition and Results of Operations – EBITDA and Adjusted EBITDA and Restaurant-level Operating Profit and Restaurant-level Operating Profit Margin” for additional information and reconciliations to the most directly comparable GAAP financial measures. |
43
You should read the following discussion and analysis of our financial condition and results of operations together with the “Selected Financial Data” and our financial statements and the related notes and other financial information included elsewhere in this report. Some of the information contained in this discussion and analysis or set forth elsewhere in this report, including information with respect to our plans and strategy for our business, includes forward-looking statements that involve risks and uncertainties. You should review the “Special Note Regarding Forward-Looking Statements” and “Risk Factors” sections of this report for a discussion of important factors that could cause actual results to differ materially from the results described in or implied by the forward-looking statements contained in the following discussion and analysis.
The following MD&A includes a discussion comparing our results in fiscal year 2020 to fiscal year 2019. For a discussion of our results of operations comparing fiscal year 2019 to fiscal year 2018 and a discussion of our cash flows for fiscal year 2018, refer to Part II, Item 7, Management’s Discussion and Analysis of Financial Condition and Results of Operations, included in our Annual Report on Form 10-K for the fiscal year ended August 31, 2019, filed with the SEC on November 26, 2019.
Overview
Kura Sushi USA, Inc. is a technology-enabled Japanese restaurant concept that provides guests with a distinctive dining experience by serving authentic Japanese cuisine through an engaging revolving sushi service model, which we refer to as the “Kura Experience”. We encourage healthy lifestyles by serving freshly prepared Japanese cuisine using high-quality ingredients that are free from artificial seasonings, sweeteners, colorings, and preservatives. We aim to make quality Japanese cuisine accessible to our guests across the United States through affordable prices and an inviting atmosphere.
Business Trends; Effects of COVID-19 on Our Business
The negative effects of the COVID-19 on our business have been significant. In March 2020, the World Health Organization declared the novel strain of coronavirus COVID-19 a global pandemic. This contagious virus, which has continued to spread, has adversely affected workforces, customers, economies and financial markets globally. In response to this outbreak, many state and local authorities mandated the temporary closure of non-essential businesses and dine-in restaurant activity. COVID-19 and the government measures taken to control it have caused a significant disruption to our business operation. On March 18, 2020, we announced the temporary closure of all of our 25 restaurants located across five states at that time and had since furloughed certain of our employees. As restrictions lifted, we were able to reopen certain restaurants at reduced indoor dining capacities. We have also started offering outdoor dining at certain restaurants. As of the filing date of this Annual Report on Form 10-K, we have 28 restaurants with 12 restaurants operating with indoor dining at reduced capacities of 25% to 75% and 15 restaurants operating with outdoor dining or takeout only, depending on local requirements, and one restaurant temporarily closed.
To support our employees during this challenging time, we had maintained payroll for all employees through April 5, 2020 and all kitchen employees through May 9, 2020. We continued to maintain payroll for store managers and key kitchen staff during the time when their respective restaurants were temporarily closed. We also continued to pay our employee’s portion of health insurance for all furloughed employees through July 31, 2020. As our restaurants reopened, we were able to bring back certain furloughed employees.
In response to the ongoing COVID-19 pandemic, we have prioritized taking steps to protect the health and safety of our employees and customers. Currently, the California restaurants are not utilizing the revolving conveyor belt. All food is ordered from the tableside touchscreen and delivered to the customers’ tables by the restaurant employees for indoor dining. For outdoor dining, food is ordered and delivered by the restaurant employees. We have also increased cleaning and sanitizing protocols of our restaurants and have implemented additional training and operational manuals for our restaurant employees, as well as increased handwashing procedures. We also provide each restaurant employee with face masks and gloves, and require each employee to pass a health screening process, which includes a temperature check, before the start of each shift.
44
The temporary restaurant closures and the reduced capacities at the reopened restaurants have caused a substantial decline in our sales in the most recently completed fiscal year. In light of the challenges posed by the COVID-19 pandemic, we are focused on maximizing our in-restaurant dining capacity as permitted by the jurisdictions where we operate, continuing to provide a safe environment for our employees and customers, maintaining our operational efficiencies as much as possible and preserving our liquidity. In line with our long-term growth strategy, we expect to continue to open new restaurants at locations where we believe they have the potential to achieve profitability. The future sales levels of our restaurants and our ability to implement our growth strategy, however, remain highly uncertain, as the full impact and duration of the COVID-19 pandemic continues to evolve as of the date of this Annual Report on Form 10-K.
Recent Events Concerning Our Financial Position
On April 10, 2020, we and Kura Japan, entered into a Revolving Credit Agreement establishing a $20 million revolving credit line with a termination date of March 31, 2024, to provide us with additional liquidity as may be necessary. On September 2, 2020, we and Kura Japan entered into a First Amendment to Revolving Credit Agreement (the “First Amendment”) to (i) increase the maximum credit amount under the credit line from $20 million to $35 million, (ii) extend the maturity date for each advance from 12 months to 60 months from the date of disbursement and (iii) extend the last day of the period of availability for the advances under the credit line from March 31, 2024 to April 10, 2025. In connection with the First Amendment, the Revolving Credit Note under the Revolving Credit Agreement was also amended by incorporating the same amendments as provided under the First Amendment. See “Note 5. Related Party Transactions” and “Note 7. Debt”.
On April 14, 2020, we entered into a Promissory Note with Bank of the West, which provided for a loan in the amount of $6.0 million (the “PPP Loan”) pursuant to the Paycheck Protection Program under the Coronavirus Aid, Relief, and Economic Security Act (the “CARES Act”) signed into law on March 27, 2020. On April 29, 2020, we returned the proceeds received from the PPP Loan.
Under the provisions of the CARES Act, we are eligible for a refundable employee retention credit subject to certain criteria. In connection with the CARES Act, the Company adopted a policy to recognize the employee retention credit when earned and to offset the credit against the related expenditure. Accordingly, we recorded a $1.8 million employee retention credit during fiscal year 2020, which is included in labor and related costs in the statements of operations.
We have received rent concessions from our landlords for certain of our restaurants in the form of rent abatements and rent deferrals which were immaterial for fiscal year 2020. We continue to have discussions with our landlords regarding potential future rent concessions.
Due to the impact of COVID-19, we assessed our long-lived assets for potential impairment which resulted in no impairment charges recorded as of August 31, 2020. We also assessed the realizability of our deferred tax assets and recorded a valuation allowance of $5.6 million during fiscal year 2020. See “Note 10. Income Taxes”.
Key Financial Definitions
Sales. Sales represent sales of food and beverages in restaurants. Restaurant sales in a given period are directly impacted by the number of restaurants we operate and comparable restaurant sales growth.
Food and beverage costs. Food and beverage costs are variable in nature, change with sales volume and are influenced by menu mix and subject to increases or decreases based on fluctuations in commodity costs. Other important factors causing fluctuations in food and beverage costs include seasonality and restaurant-level management of food waste. Food and beverage costs are a substantial expense and are expected to grow proportionally as our sales grows.
Labor and related expenses. Labor and related expenses include all restaurant-level management and hourly labor costs, including wages, employee benefits and payroll taxes. Similar to the food and beverage costs that we incur, labor and related expenses are expected to grow proportionally as our sales grows. Factors that influence fluctuations in our labor and related expenses include minimum wage and payroll tax legislation, the frequency and severity of workers’ compensation claims, healthcare costs and the performance of our restaurants.
45
Occupancy and related expenses. Occupancy and related expenses include rent for all restaurant locations and related taxes.
Depreciation and amortization expenses. Depreciation and amortization expenses are periodic non-cash charges that consist of depreciation of fixed assets, including equipment and capitalized leasehold improvements. Depreciation is determined using the straight-line method over the assets’ estimated useful lives, ranging from three to 20 years.
Other costs. Other costs include utilities, repairs and maintenance, credit card fees, royalty payments to Kura Japan, stock-based compensation expenses for restaurant-level employees and other restaurant-level expenses.
General and administrative expenses. General and administrative expenses include expenses associated with corporate and regional supervision functions that support the operations of existing restaurants and development of new restaurants, including compensation and benefits, travel expenses, stock-based compensation expenses for corporate-level employees, legal and professional fees, marketing costs, information systems, corporate office rent and other related corporate costs. General and administrative expenses are expected to grow as our sales grows, including incremental legal, accounting, insurance and other expenses incurred as a public company.
Interest expense. Interest expense includes cash and non-cash charges related to our line of credit and finance lease obligations.
Interest income. Interest income includes income earned on our investments.
Income tax expense (benefit). Provision for income taxes represents federal, state and local current and deferred income tax expense.
46
The following table presents selected comparative results of operations from our audited financial statements for the fiscal year ended August 31, 2020 compared to the fiscal year ended August 31, 2019, and the fiscal year ended August 31, 2019 compared to the fiscal year ended August 31, 2018. Our financial results for these periods are not necessarily indicative of the financial results that we will achieve in future periods. Certain totals for the table below may not sum to 100% due to rounding.
|
|
|
Fiscal Years Ended August 31, |
Increase / (Decrease) |
|
|
||||||||||||
|
|
|
2020 |
|
|
2019 |
|
|
$ |
|
|
% |
|
|
||||
|
|
|
(dollar amounts in thousands) |
|||||||||||||||
|
Sales |
|
$ |
45,168 |
|
|
$ |
64,245 |
|
|
$ |
(19,077 |
) |
|
|
(29.7 |
) |
% |
|
Restaurant operating costs: |
|
|
|
|
|
|
|
|
|
|
|
|
|
|
|
|
|
|
Food and beverage costs |
|
|
14,709 |
|
|
|
21,048 |
|
|
|
(6,339 |
) |
|
|
(30.1 |
) |
|
|
Labor and related costs |
|
|
18,669 |
|
|
|
19,942 |
|
|
|
(1,273 |
) |
|
|
(6.4 |
) |
|
|
Occupancy and related expenses |
|
|
6,359 |
|
|
|
4,593 |
|
|
|
1,766 |
|
|
|
38.4 |
|
|
|
Depreciation and amortization expenses |
|
|
2,980 |
|
|
|
2,055 |
|
|
|
925 |
|
|
|
45.0 |
|
|
|
Other costs |
|
|
6,705 |
|
|
|
7,088 |
|
|
|
(383 |
) |
|
|
(5.4 |
) |
|
|
Total restaurant operating costs |
|
|
49,422 |
|
|
|
54,726 |
|
|
|
(5,304 |
) |
|
|
(9.7 |
) |
|
|
General and administrative expenses |
|
|
12,064 |
|
|
|
7,748 |
|
|
|
4,316 |
|
|
|
55.7 |
|
|
|
Depreciation and amortization expenses |
|
|
180 |
|
|
|
110 |
|
|
|
70 |
|
|
|
63.6 |
|
|
|
Total operating expenses |
|
|
61,666 |
|
|
|
62,584 |
|
|
|
(918 |
) |
|
|
(1.5 |
) |
|
|
Operating income (loss) |
|
|
(16,498 |
) |
|
|
1,661 |
|
|
|
(18,159 |
) |
|
|
(1,093.3 |
) |
|
|
Other expense (income): |
|
|
|
|
|
|
|
|
|
|
|
|
|
|
|
|
|
|
Interest expense |
|
|
136 |
|
|
|
188 |
|
|
|
(52 |
) |
|
|
(27.7 |
) |
|
|
Interest income |
|
|
(450 |
) |
|
|
(51 |
) |
|
|
(399 |
) |
|
|
782.4 |
|
|
|
Income (loss) before income taxes |
|
|
(16,184 |
) |
|
|
1,524 |
|
|
|
(17,708 |
) |
|
|
(1,161.9 |
) |
|
|
Income tax expense |
|
|
1,174 |
|
|
|
68 |
|
|
|
1,106 |
|
|
|
1,626.5 |
|
|
|
Net income (loss) |
|
$ |
(17,358 |
) |
|
$ |
1,456 |
|
|
$ |
(18,814 |
) |
|
|
(1,292.2 |
) |
% |
|
|
|
Fiscal Years Ended August 31, |
|
|
|||||
|
|
|
2020 |
|
|
2019 |
|
|
||
|
Sales |
|
|
100.0 |
|
% |
|
100.0 |
|
% |
|
Restaurant operating costs |
|
|
|
|
|
|
|
|
|
|
Food and beverage costs |
|
|
32.6 |
|
|
|
32.8 |
|
|
|
Labor and related costs |
|
|
41.3 |
|
|
|
31.0 |
|
|
|
Occupancy and related expenses |
|
|
14.1 |
|
|
|
7.1 |
|
|
|
Depreciation and amortization expenses |
|
|
6.6 |
|
|
|
3.2 |
|
|
|
Other costs |
|
|
14.8 |
|
|
|
11.0 |
|
|
|
Total restaurant operating costs |
|
|
109.4 |
|
|
|
85.2 |
|
|
|
General and administrative expenses |
|
|
26.7 |
|
|
|
12.1 |
|
|
|
Depreciation and amortization expenses |
|
|
0.4 |
|
|
|
0.2 |
|
|
|
Impairment of long-lived assets, net |
|
|
— |
|
|
|
— |
|
|
|
Total operating expenses |
|
|
136.5 |
|
|
|
97.4 |
|
|
|
Operating income (loss) |
|
|
(36.5 |
) |
|
|
2.6 |
|
|
|
Other expense (income): |
|
|
|
|
|
|
|
|
|
|
Interest expense |
|
|
0.3 |
|
|
|
0.3 |
|
|
|
Interest income |
|
|
(1.0 |
) |
|
|
(0.1 |
) |
|
|
Income (loss) before income taxes |
|
|
(35.8 |
) |
|
|
2.4 |
|
|
|
Income tax expense |
|
|
2.6 |
|
|
|
0.1 |
|
|
|
Net income (loss) |
|
|
(38.4 |
) |
% |
|
2.3 |
|
% |
47
Fiscal Year Ended August 31, 2020 Compared to Fiscal Year Ended August 31, 2019
Sales. Sales were $45.2 million for fiscal year 2020 compared to $64.2 million for fiscal year 2019, representing a decrease of approximately $19.0 million, or 29.7%. Due to COVID-19, on March 18, 2020 we temporarily closed all of our 25 restaurants and have subsequently re-opened certain restaurants at reduced indoor dining capacities and have offered outdoor dining at certain restaurants, depending on local requirements. The decrease in sales was primarily driven by the temporary restaurant closures and reduced indoor dining capacities during the twelve months ended August 31, 2020, and was slightly offset by sales from the opening of two new restaurants during fiscal year 2020 and a full year of sales related to the six restaurants that opened in fiscal year 2019.
Food and beverage costs. Food and beverage costs were $14.7 million for fiscal year 2020 compared to $21.0 million for fiscal year 2019, representing a decrease of approximately $6.3 million, or 30.1%. The decrease in food and beverage costs was primarily driven by the temporary restaurant closures and reduced indoor dining capacities during the twelve months ended August 31, 2020, and was slightly offset by the costs associated with the sales from the opening of two new restaurants during fiscal year 2020 and a full year of expenses related to the six restaurants that opened in fiscal year 2019. As a percentage of sales, food and beverage costs remained relatively consistent at 32.6% in fiscal year 2020, compared to 32.8% in fiscal year 2019.
Labor and related costs. Labor and related costs were $18.7 million for fiscal year 2020 compared to $19.9 million for fiscal year 2019, representing a decrease of approximately $1.2 million, or 6.4%. The decrease in labor and related costs was driven by a $1.8 million employee retention credit as a result of the CARES Act, as well as the furlough and reduced labor hours of certain employees as a result of the temporary restaurant closures and reduced indoor dining capacities during the twelve months ended August 31, 2020, partially offset by additional labor costs incurred with respect to the two new restaurants that opened during fiscal year 2020 and a full year of expenses related to the six restaurants that opened in fiscal year 2019. As a percentage of sales, labor and related costs increased to 41.3% in fiscal year 2020, compared to 31.0% in fiscal year 2019. The increase in labor and related costs as a percentage of sales as primarily due to a decline in sales and maintaining payroll for certain restaurant employees during the temporary restaurant closures.
Occupancy and related expenses. Occupancy and related expenses were $6.4 million for fiscal year 2020 compared to $4.6 million for fiscal year 2019, representing an increase of approximately $1.8 million, or 38.4%. The increase was primarily a result of additional lease expense incurred with respect to two new restaurants that opened during fiscal year 2020 and a full year of expenses related to the six restaurants that opened in fiscal year 2019. As a percentage of sales, occupancy and other operating expenses increased to 14.1% in fiscal year 2020, compared to 7.1% in fiscal year 2019. The increase in occupancy and related expenses as a percentage of sales was primarily driven by the decrease in sales due to the temporary restaurant closures and reduced indoor dining capacities during the twelve months ended August 31, 2020, as well as higher occupancy rates in our newer restaurants and an increase in pre-opening lease expense.
Depreciation and amortization expenses. Depreciation and amortization expenses incurred as part of restaurant operating costs were $3.0 million for fiscal year 2020 compared to $2.1 million fiscal year 2019, representing an increase of approximately $0.9 million or 45.0%. The increase was primarily due to depreciation of property and equipment related to renovations performed on multiple restaurant locations during fiscal year 2020, the opening of two new restaurants in fiscal 2020, and a full year of expense related to the six restaurants opened in fiscal 2019. As a percentage of sales, depreciation and amortization expenses at the restaurant-level increased to 6.6% in fiscal year 2020 as compared to 3.2% in fiscal year 2019, primarily driven by the decrease in sales due to the temporary restaurant closures and reduced indoor dining capacities during twelve months ended August 31, 2020, as well as the increase in the expenses mentioned above. Depreciation and amortization expenses incurred at the corporate-level were immaterial for fiscal years 2020 and 2019, and as a percentage of sales increased to 0.4% in fiscal year 2020 from 0.2% in fiscal year 2019.
48
Other costs. Other costs were $6.7 million for fiscal year 2020 compared to $7.1 million for fiscal year 2019, representing a decrease of approximately $0.4 million, or 5.4%. The decrease was primarily due to lower operating costs as a result of temporary restaurant closures and reduced indoor dining capacities during the twelve months ended August 31, 2020, such as royalty fees, credit card fees and advertising and promotions, partially offset by costs related to two new restaurants that opened during fiscal year 2020 and a full year of expense related to six restaurants that opened in fiscal year 2019. As a percentage of sales, other costs increased to 14.8% in fiscal year 2020 from 11.0% in fiscal year 2019 primarily due to restaurant supplies and costs that are not directly variable with the decrease in sales, such as maintenance services and utilities.
General and administrative expenses. General and administrative expenses were $12.1 million for fiscal year 2020 compared to $7.7 million for fiscal year 2019, representing an increase of approximately $4.4 million, or 55.7%. This increase in general and administrative expenses was primarily due to $1.4 million of employee compensation-related expenses associated with increased wages and additional headcount to support our growth; $2.2 million of public company costs such as insurance, accounting, and legal costs; and $0.8 million in general legal and consulting costs. As a percentage of sales, general and administrative expenses increased to 26.7% in fiscal year 2020 from 12.1% in fiscal year 2019. The increase in general and administrative expenses as a percentage of sales was primarily driven by the decrease in sales due to the temporary restaurant closures and reduced indoor dining capacities during the twelve months ended August 31, 2020, as well as the increase in the expenses mentioned above.
Interest expense. Interest expense decreased approximately $0.1 million, or 27.7%, in fiscal year 2020. The decrease in interest expense was primarily due to interest expense on the line of credit with Bank of the West that the Company drew down on during the third quarter of fiscal year 2019. The Company paid down the line of credit in the fourth quarter of fiscal year 2019.
Income tax expense. Income tax expense was $1.2 million for fiscal year 2020 compared to $0.1 million for fiscal year 2019, primarily due to a $1.1 million one-time, non-cash charge to record a valuation allowance on our deferred tax assets. For further discussion of our income taxes, see “Note 10. Income Taxes”.
Key Performance Indicators
In assessing the performance of our business, we consider a variety of financial and performance measures. The key measures for determining how our business is performing include sales, EBITDA, Adjusted EBITDA, Restaurant-level Operating Profit, Restaurant-level Operating Profit margin, Average Unit Volumes (“AUVs”), comparable restaurant sales growth, and the number of restaurant openings.
Sales
Sales represents sales of food and beverages in restaurants, as shown on our statements of operations. Several factors affect our restaurant sales in any given period including the number of restaurants in operation, guest traffic and average check.
EBITDA and Adjusted EBITDA
EBITDA is defined as net income (loss) before interest, income taxes and depreciation and amortization. Adjusted EBITDA is defined as EBITDA plus stock-based compensation expense, non-cash lease expense and asset disposals, closure costs and restaurant impairments, as well as certain items that are not indicative of core operating results. EBITDA and Adjusted EBITDA are non-GAAP measures which are intended as supplemental measures of our performance and are neither required by, nor presented in accordance with, GAAP. We believe that EBITDA and Adjusted EBITDA provide useful information to management and investors regarding certain financial and business trends relating to our financial condition and operating results. However, these measures may not provide a complete understanding of the operating results of the Company as a whole and such measures should be reviewed in conjunction with our GAAP financial results.
49
We believe that the use of EBITDA and Adjusted EBITDA provides an additional tool for investors to use in evaluating ongoing operating results and trends and in comparing the Company’s financial measures with those of comparable companies, which may present similar non-GAAP financial measures to investors. However, you should be aware when evaluating EBITDA and Adjusted EBITDA that in the future we may incur expenses similar to those excluded when calculating these measures. In addition, our presentation of these measures should not be construed as an inference that our future results will be unaffected by unusual or non-recurring items. Our computation of Adjusted EBITDA may not be comparable to other similarly titled measures computed by other companies, because all companies may not calculate Adjusted EBITDA in the same fashion.
Because of these limitations, EBITDA and Adjusted EBITDA should not be considered in isolation or as a substitute for performance measures calculated in accordance with GAAP. We compensate for these limitations by relying primarily on our GAAP results and using EBITDA and Adjusted EBITDA on a supplemental basis. You should review the reconciliation of net income to EBITDA and Adjusted EBITDA below and not rely on any single financial measure to evaluate our business.
The following table reconciles net income to EBITDA and Adjusted EBITDA for the fiscal years ended August 31, 2020, August 31, 2019, and August 31, 2018, respectively:
|
|
|
Fiscal Years Ended August 31, |
|
|||||||||
|
|
|
2020 |
|
|
2019(a) |
|
|
2018(a) |
|
|||
|
|
|
(amounts in thousands) |
|
|||||||||
|
Net income (loss) |
|
$ |
(17,358 |
) |
|
$ |
1,456 |
|
|
$ |
1,742 |
|
|
Interest (income) expense, net |
|
|
(314 |
) |
|
|
137 |
|
|
|
116 |
|
|
Taxes |
|
|
1,174 |
|
|
|
68 |
|
|
|
5 |
|
|
Depreciation and amortization |
|
|
3,160 |
|
|
|
2,165 |
|
|
|
1,675 |
|
|
EBITDA |
|
|
(13,338 |
) |
|
|
3,826 |
|
|
|
3,538 |
|
|
Stock-based compensation expense(b) |
|
|
860 |
|
|
|
590 |
|
|
|
105 |
|
|
Non-cash lease expense(c) |
|
|
1,233 |
|
|
|
704 |
|
|
|
405 |
|
|
Employee retention credit(d) |
|
|
(1,750 |
) |
|
|
— |
|
|
|
— |
|
|
Impairment of long-lived assets, net(e) |
|
|
— |
|
|
|
— |
|
|
|
236 |
|
|
Other(f) |
|
|
— |
|
|
|
75 |
|
|
|
— |
|
|
Adjusted EBITDA |
|
|
(12,995 |
) |
|
|
5,195 |
|
|
|
4,284 |
|
|
Adjusted EBITDA margin |
|
|
(28.8 |
)% |
|
|
8.1 |
% |
|
|
8.3 |
% |
|
(a) |
Effective August 31, 2020, we no longer exclude pre-opening costs and cash-based pre-opening lease expense from our computation of Adjusted EBITDA. The non-cash portion of pre-opening lease expense is included in non-cash lease expense in the computation of Adjusted EBITDA. Adjusted EBITDA for the fiscal years 2019 and 2018 have been restated to conform to the current period computation methodology. |
|
(b) |
Stock-based compensation expense includes non-cash stock-based compensation, which is comprised of restaurant-level stock-based compensation included in other costs in the statements of operations and of corporate-level stock-based compensation included in general and administrative expenses in the statements of operations, see “Note 6. Stock-based Compensation” to the financial statements in this Annual Report on Form 10-K. |
|
(c) |
Non-cash lease expense includes lease expense from the date of possession of our restaurants that did not require cash outlay in the respective periods |
|
(d) |
Refundable credit against certain employment taxes recognized under the provisions of the CARES Act. |
|
(e) |
Impairment of long-lived assets, net includes losses incurred due to the impairment of property and equipment related to a restaurant closure partially offset by a reimbursement from the landlord for the termination of the lease. |
|
(f) |
Other adjustments include a $75 thousand expense related to a legal settlement. |
50
Restaurant-level Operating Profit and Restaurant-level Operating Profit Margin
Restaurant-level Operating Profit is defined as operating income (loss) plus depreciation and amortization; stock-based compensation expense; pre-opening costs and general and administrative expenses which are considered normal, recurring, cash operating expenses and are essential to support the development and operations of our restaurants; non-cash lease expense; asset disposals, closure costs and restaurant impairments; less corporate-level stock-based compensation expense recognized within general and administrative expenses. Restaurant-level Operating Profit margin is defined as Restaurant-level Operating Profit divided by sales. Restaurant-level Operating Profit and Restaurant-level Operating Profit margin are intended as supplemental measures of our performance and are neither required by, nor presented in accordance with, GAAP. We believe that Restaurant-level Operating Profit and Restaurant-level Operating Profit margin provide useful information to management and investors regarding certain financial and business trends relating to our financial condition and operating results, as this measure depicts normal, recurring cash operating expenses essential to supporting the development and operations of our restaurants. However, these measures may not provide a complete understanding of the operating results of the Company as a whole and such measures should be reviewed in conjunction with our GAAP financial results. However, these measures may not provide a complete understanding of the operating results of the Company as a whole and such measures should be reviewed in conjunction with our GAAP financial results. We expect Restaurant-level Operating Profit to increase in proportion to the number of new restaurants we open and our comparable restaurant sales growth.
We present Restaurant-level Operating Profit because it excludes the impact of general and administrative expenses, which are not incurred at the restaurant-level. We also use Restaurant-level Operating Profit to measure operating performance and returns from opening new restaurants. Restaurant-level Operating Profit margin allows us to evaluate the level of Restaurant-level Operating Profit generated from sales.
However, you should be aware that Restaurant-level Operating Profit and Restaurant-level Operating Profit margin are financial measures which are not indicative of overall results for the Company, and Restaurant-level Operating Profit and Restaurant-level Operating Profit margin do not accrue directly to the benefit of stockholders because of corporate-level expenses excluded from such measures.
In addition, when evaluating Restaurant-level Operating Profit and Restaurant-level Operating Profit margin, you should be aware that in the future we may incur expenses similar to those excluded when calculating these measures. Our presentation of these measures should not be construed as an inference that our future results will be unaffected by unusual or non-recurring items. Our computation of Restaurant-level Operating Profit and Restaurant-level Operating Profit margin may not be comparable to other similarly titled measures computed by other companies, because all companies may not calculate Restaurant-level Operating Profit and Restaurant-level Operating Profit margin in the same fashion. Restaurant-level Operating Profit and Restaurant-level Operating Profit margin have limitations as analytical tools, and you should not consider it in isolation or as a substitute for analysis of our results as reported under GAAP.
51
The following table reconciles operating income (loss) to Restaurant-level Operating Profit and Restaurant-level Operating Profit margin for the fiscal years ended August 31, 2020, August 31, 2019, and August 31, 2018, respectively:
|
|
Fiscal Years Ended August 31, |
|
|||||||||
|
|
2020 |
|
|
2019(a) |
|
|
2018(a) |
|
|||
|
|
(amounts in thousands) |
|
|||||||||
|
Operating income (loss) |
$ |
(16,498 |
) |
|
$ |
1,661 |
|
|
$ |
1,863 |
|
|
Depreciation and amortization |
|
3,160 |
|
|
|
2,165 |
|
|
|
1,675 |
|
|
Stock-based compensation expense(b) |
|
860 |
|
|
|
590 |
|
|
|
105 |
|
|
Pre-opening costs(c) |
|
972 |
|
|
|
587 |
|
|
|
222 |
|
|
Non-cash lease expense(d) |
|
1,233 |
|
|
|
704 |
|
|
|
405 |
|
|
Employee retention credit(e) |
|
(1,750 |
) |
|
|
— |
|
|
|
— |
|
|
Impairment of long-lived assets, net(f) |
|
— |
|
|
|
— |
|
|
|
236 |
|
|
General and administrative expenses |
|
12,064 |
|
|
|
7,748 |
|
|
|
5,965 |
|
|
Corporate-level stock-based compensation included in General and administrative expenses |
|
(774 |
) |
|
|
(510 |
) |
|
|
(91 |
) |
|
Restaurant-level operating profit (loss) |
|
(733 |
) |
|
|
12,945 |
|
|
|
10,380 |
|
|
Operating profit margin |
|
(36.5 |
)% |
|
|
2.6 |
% |
|
|
3.6 |
% |
|
Restaurant-level operating profit margin |
|
(1.6 |
)% |
|
|
20.1 |
% |
|
|
20.1 |
% |
_______________
|
(a) |
Effective August 31, 2020, the cash portion of pre-opening lease expense is included in pre-opening costs and the non-cash portion of pre-opening lease expense is included in non-cash lease expense in the computation of Restaurant-level operating profit (loss). Restaurant-level operating profit for the fiscal years 2019 and 2018 have been restated to conform to the current period computation methodology and had no impact to the total Restaurant-level operating profit amount of $12.945 million and $10.380 million, respectively. |
|
(b) |
Stock-based compensation expense includes non-cash stock-based compensation, which is comprised of restaurant-level stock-based compensation included in other costs in the statements of operations and of corporate-level stock-based compensation included in general and administrative expenses in the statements of operations, see “Note 6. Stock-based Compensation” to the financial statements in this Annual Report on Form 10-K. |
|
(c) |
Pre-opening costs consist of labor costs and travel expenses for new employees and trainers during the training period, recruitment fees, legal fees, cash-based lease expenses incurred between the date of possession and opening day of our restaurants, and other related pre-opening costs. |
|
(d) |
Non-cash lease expense includes lease expense from the date of possession of our restaurants that did not require cash outlay in the respective periods |
|
(e) |
Refundable credit against certain employment taxes recognized under the provisions of the CARES Act. |
|
(f) |
Impairment of long-lived assets, net includes losses incurred due to the impairment of property and equipment related to a restaurant closure partially offset by a reimbursement from the landlord for the termination of the lease. |
Average Unit Volumes (“AUVs”)
“Average Unit Volumes” or “AUVs” consist of the average annual sales of all restaurants that have been open for 18 months or longer at the end of the fiscal year presented due to new restaurants experiencing a period of higher sales upon opening. AUVs are calculated by dividing (x) annual sales for the fiscal year presented for all such restaurants by (y) the total number of restaurants in that base. We make fractional adjustments to sales for restaurants that were not open for the entire fiscal year presented (such as a restaurant closed for renovation) to annualize sales for such period of time. We did not make any adjustments for the temporary restaurant closures due
52
to COVID-19 during fiscal year 2020. This measurement allows management to assess changes in consumer spending patterns at our restaurants and the overall performance of our restaurant base. The AUVs measure is calculated excluding the Laguna Hills, California restaurant, which closed in fiscal year 2018.
The following table shows the AUVs for the fiscal years ended August 31, 2020, August 31, 2019, and August 31, 2018, respectively
|
|
|
Fiscal Years Ended August 31, |
|
|||||||||
|
|
|
2020 |
|
|
2019 |
|
|
2018 |
|
|||
|
|
|
(in thousands) |
|
|||||||||
|
Average Unit Volumes |
|
$ |
1,942 |
|
|
$ |
3,498 |
|
|
$ |
3,457 |
|
Comparable Restaurant Sales Growth
Comparable restaurant sales growth refers to the change in year-over-year sales for the comparable restaurant base. We include restaurants in the comparable restaurant base that have been in operation for at least 18 months prior to the start of the accounting period presented due to new restaurants experiencing a period of higher sales upon opening, including those temporarily closed for renovations during the year. For restaurants that were temporarily closed for renovations during the year, we make fractional adjustments to sales such that sales are annualized in the associated period. We did not make any adjustments for the temporary restaurant closures due to COVID-19 during fiscal year 2020. The comparable restaurant sales growth measure is calculated excluding the Laguna Hills, California restaurant, which closed in fiscal year 2018.
Measuring our comparable restaurant sales growth allows us to evaluate the performance of our existing restaurant base. Various factors impact comparable restaurant sales, including:
|
|
• |
government restrictions on indoor dining capacity due to COVID-19; |
|
|
• |
consumer recognition of our brand and our ability to respond to changing consumer preferences; |
|
|
• |
overall economic trends, particularly those related to consumer spending; |
|
|
• |
our ability to operate restaurants effectively and efficiently to meet consumer expectations; |
|
|
• |
pricing; |
|
|
• |
guest traffic; |
|
|
• |
per-guest spend and average check; |
|
|
• |
marketing and promotional efforts; |
|
|
• |
local competition; and |
|
|
• |
opening of new restaurants in the vicinity of existing locations. |
Since opening new restaurants will be a significant component of our sales growth, comparable restaurant sales growth is only one measure of how we evaluate our performance. The following table shows the comparable restaurant sales growth for the fiscal years ended August 31, 2020, August 31, 2019, and August 31, 2018, respectively:
|
|
|
Fiscal Years Ended August 31, |
|
|||||||||
|
|
|
2020 |
|
|
2019 |
|
|
2018 |
|
|||
|
Comparable restaurant sales growth (%) |
|
|
(37.8 |
)% |
|
|
6.2 |
% |
|
|
2.9 |
% |
|
Comparable restaurant base |
|
14 |
|
|
10 |
|
|
8 |
|
|||
53
The number of restaurant openings reflects the number of restaurants opened during a particular reporting period. Before we open new restaurants, we incur pre-opening costs. New restaurants may not be profitable, and their sales performance may not follow historical patterns. The number and timing of restaurant openings has had, and is expected to continue to have, an impact on our results of operations. Although we expect to continue to implement our growth strategy, we have slowed down opening new restaurants in fiscal year 2020 to conserve cash in response to the operational challenges posed by the COVID-19 pandemic. The following table shows the growth in our restaurant base for the fiscal years ended August 31, 2020, August 31, 2019, and August 31, 2018, respectively:
|
|
|
Fiscal Years Ended August 31, |
|
|||||||||
|
|
|
2020 |
|
|
2019 |
|
|
2018 |
|
|||
|
Restaurant activity: |
|
|
|
|
|
|
|
|
|
|
|
|
|
Beginning of period |
|
|
23 |
|
|
|
17 |
|
|
|
14 |
|
|
Openings |
|
|
2 |
|
|
|
6 |
|
|
|
4 |
|
|
Closings |
|
|
— |
|
|
|
— |
|
|
|
(1 |
) |
|
End of period |
|
|
25 |
|
|
|
23 |
|
|
|
17 |
|
Liquidity and Capital Resources
Our primary uses of cash are for operational expenditures and capital investments, including new restaurants, costs incurred for restaurant remodels and restaurant fixtures. Historically, our main sources of liquidity have been cash flows from operations and annual capital contributions from Kura Japan. Kura Japan made capital contributions to us of $5.0 million in fiscal year 2018. We did not receive capital contributions from Kura Japan in fiscal year 2020 or 2019. There is no guarantee that if we need to raise any additional capital, we will receive additional capital contributions from Kura Japan. The impact of the COVID-19 pandemic is highly uncertain and management expects that the current restaurant sales levels and ongoing length and severity of the economic downturn will have a material adverse impact on our business, financial condition, liquidity and financial results. For further discussion, see above under “—Business Trends; Effects of COVID-19 on our Business”.
On April 10, 2020, and amended on September 2, 2020, we and Kura Japan entered into a Revolving Credit Agreement establishing a $35 million revolving credit line with a termination date of April 10, 2025, to provide us with additional liquidity as may be necessary as a result of the impact of COVID-19 and economic downturn. The maturity date for amounts borrowed under the Revolving Credit Agreement is sixty months after the disbursement date, unless renewed or extended by mutual agreement of both parties in additional twelve-month increments. Subsequent to August 31, 2020 and through the date of the filing of this Annual Report on Form 10-K, we borrowed $3 million on this credit line with Kura Japan.
The significant components of our working capital are liquid assets such as cash, cash equivalents and receivables, reduced by accounts payable and accrued expenses. Our working capital position benefits from the fact that we generally collect cash from sales to guests the same day or, in the case of credit or debit card transactions, within several days of the related sale, while we typically have longer payment terms with our vendors.
We believe that cash provided by operating activities, cash on hand and availability under our existing line of credit will be sufficient to fund our lease obligations, capital expenditures and working capital needs for at least the next 12 months.
54
Our primary sources of liquidity and cash flows are operating cash flows and cash on hand. We use this to fund investing expenditures for new restaurant openings, reinvest in our existing restaurants, and increase our working capital. Our working capital position benefits from the fact that we generally collect cash from sales to guests the same day, or in the case of credit or debit card transactions, within several days of the related sale, and we typically have at least 30 days to pay our vendors.
The following table summarizes our cash flows for the periods presented:
|
|
|
Fiscal Years Ended August 31, |
|
|||||||||
|
|
|
2020 |
|
|
2019 |
|
|
2018 |
|
|||
|
|
|
(amounts in thousands) |
|
|||||||||
|
Statement of Cash Flow Data: |
|
|
|
|
|
|
|
|
|
|
|
|
|
Net cash (used in) provided by operating activities |
|
$ |
(13,004 |
) |
|
$ |
5,993 |
|
|
$ |
5,243 |
|
|
Net cash used in investing activities |
|
|
(14,777 |
) |
|
|
(11,255 |
) |
|
|
(6,590 |
) |
|
Net cash (used in) provided by financing activities |
|
|
(1,004 |
) |
|
|
37,595 |
|
|
|
4,176 |
|
Cash Flows (Used in) Provided by Operating Activities
Net cash used in operating activities during the fiscal year 2020 was $13.0 million, which results from net loss of $17.4 million, non-cash charges of $3.2 million for depreciation and amortization, $0.9 million for stock-based compensation, $2.3 million in noncash lease expense, $1.1 million in deferred tax assets, and net cash outflows of approximately $3.2 million from changes in operating assets and liabilities. The net cash outflows from changes in operating assets and liabilities were primarily the result of decreases of $1.0 million for accrued expenses and other current liabilities, $0.6 million for accounts payable, and an increase of $1.3 million in prepaid expenses and other current assets. The decrease in the above-mentioned items was primarily due to the timing of cash payments. The increase in prepaid expenses and other current assets was primarily due to the employee retention credit accrued under the CARES Act.
Net cash provided by operating activities during the fiscal year 2019 was $6.0 million, which results from net income of $1.5 million, non-cash charges of $2.2 million for depreciation and amortization, $0.6 million for stock-based compensation, offset by $0.1 million of increase in deferred tax assets, and net cash inflows of approximately $1.8 million from changes in operating assets and liabilities. The net cash inflows from changes in operating assets and liabilities were primarily the result of increases of $1.6 million for accounts payable, $1.1 million for deferred rent and tenant allowances, $1.1 million for accrued expenses and other current liabilities and $0.5 million in salary and wages payable, partially offset by an increase of $1.1 million in prepaid expenses and other current assets, $0.8 million in deposits and other assets and $0.4 million in accounts receivable. The increase in the above-mentioned items was primarily due to the six new restaurants opened during the fiscal year 2019.
Cash Flows Used in Investing Activities
Net cash used in investing activities during the fiscal year 2020 was $14.8 million, primarily due to purchases of property and equipment. The increase in purchases of property and equipment in fiscal year 2020 is primarily related to capital expenditures for current and future restaurant openings, renovations, maintaining our existing restaurants and other projects.
Net cash used in investing activities during the fiscal year 2019 was $11.3 million, primarily due to purchases of property and equipment. The increase in purchases of property and equipment in fiscal year 2019 is primarily related to capital expenditures for current and future restaurant openings, renovations, maintaining our existing restaurants and other projects.
Cash Flows (Used in) Provided by Financing Activities
Net cash used in financing activities during fiscal year 2020 was $1.0 million primarily due to repayment of principal on financing leases of equipment.
55
Net cash provided by financing activities during fiscal year 2019 was $37.6 million primarily due to $43.4 million received as proceeds from our IPO, net of discounts and commission and $3.9 million in borrowings under our line of credit, partially offset by $1.0 million repayment of principal on finance leases, $4.8 million payment of costs associated with IPO, and repayment of $3.9 million in borrowings.
Contractual Obligations
The following table presents our commitments and contractual obligations as of August 31, 2020, as well as our long-term obligations:
|
|
|
Payments due by fiscal period |
|
|||||||||||||||||
|
|
|
Total |
|
|
Less than 1 year |
|
|
1 – 3 Years |
|
|
3 – 5 Years |
|
|
More than 5 years |
|
|||||
|
|
|
(amounts in thousands) |
|
|||||||||||||||||
|
Operating lease payments(1) |
|
$ |
98,511 |
|
|
$ |
2,313 |
|
|
$ |
11,456 |
|
|
$ |
11,829 |
|
|
$ |
72,913 |
|
|
Finance lease payments(2) |
|
|
2,609 |
|
|
|
1,102 |
|
|
|
1,488 |
|
|
|
19 |
|
|
|
— |
|
|
Purchase obligations(3) |
|
|
3,593 |
|
|
|
3,593 |
|
|
|
— |
|
|
|
— |
|
|
|
— |
|
|
Total contractual obligations |
|
$ |
104,713 |
|
|
$ |
7,008 |
|
|
$ |
12,944 |
|
|
$ |
11,848 |
|
|
$ |
72,913 |
|
|
(1) |
Represent future minimum lease payments for our restaurant operations and corporate office. Operating lease payments excludes contingent rent payments that may be due under certain of our leases based on a percentage of sales in excess of specified thresholds. |
|
(2) |
Reflects the principal payments during the lease terms. |
|
(3) |
Reflects contractual purchase commitments for goods related to restaurant operations and commitments for construction of new restaurants. |
Off-Balance Sheet Arrangements
As of August 31, 2020, we did not have any material off-balance sheet arrangements.
Critical Accounting Policies and Estimates
Our discussion and analysis of operating results and financial condition are based upon our financial statements. The preparation of our financial statements in accordance with GAAP requires us to make estimates and assumptions that affect the reported amounts of assets, liabilities, sales, expenses and related disclosures of contingent assets and liabilities. We base our estimates on past experience and other assumptions that we believe are reasonable under the circumstances, and we evaluate these estimates on an ongoing basis.
Our critical accounting policies are those that materially affect our financial statements and involve subjective or complex judgments by management. Although these estimates are based on management’s best knowledge of current events and actions that may impact us in the future, actual results may be materially different from the estimates. We believe the following critical accounting policies are affected by significant judgments and estimates used in the preparation of our financial statements and that the judgments and estimates are reasonable.
Operating and Finance Leases
We currently lease all of our restaurant locations, corporate offices, and some of the equipment used in our restaurants. On September 1, 2019, we adopted ASU 2016-02, Leases (Topic 842), using a modified retrospective approach. Refer to “Note 4. Leases” to the financial statements in this Annual Report on Form 10-K for further details. At commencement of the lease, we determine the appropriate classification as an operating lease or a finance lease. All of our restaurant and office leases are classified as operating leases and most of our equipment leases are classified as finance leases.
56
Our office leases provide for fixed minimum rent payments. Most of our restaurants provide for fixed minimum rent payments and some require additional contingent rent payments based upon sales in excess of specified thresholds. When achievement of such sales thresholds is deemed probable, contingent rent is accrued in proportion to the sales recognized in the period. For operating leases that include free-rent periods and rent escalation clauses, we recognize rent expense based on the straight-line method. For the purpose of calculating rent expenses under the straight-line method, the lease term commences on the date we obtain control of the property. Lease incentives used to fund leasehold improvements are recognized when earned and reduce the operating right-of-use asset related to the lease. These are amortized through the operating right-of-use asset as reductions of expense over the lease term. Restaurant lease expense is included in the occupancy and related expenses financial statement line item, while office lease expense is included in general and administrative expenses financial statement line item, on the accompanying financial statements.
Assets we acquired under finance lease arrangements are recorded at the lower of the present value of future minimum lease payments or fair value of the assets at the inception of the lease. Finance lease assets are amortized over the shorter of the useful life of the assets or the lease term, and the amortization expense is included in the depreciation and amortization financial statement line item on the accompanying financial statements.
Impairment of Long-Lived Assets
We assess potential impairments of our long-lived assets, which includes property and equipment and operating lease right-of-use assets, in accordance with the provisions of Financial Accounting Standards Board (“FASB”) Accounting Standards Codification (“ASC”) 360—Property, Plant and Equipment. An impairment test is performed on an annual basis or whenever events or changes in circumstances indicate that the carrying value of the assets may not be recoverable. In determining the recoverability of the asset value, an analysis is performed at the individual restaurant level. Assets are grouped at the individual restaurant-level for purposes of the impairment assessment because a restaurant represents the lowest level for which identifiable cash flows are largely independent of the cash flows of other assets and liabilities. Recoverability of an asset group is measured by a comparison of the carrying amount of an asset group to its estimated forecasted restaurant cash flows expected to be generated by the asset group. Factors considered by us in estimating future cash flows include, but are not limited to: significant underperformance relative to expected historical or projected future operating results; significant changes in the manner of use of the acquired assets; and significant negative industry or economic trends. If the carrying amount of the asset group exceeds its estimated undiscounted future cash flows, an impairment charge is recognized as the amount by which the carrying amount of the asset exceeds the fair value of the asset.
We recognized $0.2 million impairment loss during the fiscal year ended August 31, 2018. No impairment loss was recognized during fiscal years ended August 31, 2020 and August 31, 2019.
Jumpstart Our Business Startups Act of 2012
We qualify as an “emerging growth company” as defined in Section 2(a)(19) of the Securities Act, as modified by the JOBS Act. Section 107 of the JOBS Act provides that an emerging growth company can take advantage of the extended transition period provided in Section 7(a)(2)(B) of the Securities Act for complying with new or revised accounting standards. In other words, an emerging growth company can delay the adoption of certain accounting standards until those standards would otherwise apply to private companies. We have irrevocably elected not to avail ourselves of this extended transition period and, as a result, we will adopt new or revised accounting standards on the relevant dates on which adoption of such standards is required for other public companies.
Subject to certain conditions set forth in the JOBS Act, we are also eligible for and intend to take advantage of certain exemptions from various reporting requirements applicable to other public companies that are not emerging growth companies, including (i) the exemption from the auditor attestation requirements with respect to internal control over financial reporting under Section 404 of the Sarbanes-Oxley Act, (ii) the exemptions from say-on-pay, say-on-frequency and say-on-golden parachute voting requirements and (iii) reduced disclosure obligations regarding executive compensation in our periodic reports and proxy statements. We may take advantage of these exemptions until we are no longer an emerging growth company. We will continue to be an emerging growth company until the earliest to occur of (i) the last day of the fiscal year in which the market value of our Class A common stock that is held by non-affiliates exceeds $700 million as of June 30 of that fiscal year, (ii) the last day of
57
the fiscal year in which we had total annual gross revenue of $1 billion or more during such fiscal year (as indexed for inflation), (iii) the date on which we have issued more than $1 billion in non-convertible debt in the prior three-year period or (iv) the last day of the fiscal year following the fifth anniversary of the date of the completion of our IPO.
Commodity and Food Price Risks
Our profitability is dependent on, among other things, our ability to anticipate and react to changes in the costs of key operating resources, including food and beverage and other commodities. We have been able to partially offset cost increases resulting from a number of factors, including market conditions, shortages or interruptions in supply due to weather or other conditions beyond our control, governmental regulations and inflation, by increasing our menu prices, as well as making other operational adjustments that increase productivity. However, substantial increases in costs and expenses could impact our operating results to the extent that such increases cannot be offset by menu price increases or operational adjustments.
Inflation Risk
The primary inflationary factors affecting our operations are food and beverage costs, labor costs, and energy costs. Our restaurant operations are subject to federal and state minimum wage and other laws governing such matters as working conditions, overtime and tip credits. Significant numbers of our restaurant personnel are paid at rates related to the federal and/or state minimum wage and, accordingly, increases in the minimum wage increase our labor costs. To the extent permitted by competition and the economy, we have mitigated increased costs by increasing menu prices and may continue to do so if deemed necessary in future years. Substantial increases in costs and expenses could impact our operating results to the extent such increases cannot be passed through to our guests. Historically, inflation has not had a material effect on our results of operations. Severe increases in inflation, however, could affect the global and U.S. economies and could have an adverse impact on our business, financial condition or results of operations.
While we have been able to partially offset inflation and other changes in the costs of core operating resources by gradually increasing menu prices, coupled with more efficient purchasing practices, productivity improvements and greater economies of scale, there can be no assurance that we will be able to continue to do so in the future. From time to time, competitive conditions could limit our menu pricing flexibility. In addition, macroeconomic conditions could make additional menu price increases imprudent. There can be no assurance that future cost increases can be offset by increased menu prices or that increased menu prices will be fully absorbed by our guests without any resulting change to their visit frequencies or purchasing patterns. In addition, there can be no assurance that we will generate the same sales growth in an amount sufficient to offset inflationary or other cost pressures.
58
INDEX TO FINANCIAL STATEMENTS
|
|
Page |
|
|
|
|
60 |
|
|
|
|
62 |
|
|
|
|
63 |
|
|
|
|
64 |
|
|
|
|
65 |
|
|
|
|
66 |
|
|
59
Report of Independent Registered Public Accounting Firm
To the Stockholders and Board of Directors
Kura Sushi USA, Inc.:
Opinion on the Financial Statements
We have audited the accompanying balance sheet of Kura Sushi USA, Inc. (the Company) as of August 31, 2020, the related statements of operations, stockholders’ equity, and cash flows for the period ended August 31, 2020, and the related notes (collectively, the financial statements). In our opinion, the financial statements present fairly, in all material respects, the financial position of the Company as of August 31, 2020, and the results of its operations and its cash flows for the period ended August 31, 2020, in conformity with U.S. generally accepted accounting principles.
Change in Accounting Principle
As discussed in Note 2 to the financial statements, the Company has changed its method of accounting for the recognition, measurement, presentation and disclosure of leases as of September 1, 2019 due to the adoption of Accounting Standards Update (ASU) 2016-02, Leases, and the amendments in ASUs 2018-01, 2018-10, and 2018-11.
Basis for Opinion
These financial statements are the responsibility of the Company’s management. Our responsibility is to express an opinion on these financial statements based on our audit. We are a public accounting firm registered with the Public Company Accounting Oversight Board (United States) (PCAOB) and are required to be independent with respect to the Company in accordance with the U.S. federal securities laws and the applicable rules and regulations of the Securities and Exchange Commission and the PCAOB.
We conducted our audit in accordance with the standards of the PCAOB. Those standards require that we plan and perform the audit to obtain reasonable assurance about whether the financial statements are free of material misstatement, whether due to error or fraud. The Company is not required to have, nor were we engaged to perform, an audit of its internal control over financial reporting. As part of our audit, we are required to obtain an understanding of internal control over financial reporting but not for the purpose of expressing an opinion on the effectiveness of the Company’s internal control over financial reporting. Accordingly, we express no such opinion.
Our audit included performing procedures to assess the risks of material misstatement of the financial statements, whether due to error or fraud, and performing procedures that respond to those risks. Such procedures included examining, on a test basis, evidence regarding the amounts and disclosures in the financial statements. Our audit also included evaluating the accounting principles used and significant estimates made by management, as well as evaluating the overall presentation of the financial statements. We believe that our audit provides a reasonable basis for our opinion.
/s/ KPMG LLP
We have served as the Company's auditor since 2020.
Irvine, California
November 17, 2020
60
REPORT OF INDEPENDENT REGISTERED PUBLIC ACCOUNTING FIRM
To the stockholders and the Board of Directors of Kura Sushi USA, Inc.
Opinion on the Financial Statements
We have audited the accompanying balance sheets of Kura Sushi USA, Inc. (the "Company") as of August 31, 2019, and the related statements of operations, stockholders’ equity, and cash flows, for each of the two years in the period ended August 31, 2019, the related notes (collectively referred to as the "financial statements"). In our opinion, the financial statements present fairly, in all material respects, the financial position of the Company as of August 31, 2019, and the results of its operations and its cash flows for each of the two years in the period ended August 31, 2019, in conformity with accounting principles generally accepted in the United States of America.
Basis for Opinion
These financial statements are the responsibility of the Company's management. Our responsibility is to express an opinion on the Company's financial statements based on our audits. We are a public accounting firm registered with the Public Company Accounting Oversight Board (United States) (PCAOB) and are required to be independent with respect to the Company in accordance with the U.S. federal securities laws and the applicable rules and regulations of the Securities and Exchange Commission and the PCAOB.
We conducted our audits in accordance with the standards of the PCAOB. Those standards require that we plan and perform the audit to obtain reasonable assurance about whether the financial statements are free of material misstatement, whether due to error or fraud. The Company is not required to have, nor were we engaged to perform, an audit of its internal control over financial reporting. As part of our audits, we are required to obtain an understanding of internal control over financial reporting but not for the purpose of expressing an opinion on the effectiveness of the Company’s internal control over financial reporting. Accordingly, we express no such opinion.
Our audits included performing procedures to assess the risks of material misstatement of the financial statements, whether due to error or fraud, and performing procedures that respond to those risks. Such procedures included examining, on a test basis, evidence regarding the amounts and disclosures in the financial statements. Our audits also included evaluating the accounting principles used and significant estimates made by management, as well as evaluating the overall presentation of the financial statements. We believe that our audits provide a reasonable basis for our opinion.
/s/ Deloitte & Touche LLP
Los Angeles, California
November 26, 2019
We began serving as the Company’s auditor in 2017. In 2019 we became the predecessor auditor.
61
(amounts in thousands, except par value)
|
|
|
As of August 31, |
|
|||||
|
|
|
2020 |
|
|
2019 |
|
||
|
Assets |
|
|
|
|
|
|
|
|
|
Current assets: |
|
|
|
|
|
|
|
|
|
Cash and cash equivalents |
|
$ |
9,259 |
|
|
$ |
38,044 |
|
|
Accounts receivable |
|
|
2,130 |
|
|
|
948 |
|
|
Inventories |
|
|
367 |
|
|
|
539 |
|
|
Due from affiliate |
|
|
12 |
|
|
|
226 |
|
|
Prepaid expenses and other current assets |
|
|
3,010 |
|
|
|
1,744 |
|
|
Total current assets |
|
|
14,778 |
|
|
|
41,501 |
|
|
Non-current assets: |
|
|
|
|
|
|
|
|
|
Property and equipment - net |
|
|
45,541 |
|
|
|
31,917 |
|
|
Operating lease right-of-use assets |
|
|
56,119 |
|
|
|
— |
|
|
Deposits and other assets |
|
|
1,941 |
|
|
|
1,865 |
|
|
Deferred tax assets |
|
|
— |
|
|
|
1,127 |
|
|
Total assets |
|
$ |
118,379 |
|
|
$ |
76,410 |
|
|
|
|
|
|
|
|
|
|
|
|
Liabilities and stockholders' equity |
|
|
|
|
|
|
|
|
|
Current liabilities: |
|
|
|
|
|
|
|
|
|
Accounts payable |
|
$ |
4,919 |
|
|
$ |
3,684 |
|
|
Accrued expenses and other current liabilities |
|
|
720 |
|
|
|
1,635 |
|
|
Salaries and wages payable |
|
|
1,786 |
|
|
|
1,348 |
|
|
Finance leases - current |
|
|
1,004 |
|
|
|
994 |
|
|
Operating lease liabilities - current |
|
|
5,106 |
|
|
|
— |
|
|
Due to affiliate |
|
|
201 |
|
|
|
83 |
|
|
Sales tax payable |
|
|
189 |
|
|
|
547 |
|
|
Total current liabilities |
|
|
13,925 |
|
|
|
8,291 |
|
|
Non-current liabilities: |
|
|
|
|
|
|
|
|
|
Finance leases - non-current |
|
|
1,481 |
|
|
|
2,424 |
|
|
Operating lease liabilities - non-current |
|
|
56,918 |
|
|
|
— |
|
|
Deferred rent |
|
|
— |
|
|
|
2,188 |
|
|
Tenant allowances |
|
|
— |
|
|
|
1,089 |
|
|
Other liabilities |
|
|
342 |
|
|
|
237 |
|
|
Total liabilities |
|
|
72,666 |
|
|
|
14,229 |
|
|
Commitments and contingencies (Note 9) |
|
|
|
|
|
|
|
|
|
Stockholders' equity: |
|
|
|
|
|
|
|
|
|
Preferred stock, $0.001 par value; 1,000 shares authorized, no shares issued or outstanding |
|
|
— |
|
|
|
— |
|
|
Class A common stock, $0.001 par value; 50,000 authorized, 7,342 and 7,335 issued and outstanding as of August 31, 2020 and August 31, 2019, respectively |
|
|
7 |
|
|
|
7 |
|
|
Class B common stock, $0.001 par value; 10,000 authorized, 1,000 issued and outstanding as of August 31, 2020 and August 31, 2019 |
|
|
1 |
|
|
|
1 |
|
|
Additional paid-in capital |
|
|
60,332 |
|
|
|
59,442 |
|
|
Retained earnings (Accumulated deficit) |
|
|
(14,627 |
) |
|
|
2,731 |
|
|
Total stockholders' equity |
|
|
45,713 |
|
|
|
62,181 |
|
|
Total liabilities and stockholders' equity |
|
$ |
118,379 |
|
|
$ |
76,410 |
|
See accompanying notes to financial statements
62
(amounts in thousands, except income (loss) per share data)
|
|
|
Fiscal Years Ended August 31, |
|
|||||||||
|
|
|
2020 |
|
|
2019 |
|
|
2018 |
|
|||
|
Sales |
|
$ |
45,168 |
|
|
$ |
64,245 |
|
|
$ |
51,744 |
|
|
Restaurant operating costs: |
|
|
|
|
|
|
|
|
|
|
|
|
|
Food and beverage costs |
|
|
14,709 |
|
|
|
21,048 |
|
|
|
17,594 |
|
|
Labor and related costs |
|
|
18,669 |
|
|
|
19,942 |
|
|
|
15,994 |
|
|
Occupancy and related expenses |
|
|
6,359 |
|
|
|
4,593 |
|
|
|
3,013 |
|
|
Depreciation and amortization expenses |
|
|
2,980 |
|
|
|
2,055 |
|
|
|
1,624 |
|
|
Other costs |
|
|
6,705 |
|
|
|
7,088 |
|
|
|
5,404 |
|
|
Total restaurant operating costs |
|
|
49,422 |
|
|
|
54,726 |
|
|
|
43,629 |
|
|
General and administrative expenses |
|
|
12,064 |
|
|
|
7,748 |
|
|
|
5,965 |
|
|
Depreciation and amortization expenses |
|
|
180 |
|
|
|
110 |
|
|
|
51 |
|
|
Impairment of long-lived assets, net |
|
|
— |
|
|
|
— |
|
|
|
236 |
|
|
Total operating expenses |
|
|
61,666 |
|
|
|
62,584 |
|
|
|
49,881 |
|
|
Operating income (loss) |
|
|
(16,498 |
) |
|
|
1,661 |
|
|
|
1,863 |
|
|
Other expense (income): |
|
|
|
|
|
|
|
|
|
|
|
|
|
Interest expense |
|
|
136 |
|
|
|
188 |
|
|
|
128 |
|
|
Interest income |
|
|
(450 |
) |
|
|
(51 |
) |
|
|
(12 |
) |
|
Income (loss) before income taxes |
|
|
(16,184 |
) |
|
|
1,524 |
|
|
|
1,747 |
|
|
Income tax expense |
|
|
1,174 |
|
|
|
68 |
|
|
|
5 |
|
|
Net income (loss) |
|
$ |
(17,358 |
) |
|
$ |
1,456 |
|
|
$ |
1,742 |
|
|
Net income (loss) per Class A and Class B shares |
|
|
|
|
|
|
|
|
|
|
|
|
|
Basic |
|
$ |
(2.08 |
) |
|
$ |
0.28 |
|
|
$ |
0.35 |
|
|
Diluted |
|
$ |
(2.08 |
) |
|
$ |
0.26 |
|
|
$ |
0.34 |
|
|
Weighted average Class A and Class B shares |
|
|
|
|
|
|
|
|
|
|
|
|
|
Basic |
|
|
8,338 |
|
|
|
5,283 |
|
|
|
5,000 |
|
|
Diluted |
|
|
8,338 |
|
|
|
5,512 |
|
|
|
5,050 |
|
See accompanying notes to financial statements
63
Statements of Stockholders’ Equity
(amounts in thousands)
|
|
|
|
|
|
|
|
|
|
|
|
|
|
|
|
|
|
|
|
|
|
|
Retained |
|
|
|
|
|
|
|
|
|
Common Stock |
|
|
Additional |
|
|
Earnings |
|
|
Total |
|
||||||||||||||||
|
|
|
Class A |
|
|
Class B |
|
|
Paid-in |
|
|
(Accumulated |
|
|
Stockholders' |
|
|||||||||||||
|
|
|
Shares |
|
|
Amount |
|
|
Shares |
|
|
Amount |
|
|
Capital |
|
|
Deficit) |
|
|
Equity |
|
|||||||
|
Balances as of August 31, 2017 |
|
|
4,000 |
|
|
|
4 |
|
|
|
1,000 |
|
|
|
1 |
|
|
|
15,120 |
|
|
|
(467 |
) |
|
|
14,658 |
|
|
Issuance of common stock |
|
|
— |
|
|
|
— |
|
|
|
— |
|
|
|
— |
|
|
|
— |
|
|
|
— |
|
|
|
— |
|
|
Stock-based compensation |
|
|
— |
|
|
|
— |
|
|
|
— |
|
|
|
— |
|
|
|
105 |
|
|
|
— |
|
|
|
105 |
|
|
Additional capital investment from affiliate |
|
|
— |
|
|
|
— |
|
|
|
— |
|
|
|
— |
|
|
|
5,000 |
|
|
|
— |
|
|
|
5,000 |
|
|
Net income |
|
|
— |
|
|
|
— |
|
|
|
— |
|
|
|
— |
|
|
|
— |
|
|
|
1,742 |
|
|
|
1,742 |
|
|
Balances as of August 31, 2018 |
|
|
4,000 |
|
|
|
4 |
|
|
|
1,000 |
|
|
|
1 |
|
|
|
20,225 |
|
|
|
1,275 |
|
|
|
21,505 |
|
|
Stock-based compensation |
|
|
— |
|
|
|
— |
|
|
|
— |
|
|
|
— |
|
|
|
590 |
|
|
|
— |
|
|
|
590 |
|
|
Issuance of common stock in connection with initial public offering, net of underwriter discounts and issuance costs |
|
|
3,335 |
|
|
|
3 |
|
|
|
— |
|
|
|
— |
|
|
|
38,627 |
|
|
|
— |
|
|
|
38,630 |
|
|
Net income |
|
|
— |
|
|
|
— |
|
|
|
— |
|
|
|
— |
|
|
|
— |
|
|
|
1,456 |
|
|
|
1,456 |
|
|
Balances as of August 31, 2019 |
|
|
7,335 |
|
|
|
7 |
|
|
|
1,000 |
|
|
|
1 |
|
|
|
59,442 |
|
|
|
2,731 |
|
|
|
62,181 |
|
|
Stock-based compensation |
|
|
— |
|
|
|
— |
|
|
|
— |
|
|
|
— |
|
|
|
860 |
|
|
|
— |
|
|
|
860 |
|
|
Net loss |
|
|
— |
|
|
|
— |
|
|
|
— |
|
|
|
— |
|
|
|
— |
|
|
|
(17,358 |
) |
|
|
(17,358 |
) |
|
Exercise of stock options |
|
|
7 |
|
|
|
— |
|
|
|
— |
|
|
|
— |
|
|
|
30 |
|
|
|
— |
|
|
|
30 |
|
|
Balances as of August 31, 2020 |
|
|
7,342 |
|
|
|
7 |
|
|
|
1,000 |
|
|
|
1 |
|
|
|
60,332 |
|
|
|
(14,627 |
) |
|
|
45,713 |
|
See accompanying notes to financial statements
64
(amounts in thousands)
|
|
|
Fiscal Years Ended August 31, |
|
|||||||||
|
|
|
2020 |
|
|
2019 |
|
|
2018 |
|
|||
|
Cash flows from operating activities |
|
|
|
|
|
|
|
|
|
|
|
|
|
Net income (loss) |
|
$ |
(17,358 |
) |
|
$ |
1,456 |
|
|
$ |
1,742 |
|
|
Adjustments to reconcile net income (loss) to net cash provided by (used in) operating activities |
|
|
|
|
|
|
|
|
|
|
|
|
|
Depreciation and amortization |
|
|
3,160 |
|
|
|
2,165 |
|
|
|
1,675 |
|
|
Stock-based compensation |
|
|
860 |
|
|
|
590 |
|
|
|
105 |
|
|
Loss on disposal of property and equipment |
|
|
47 |
|
|
|
— |
|
|
|
234 |
|
|
Deferred income taxes |
|
|
1,121 |
|
|
|
(61 |
) |
|
|
(60 |
) |
|
Noncash lease expense |
|
|
2,326 |
|
|
|
— |
|
|
|
— |
|
|
Inventory write-downs |
|
|
50 |
|
|
|
— |
|
|
|
— |
|
|
Changes in operating assets and liabilities: |
|
|
|
|
|
|
|
|
|
|
|
|
|
Accounts receivable |
|
|
629 |
|
|
|
(427 |
) |
|
|
170 |
|
|
Inventories |
|
|
122 |
|
|
|
(155 |
) |
|
|
(115 |
) |
|
Due from affiliate |
|
|
214 |
|
|
|
(222 |
) |
|
|
3 |
|
|
Prepaid expenses and other current assets |
|
|
(1,320 |
) |
|
|
(1,082 |
) |
|
|
66 |
|
|
Deposits and other assets |
|
|
(548 |
) |
|
|
(816 |
) |
|
|
53 |
|
|
Accounts payable |
|
|
(614 |
) |
|
|
1,646 |
|
|
|
250 |
|
|
Accrued expenses and other current liabilities |
|
|
(1,024 |
) |
|
|
1,135 |
|
|
|
311 |
|
|
Sales tax payable |
|
|
(358 |
) |
|
|
152 |
|
|
|
60 |
|
|
Salary and wages payable |
|
|
438 |
|
|
|
531 |
|
|
|
124 |
|
|
Due to affiliate |
|
|
(35 |
) |
|
|
(38 |
) |
|
|
28 |
|
|
Deferred rent and tenant allowances |
|
|
— |
|
|
|
1,119 |
|
|
|
597 |
|
|
Operating lease liabilities |
|
|
(714 |
) |
|
|
— |
|
|
|
— |
|
|
Net cash (used in) provided by operating activities |
|
|
(13,004 |
) |
|
|
5,993 |
|
|
|
5,243 |
|
|
Cash flows from investing activities |
|
|
|
|
|
|
|
|
|
|
|
|
|
Redemption of short-term investment |
|
|
— |
|
|
|
— |
|
|
|
12 |
|
|
Payments for property and equipment |
|
|
(14,400 |
) |
|
|
(10,726 |
) |
|
|
(7,089 |
) |
|
Proceeds from disposal of property and equipment |
|
|
— |
|
|
|
— |
|
|
|
502 |
|
|
Payments for initial direct costs |
|
|
(319 |
) |
|
|
— |
|
|
|
— |
|
|
Payments for purchases of liquor licenses |
|
|
(58 |
) |
|
|
(529 |
) |
|
|
(15 |
) |
|
Net cash used in investing activities |
|
|
(14,777 |
) |
|
|
(11,255 |
) |
|
|
(6,590 |
) |
|
Cash flows from financing activities |
|
|
|
|
|
|
|
|
|
|
|
|
|
Cash received for additional capital investment from affiliate |
|
|
— |
|
|
|
— |
|
|
|
5,000 |
|
|
Proceeds from the initial public offering, net of discounts and commissions |
|
|
— |
|
|
|
43,422 |
|
|
|
— |
|
|
Payments of costs related to the initial public offering |
|
|
— |
|
|
|
(4,792 |
) |
|
|
— |
|
|
Proceeds from borrowings of debt |
|
|
— |
|
|
|
3,921 |
|
|
|
— |
|
|
Repayment on debt |
|
|
— |
|
|
|
(3,921 |
) |
|
|
— |
|
|
Proceeds from PPP loan |
|
|
5,983 |
|
|
|
— |
|
|
|
— |
|
|
Repayment of PPP loan |
|
|
(5,983 |
) |
|
|
— |
|
|
|
— |
|
|
Repayment of principal on finance leases |
|
|
(1,034 |
) |
|
|
(1,035 |
) |
|
|
(824 |
) |
|
Proceeds from stock option exercises |
|
|
30 |
|
|
|
— |
|
|
|
— |
|
|
Net cash (used in) provided by financing activities |
|
|
(1,004 |
) |
|
|
37,595 |
|
|
|
4,176 |
|
|
Increase (decrease) in cash and cash equivalents |
|
|
(28,785 |
) |
|
|
32,333 |
|
|
|
2,829 |
|
|
Cash and cash equivalents, beginning of year |
|
|
38,044 |
|
|
|
5,711 |
|
|
|
2,882 |
|
|
Cash and cash equivalents, end of year |
|
$ |
9,259 |
|
|
$ |
38,044 |
|
|
$ |
5,711 |
|
|
Supplemental disclosures of cash flow information |
|
|
|
|
|
|
|
|
|
|
|
|
|
Cash paid for interest |
|
$ |
8 |
|
|
$ |
189 |
|
|
$ |
116 |
|
|
Cash paid for income taxes (net of refunds) |
|
$ |
132 |
|
|
$ |
56 |
|
|
$ |
4 |
|
|
Noncash investing activities |
|
|
|
|
|
|
|
|
|
|
|
|
|
Acquisition of finance leases |
|
$ |
101 |
|
|
$ |
— |
|
|
$ |
1,733 |
|
|
Amounts unpaid for purchases of property and equipment |
|
$ |
2,219 |
|
|
$ |
142 |
|
|
$ |
57 |
|
See accompanying notes to financial statements
65
Note 1—Organization and Description of Business
Kura Sushi USA, Inc. is a technology-enabled Japanese restaurant concept that provides guests with a distinctive dining experience by serving authentic Japanese cuisine through an engaging revolving sushi service model, which the Company refers to as the “Kura Experience”. Kura Sushi encourages healthy lifestyles by serving freshly prepared Japanese cuisine using high-quality ingredients that are free from artificial seasonings, sweeteners, colorings, and preservatives. Kura Sushi aims to make quality Japanese cuisine accessible to its guests across the United States through affordable prices and an inviting atmosphere.
Initial Public Offering
On August 5, 2019, the Company completed the initial public offering of its Class A common stock at a public offering price of $14.00 per share. The Company issued 3,335,000 shares, including 435,000 shares sold to the underwriters pursuant to their over-allotment option. After underwriter discounts and commissions and offering expenses, net proceeds from the offering were approximately $39 million.
Effects of COVID-19
In March 2020, the World Health Organization declared the novel strain of coronavirus COVID-19 a global pandemic. This contagious virus, which has continued to spread, has adversely affected workforces, customers, economies and financial markets globally. In response to this outbreak, many state and local authorities mandated the temporary closure of non-essential businesses and dine-in restaurant activity. COVID-19 and the government measures taken to control it have caused a significant disruption to the Company’s business operation. On March 18, 2020, the Company announced the temporary closure of all of its 25 restaurants located across five states at that time and has since furloughed certain of its employees. As restrictions lifted, the Company was able to reopen certain restaurants at reduced indoor dining capacities. The Company has also started offering outdoor dining at certain restaurants. As of the filing date of this Annual Report on Form 10-K, the Company has 28 restaurants with 12 restaurants operating with indoor dining at reduced capacities of 25% to 75% and 15 restaurants operating with outdoor dining or takeout only, depending on local requirements, and one restaurant temporarily closed.
To support the Company’s employees during this challenging time, the Company had maintained payroll for all employees through April 5, 2020 and all kitchen employees through May 9, 2020. The Company continued to maintain payroll for store managers and key kitchen staff during the time when their respective restaurants were temporarily closed. The Company also continued to pay the employee’s portion of health insurance for all furloughed employees through July 31, 2020. As the restaurants reopened, the Company was able to bring back certain furloughed employees.
In response to the ongoing COVID-19 pandemic, the Company has prioritized taking steps to protect the health and safety of its employees and customers. Currently, due to local government restrictions, the California restaurants are not utilizing the revolving conveyor belt . All food is ordered from the tableside touchscreen and delivered to the customers’ tables by the restaurant employees for indoor dining. For outdoor dining, food is ordered and delivered by the restaurant employees. The Company has increased cleaning and sanitizing protocols of its restaurants and has implemented additional training and operational manuals for its restaurant employees, as well as increased handwashing procedures. The Company also provides each restaurant employee with face masks and gloves, and requires each employee to pass a health screening process, which includes a temperature check, before the start of each shift.
The temporary restaurant closures and the reduced capacities at the reopened restaurants have caused a substantial decline in the Company’s sales in the most recently completed fiscal year. In light of the challenges posed by the COVID-19 pandemic, the Company is focused on maximizing its in-restaurant dining capacity as permitted by the jurisdictions where it operates, continuing to provide a safe environment for its employees and customers, maintaining its operational efficiencies as much as possible and preserving its liquidity. In line with the Company’s long-term growth strategy, it expects to continue to open new restaurants at locations where it believes
66
the restaurants have the potential to achieve profitability. The future sales levels of the Company’s restaurants and its ability to implement it growth strategy, however, remain highly uncertain, as the full impact and duration of the COVID-19 pandemic continues to evolve as of the date of this Annual Report on Form 10-K.
Recent Events Concerning the Company’s Financial Position
On April 10, 2020, the Company and Kura Sushi, Inc. (“Kura Japan”), a majority stockholder, entered into a Revolving Credit Agreement establishing a $35 million revolving credit line with a termination date of April 10, 2025 , to provide the Company with additional liquidity as may be necessary. On September 2, 2020, the Company and Kura Japan entered into a First Amendment to Revolving Credit Agreement (the “First Amendment”) to (i) increase the maximum credit amount under the credit line from $20 million to $35 million, (ii) extend the maturity date for each advance from 12 months to 60 months from the date of disbursement and (iii) extend the last day of the period of availability for the advances under the credit line from March 31, 2024 to April 10, 2025. In connection with the First Amendment, the Revolving Credit Note under the Revolving Credit Agreement was also amended by incorporating the same amendments as provided under the First Amendment. See “Note 5. Related Party Transactions” and “Note 7. Debt”.
On April 14, 2020, the Company entered into a Promissory Note with Bank of the West, which provided for a loan in the amount of $6.0 million (the “PPP Loan”) pursuant to the Paycheck Protection Program under the Coronavirus Aid, Relief, and Economic Security Act (the “CARES Act”) signed into law on March 27, 2020. On April 29, 2020, the Company returned the proceeds received from the PPP Loan.
Under the provisions of the CARES Act, the Company is eligible for a refundable employee retention credit subject to certain criteria. In connection with the CARES Act, the Company adopted a policy to recognize the employee retention credit when earned and to offset the credit against the related expenditure. Accordingly, the Company recorded a $1.8 million employee retention credit during the twelve months ended August 31, 2020, which is included in Labor and related costs in the statements of operations.
The Company has received rent concessions from its landlords for certain of its restaurants in the form of rent abatements and rent deferrals which were immaterial for the twelve months ended August 31, 2020. The Company continues to have discussions with its landlords regarding potential future rent concessions.
Due to the impact of COVID-19, the Company assessed its long-lived assets for potential impairment, which resulted in no impairment charges recorded as of August 31, 2020. The Company also assessed the realizability of its deferred tax assets and recorded a valuation allowance of $5.6 million during the twelve months ended August 31, 2020. See “Note 10. Income Taxes”.
Note 2—Basis of Presentation and Summary of Significant Accounting Policies
Basis of Presentation
The accompanying financial statements have been prepared in accordance with generally accepted accounting principles in the United States (“GAAP”). The Company’s fiscal year begins on September 1 and ends on August 31 and references made to “fiscal year 2020”, “fiscal year 2019” and “fiscal year 2018” refer to the Company’s fiscal years ended August 31, 2020, August 31, 2019 and August 31, 2018, respectively.
Use of Estimates
The preparation of financial statements in conformity with GAAP requires management to make estimates and assumptions that affect the reported amounts of assets and liabilities, disclosure of contingent assets and liabilities at the date of the financial statements and the reported amounts of revenues and expenses during the reporting periods presented.
67
Significant items subject to such estimates include asset retirement obligations, stock-based compensation, the useful lives of assets, the assessment of the recoverability of long-lived assets, and income taxes. The Company evaluates its estimates and assumptions on an ongoing basis using historical experience and other factors, and adjusts those estimates and assumptions when facts and circumstances dictate. Actual results could differ materially from those estimates and assumptions.
Concentration of Credit Risk
Financial instruments that potentially subject the Company to concentration of credit risk consist principally of cash and cash equivalents. The Company maintains its cash and cash equivalents with financial institutions and, at times, the balance may exceed the Federal Deposit Insurance Corporation federally insured limits. The Company has never experienced any losses related to these balances.
Concentration of Significant Suppliers
The Company relies on third parties for specified food products and supplies. In instances where these parties fail to perform their obligations, the Company may be unable to find alternative suppliers. The Company is subject to supplier concentration risk as JFC International Inc., a subsidiary of Kikkoman Corporation and the Company’s largest supplier, accounted for approximately 59%, 55%, and 47% of total food and beverage costs for fiscal years 2020, 2019, and 2018, respectively. The Company also relies on Wismettac Asian Foods, Inc. (formerly Nishimoto Trading Co., Ltd.), a subsidiary of Nishimoto Co., Ltd., which provided food products and supplies equaling approximately 27% of total food and beverage cost for fiscal year 2020 and 28% of total food and beverage costs for fiscal years 2019 and 2018.
Segment Information
Management has determined that the Company has one operating segment and therefore one reportable segment. The Company’s chief operating decision maker, who is its Chief Executive Officer, reviews financial performance and allocates resources. All of the Company’s sales are derived in the United States of America.
Cash and Cash Equivalents
Cash and cash equivalents consist of primarily cash on hand, deposits with banks, and term deposits with maturities of three months or less. As of August 31, 2020 and August 31, 2019, cash equivalents consist of money market funds and time deposits of approximately $8.8 million and $37.0 million, respectively. Due to the short-term maturities and their relatively low interest rates, the carrying value of the money market accounts approximates their fair value. Cash and cash equivalents are maintained at financial institutions with strong credit ratings. The Company considers all highly liquid investments with an original maturity at the date of purchase of three months or less to be cash equivalents.
Accounts Receivable
Accounts receivable consist primarily of receivables from landlords for tenant allowances and credit card receivables. The Company does not extend credit to guests and thus does not have credit risk from guests. Accounts receivable balances are stated at the amounts management expects to collect from balances outstanding at fiscal year-end, accordingly no allowance for doubtful accounts is recorded as of August 31, 2020 and August 31, 2019.
Inventories
Inventories consist of food and beverages, and are stated at the lower of cost or net realizable value with cost determined on a first-in, first-out basis.
68
Property and equipment consists of computer equipment, vehicles, software, furniture and fixtures, leasehold improvements and leased assets. Property and equipment are carried at cost, less accumulated depreciation and amortization. Depreciation and amortization on property and equipment is calculated using the straight-line method over the estimated useful lives of the respective assets, ranging from three to 20 years. Leasehold improvements are amortized on a straight-line basis over the shorter of the remaining lease term or estimated life of the improvements. The following table represents the various types of property and equipment and their respective useful lives:
|
Property and Equipment |
|
Useful Life |
|
Computer equipment |
|
3 – 5 years |
|
Vehicles |
|
5 years |
|
Software |
|
5 years |
|
Furniture and fixtures |
|
10 years |
|
Leasehold improvements |
|
Shorter of useful life or remaining lease term |
|
Lease assets |
|
Fixed lease term |
Long-lived assets to be held and used are reviewed for impairment whenever events or changes in circumstances indicate that the related carrying amount may be impaired. If an impairment loss has occurred, a charge is recorded to reduce the carrying amount of the asset to its estimated fair value.
Liquor Licenses
Liquor licenses are deemed to have indefinite useful lives and are subject to annual impairment testing. Liquor licenses are included in deposits and other assets in the accompanying balance sheets.
Asset Retirement Obligations
Asset retirement obligations (“ARO”) represents the estimated present value of future expenses the Company expects to incur at the end of a lease to restore the location to its original condition. The ARO is recorded as a liability at its estimated present value at inception with an offsetting increase in the carrying amount of the related property and equipment in the accompanying balance sheet. Periodic accretion of the discount of the estimated liability is recorded as an interest expense in the accompanying statements of operations. Asset retirement obligations are amortized on a straight-line basis over the shorter of the remaining lease term or estimated life of the leasehold improvements. The Company’s ARO liability is approximately $0.3 million and $0.2 million as of August 31, 2020 and August 31, 2019 and is included in other liabilities in the accompanying balance sheets.
Impairment of Long-lived Assets
The Company assesses potential impairments of its long-lived assets, which includes property and equipment and operating lease right-of-use assets, in accordance with the provisions of Financial Accounting Standards Board (“FASB”) Accounting Standards Codification (“ASC”) 360—Property, Plant and Equipment. An impairment test is performed on an annual basis or whenever events or changes in circumstances indicate that the carrying value of the assets may not be recoverable. In determining the recoverability of the asset value, an analysis is performed at the individual restaurant level. Assets are grouped at the individual restaurant-level for purposes of the impairment assessment because a restaurant represents the lowest level for which identifiable cash flows are largely independent of the cash flows of other assets and liabilities. Recoverability of an asset group is measured by a comparison of the carrying amount of an asset group to its estimated forecasted restaurant cash flows expected to be generated by the asset group. Factors considered in estimating future cash flows include, but are not limited to: significant underperformance relative to expected historical or projected future operating results; significant changes in the manner of use of the acquired assets; and significant negative industry or economic trends. If the carrying amount of the asset group exceeds its estimated undiscounted future cash flows, an impairment charge is recognized as the amount by which the carrying amount of the asset exceeds the fair value of the asset. During the fiscal year ended August 31, 2018, one of the Company’s restaurants exited a lease prior to the end of the lease term. As a result, the property and equipment held at that location were deemed to be not recoverable, which was determined by comparing the net carrying value of the assets to the undiscounted net cash flows from the eventual disposition of
69
the assets. Given the property and equipment at the restaurant will no longer be in use, the net carrying value of the assets were deemed to have zero value. This impairment was offset by a reimbursement from the landlord of $0.5 million for the termination of the lease, hence resulting in a net impairment charge of $0.2 million, which is included in operating income. During the fiscal years ended August 31, 2020 and August 31, 2019, there were no impairment charges recognized.
Income Taxes
The provision for income taxes, income taxes payable, and deferred income taxes are determined using the asset and liability method. Deferred income tax assets and liabilities are determined based on temporary differences between the financial carrying amounts and tax bases of assets and liabilities that will result in taxable or deductible amounts in the future. Such deferred income tax asset and liability computations are based on enacted tax laws and rates applicable to periods in which the differences are expected to reverse. The Company establishes a valuation allowance to the extent that it is more likely than not that deferred tax assets will not be recoverable against future taxable income. Income tax expense or benefit is the income tax payable or refundable for the period, plus or minus the change during the period to deferred income tax assets and liabilities.
The Company regularly evaluates the likelihood of realizing the benefit for income tax positions it has taken in federal and state filings by considering all facts, circumstances, and information available. For those benefits that the Company believes it is more likely than not will be sustained, it recognizes the largest amount it believes is cumulatively greater than 50% likely to be realized.
Revenue Recognition
Revenue from sales is recognized when food and beverages are sold to customers. Sales are presented net of discounts and sales taxes collected from customers.
Sales Taxes
Sales taxes are imposed by state, county, and city governmental authorities, collected from customers and remitted to the appropriate governmental agency. The Company’s policy is to record the sales taxes collected as a liability on the books and then remove the liability when the sales tax is remitted. There is no impact on the statements of operations as restaurant sales are recorded net of sales tax.
Operating and Finance Leases
At inception of a contract, the Company assesses whether the contract is a lease based on whether the contract conveys the right to control the use of an identified asset for a period of time in exchange for consideration. Lease classification, measurement, and recognition are determined at lease commencement, which is the date the underlying asset is available for use by the Company. The accounting classification of a lease is based on whether the arrangement is effectively a financed purchase of the underlying asset (finance lease) or not (operating lease). The Company has operating and finance leases for its corporate office, restaurant locations, office equipment, kitchen equipment and automobiles. The leases have remaining lease terms of less than 1 year to 20 years, some of which include options to extend the leases. For leases with renewal periods at the Company’s option, the Company determines the expected lease period based on whether the renewal of any options is reasonably assured at the inception of the lease.
Operating leases are accounted for on the balance sheet with the right-of-use (“ROU”) assets and lease liabilities recognized in “Operating lease right-of-use assets”, “Operating lease liabilities - current" and "Operating lease liabilities - noncurrent" on the balance sheet, respectively. Finance leases are accounted for on the balance sheet with ROU assets and lease liabilities recognized in "Property and equipment - net”, “Finance lease - current" and "Finance lease - noncurrent" on the balance sheet, respectively.
70
Lease assets and liabilities are recognized at the lease commencement date. All lease liabilities are measured at the present value of the lease payments not yet paid. To determine the present value of lease payments not yet paid, the Company estimates incremental borrowing rates corresponding to the maturities of the leases. As the Company has no outstanding debt, it estimates this rate based on prevailing financial market conditions, comparable company and credit analysis, and management judgment. ROU assets, for both operating and finance leases, are initially measured based on the lease liability, adjusted for initial direct costs, prepaid or deferred rent, and lease incentives. The operating lease ROU assets are subsequently measured at the carrying amount of the lease liability adjusted for initial direct costs, prepaid or accrued lease payments, and lease incentives. Depreciation of the finance lease ROU assets are subsequently calculated using the straight-line method over the shorter of the estimated useful lives or the expected lease terms and recorded in "Depreciation and amortization expense" on the statement of operations.
Related to the adoption of Topic 842, the Company’s policy elections were as follows:
|
Separation of lease and non-lease components |
|
The Company has elected a policy to account for lease and non-lease components as a single component for its entire population of operating lease assets. |
|
Short-term policy |
|
The Company has elected the short-term lease recognition exemption for all applicable classes of underlying assets. Short-term disclosures include only those leases with a term greater than one month and 12 months or less, and expense is recognized on a straight-line basis over the lease term. Leases with an initial term of 12 months or less, that do not include an option to purchase the underlying asset that the Company is reasonably certain to exercise, are not recorded on the balance sheet. |
The Company recognizes expense for these leases on a straight-line basis over the lease term. In addition to the fixed minimum payments required under the lease arrangements, certain leases require variable lease payments, such as common area maintenance, insurance and real estate taxes, which are recognized when the associated activity occurs. Additionally, contingent rental payments based on sales thresholds for certain of its restaurants are accrued based on estimated sales.
Other Costs
Other costs in restaurant operating costs in the accompanying statements of operations include utilities, repairs and maintenance, credit card fees, royalty payments, stock-based compensation for restaurant-level employees, and other restaurant-level expenses. The Company incurred approximately $6.7 million, $7.1 million and $5.4 million in other costs for the fiscal years ended August 31, 2020, August 31, 2019 and August 31, 2018, respectively.
Advertising Costs
Advertising costs are expensed as incurred and are included in other costs in the accompanying statements of operations. The Company incurred approximately $0.3 million, $0.4 million and $0.3 million in advertising expenses for the fiscal years ended August 31, 2020, August 31, 2019 and August 31, 2018, respectively.
71
The Company defines fair value as the exchange price that would be received from the sale of an asset or paid to transfer a liability in the principal or most advantageous market for the asset or liability in an orderly transaction between market participants on the measurement date. Valuation techniques used to measure fair value must maximize the use of observable inputs and minimize the use of unobservable inputs. The fair value measurement accounting guidance creates a fair value hierarchy to prioritize the inputs used to measure fair value into three categories. A financial instrument’s level within the fair value hierarchy is based on the lowest level of input significant to the fair value measurement, where Level 1 is the highest and Level 3 is the lowest. The three levels are defined as follows:
Level 1 – Observable inputs that reflect unadjusted quoted prices for identical assets or liabilities in active markets. Active markets are those in which transactions for the asset or liability occur with sufficient frequency and volume to provide pricing information on an ongoing basis.
Level 2 – Observable inputs other than Level 1 prices, such as unadjusted quoted prices for similar assets or liabilities in active markets, unadjusted quoted prices for identical or similar assets or liabilities in markets that are not active, or other inputs that are observable or can be corroborated by observable market data for substantially the full term of the assets or liabilities; and
Level 3 – Unobservable inputs that are supported by little or no market activity and that are significant to the fair value of the assets or liabilities. These inputs are based on the Company’s own assumptions used to measure assets and liabilities at fair value and require significant management judgment or estimation.
The Company’s financial statements include cash and cash equivalents, accounts receivable, accounts payable, accrued expenses and other current liabilities, and salaries and wages payable for which the carrying amounts approximate fair value due to their short-term maturity. The fair value of payments due to or from Kura Japan is not determinable due to its related-party nature.
Stock-based Compensation
Stock-based compensation consists of stock options issued to employees and non-employees. The Company measures and recognizes stock-based compensation for the estimated fair value of stock options based on the grant date fair value of the award. The fair value of stock options is estimated using the Black-Scholes option-pricing model and is impacted by the fair value of the Company’s common stock, as well as changes in assumptions regarding a number of subjective variables. These variables include, but are not limited to, the expected common stock price volatility over the term of the stock option awards, the expected term of the awards, risk-free interest rates and the expected dividend yield.
The Company granted 157,539, 22,000, and 419,091 stock options for the fiscal years ended August 31, 2020, August 31, 2019 and August 31, 2018, respectively. For stock options that are based on a service requirement, the cost is recognized on a straight-line basis over the requisite service period, which is typically the vesting period. Stock options granted in fiscal year 2020 have vesting periods ranging from 9 months to 46 months. The majority of stock options granted in fiscal 2019 and 2018 have a vesting period of approximately 45 months. The Company adopted the Accounting Standards Update (“ASU”) No. 2016-09, Compensation—Stock Compensation (Topic 718): Improvements to Employee Share-Based Payment Accounting in fiscal year 2018 and accounts for forfeitures as they occur.
Comprehensive Income (Loss)
Comprehensive income (loss) is defined as the change in equity of a business enterprise during a period from transactions and other events and circumstances from non-owner sources. Comprehensive income (loss) is the same as net income (loss) for all periods presented. Therefore, a separate statement of comprehensive income (loss) is not included in the accompanying financial statements.
72
Earnings per share is calculated by dividing net income (loss) by the weighted average shares outstanding during the period, without consideration of common stock equivalents. Diluted earnings per share assumes the conversion, exercise or issuance of all potential dilutive common stock equivalents outstanding for the period. For the purposes of this calculation, options are considered to be common stock equivalents and are only included in the calculation of diluted earnings per share when their effect is dilutive. Diluted earnings per share is calculated by adjusting weighted average shares outstanding for the dilutive effect of common stock equivalents outstanding for the period, determined using the treasury-stock method.
Recently Adopted Accounting Pronouncements
In April 2020, the staff of the Financial Accounting Standards Board (FASB) issued a question-and-answer document that stated that entities may elect to account for lease concessions related to the effects of the COVID-19 pandemic as though the rights and obligations for those concessions existed as of the commencement of the contract rather than as a lease modification. Lessees may make the election for any lessor-provided lease concession related to the impact of the COVID-19 pandemic as long as the concession does not result in a substantial increase in the rights of the lessor or in the obligations of the lessee. The Company has made such election. The Company has received immaterial rent concessions that did not result in an extension of lease term. As such, this election did not have a material impact on the balance sheets, the statements of operations, statements of stockholders’ equity or statements of cash flows.
On September 1, 2019, the Company adopted ASU 2016-02, “Leases (Topic 842)” (“Topic 842” or “ASC 842”), along with related clarifications and improvements. This pronouncement requires lessees to recognize a liability for lease obligations, which represents the discounted obligation to make future lease payments, and a corresponding right-of-use asset on the balance sheet. The guidance requires disclosure of key information about leasing arrangements that is intended to give financial statement users the ability to assess the amount, timing, and potential uncertainty of cash flows related to leases. The Company elected the optional transition method to apply the standard as of the effective date and therefore, prior period amounts have not been adjusted and continue to be reported in accordance with its historical accounting under previous lease guidance, ASC Topic 840: “Leases (Topic 840)”. The adoption of Topic 842 had a material impact on the balance sheet and an immaterial impact on the statement of operations, statement of stockholders’ equity and statement of cash flows.
The practical expedients were as follows:
|
Practical expedients |
|
The Company has not reassessed whether any expired or existing contracts are, or contain, leases. |
|
|
|
The Company has not reassessed the lease classification for any expired or existing leases. |
|
|
|
The Company has not reassessed initial direct costs for any expired or existing leases. |
|
Hindsight Practical Expedient |
|
The Company has elected the hindsight practical expedient, which permits the use of hindsight when determining lease term and impairment of operating lease assets. |
73
The impact on the balance sheet is as follows:
|
|
|
August 31, 2019 |
|
|
Adjustments Due to the Adoption of Topic 842 |
|
|
September 1, 2019 |
|
|||
|
|
|
(amounts in thousands) |
|
|||||||||
|
Assets |
|
|
|
|
|
|
|
|
|
|
|
|
|
Current assets: |
|
|
|
|
|
|
|
|
|
|
|
|
|
Cash and cash equivalents |
|
$ |
38,044 |
|
|
$ |
— |
|
|
$ |
38,044 |
|
|
Accounts receivable |
|
|
948 |
|
|
|
— |
|
|
|
948 |
|
|
Inventories |
|
|
539 |
|
|
|
— |
|
|
|
539 |
|
|
Due from affiliate |
|
|
226 |
|
|
|
— |
|
|
|
226 |
|
|
Prepaid expenses and other current assets(1) |
|
|
1,744 |
|
|
|
(54 |
) |
|
|
1,690 |
|
|
Total current assets |
|
|
41,501 |
|
|
|
(54 |
) |
|
|
41,447 |
|
|
Non-current assets: |
|
|
|
|
|
|
|
|
|
|
|
|
|
Property and equipment - net |
|
|
31,917 |
|
|
|
|
|
|
|
31,917 |
|
|
Operating lease right-of-use assets |
|
|
— |
|
|
|
35,935 |
|
|
|
35,935 |
|
|
Deposits and other assets(1) |
|
|
1,865 |
|
|
|
(530 |
) |
|
|
1,335 |
|
|
Deferred tax assets |
|
|
1,127 |
|
|
|
— |
|
|
|
1,127 |
|
|
Total assets |
|
$ |
76,410 |
|
|
$ |
35,351 |
|
|
$ |
111,761 |
|
|
Liabilities and stockholders' equity |
|
|
|
|
|
|
|
|
|
|
|
|
|
Current liabilities: |
|
|
|
|
|
|
|
|
|
|
|
|
|
Accounts payable |
|
$ |
3,684 |
|
|
$ |
— |
|
|
$ |
3,684 |
|
|
Accrued expenses and other current liabilities(1) |
|
|
1,635 |
|
|
|
(97 |
) |
|
|
1,538 |
|
|
Salaries and wages payable |
|
|
1,348 |
|
|
|
— |
|
|
|
1,348 |
|
|
Finance leases - current |
|
|
994 |
|
|
|
— |
|
|
|
994 |
|
|
Operating lease liabilities - current |
|
|
— |
|
|
|
3,606 |
|
|
|
3,606 |
|
|
Due to affiliate |
|
|
83 |
|
|
|
— |
|
|
|
83 |
|
|
Sales tax payable |
|
|
547 |
|
|
|
— |
|
|
|
547 |
|
|
Total current liabilities |
|
|
8,291 |
|
|
|
3,509 |
|
|
|
11,800 |
|
|
Non-current liabilities: |
|
|
|
|
|
|
|
|
|
|
|
|
|
Finance leases - non-current |
|
|
2,424 |
|
|
|
— |
|
|
|
2,424 |
|
|
Operating lease liabilities - non-current |
|
|
— |
|
|
|
35,119 |
|
|
|
35,119 |
|
|
Deferred rent(1) |
|
|
2,188 |
|
|
|
(2,188 |
) |
|
|
— |
|
|
Tenant allowances(1) |
|
|
1,089 |
|
|
|
(1,089 |
) |
|
|
— |
|
|
Other liabilities |
|
|
237 |
|
|
|
— |
|
|
|
237 |
|
|
Total liabilities |
|
|
14,229 |
|
|
|
35,351 |
|
|
|
49,580 |
|
|
Stockholders' equity: |
|
|
|
|
|
|
|
|
|
|
|
|
|
Preferred stock |
|
|
— |
|
|
|
— |
|
|
|
— |
|
|
Common stock - Class A |
|
|
7 |
|
|
|
— |
|
|
|
7 |
|
|
Common stock - Class B |
|
|
1 |
|
|
|
— |
|
|
|
1 |
|
|
Additional paid-in capital |
|
|
59,442 |
|
|
|
— |
|
|
|
59,442 |
|
|
Retained earnings |
|
|
2,731 |
|
|
|
— |
|
|
|
2,731 |
|
|
Total stockholders' equity |
|
|
62,181 |
|
|
|
— |
|
|
|
62,181 |
|
|
Total liabilities and stockholders' equity |
|
$ |
76,410 |
|
|
$ |
35,351 |
|
|
$ |
111,761 |
|
|
(1) |
Adjustment to reclassify prepaid rent, initial direct costs, deferred rent and tenant allowance to right-of-use assets for operating leases upon the adoption of Topic 842. |
Recently Issued Accounting Pronouncements
In December 2019, the FASB issued ASU 2019-12, “Income Taxes (Topic 740): Simplifying the Accounting for Income Taxes,” which is intended to simplify various aspects related to accounting for income taxes. The pronouncement is effective for fiscal years, and for interim periods within those fiscal years, beginning after December 15, 2020, with early adoption permitted. ASU 2019-12 is effective for the Company beginning in fiscal year 2022. The Company is currently in the process of evaluating the effects of this pronouncement on its financial statements.
74
Note 3—Balance Sheet Components
Accounts Receivable
Accounts receivable as of August 31, 2020 and August 31, 2019 consists of the following:
|
|
|
As of August 31, |
|
|||||
|
|
|
2020 |
|
|
2019 |
|
||
|
|
|
(amounts in thousands) |
|
|||||
|
Lease receivable |
|
$ |
1,811 |
|
|
$ |
215 |
|
|
Credit card receivable |
|
|
281 |
|
|
|
733 |
|
|
Other receivable |
|
|
38 |
|
|
|
— |
|
|
Total accounts receivable |
|
$ |
2,130 |
|
|
$ |
948 |
|
Inventories
Inventories as of August 31, 2020 and August 31, 2019 consists of the following:
|
|
|
As of August 31, |
|
|||||
|
|
|
2020 |
|
|
2019 |
|
||
|
|
|
(amounts in thousands) |
|
|||||
|
Food |
|
$ |
320 |
|
|
$ |
491 |
|
|
Liquor and beverages |
|
|
47 |
|
|
|
48 |
|
|
Total inventories |
|
$ |
367 |
|
|
$ |
539 |
|
Prepaid expenses and other current assets
Prepaid expenses and other current assets as of August 31, 2020 and August 31, 2019 consists of the following:
|
|
|
As of August 31, |
|
|||||
|
|
|
2020 |
|
|
2019 |
|
||
|
|
|
(amounts in thousands) |
|
|||||
|
Prepaid expenses |
|
$ |
885 |
|
|
$ |
1,293 |
|
|
Other current assets |
|
|
375 |
|
|
|
451 |
|
|
Employee retention credit |
|
|
1,750 |
|
|
|
— |
|
|
Total prepaid expenses and other current assets |
|
$ |
3,010 |
|
|
$ |
1,744 |
|
75
Property and equipment, net as of August 31, 2020 and August 31, 2019 consists of the following:
|
|
|
As of August 31, |
|
|||||
|
|
|
2020 |
|
|
2019 |
|
||
|
|
|
(amounts in thousands) |
|
|||||
|
Leasehold improvements |
|
$ |
30,497 |
|
|
$ |
24,926 |
|
|
Lease assets |
|
|
6,117 |
|
|
|
6,037 |
|
|
Furniture and fixtures |
|
|
7,908 |
|
|
|
5,600 |
|
|
Computer equipment |
|
|
696 |
|
|
|
599 |
|
|
Vehicles |
|
|
88 |
|
|
|
75 |
|
|
Software |
|
|
689 |
|
|
|
428 |
|
|
Construction in progress |
|
|
9,558 |
|
|
|
1,127 |
|
|
Property and equipment, gross |
|
|
55,553 |
|
|
|
38,792 |
|
|
Less: accumulated depreciation and amortization |
|
|
(10,012 |
) |
|
|
(6,875 |
) |
|
|
|
|
|
|
|
|
|
|
|
Total property and equipment - net |
|
$ |
45,541 |
|
|
$ |
31,917 |
|
Depreciation and amortization expense for property and equipment was approximately $3.2 million, $2.2 million and $1.7 million for the fiscal years ended August 31, 2020, August 31, 2019, and August 31, 2018, respectively. Amortization expense related to leased assets for the fiscal years ended August 31, 2019, and August 31, 2018 was immaterial. For amortization expense related to leased assets for the fiscal year ended August 31, 2020, please see “Note 4. Leases.”
Deposits and Other Assets
Deposits and other assets, as of August 31, 2020 and August 31, 2019 consists of the following:
|
|
|
As of August 31, |
|
|||||
|
|
|
2020 |
|
|
2019 |
|
||
|
|
|
(amounts in thousands) |
|
|||||
|
Liquor license |
|
$ |
696 |
|
|
$ |
638 |
|
|
Initial direct costs |
|
|
— |
|
|
|
530 |
|
|
Deposits |
|
|
1,245 |
|
|
|
697 |
|
|
Total deposits and other assets |
|
$ |
1,941 |
|
|
$ |
1,865 |
|
Note 4—Leases
As a result of the COVID-19 pandemic and the economic uncertainty in the restaurant industry that has resulted, the Company contacted each of its landlords to potentially negotiate accommodations to preserve cash, and for certain leases was able to modify existing payment terms, in some cases through deferral of existing payments until future periods and in some cases through a reduction in payments due during this period. The Company elected the practical expedient to not evaluate whether a deferral of rent within the current term is a lease modification. Any concessions resulting in extension of the existing lease term were accounted for as a lease modification in accordance with Topic 842, Leases. Pursuant to such guidance, the Company remeasured the modified leases using the revised terms as of the modification dates. Adjustments were made to reflect the remeasured liability with the offset to the ROU asset.
76
Lease related costs recognized in the statements of operations for the twelve months ended August 31, 2020 are as follows:
|
|
|
Fiscal Year Ended |
|
|
|
|
|
August 31, 2020 |
|
|
|
|
|
(amounts in thousands) |
|
|
|
Finance lease cost |
Classification |
|
|
|
|
Amortization of right-of-use assets |
Depreciation and amortization expense |
$ |
552 |
|
|
Interest on lease liabilities |
Interest expense |
|
120 |
|
|
Total finance lease cost |
|
$ |
672 |
|
|
|
|
|
|
|
|
|
|
|
|
|
|
|
|
Fiscal Year Ended |
|
|
|
|
|
August 31, 2020 |
|
|
|
|
|
(amounts in thousands) |
|
|
|
Operating lease cost |
Classification |
|
|
|
|
Operating lease cost |
Occupancy and related expenses, other costs and general and administrative expenses |
$ |
5,194 |
|
|
Variable lease cost |
Occupancy and related expenses, and general and administrative expenses |
|
1,059 |
|
|
Total operating lease cost |
|
$ |
6,253 |
|
Supplemental balance sheet information related to leases was as follows:
Operating Leases
|
|
|
As of August 31, 2020 |
|
|
|
|
|
(amounts in thousands) |
|
|
|
Right-of-use assets |
|
$ |
56,119 |
|
|
|
|
|
|
|
|
Lease liabilities - current |
|
$ |
5,106 |
|
|
Lease liabilities - non-current |
|
|
56,918 |
|
|
Total lease liabilities |
|
$ |
62,024 |
|
Finance Lease Assets, net
|
|
|
As of August 31, 2020 |
|
|
|
|
|
(amounts in thousands) |
|
|
|
Property and equipment |
|
$ |
6,117 |
|
|
Accumulated depreciation |
|
|
(2,178 |
) |
|
Total property and equipment - net |
|
$ |
3,939 |
|
Finance Leases Liabilities
|
|
|
As of August 31, 2020 |
|
|
|
|
|
(amounts in thousands) |
|
|
|
Finance lease - current |
|
$ |
1,004 |
|
|
Finance lease - non-current |
|
|
1,481 |
|
|
Total finance lease liabilities |
|
$ |
2,485 |
|
77
|
|
|
As of August 31, 2020 |
|
|
|
Weighted Average Remaining Lease Term (Years) |
|
|
|
|
|
Operating leases |
|
|
16.3 |
|
|
Finance leases |
|
|
2.4 |
|
|
|
|
|
|
|
|
Weighted Average Discount Rate |
|
|
|
|
|
Operating leases |
|
|
6.2 |
% |
|
Finance leases |
|
|
4.4 |
% |
Supplemental disclosures of cash flow information related to leases were as follows:
|
|
|
Fiscal Year Ended |
|
|
|
|
|
August 31, 2020 |
|
|
|
|
|
(amounts in thousands) |
|
|
|
Operating cash flows paid for operating lease liabilities |
|
$ |
4,570 |
|
|
Operating right-of-use assets obtained in exchange for new operating lease liabilities |
|
$ |
21,203 |
|
As of August 31, 2020, the Company has additional operating leases related to restaurants the Company has not yet taken possession of $13.7 million. These operating leases will commence in fiscal year 2021 with lease terms of 20 years.
Lease expense was approximately $4.7 million and $3.0 million, including contingent rent expenses of approximately $0.2 million for each of the fiscal years ended August 31, 2019 and August 31, 2018.
Maturities of lease liabilities were as follows as of August 31, 2020:
|
|
|
Operating Leases |
|
|
Finance Leases |
|
||
|
|
|
(amounts in thousands) |
|
|||||
|
2021 |
|
$ |
2,313 |
|
|
$ |
1,102 |
|
|
2022 |
|
|
5,734 |
|
|
|
1,005 |
|
|
2023 |
|
|
5,722 |
|
|
|
483 |
|
|
2024 |
|
|
5,848 |
|
|
|
17 |
|
|
2025 |
|
|
5,981 |
|
|
|
2 |
|
|
Thereafter |
|
|
72,913 |
|
|
|
— |
|
|
Total lease payments |
|
|
98,511 |
|
|
|
2,609 |
|
|
Less: imputed interest |
|
|
(36,487 |
) |
|
|
(124 |
) |
|
Present value of lease liabilities |
|
$ |
62,024 |
|
|
$ |
2,485 |
|
78
As previously disclosed in the Company’s fiscal year 2019 Annual Report on Form 10-K and under the previous lease accounting, maturities of lease liabilities were as follows as of August 31, 2019:
|
|
|
Operating Lease Payments |
|
|
Capital Lease Payments |
|
||
|
|
|
(amounts in thousands) |
|
|||||
|
2020 |
|
$ |
4,256 |
|
|
$ |
1,113 |
|
|
2021 |
|
|
4,435 |
|
|
|
1,075 |
|
|
2022 |
|
|
4,477 |
|
|
|
972 |
|
|
2023 |
|
|
4,465 |
|
|
|
476 |
|
|
2024 |
|
|
4,607 |
|
|
|
13 |
|
|
Thereafter |
|
|
58,714 |
|
|
|
— |
|
|
Total |
|
$ |
80,954 |
|
|
$ |
3,649 |
|
|
Less interest |
|
|
|
|
|
|
(231 |
) |
|
Total capital lease obligation |
|
|
|
|
|
|
3,418 |
|
|
Less current portion of capital lease obligation |
|
|
|
|
|
|
(994 |
) |
|
Non-current portion of capital lease obligation |
|
|
|
|
|
$ |
2,424 |
|
Note 5—Related Party Transactions
Kura Japan is a majority stakeholder of the Company and is incorporated and headquartered in Japan. In August 2019, in connection with the closing of the IPO, the Company entered into a Shared Services Agreement with Kura Japan, pursuant to which Kura Japan will provide the Company with certain strategic, operational and other support services, including assigning certain employees to work for the Company as expatriates to provide support to the Company’s operations, sending its employees to the Company on a short-term basis to provide support for the opening of new restaurants or renovation of existing restaurants, and providing the Company with certain supplies, parts and equipment for use in the Company’s restaurants. In addition, the Company has agreed to continue to provide Kura Japan with certain translational support services, market research analyses and other additional services mutually agreed upon. In exchange for such services, supplies, parts and equipment, the parties will pay fees to each other as set forth under the Shared Services Agreement. A right of setoff is not required, however, from time to time, either party will net settle transactions as needed. The Company reimburses Kura Japan for purchases of supplies, expatriate salaries and travel and other administrative expenses. These expenses are included in general and administrative expenses in the accompanying statements of operations. Purchases of equipment from Kura Japan are included in property and equipment in the accompanying balance sheets. Kura Japan reimburses the Company for a portion of the directors’ and officers’ (“D&O”) insurance, as well as travel and other administrative expenses, and are included in general and administrative expenses in the accompanying statements of operations.
In August 2019, the Company entered into an Amended and Restated Exclusive License Agreement (the “License Agreement”) with Kura Japan. Pursuant to the License Agreement, the Company will pay Kura Japan a royalty fee of 0.5% of the Company’s net sales in exchange for an exclusive, royalty-bearing license for use of certain of Kura Japan’s intellectual property rights, including, but not limited to, Kura Japan’s trademarks “Kura Sushi” and “Kura Revolving Sushi Bar,” and patents for a food management system and the Mr. Fresh protective dome, among other intellectual property rights necessary to continue operation of the Company’s restaurants. Royalty payments to Kura Japan are included in other costs at the restaurant-level in the accompanying statements of operations.
Kura Japan contributed $5.0 million to the Company in fiscal year 2018 and made no capital contributions in fiscal years 2020 and 2019. No additional shares were issued in exchange for the capital contribution.
79
On April 10, 2020, the Company and Kura Japan entered into a Revolving Credit Agreement establishing a $20 million revolving credit line with a termination date of March 31, 2024, to provide the Company with additional liquidity. The maturity date for amounts borrowed under the Revolving Credit Agreement is twelve months after the disbursement date, unless renewed or extended by mutual agreement of both parties for an additional twelve months.
On September 2, 2020, the Company entered into a First Amendment to Revolving Credit Agreement (the “First Amendment”) with Kura Japan. Pursuant to the terms of the First Amendment, the Revolving Credit Agreement was amended, among other things, to (i) increase the maximum credit amount under the credit line from $20 million to $35 million, (ii) extend the maturity date for each advance from 12 months to 60 months from the date of disbursement and (iii) extend the last day of the period of availability for the advances under the credit line from March 31, 2024 to April 10, 2025. In connection with the First Amendment, the Revolving Credit Note under the Revolving Credit Agreement was also amended by incorporating the same amendments as provided under the First Amendment.
Balances with Kura Japan as of August 31, 2020 and August 31, 2019 are as follows:
|
|
|
As of August 31, |
|
|||||
|
|
|
2020 |
|
|
2019 |
|
||
|
|
|
(amounts in thousands) |
|
|||||
|
Due from affiliate |
|
$ |
12 |
|
|
$ |
226 |
|
|
Due to affiliate |
|
201 |
|
|
83 |
|
||
Reimbursements by the Company to Kura Japan for fiscal years ended August 31, 2020, August 31, 2019, and August 31, 2018 are as follows:
|
|
|
Fiscal Years Ended August 31, |
|
|||||||||
|
|
|
2020 |
|
|
2019 |
|
|
2018 |
|
|||
|
|
|
(amounts in thousands) |
|
|||||||||
|
Related party transactions: |
|
|
|
|
|
|
|
|
|
|
|
|
|
Purchases of administrative supplies |
|
$ |
53 |
|
|
$ |
46 |
|
|
$ |
59 |
|
|
Expatriate salaries expense |
|
|
141 |
|
|
|
147 |
|
|
|
95 |
|
|
Royalty payments |
|
|
226 |
|
|
|
321 |
|
|
|
279 |
|
|
Travel and other administrative expenses |
|
|
73 |
|
|
|
49 |
|
|
|
78 |
|
|
Purchases of equipment |
|
|
1,129 |
|
|
|
685 |
|
|
|
650 |
|
|
Total related party transactions |
|
$ |
1,622 |
|
|
$ |
1,248 |
|
|
$ |
1,161 |
|
|
Additional investment received |
|
$ |
— |
|
|
$ |
— |
|
|
$ |
5,000 |
|
Reimbursements by Kura Japan to the Company for fiscal years ended August 31, 2020 and August 31, 2019 are $0.1 million for travel and other administrative expenses and $0.3 million for D&O insurance, travel and other administrative expenses, respectively. There were no reimbursements paid to the Company by Kura Japan for the fiscal year ended August 31, 2018.
Note 6—Incentive Compensation Plan
The Company adopted the 2018 Incentive Compensation Plan (the “Stock Incentive Plan”) in January 2018. Under the Stock Incentive Plan, the Company may grant stock options, stock appreciation rights, restricted stock, restricted stock units, as well as performance awards in the form of shares and cash. Stock options granted under the Stock Incentive Plan include both incentive stock options and non-qualified stock options. This plan authorizes 700,000 awards to be granted.
80
Activity under the Stock Incentive Plan is as follows:
|
|
|
Options Outstanding |
|
|||||||||||||
|
|
|
Number of shares underlying outstanding options |
|
|
Weighted Average Exercise Price Per Share |
|
|
Weighted Average Remaining Contractual Term (Years) |
|
|
Aggregate Intrinsic Value |
|
||||
|
|
|
|
|
|
|
|
|
|
|
|
|
|
|
(amounts in thousands) |
|
|
|
Outstanding—August 31, 2018 |
|
|
417,272 |
|
|
$ |
4.26 |
|
|
|
9.8 |
|
|
$ |
1,665 |
|
|
Options granted |
|
|
22,000 |
|
|
|
8.76 |
|
|
|
|
|
|
|
|
|
|
Options exercised |
|
|
— |
|
|
|
— |
|
|
|
|
|
|
|
|
|
|
Options canceled/forfeited |
|
|
(33,970 |
) |
|
|
4.78 |
|
|
|
|
|
|
|
|
|
|
Outstanding—August 31, 2019 |
|
|
405,302 |
|
|
$ |
4.46 |
|
|
|
8.8 |
|
|
$ |
8,353 |
|
|
Options granted |
|
|
157,539 |
|
|
|
22.08 |
|
|
|
|
|
|
|
|
|
|
Options exercised |
|
|
(7,012 |
) |
|
|
4.26 |
|
|
|
|
|
|
|
|
|
|
Options canceled/forfeited |
|
|
(24,082 |
) |
|
|
8.26 |
|
|
|
|
|
|
|
|
|
|
Outstanding—August 31, 2020 |
|
|
531,747 |
|
|
$ |
9.51 |
|
|
|
8.3 |
|
|
$ |
1,441 |
|
|
Options exercisable |
|
|
257,145 |
|
|
$ |
6.59 |
|
|
|
8.0 |
|
|
$ |
1,446 |
|
Stock-based compensation related to the stock options issued under the Stock Incentive Plan was $0.9 million, $0.6 million, and 0.1 million for the fiscal years ended August 31, 2020, August 31, 2019, and August 31, 2018 respectively, and is included in restaurant operating costs and in general and administrative expenses on the accompanying statements of operations. Before the IPO, the aggregate intrinsic value represented the difference between the exercise price of the options and the estimated fair value of the Company’s common stock as determined by its board of directors. Following the IPO, the aggregate intrinsic value represented the difference between the exercise price of the options and the closing price of the Company’s common stock on The Nasdaq Global Market as of the day prior to the date of exercise. The total intrinsic value of stock options exercised during fiscal year 2020 was $0.1 million.
The total fair value of options vested was approximately $0.6 million, $0.6 million, and $0.1 million for the fiscal years ended August 31, 2020, August 31, 2019, and August 31, 2018. As of August 31, 2020, unrecognized stock-based compensation of $2.0 million related to unvested stock options is expected to be recognized on a straight-line basis over a weighted average period of 2.54 years.
Stock-based Compensation
Stock-based compensation for restaurant-level employees is included in other costs and stock-based compensation for corporate-level employees is included in general and administrative expenses in the statements of operations. The total stock-based compensation recognized for stock options granted under the Stock Incentive Plan in the statements of operations is as follows:
|
|
|
Fiscal Years Ended August 31, |
|
|||||||||
|
|
|
2020 |
|
|
2019 |
|
|
2018 |
|
|||
|
|
|
(amounts in thousands) |
|
|||||||||
|
Restaurant-level stock-based compensation included in other costs |
|
$ |
86 |
|
|
$ |
80 |
|
|
$ |
14 |
|
|
Corporate-level stock-based compensation included in general and administrative expenses |
|
|
774 |
|
|
|
510 |
|
|
|
91 |
|
|
Total stock-based compensation |
|
$ |
860 |
|
|
$ |
590 |
|
|
$ |
105 |
|
81
For the fiscal years ended August 31, 2020, August 31, 2019 and August 31, 2018, the fair value of stock options granted to employees and non-employees was estimated on the grant date using the Black-Scholes valuation model with the following assumptions:
|
|
|
Fiscal Years Ended August 31, |
|
|||||||||
|
|
|
2020 |
|
|
2019 |
|
|
2018 |
|
|||
|
Expected term (in years) |
|
5.23 - 5.98 |
|
|
|
5.96 |
|
|
5.50 - 5.96 |
|
||
|
Expected volatility |
|
48% - 58.5% |
|
|
|
64 |
% |
|
|
64 |
% |
|
|
Risk-free interest rate |
|
0.40% - 1.67% |
|
|
|
2.77 |
% |
|
2.83% - 2.85% |
|
||
|
Dividend rate |
|
|
— |
|
|
|
— |
|
|
|
— |
|
|
Weighted average grant date fair value |
|
$ |
11.01 |
|
|
$ |
6.91 |
|
|
$ |
4.05 |
|
Expected Term - The expected term represents the period that the Company’s stock-based awards are expected to be outstanding. For option grants that are considered to be “plain vanilla,” the Company determines the expected term using the simplified method. The simplified method deems the term to be the average of the time-to-vesting and the contractual life of the options.
Expected Volatility - Since the Company does not have a trading history of its common stock, the expected volatility is derived from the average historical stock volatilities of several unrelated public companies within the Company’s industry that the Company considers to be comparable to its business over a period equivalent to the expected term of the stock option grants.
Risk-Free Interest Rate - The risk-free interest rate is based on the U.S. Treasury yield curve in effect at the time of grant for zero-coupon U.S. Treasury notes with maturities approximately equal to the option’s expected term.
Dividend Rate - The expected dividend is assumed to be zero as the Company has never paid dividends and has no current plans to do so.
Fair Value of Common Stock - Given the absence of a public trading market prior to the IPO, the Company’s board of directors considered numerous objective and subjective factors to determine the fair value of its common stock at each grant date, which was $10.75 and $6.70 for the fiscal years 2019 and 2018, respectively. These factors included, but were not limited to (i) independent contemporaneous third-party valuations of common stock; (ii) the lack of marketability of its common stock; and (iii) the likelihood of achieving a liquidity event, such as an initial public offering of the Company, given prevailing market conditions. Subsequent to the IPO, the fair value of common stock is based on the closing price of the Company’s common stock, as reported on The Nasdaq Global Market.
Note 7—Debt
On January 31, 2019, the Company secured a non-revolving line of credit with Bank of the West in the amount of up to $5 million (the “Credit Facility”) that expired on July 31, 2020. During fiscal year 2019, the Company drew down and paid off $3.9 million in aggregate from this credit facility. The Company did not draw down on this credit facility during fiscal year 2020.
On April 10, 2020, the Company and Kura Japan entered into a Revolving Credit Agreement (the “Revolving Credit Agreement”) establishing a $20 million revolving credit line with a termination date of March 31, 2024, to provide the Company with additional liquidity. The maturity date for amounts borrowed under the Revolving Credit Agreement is twelve months after the disbursement date, unless renewed or extended by mutual agreement of both parties for an additional twelve months. There are no financial covenants under the Revolving Credit Agreement with which the Company must comply.
82
On September 2, 2020, the Company and Kura Japan entered into a First Amendment to Revolving Credit Agreement (the “First Amendment”) to (i) increase the maximum credit amount under the credit line from $20 million to $35 million, (ii) extend the maturity date for each advance from 12 months to 60 months from the date of disbursement and (iii) extend the last day of the period of availability for the advances under the credit line from March 31, 2024 to April 10, 2025. In connection with the First Amendment, the Revolving Credit Note under the Revolving Credit Agreement was also amended by incorporating the same amendments as provided under the First Amendment.
As of August 31, 2020, the Company had not drawn on the available revolving credit line. For further discussion, please see “Note 1. Organization and Basis of Presentation” and “Note 5. Related Party Transactions.” Subsequent to August 31, 2020 and through the filing date of this Annual Report on Form 10-K, the Company drew down $3 million under the Revolving Credit Agreement.
On April 14, 2020, the Company entered into a Promissory Note with Bank of the West, which provided for a loan in the amount of $6.0 million (the “PPP Loan”) pursuant to the Paycheck Protection Program under the CARES Act. On April 29, 2020, the Company returned the proceeds received from the PPP Loan.
Note 8—Earnings Per Share
The net income (loss) per share attributable to common stockholder is allocated based on the contractual participation rights of the Class A common stock and Class B common stock as if the income for the year has been distributed. As the liquidation and dividend rights for Class A and Class B common stock are identical, the net income (loss) attributable to common stockholder is allocated on a proportionate basis.
The following table sets forth the computation of the Company’s basic and diluted net income (loss) per share:
|
|
|
Fiscal Years Ended August 31, |
|
|||||||||||||||||||||
|
|
|
2020 |
|
|
2019 |
|
|
2018 |
|
|||||||||||||||
|
|
|
Class A |
|
|
Class B |
|
|
Class A |
|
|
Class B |
|
|
Class A |
|
|
Class B |
|
||||||
|
|
|
|
(amounts in thousands, except per share data) |
|
||||||||||||||||||||
|
Net income (loss) attributable to common stockholders - basic |
|
$ |
(15,276 |
) |
|
$ |
(2,082 |
) |
|
$ |
1,180 |
|
|
$ |
276 |
|
|
$ |
1,394 |
|
|
$ |
348 |
|
|
Weighted average common shares outstanding - basic |
|
|
7,338 |
|
|
|
1,000 |
|
|
|
4,283 |
|
|
|
1,000 |
|
|
|
4,000 |
|
|
|
1,000 |
|
|
Net income (loss) per share attributable to common stockholders - basic |
|
$ |
(2.08 |
) |
|
$ |
(2.08 |
) |
|
$ |
0.28 |
|
|
$ |
0.28 |
|
|
$ |
0.35 |
|
|
$ |
0.35 |
|
|
Net income (loss) attributable to common stockholders - diluted |
|
$ |
(15,276 |
) |
|
$ |
(2,082 |
) |
|
$ |
1,192 |
|
|
$ |
264 |
|
|
$ |
1,394 |
|
|
$ |
348 |
|
|
Weighted average shares outstanding - basic |
|
|
7,338 |
|
|
|
1,000 |
|
|
|
4,283 |
|
|
|
1,000 |
|
|
|
4,000 |
|
|
|
1,000 |
|
|
Options to purchase common stock |
|
|
— |
|
|
|
— |
|
|
|
229 |
|
|
|
— |
|
|
|
50 |
|
|
|
— |
|
|
Weighted average shares outstanding - diluted |
|
|
7,338 |
|
|
|
1,000 |
|
|
|
4,512 |
|
|
|
1,000 |
|
|
|
4,050 |
|
|
|
1,000 |
|
|
Net income (loss) per share attributable to common stockholders - diluted |
|
$ |
(2.08 |
) |
|
$ |
(2.08 |
) |
|
$ |
0.26 |
|
|
$ |
0.26 |
|
|
$ |
0.34 |
|
|
$ |
0.35 |
|
The Company computes basic income (loss) per common share using net income and the weighted average number of common shares outstanding during the period. Diluted income (loss) per common share is computed using net income and the weighted average number of common shares and potentially dilutive common shares outstanding during the period. Potentially dilutive common shares include dilutive outstanding employee stock options.
For the twelve months ended August 31, 2020 there were 115 thousand potentially dilutive shares that were excluded from the calculation of diluted loss per share because their inclusion would have been anti-dilutive. There was no antidilutive effect from stock options during the fiscal years ending August 31, 2019 and August 31, 2018.
83
Note 9—Commitments and Contingencies
On May 31, 2019, a putative class action complaint was filed by a former employee Brandy Gomes in Los Angeles County Superior Court, alleging violations of California wage and hour laws. On July 9, 2020, plaintiff’s counsel filed a first amended class action complaint to add Jamar Spencer, another former employee, as a plaintiff to this action. In addition, the first amended class action complaint added new causes of action alleging violations of California wage and hour laws. On August 7, 2020, the Company filed its answer to the first amended complaint, generally denying the allegations in the complaint. The Company intends to defend itself vigorously in this matter. The Company is currently unable to estimate the range of possible losses associated with this proceeding.
The Company is involved from time to time in various legal proceedings that arise in the ordinary course of its business, including but not limited to commercial disputes, environmental matters, employee related claims, intellectual property disputes and litigation in connection with transactions including acquisitions and divestitures. In the opinion of management, the Company does not believe that such litigation, claims, and administrative proceedings, including the putative class action matter referenced above, will have a material adverse effect on its business, financial position, results of operations or cash flows. However, a significant increase in the number of these claims or an increase in amounts owing under successful claims, including the putative class action referenced above, could materially and adversely affect its business, financial condition, results of operations or cash flows. The Company records a liability when a loss is considered probable, and the amount can be reasonably estimated.
Note 10—Income Taxes
On December 22, 2017, the Tax Cuts and Jobs Act (the “Act”) was signed into law. The Act, among other changes, reduces the U.S. federal corporate tax rate from 35% to 21% as of January 1, 2018 (25.3% applicable for fiscal year 2018 or 21.0% applicable for fiscal year 2019 and after), limits the deductibility of interest, changes the rules on utilization and carryover of net operating losses, limits the deductibility of officers’ compensation, allows for expensing of certain qualified fixed assets, and implements a modified territorial tax system that includes other U.S. international tax provisions.
The Company has re-measured the U.S. deferred tax assets and liabilities based on the enacted tax rates which will be in effect when these differences reverse, which is estimated to be either the blended tax rate of 25.3% for fiscal year 2018 or 21.0% for after fiscal year 2019 or after. The Company has completed its assessment and reflected the income tax effects of the Act on the Company’s financial statements.
The components of income (loss) before provision for taxes are as follows:
|
|
|
Fiscal Years Ended August 31, |
|
|||||||||
|
|
|
2020 |
|
|
2019 |
|
|
2018 |
|
|||
|
|
|
(amounts in thousands) |
|
|||||||||
|
US |
|
$ |
(16,184 |
) |
|
$ |
1,524 |
|
|
$ |
1,747 |
|
|
Total |
|
$ |
(16,184 |
) |
|
$ |
1,524 |
|
|
$ |
1,747 |
|
84
The components of the provision for income taxes are as follows:
|
|
|
Fiscal Years Ended August 31, |
|
|||||||||
|
|
|
2020 |
|
|
2019 |
|
|
2018 |
|
|||
|
|
|
(amounts in thousands) |
|
|||||||||
|
Current: |
|
|
|
|
|
|
|
|
|
|
|
|
|
Federal |
|
$ |
— |
|
|
$ |
— |
|
|
$ |
— |
|
|
State |
|
|
53 |
|
|
|
129 |
|
|
|
65 |
|
|
Total current |
|
|
53 |
|
|
|
129 |
|
|
|
65 |
|
|
Deferred: |
|
|
|
|
|
|
|
|
|
|
|
|
|
Federal |
|
|
1,047 |
|
|
|
(47 |
) |
|
|
(146 |
) |
|
State |
|
|
74 |
|
|
|
(14 |
) |
|
|
86 |
|
|
Total deferred |
|
|
1,121 |
|
|
|
(61 |
) |
|
|
(60 |
) |
|
Total |
|
$ |
1,174 |
|
|
$ |
68 |
|
|
$ |
5 |
|
The Company had an effective tax rate of (7.3)%, 4.5%, and 0.3% for the fiscal years ended August 31, 2020, August 31, 2019, and August 31, 2018 respectively. The reconciliation of the statutory federal income tax rate to the Company’s effective tax rate was as follows:
|
|
|
Fiscal Years Ended August 31, |
|
|||||||||
|
|
|
2020 |
|
|
2019 |
|
|
2018 |
|
|||
|
Tax at federal statutory rate |
|
|
21.0 |
% |
|
|
21.0 |
% |
|
|
25.3 |
% |
|
Employer tip credit |
|
|
0.9 |
|
|
|
(20.2 |
) |
|
|
(23.5 |
) |
|
Stock-based compensation |
|
|
(0.8 |
) |
|
|
— |
|
|
|
— |
|
|
Change in valuation allowance |
|
|
(28.3 |
) |
|
|
— |
|
|
|
— |
|
|
Other items |
|
|
0.5 |
|
|
|
(2.2 |
) |
|
|
(7.8 |
) |
|
State tax, net of federal benefit |
|
|
(0.6 |
) |
|
|
5.9 |
|
|
|
6.3 |
|
|
Effective tax rate |
|
|
(7.3 |
)% |
|
|
4.5 |
% |
|
|
0.3 |
% |
The Company recorded an income tax provision of approximately $1.2 million and $0.1 million for the fiscal years ended August 31, 2020 and August 31, 2019, respectively. The income tax provision was immaterial for the fiscal year ended August 31, 2018. The primary difference between the effective tax rate and the federal statutory tax rate relates to the recognition of valuation allowance against deferred tax assets, employer tip credits, and non-deductible stock-based compensation.
The deferred income taxes reflect the tax effects of the temporary differences between the carrying amounts of assets and liabilities for financial reporting purposes and amounts used for income tax purposes.
85
The tax effects of temporary differences that give rise to significant portions of deferred tax assets and liabilities are as follows:
|
|
|
As of August 31, |
|
|||||
|
|
|
2020 |
|
|
2019 |
|
||
|
|
|
(amounts in thousands) |
|
|||||
|
Deferred tax assets: |
|
|
|
|
|
|
|
|
|
General business credit |
|
$ |
6,472 |
|
|
$ |
1,789 |
|
|
NOL carryover |
|
|
2,003 |
|
|
|
792 |
|
|
Lease liabilities |
|
|
16,635 |
|
|
|
— |
|
|
Deferred rent |
|
|
— |
|
|
|
602 |
|
|
Tenant allowance |
|
|
— |
|
|
|
324 |
|
|
State tax deduction |
|
|
12 |
|
|
|
29 |
|
|
Other |
|
|
535 |
|
|
|
14 |
|
|
Gross deferred tax assets |
|
|
25,657 |
|
|
|
3,550 |
|
|
Deferred tax liabilities: |
|
|
|
|
|
|
|
|
|
Basis difference on fixed assets |
|
|
(4,593 |
) |
|
|
(2,408 |
) |
|
Right-of-use assets |
|
|
(15,496 |
) |
|
|
(15 |
) |
|
Gross deferred tax liabilities |
|
|
(20,089 |
) |
|
|
(2,423 |
) |
|
Valuation allowance |
|
|
(5,568 |
) |
|
|
— |
|
|
Net deferred tax |
|
$ |
— |
|
|
$ |
1,127 |
|
As of August 31, 2020, the Company has U.S. federal net operating loss (“NOL”) carryover of approximately $27.0 million and federal tax credit carryover of approximately $2.0 million. If not utilized, $22.8 million of the federal NOL can be carried forward indefinitely, and the remainder will begin to expire in the fiscal year ending August 31, 2032. The federal tax credit will begin to expire in the fiscal year ending August 31, 2032. Utilization of the Company’s NOL and federal tax credit carryover may be subject to a substantial annual limitation due to ownership change limitations that may have occurred or that could occur in the future, as required by Sections 382 and 383 of the Internal Revenue Code of 1986, as amended.
The Company has not recorded any unrecognized tax benefits as of August 31, 2020. Tax benefits of uncertain tax positions are recognized only if it is more likely than not that the Company will be able to sustain a position taken on an income tax return. The Company has no liability for uncertain positions. Interest and penalties, if any, related to unrecognized tax benefits would be recognized as income tax expense.
The Company evaluates the realizability of its deferred tax assets on a quarterly basis and establish valuation allowance when it is more likely than not that all or a portion of a deferred tax asset may not be realized. During the fiscal year ended August 31, 2020, the adverse effects of the COVID-19 pandemic have caused the Company to reassess the need for valuation allowances against deferred tax assets. As a result, the Company determined that it is no longer more likely than not that it will generate sufficient future U.S. taxable income to realize its deferred tax assets and, therefore, recorded valuation allowances against the net deferred tax assets. The total amount of the valuation allowances recorded was approximately $5.6 million.
86
Note 11—Selected Quarterly Financial Data (unaudited)
The following table sets forth certain unaudited financial information for each quarter of fiscal years 2020 and 2019. The unaudited quarterly information has been prepared using unaudited financial statements and includes all adjustments consisting only of normal recurring adjustments necessary for a fair presentation of the results of the interim periods.
|
|
|
Fiscal Quarter of 2020 |
|
|||||||||||||
|
|
|
First |
|
|
Second |
|
|
Third |
|
|
Fourth |
|
||||
|
|
|
(amounts in thousands, except per share data) |
|
|||||||||||||
|
Sales |
|
$ |
17,440 |
|
|
$ |
19,388 |
|
|
$ |
2,812 |
|
|
$ |
5,528 |
|
|
Operating income (loss) |
|
|
(1,391 |
) |
|
|
(240 |
) |
|
|
(8,028 |
) |
|
|
(6,839 |
) |
|
Net income (loss) |
|
|
(1,224 |
) |
|
|
(133 |
) |
|
|
(9,152 |
) |
|
|
(6,849 |
) |
|
Basic income (loss) per share of Class A and Class B common stock |
|
$ |
(0.15 |
) |
|
$ |
(0.02 |
) |
|
$ |
(1.10 |
) |
|
$ |
(0.82 |
) |
|
Diluted income (loss) per share of Class A and Class B common stock |
|
$ |
(0.15 |
) |
|
$ |
(0.02 |
) |
|
$ |
(1.10 |
) |
|
$ |
(0.82 |
) |
|
|
|
Fiscal Quarter of 2019 |
|
|||||||||||||
|
|
|
First |
|
|
Second |
|
|
Third |
|
|
Fourth |
|
||||
|
|
|
(amounts in thousands, except per share data) |
|
|||||||||||||
|
Sales |
|
$ |
13,420 |
|
|
$ |
15,117 |
|
|
$ |
16,955 |
|
|
$ |
18,753 |
|
|
Operating income (loss) |
|
|
(420 |
) |
|
|
282 |
|
|
|
834 |
|
|
|
965 |
|
|
Net income (loss) |
|
|
(391 |
) |
|
|
212 |
|
|
|
719 |
|
|
|
916 |
|
|
Basic income (loss) per share of Class A and Class B common stock |
|
$ |
(0.08 |
) |
|
$ |
0.04 |
|
|
$ |
0.14 |
|
|
$ |
0.15 |
|
|
Diluted income (loss) per share of Class A and Class B common stock |
|
$ |
(0.08 |
) |
|
$ |
0.04 |
|
|
$ |
0.14 |
|
|
$ |
0.15 |
|
87
None.
Disclosure Controls and Procedures
Our management carried out an evaluation, under the supervision and with the participation of our principal executive officer and principal financial officer, of the effectiveness of the design and operation of our disclosure controls and procedures (as defined in Rule 13a-15(e) of the Exchange Act) as of the end of the period covered by this report.
Based on this evaluation, our principal executive officer and principal financial officer concluded that our disclosure controls and procedures were effective as of the end of the period covered by this report.
Management’s Report on Internal Control Over Financial Reporting
Our management is responsible for establishing and maintaining adequate internal control over financial reporting (as defined in Rule 13a-15(f) and 15d-15(f) under the Exchange Act). Our internal control over financial reporting is a process designed to provide reasonable assurance regarding the reliability of financial reporting and the preparation of financial statements for external purposes in accordance with generally accepted accounting principles. Our internal control over financial reporting includes those policies and procedures that (i) pertain to the maintenance of records that, in reasonable detail, accurately and fairly reflect the transactions and dispositions of our assets; (ii) provide reasonable assurance that transactions are recorded as necessary to permit preparation of financial statements in accordance with generally accepted accounting principles, and that our receipts and expenditures are being made only in accordance with authorizations of our management and directors; and (iii) provide reasonable assurance regarding prevention or timely detection of unauthorized acquisition, use or disposition of our assets that could have a material effect on our financial statements.
Because of its inherent limitations, internal control over financial reporting may not prevent or detect misstatements. Therefore, even those systems determined to be effective can provide only reasonable assurance with respect to financial statement preparation and presentation. Also, projections of any evaluation of effectiveness to future periods are subject to the risk that controls may become inadequate because of changes in conditions or that the degree of compliance with the policies or procedures may deteriorate.
Our management assessed the effectiveness of our internal control over financial reporting using the criteria established by the Committee of Sponsoring Organizations of the Treadway Commission (“COSO”) in Internal Control-Integrated Framework (2013). Based on this assessment, management has concluded that our internal control over financial reporting was effective as of the end of the period covered by this report.
Changes in Internal Control over Financial Reporting
There have been no changes in our internal control over financial reporting that occurred during our most recent fiscal quarter that have materially affected, or are reasonably likely to materially affect, our internal control over financial reporting.
None.
88
The information required by Items 10, 11, 12, 13 and 14 will be furnished (and are hereby incorporated by reference) by an amendment hereto or pursuant to the Company’s definitive proxy statement pursuant to Regulation 14A for the 2020 annual meeting of stockholders that will contain such information.
89
|
(a)(1). |
Financial Statements. See “Table of Contents” on page 58. |
|
(a)(2). |
Financial Statement Schedules. |
All schedules are omitted because they are not required or applicable, or the required information is included in the Company’s financial statements or related notes.
|
(a)(3). |
Exhibits. See “Index to Exhibits.” |
90
|
Exhibit Number |
|
Description |
|
|
|
|
|
3.1 |
|
|
|
|
|
|
|
3.2 |
|
|
|
|
|
|
|
4.1 |
|
|
|
|
|
|
|
4.2# |
|
|
|
|
|
|
|
10.1† |
|
|
|
|
|
|
|
10.2† |
|
|
|
|
|
|
|
10.3† |
|
|
|
|
|
|
|
10.4 |
|
|
|
|
|
|
|
10.5 |
|
|
|
|
|
|
|
10.6 |
|
|
|
|
|
|
|
10.7 |
|
|
|
|
|
|
|
10.8 |
|
|
|
|
|
|
|
10.9† |
|
|
|
|
|
|
|
10.10† |
|
|
|
|
|
|
|
23.1# |
|
|
|
|
|
|
|
23.2# |
|
|
|
|
|
|
|
24.1# |
|
Power of Attorney (included on signature page of this report) |
|
|
|
|
|
31.1# |
|
|
|
|
|
|
|
31.2# |
|
|
|
|
|
|
|
32.1# |
|
Certification of Chief Executive Officer pursuant to Section 906 of the Sarbanes-Oxley Act of 2002 |
|
|
|
|
|
32.2# |
|
Certification of Chief Financial Officer pursuant to Section 906 of the Sarbanes-Oxley Act of 2002 |
91
|
|
|
|
|
101.INS |
|
XBRL Instance Document |
|
|
|
|
|
101.SCH |
|
XBRL Taxonomy Extension Schema Document |
|
|
|
|
|
101.CAL |
|
XBRL Taxonomy Extension Calculation Linkbase Document |
|
|
|
|
|
101.DEF |
|
XBRL Taxonomy Extension Definition Linkbase Document |
|
|
|
|
|
101.LAB |
|
XBRL Taxonomy Extension Label Linkbase Document |
|
|
|
|
|
101.PRE |
|
XBRL Taxonomy Extension Presentation Linkbase Document |
|
† |
Management contract or compensatory plan. |
|
# |
Filed herewith. |
None.
92
Pursuant to the requirements of Section 13 or 15(d) of the Securities Exchange Act of 1934, the registrant has duly caused this report to be signed on its behalf by the undersigned thereunto duly authorized.
Date: November 17, 2020
|
KURA SUSHI USA, INC. |
||
|
By: |
|
/s/ Koji Shinohara |
|
Name: |
|
Koji Shinohara |
|
Title: |
|
Chief Financial Officer, Treasurer and Secretary (Principal Financial Officer and Principal Accounting Officer) |
KNOW ALL PERSONS BY THESE PRESENTS, that each person whose signature appears below constitutes and appoints Hajime Uba and Koji Shinohara, and each of them, as his or her true and lawful attorneys-in-fact and agents, with full power of substitution and resubstitution, for him or her and in his or her name, place and stead, in any and all capacities, to sign any and all amendments to this Annual Report on Form 10-K, and to file the same, with all exhibits thereto, and other documents in connection therewith, with the Securities and Exchange Commission, granting unto said attorneys-in-fact and agents, and each of them, full power and authority to do and perform each and every act and thing requisite and necessary to be done in connection therewith, as fully to all intents and purposes as he or she might or could do in person, hereby ratifying and confirming that all said attorneys-in-fact and agents, or any of them or their or his or her substitute or substitutes, may lawfully do or cause to be done by virtue hereof.
Pursuant to the requirements of the Securities Exchange Act of 1934, this report has been signed below by the following persons in their indicated capacities and on the dates indicated.
|
Signature |
|
Title |
|
Date |
|
|
|
|
|
|
|
/s/ Hajime Uba |
|
Chairman, President, Chief Executive Officer and Director (Principal Executive Officer) |
|
November 17, 2020 |
|
Hajime Uba |
|
|
||
|
|
|
|
|
|
|
/s/ Koji Shinohara |
|
Chief Financial Officer, Treasurer and Secretary (Principal Financial Officer and Principal Accounting Officer) |
|
November 17, 2020 |
|
Koji Shinohara |
|
|
||
|
|
|
|
|
|
|
/s/ Shintaro Asako |
|
Director |
|
November 17, 2020 |
|
Shintaro Asako |
|
|
|
|
|
|
|
|
|
|
|
/s/ Kim Ellis |
|
Director |
|
November 17, 2020 |
|
Kim Ellis |
|
|
|
|
|
|
|
|
|
|
|
/s/ Seitaro Ishii |
|
Director |
|
November 17, 2020 |
|
Seitaro Ishii |
|
|
|
|
|
|
|
|
|
|
|
/s/ Hiroyuki Okamoto |
|
Director |
|
November 17, 2020 |
|
Hiroyuki Okamoto |
|
|
|
|
93