Attached files
| file | filename |
|---|---|
| EX-99.1 - PRESS RELEASE - Simulations Plus, Inc. | simulations_ex9901.htm |
| 8-K - CURRENT REPORT - Simulations Plus, Inc. | simulations_8k.htm |
Exhibit 99.2

Q4 and Fiscal Year 2020 Investor Conference Call Shawn O’Connor, CEO John Kneisel, CFO November 16, 2020 (NASDAQ:SLP)

2 With the exception of historical information, the matters discussed in this presentation are forward - looking statements that involve a number of risks and uncertainties . The actual results of the Company could differ significantly from those statements . Factors that could cause or contribute to such differences include, but are not limited to : continuing demand for the Company’s products, competitive factors, the Company’s ability to finance future growth, the Company’s ability to produce and market new products in a timely fashion, the Company’s ability to continue to attract and retain skilled personnel, and the Company’s ability to sustain or improve current levels of productivity . Further information on the Company’s risk factors is contained in the Company’s quarterly and annual reports and filed with the Securities and Exchange Commission . Safe Harbor Statement

FY2020 Highlights : Achieved step up in revenue growth to target of 15 - 20% growth despite COVID - 19 disruption; Completed Lixoft acquisition in Q3; Completed capital raise in Q4; Improved portfolio of software offerings through internal development, collaborations with clients and regulatory agencies, and acquisition; Broadened service offerings and expanded capacity of consulting team; Continued to further science and support clients in their growing use of modeling and simulation to improve their drug development process 3

Strong Revenue Performance (in millions) 4 $29.7 $34.0 $41.6 FY2018 FY2019 FY2020 3 YR CAGR 19% UP 22% FY2020

$17.0 $12.7 $29.7 $18.5 $15.5 $34.0 $21.6 $20.0 $41.6 Software Consulting Total FY2018 FY2019 FY2020 30% Growth 22% Growth Revenue by Source (in millions) 5 16% Growth
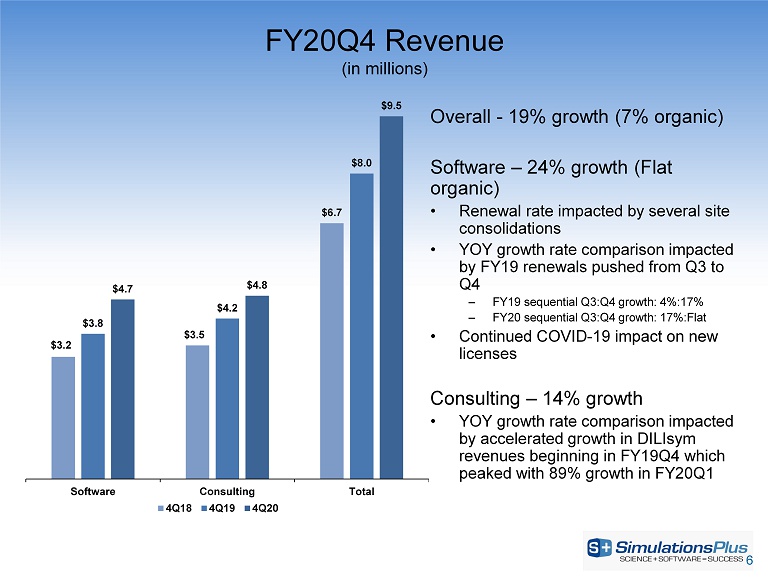
FY20Q4 Revenue (in millions) Overall - 19% growth (7% organic) Software – 24% growth (Flat organic) • Renewal rate impacted by several site consolidations • YOY growth rate comparison impacted by FY19 renewals pushed from Q3 to Q4 – FY19 sequential Q3:Q4 growth: 4%:17% – FY20 sequential Q3:Q4 growth: 17%:Flat • Continued COVID - 19 impact on new licenses Consulting – 14% growth • YOY growth rate comparison impacted by accelerated growth in DILIsym revenues beginning in FY19Q4 which peaked with 89% growth in FY20Q1 6 $3.2 $3.5 $6.7 $3.8 $4.2 $8.0 $4.7 $4.8 $9.5 Software Consulting Total 4Q18 4Q19 4Q20

48% 52% Consulting Software Revenue Breakdown Software FY2020 Total Revenue * Includes five months of revenue recorded post acquisition 7 34% 10% 4% 2% 2% GastroPlus ADMET Predictor Monolix Suite* Other Software DILIsym Software Products as % of Total Revenues

Software Product Highlights • GastroPlus; PBPK modeling platform; Collaborations; GastroPlus 9.8 released in October; ADMET Predictor; – ML modeling platform – APX Œ released in September – AI - Driven Drug Design (AIDD) Module; Monolix Suite; Pop PK/PD modeling platform; Monolix Suite 2020R1 released in November; Re - engineered simulations module 8

Software Renewal Rates Q4 Trend FY Trend 9 92% 93% 93% 87% 85% 89% FY2018 FY2019 FY2020 Fees Accounts 91% 93% 88% 86% 86% 93% 4Q18 4Q19 4Q20 Fees Accounts

New Software Customers Q4 Trend 7 20 10 13 13 14 20 33 24 4Q18 4Q19 4Q20 Commercial Non-profit Total FY Trend 37 46 49 39 54 64 76 100 113 FY2018 FY2019 FY2020 Commercial Non-profit Total

11 Commercial Software Companies ($’s in millions) $16.1 $17.6 $20.4 148 159 184 FY2018 FY2019 FY2020 Software License Revenue Revenue Companies 48 53 74 FY2018 FY2019 FY2020 $100K+ Companies
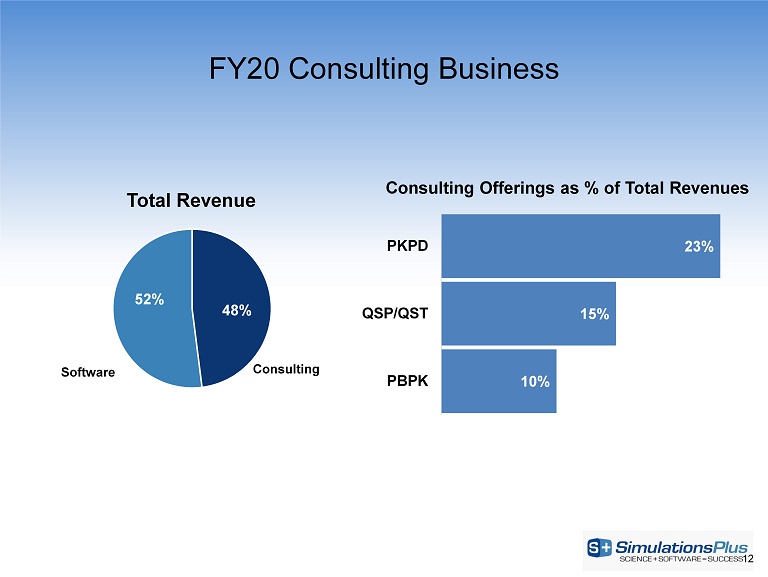
48% 52% Consulting Software FY20 Consulting Business Total Revenue 12 Consulting Offerings as % of Total Revenues 10% 15% 23% PBPK QSP/QST PKPD

Consulting Business Highlights • Recent Client Success – NDA for Pexidartinib – FDA approval of Ubrogepant – OEHHA review of Acetaminophen • New Services – Regulatory Strategies – COVID Strategies • Capacity – 22% increase in FY20 13

Consulting Revenue Sources ($’s in millions) 14 $7.0 $3.4 $2.3 $8.0 $4.3 $3.1 $9.9 $6.1 $4.0 PKPD QSP/QST PBPK Consulting Revenue by Type FY2018 FY2019 FY2020 63 39 69 85 42 77 117 39 97 PKPD QSP/QST PBPK Projects FY2018 FY2019 FY2020

Backlog (in millions) 15 $1.8 $4.9 $1.1 $7.8 $2.9 $6.7 $1.5 $11.1 $3.8 $5.5 $1.2 $10.5 QSP/QST PKPD PBPK Total FY2018 FY2019 FY2020

FY 21 Outlook • Maintain organic growth outlook in 15 - 20% range – Monolix Suite growth delivers an incremental 3 - 5% growth – Additional FY21 acquisitions would be incremental • Software growth FY20: 16% FY21: 20 - 25% – GastroPlus – New 9.8 release with introduction in FY21 of GPX – ADMET Predictor – New release, accelerated growth momentum and AIDD module – Monolix Suite – Performing well and tracking to their 15/30% growth rates as anticipated in the earnout agreement – Price – Price increase and discount policy changes being rolled out – Cross - selling – Prior investments in S&M now being focused on strategic sales initiatives that will provide benefits • Consulting growth FY20: 30% FY21: 25% - 30% – Continued demand across our services with PKPD and PBPK services remaining consistent while DILI settles into a more consistent delivery of project flow • M&A Update – Focused on a population of targets that we believe could add value to our growth strategy and enhance our value to our client base • software entities that extend our modeling and simulation application offering portfolio • service opportunities which provide new service capabilities and/or add to our service capacity or geographic coverage – We continue to adhere to strict acquisition criteria that include product and cultural fit, enhancement of value to our clients, and appropriate valuation accretive characteristics 16

Financial Results
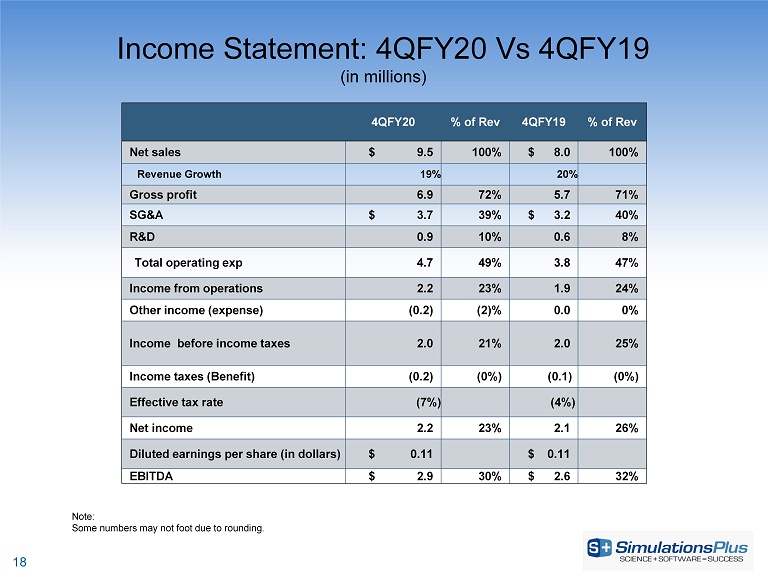
18 Income Statement: 4QFY20 Vs 4QFY19 (in millions) Note: Some numbers may not foot due to rounding. 4QFY20 % of Rev 4QFY19 % of Rev Net sales $ 9.5 100% $ 8.0 100% Revenue Growth 19% 20% Gross profit 6.9 72% 5.7 71% SG&A $ 3.7 39% $ 3.2 40% R&D 0.9 10% 0.6 8% Total operating exp 4.7 49% 3.8 47% Income from operations 2.2 23% 1.9 24% Other income (expense) (0.2) (2)% 0.0 0% Income before income taxes 2.0 21% 2.0 25% Income taxes (Benefit) (0.2) (0%) (0.1) (0%) Effective tax rate (7%) (4%) Net income 2.2 23% 2.1 26% Diluted earnings per share (in dollars) $ 0.11 $ 0.11 EBITDA $ 2.9 30% $ 2.6 32%

19 Income Statement: 12moFY20 Vs 12MoFY19 (in millions) Note: Some numbers may not foot due to rounding. FY20 SG&A includes $1.4M of acquisition related costs. FY20 % of Rev FY19 % of Rev Net sales $ 41.6 100% $ 34.0 100% Revenue Growth 22.4% 14.5% Gross profit 30.9 74% 24.9 73% SG&A $ 16.4 39% 11.8 35% R&D 3.0 7% 2.5 7% Total operating exp 19.3 46% 14.3 42% Income from operations 11.6 28% 10.6 31% Other income (expense) (0.2) (1)% (0.1) (0)% Income before income taxes 11.4 27% 10.6 31% Income taxes 2.1 5% 2.0 6% Effective tax rate 18.0% 18.7% Net income $ 9.3 22% $ 8.6 25% Diluted earnings per share (in dollars) $ 0.50 $ 0.48 EBITDA $ 14.4 35% $ 13.4 39%

20 Revenues : Fiscal Quarter (in millions) $7.1 $7.4 $8.6 $6.7 $7.5 $8.5 $9.9 $8.0 $9.4 $10.3 $12.3 $9.5 Q1 Q2 Q3 Q4 FY2018 FY2019 FY2020

21 EBITDA : Fiscal Quarter (in millions) $3.2 $3.1 $4.1 $2.6 $2.8 $3.4 $4.6 $2.7 $3.4 $3.5 $4.6 $2.9 Q1 Q2 Q3 Q4 FY2018 FY2019 FY2020

Average Revenue per Customer (in 1,000’s) Note: Software revenue per customer excludes academic and non - profit customers 22 $108.7 $110.6 $110.8 $151.8 $161.8 $203.1 FY2018 FY2019 FY2020 Software Consulting

Margins Deliver Steady EPS Growth * Pro forma non - GAAP numbers 23 81% 82% 85% 63% 63% 63% 73% 73% 74% FY2018 FY2019 FY2020 Gross Profit % Software Consulting Total $0.50 $0.48 $0.50 $0.42 $0.48 $0.56 FY2018 FY2019 FY2020 EPS Growth Over Time* EPS (diluted) as reported Proforma EPS

Revenue by Region – FY2020 24 64% 66% 71% 18% 17% 14% 18% 17% 15% FY2018 FY2019 FY2020 Americas Europe Asia

Cash Activity (in millions) 25 $9.4 $11.4 $116.0 FY2018 FY2019 FY2020 Cash and Investments $4.2 $4.2 $4.3 FY2018 FY2019 FY2020 Dividends $9.3 $11.6 $10.9 FY2018 FY2019 FY2020 Cash flow from operations

Headcount 26 FY2018 FY2019 FY2020 Software 29 32 39 Consulting 36 46 56 Sales and Marketing 6 7 8 Other 23 26 34 Total 94 111 137

27 Selected Balance Sheet Items (in millions, except where indicated) August 31, 2020 August 31, 2019 Cash and short - term investments $ 116.0 $ 11.4 Total current assets 129.1 21.2 Total assets 168.4 45.2 Current liabilities 5.5 4.8 Long - term liabilities 6.9 2.7 Total liabilities 12.4 7.5 Shareholders’ equity 156.0 37.7 Total liabilities and shareholders’ equity 168.4 45.2 Current ratio 23.5x 4.4x

Conclusion Tremendous year for SLP!; Focused efforts succeeded in moving the organic growth rate to 15 - 20% target; We added to the SLP family with the acquisition of Lixoft, a significant addition to our software portfolio and an addition of talented scientific staff to our organization; We positioned ourselves for future growth with the completion of our capital raise in August; As a company, we remain focused on delivering good science, measurable value, and quality service to our clients; I'd like to take the opportunity to thank all of our team of outstanding professionals here at SLP for their efforts and devotion to our success during a most unusual but rewarding year 28

Selected Financial Information Nasdaq SLP Cash and short - term investments $116 million Borrowed Debt Outstanding $0.0 Market Capitalization (a/o 11/13/20) $ 1.4B Fully Diluted Shares Outstanding FY2020 18.5M Average Daily Trading Volume (current 30 day - a/o 11/13/20) ~204,000 29

30 Thank you! https://www.linkedin.com/company/simulations - plus https://www.linkedin.com/company/cognigen https://www.linkedin.com/company/dilisym https://www.linkedin.com/company/lixoft/