Attached files
| file | filename |
|---|---|
| 8-K - 8-K - PACIFIC PREMIER BANCORP INC | ppbi-20201117.htm |
Investor Presentation Third Quarter 2020 November 17, 2020 Steve Gardner Chairman, President & Chief Executive Officer sgardner@ppbi.com 949-864-8000 Ronald J. Nicolas, Jr. Sr. EVP & Chief Financial Officer rnicolas@ppbi.com 949-864-8000

FORWARD LOOKING STATEMENTS AND WHERE TO FIND MORE INFORMATION Forward Looking Statements This investor presentation contains “forward-looking statements” within the meaning of the Private Securities Litigation Reform Act of 1995 regarding the financial condition, results of operations, business plans and the future performance of Pacific Premier Bancorp, Inc. (“PPBI” or the “Company”), including its wholly-owned subsidiary Pacific Premier Bank (“Pacific Premier” or the “Bank”). Words such as “anticipates,” “believes,” “estimates,” “expects,” “forecasts,” “intends,” “plans,” “projects,” “could,” “may,” “should,” “will” or other similar words and expressions are intended to identify these forward-looking statements. These forward-looking statements are based on PPBI’s current expectations and beliefs concerning future developments and their potential effects on the Company including, without limitation, plans, strategies and goals, and statements about the Company’s expectations regarding revenue and asset growth, financial performance and profitability, loan and deposit growth, yields and returns, loan diversification and credit management, stockholder value creation, tax rates and the impact of the acquisition of Opus Bank (“Opus” or “OPB”) and other acquisitions. Because forward-looking statements relate to future results and occurrences, they are subject to inherent uncertainties, risks, and changes in circumstances that are difficult to predict. Many possible events or factors could affect PPBI’s future financial results and performance and could cause actual results or performance to differ materially from anticipated results or performance. The COVID-19 pandemic is adversely affecting us, our customers, counterparties, employees, and third-party service providers, and the ultimate extent of the impacts on our business, financial position, results of operations, liquidity, and prospects is uncertain. Continued deterioration in general business and economic conditions, including further increases in unemployment rates, or turbulence in domestic or global financial markets could adversely affect our revenues and the values of our assets and liabilities, reduce the availability of funding, lead to a tightening of credit, and further increase stock price volatility, which could result in impairment to our goodwill in future periods. In addition, changes to statutes, regulations, or regulatory policies or practices as a result of, or in response to COVID-19, could affect us in substantial and unpredictable ways, including the potential adverse impact of loan modifications and payment deferrals implemented consistent with recent regulatory guidance. Other risks and uncertainties include, but are not limited to, the following: the strength of the United States economy in general and the strength of the local economies in which we conduct operations; the effects of, and changes in, trade, monetary and fiscal policies and laws, including interest rate policies of the Board of Governors of the Federal Reserve System; inflation/deflation, interest rate, market and monetary fluctuations; the effect of acquisitions we have made or may make, such as our recent acquisition of Opus, including, without limitation, the failure to achieve the expected revenue growth and/or expense savings from such acquisitions, and/or the failure to effectively integrate an acquisition target into our operations; the timely development of competitive new products and services and the acceptance of these products and services by new and existing customers; the impact of changes in financial services policies, laws and regulations, including those concerning taxes, banking, securities and insurance, and the application thereof by regulatory bodies; the effectiveness of our risk management framework and quantitative models; changes in the level of our nonperforming assets and charge-offs; uncertainty regarding the future of LIBOR and potential alternative reference rates, including SOFR; the effect of changes in accounting policies and practices or accounting standards, as may be adopted from time-to-time by bank regulatory agencies, the U.S. Securities and Exchange Commission (“SEC”), the Public Company Accounting Oversight Board, the Financial Accounting Standards Board or other accounting standards setters, including ASU 2016-13 (Topic 326), “Measurement of Credit Losses on Financial Instruments,” commonly referenced as the CECL model, which has changed how we estimate credit losses and may further increase the required level of our allowance for credit losses in future periods; possible credit related impairments of securities held by us; possible impairment charges to goodwill; the impact of current governmental efforts to restructure the U.S. financial regulatory system, including any amendments to the Dodd-Frank Wall Street Reform and Consumer Protection Act; changes in consumer spending, borrowing and savings habits; the effects of our lack of a diversified loan portfolio, including the risks of geographic and industry concentrations; our ability to attract deposits and other sources of liquidity; the possibility that we may reduce or discontinue the payments of dividends on our common stock; changes in the financial performance and/or condition of our borrowers; changes in the competitive environment among financial and bank holding companies and other financial service providers; geopolitical conditions, including acts or threats of terrorism, actions taken by the United States or other governments in response to acts or threats of terrorism and/or military conflicts, which could impact business and economic conditions in the United States and abroad; public health crises and pandemics, including the COVID-19 pandemic, and their effects on the economic and business environments in which we operate, including on our credit quality and business operations, as well as the impact on general economic and financial market conditions; cybersecurity threats and the cost of defending against them, including the costs of compliance with potential legislation to combat cybersecurity at a state, national or global level; unanticipated regulatory or legal proceedings; and our ability to manage the risks involved in the foregoing. Additional factors that could cause actual results to differ materially from those expressed in the forward-looking statements are discussed in the Company’s Annual Report on Form 10-K for the year ended December 31, 2019, its Quarterly Report on Form 10-Q for the quarter ended September 30, 2020, and other filings filed with the SEC and available at the SEC’s Internet site (http://www.sec.gov). The Company undertakes no obligation to revise or publicly release any revision or update to these forward-looking statements to reflect events or circumstances that occur after the date on which such statements were made. Non-U.S. GAAP Financial Measures This presentation contains non-U.S. GAAP financial measures. For purposes of Regulation G promulgated by the SEC, a non-U.S. GAAP financial measure is a numerical measure of the registrant’s historical or future financial performance, financial position or cash flows that excludes amounts or is subject to adjustments that have the effect of excluding amounts that are included in the most directly comparable measure calculated and presented in accordance with U.S. GAAP in the statement of income, statement of financial condition or statement of cash flows (or equivalent statements) of the issuer; or includes amounts, or is subject to adjustments that have the effect of including amounts, that are excluded from the most directly comparable measure so calculated and presented in this regard. U.S. GAAP refers to generally accepted accounting principles in the United States. Pursuant to the requirements of Regulation G, PPBI has provided reconciliations within this presentation, as necessary, of the non-U.S GAAP financial measures to the most directly comparable U.S. GAAP financial measures. For more details on PPBI’s non-U.S. GAAP measures, refer to the Appendix in this presentation. © 2020 Pacific Premier Bancorp, Inc. | All rights reserved 2
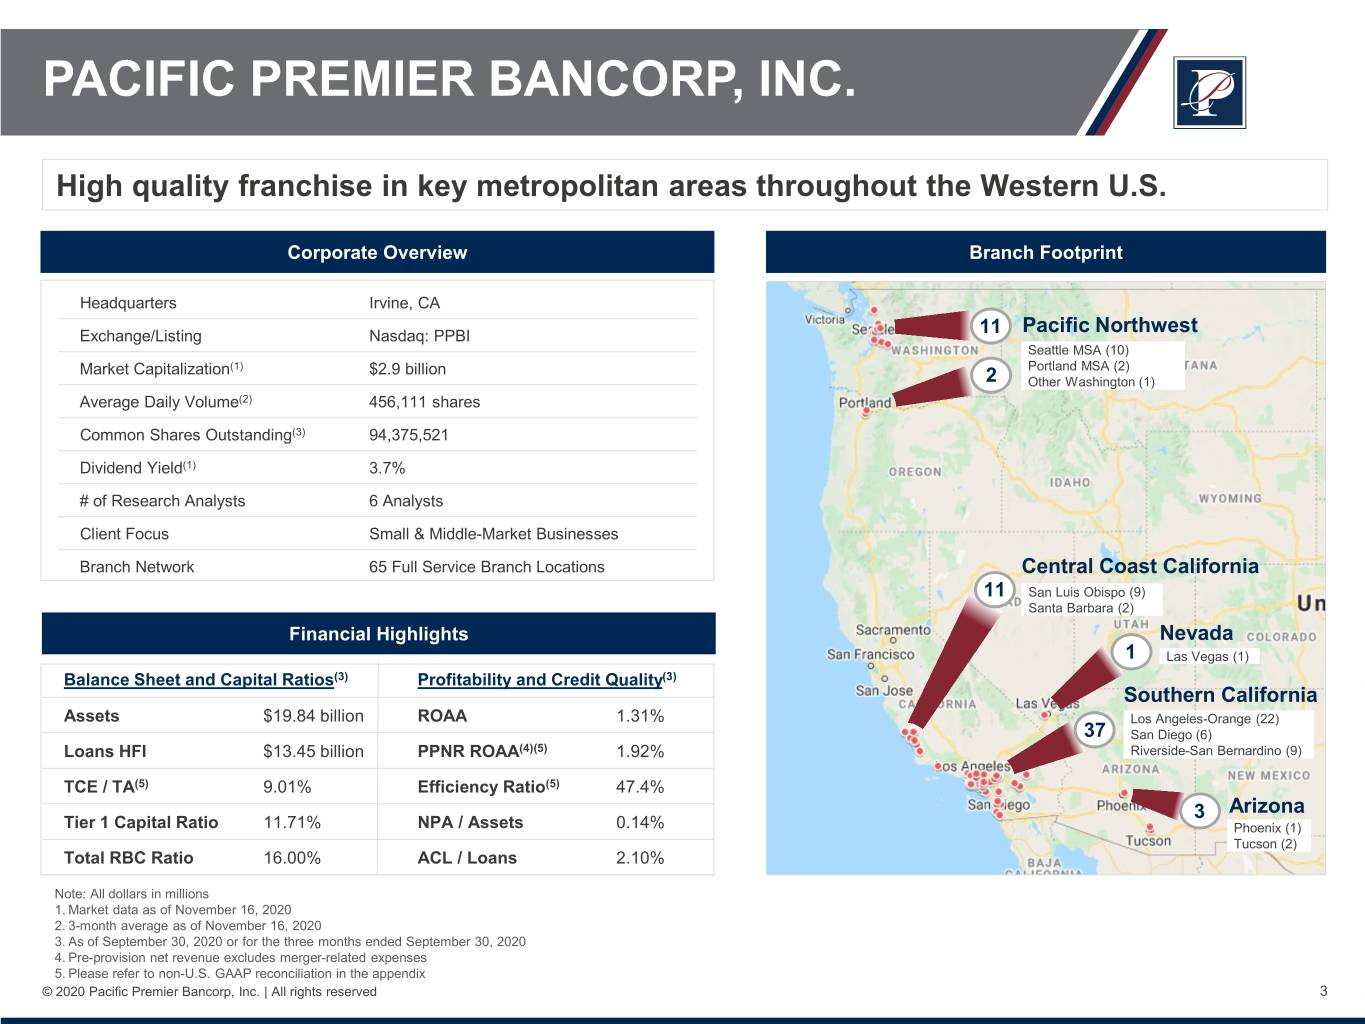
PACIFIC PREMIER BANCORP, INC. High quality franchise in key metropolitan areas throughout the Western U.S. Corporate Overview Branch Footprint Headquarters Irvine, CA Exchange/Listing Nasdaq: PPBI 11 Pacific Northwest Seattle MSA (10) Market Capitalization(1) $2.9 billion Portland MSA (2) 2 Other Washington (1) Average Daily Volume(2) 456,111 shares Common Shares Outstanding(3) 94,375,521 Dividend Yield(1) 3.7% # of Research Analysts 6 Analysts Client Focus Small & Middle-Market Businesses Branch Network 65 Full Service Branch Locations Central Coast California 11 San Luis Obispo (9) Santa Barbara (2) Financial Highlights Nevada 1 Las Vegas (1) Balance Sheet and Capital Ratios(3) Profitability and Credit Quality(3) Southern California Assets $19.84 billion ROAA 1.31% Los Angeles-Orange (22) 37 San Diego (6) Loans HFI $13.45 billion PPNR ROAA(4)(5) 1.92% Riverside-San Bernardino (9) TCE / TA(5) 9.01% Efficiency Ratio(5) 47.4% 3 Arizona Tier 1 Capital Ratio 11.71% NPA / Assets 0.14% Phoenix (1) Tucson (2) Total RBC Ratio 16.00% ACL / Loans 2.10% Note: All dollars in millions 1. Market data as of November 16, 2020 2. 3-month average as of November 16, 2020 3. As of September 30, 2020 or for the three months ended September 30, 2020 4. Pre-provision net revenue excludes merger-related expenses 5. Please refer to non-U.S. GAAP reconciliation in the appendix © 2020 Pacific Premier Bancorp, Inc. | All rights reserved 3
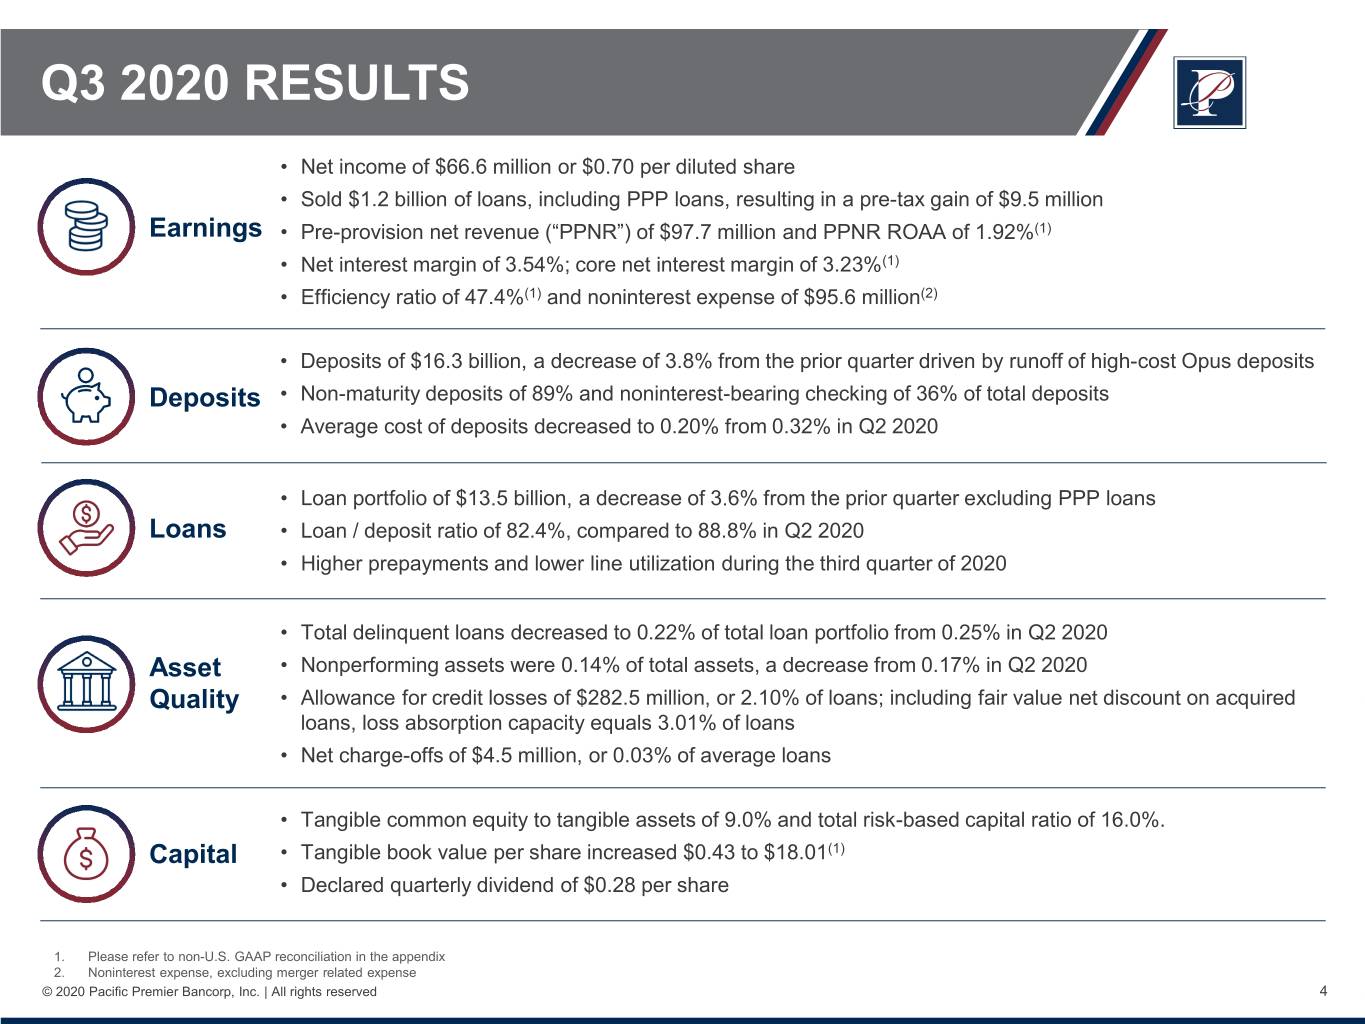
Q3 2020 RESULTS • Net income of $66.6 million or $0.70 per diluted share • Sold $1.2 billion of loans, including PPP loans, resulting in a pre-tax gain of $9.5 million Earnings • Pre-provision net revenue (“PPNR”) of $97.7 million and PPNR ROAA of 1.92%(1) • Net interest margin of 3.54%; core net interest margin of 3.23%(1) • Efficiency ratio of 47.4%(1) and noninterest expense of $95.6 million(2) • Deposits of $16.3 billion, a decrease of 3.8% from the prior quarter driven by runoff of high-cost Opus deposits Deposits • Non-maturity deposits of 89% and noninterest-bearing checking of 36% of total deposits • Average cost of deposits decreased to 0.20% from 0.32% in Q2 2020 • Loan portfolio of $13.5 billion, a decrease of 3.6% from the prior quarter excluding PPP loans Loans • Loan / deposit ratio of 82.4%, compared to 88.8% in Q2 2020 • Higher prepayments and lower line utilization during the third quarter of 2020 • Total delinquent loans decreased to 0.22% of total loan portfolio from 0.25% in Q2 2020 Asset • Nonperforming assets were 0.14% of total assets, a decrease from 0.17% in Q2 2020 Quality • Allowance for credit losses of $282.5 million, or 2.10% of loans; including fair value net discount on acquired loans, loss absorption capacity equals 3.01% of loans • Net charge-offs of $4.5 million, or 0.03% of average loans • Tangible common equity to tangible assets of 9.0% and total risk-based capital ratio of 16.0%. Capital • Tangible book value per share increased $0.43 to $18.01(1) • Declared quarterly dividend of $0.28 per share 1. Please refer to non-U.S. GAAP reconciliation in the appendix 2. Noninterest expense, excluding merger related expense © 2020 Pacific Premier Bancorp, Inc. | All rights reserved 4
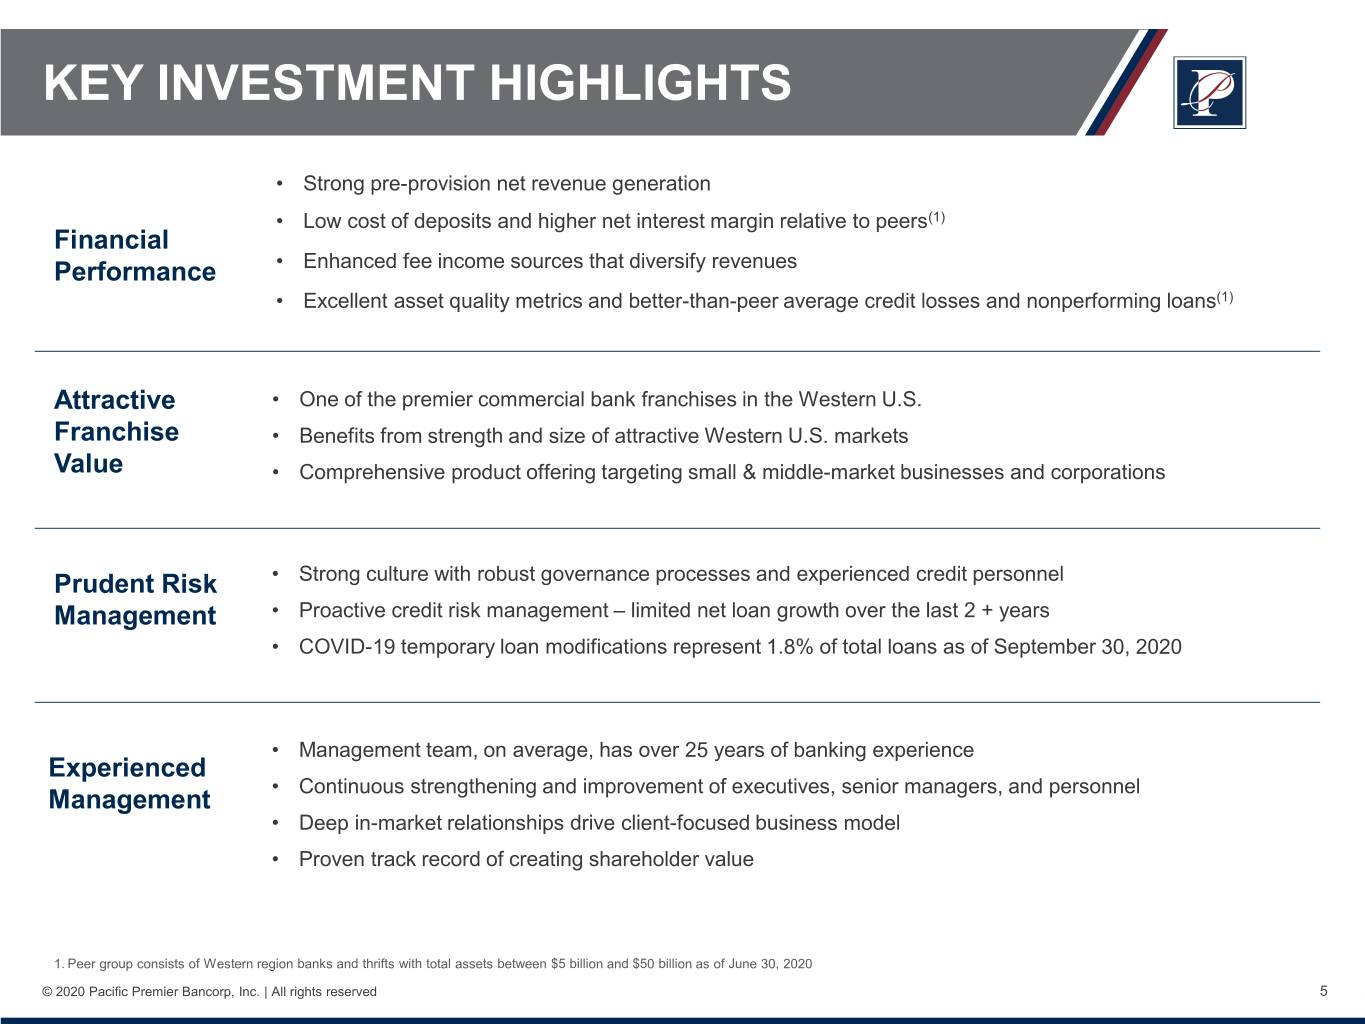
KEY INVESTMENT HIGHLIGHTS • Strong pre-provision net revenue generation • Low cost of deposits and higher net interest margin relative to peers(1) Financial Performance • Enhanced fee income sources that diversify revenues • Excellent asset quality metrics and better-than-peer average credit losses and nonperforming loans(1) Attractive • One of the premier commercial bank franchises in the Western U.S. Franchise • Benefits from strength and size of attractive Western U.S. markets Value • Comprehensive product offering targeting small & middle-market businesses and corporations Prudent Risk • Strong culture with robust governance processes and experienced credit personnel Management • Proactive credit risk management – limited net loan growth over the last 2 + years • COVID-19 temporary loan modifications represent 1.8% of total loans as of September 30, 2020 • Management team, on average, has over 25 years of banking experience Experienced • Continuous strengthening and improvement of executives, senior managers, and personnel Management • Deep in-market relationships drive client-focused business model • Proven track record of creating shareholder value 1. Peer group consists of Western region banks and thrifts with total assets between $5 billion and $50 billion as of June 30, 2020 © 2020 Pacific Premier Bancorp, Inc. | All rights reserved 5
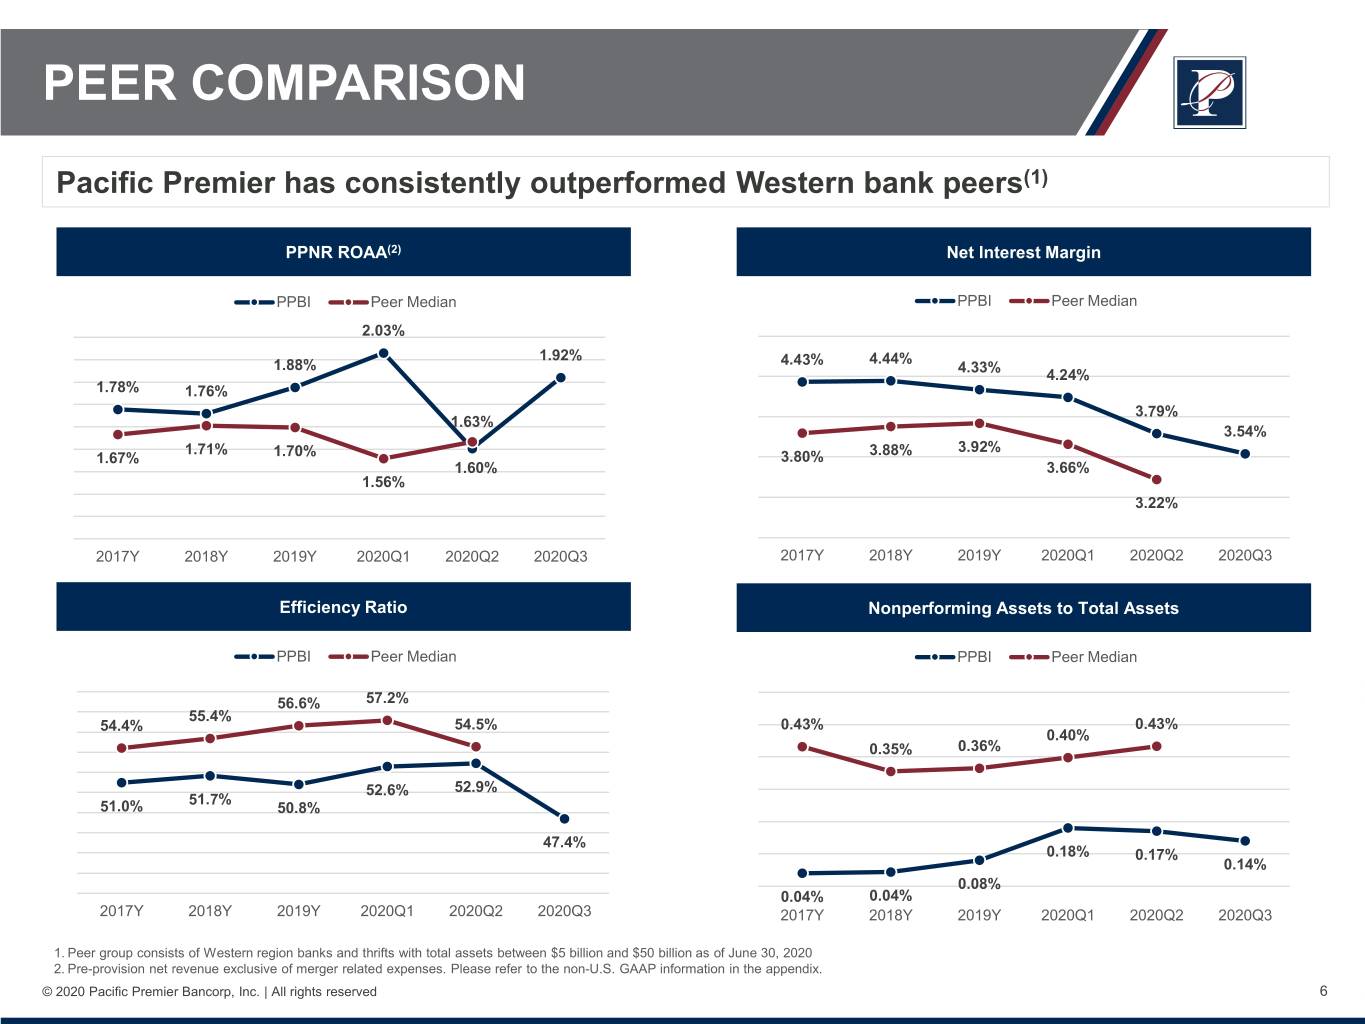
PEER COMPARISON Pacific Premier has consistently outperformed Western bank peers(1) PPNR ROAA(2) Net Interest Margin PPBI Peer Median PPBI Peer Median 2.03% 1.92% 1.88% 4.43% 4.44% 4.33% 4.24% 1.78% 1.76% 3.79% 1.63% 3.54% 1.71% 3.88% 3.92% 1.67% 1.70% 3.80% 1.60% 3.66% 1.56% 3.22% 2017Y 2018Y 2019Y 2020Q1 2020Q2 2020Q3 2017Y 2018Y 2019Y 2020Q1 2020Q2 2020Q3 Efficiency Ratio Nonperforming Assets to Total Assets PPBI Peer Median PPBI Peer Median 56.6% 57.2% 55.4% 54.4% 54.5% 0.43% 0.43% 0.40% 0.35% 0.36% 52.6% 52.9% 51.7% 51.0% 50.8% 47.4% 0.18% 0.17% 0.14% 0.08% 0.04% 0.04% 2017Y 2018Y 2019Y 2020Q1 2020Q2 2020Q3 2017Y 2018Y 2019Y 2020Q1 2020Q2 2020Q3 1. Peer group consists of Western region banks and thrifts with total assets between $5 billion and $50 billion as of June 30, 2020 2. Pre-provision net revenue exclusive of merger related expenses. Please refer to the non-U.S. GAAP information in the appendix. © 2020 Pacific Premier Bancorp, Inc. | All rights reserved 6
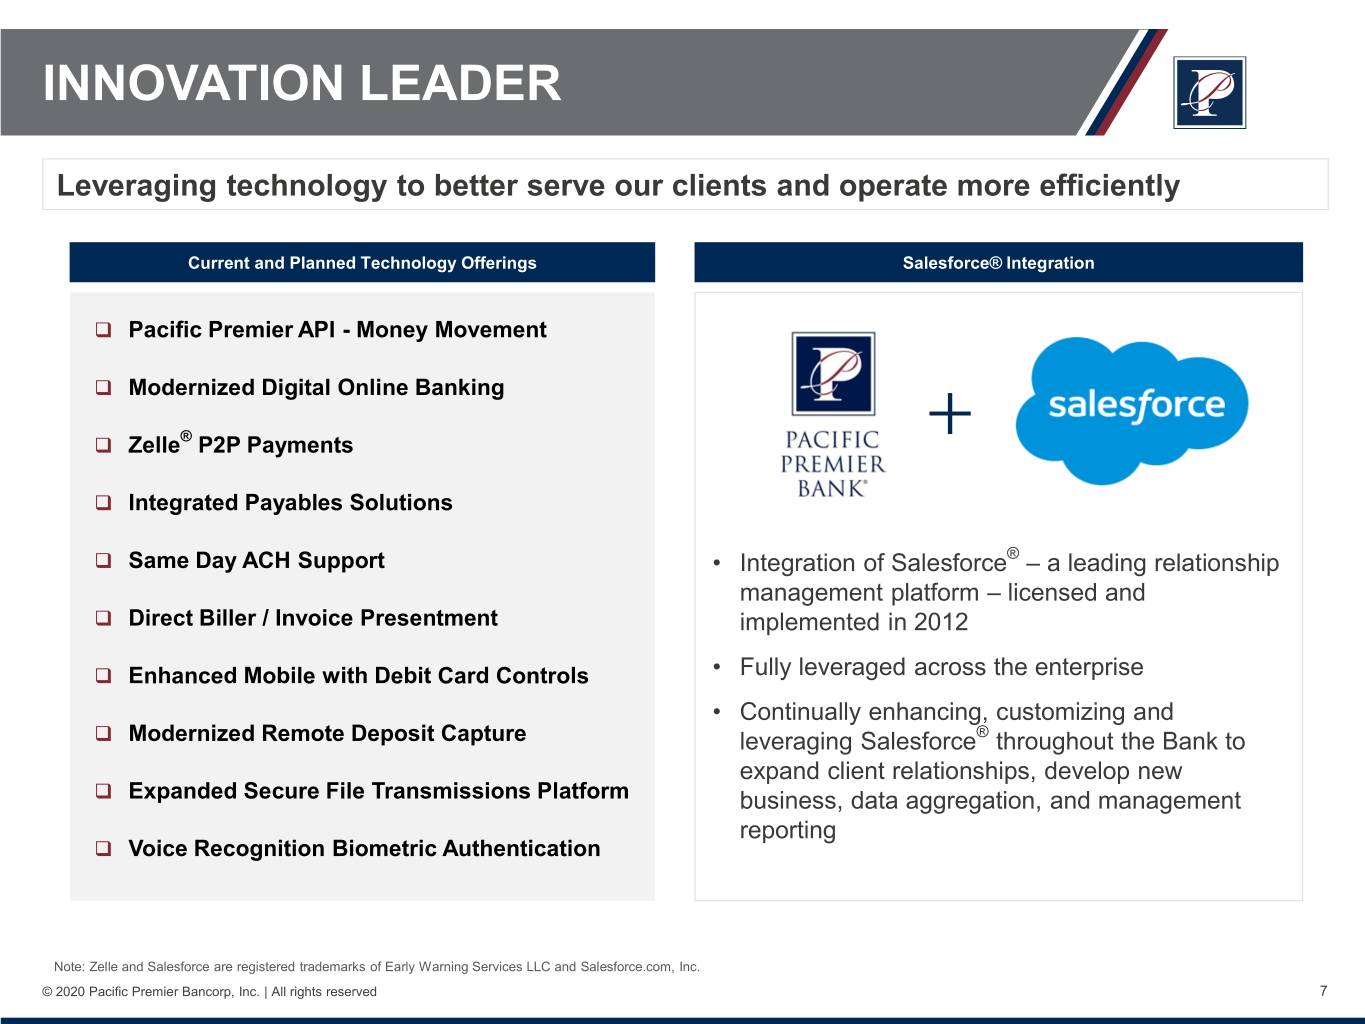
INNOVATION LEADER Leveraging technology to better serve our clients and operate more efficiently Current and Planned Technology Offerings Salesforce® Integration Pacific Premier API - Money Movement Modernized Digital Online Banking Zelle® P2P Payments Integrated Payables Solutions Same Day ACH Support • Integration of Salesforce® – a leading relationship management platform – licensed and Direct Biller / Invoice Presentment implemented in 2012 Enhanced Mobile with Debit Card Controls • Fully leveraged across the enterprise • Continually enhancing, customizing and Modernized Remote Deposit Capture leveraging Salesforce® throughout the Bank to expand client relationships, develop new Expanded Secure File Transmissions Platform business, data aggregation, and management reporting Voice Recognition Biometric Authentication Note: Zelle and Salesforce are registered trademarks of Early Warning Services LLC and Salesforce.com, Inc. © 2020 Pacific Premier Bancorp, Inc. | All rights reserved 7
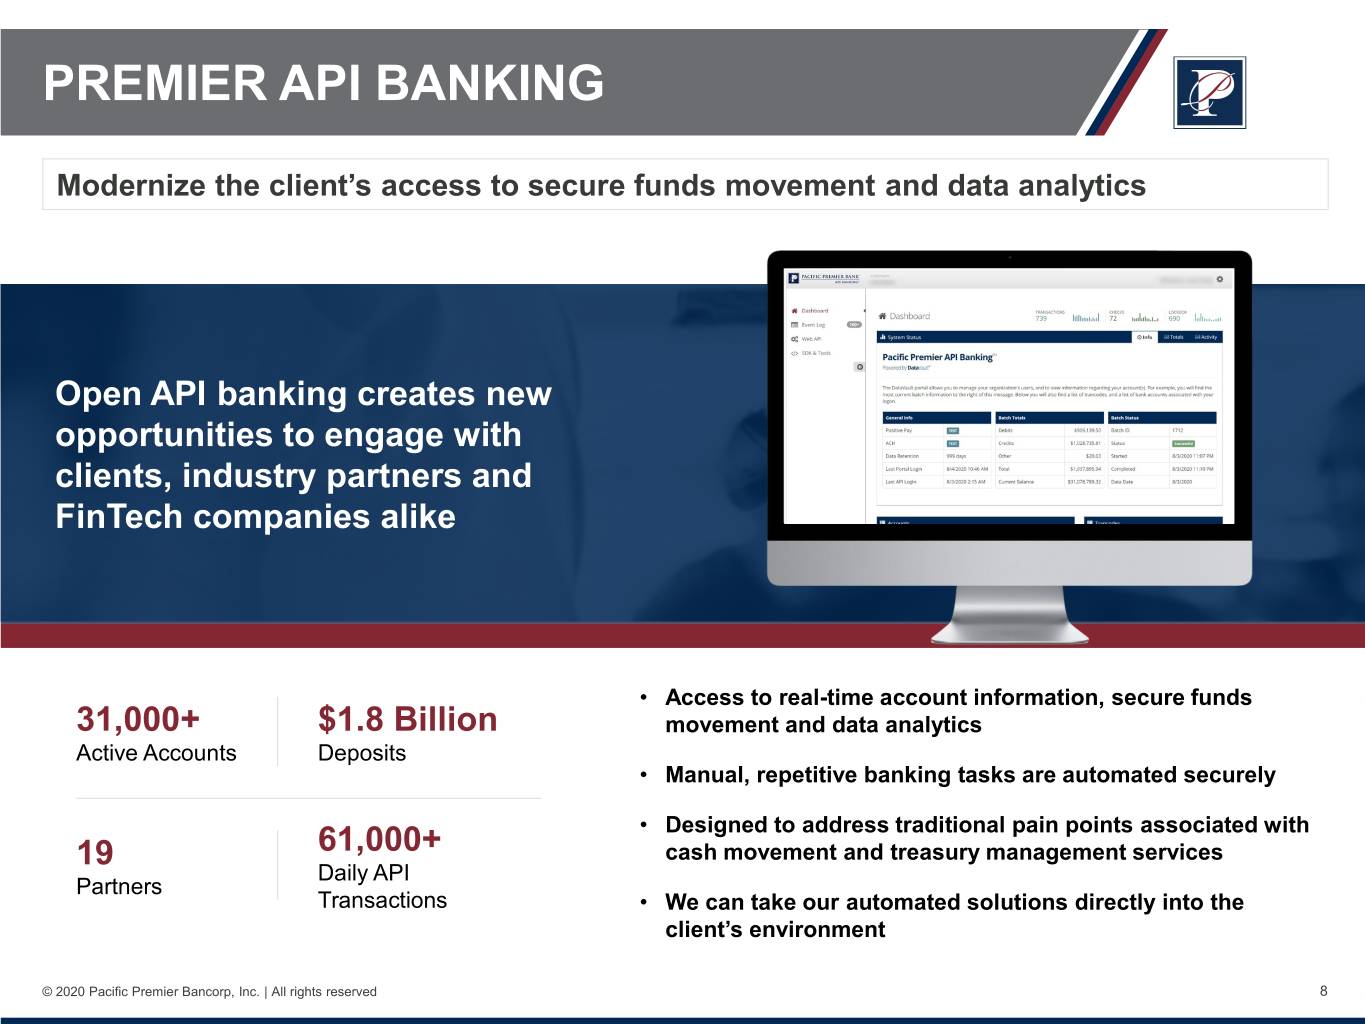
PREMIER API BANKING Modernize the client’s access to secure funds movement and data analytics Open API banking creates new opportunities to engage with clients, industry partners and FinTech companies alike • Access to real-time account information, secure funds 31,000+ $1.8 Billion movement and data analytics Active Accounts Deposits • Manual, repetitive banking tasks are automated securely • Designed to address traditional pain points associated with 61,000+ cash movement and treasury management services 19 Daily API Partners Transactions • We can take our automated solutions directly into the client’s environment © 2020 Pacific Premier Bancorp, Inc. | All rights reserved 8
DIVERSIFYING REVENUE Leading Custodian • Over thirty years experience as one of the country’s leading IRA custodians for alternative assets • Custodian for over 40,000 unique investments in private equity, real estate, debt instruments, and other non-exchange traded assets Opportunity to Scale • Over $15 billion in assets under custody, up approximately 5.8% year to date, with meaningful opportunity to expand over time • Nationwide business with a granular customer base – approximately 44,000 customer accounts Strong fee income • Consistent source of noninterest income through custodial account fees • Contributes approximately $28 million of noninterest income annually Attractive funding • Ancillary cash balances in customers’ accounts that are not invested in other assets • Approximately $1.3 billion of deposits at a 0.02% cost of deposits © 2020 Pacific Premier Bancorp, Inc. | All rights reserved 9
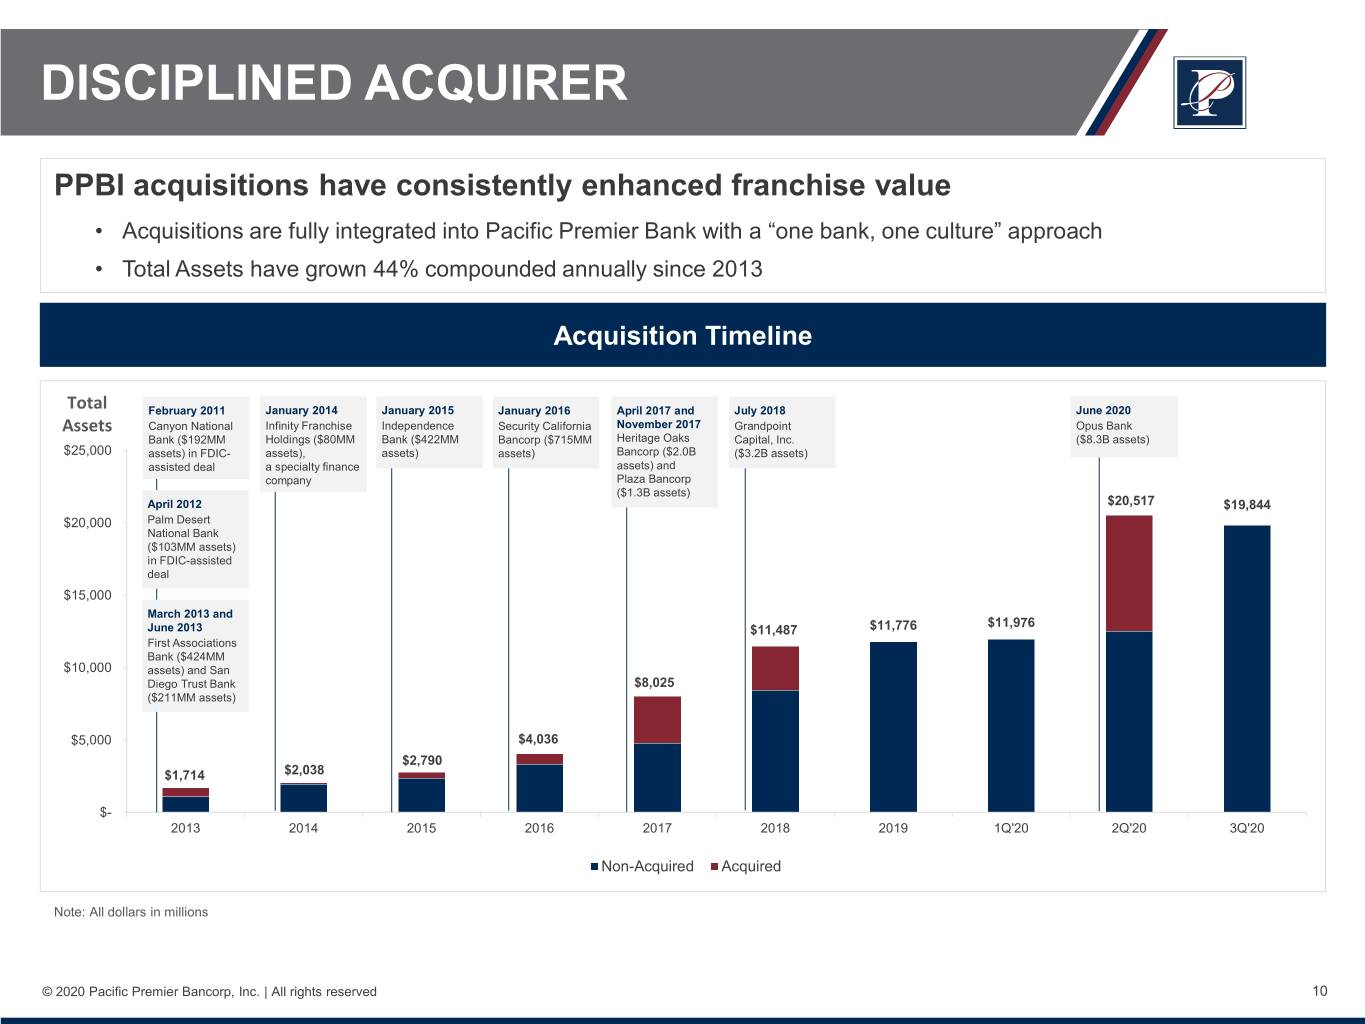
DISCIPLINED ACQUIRER PPBI acquisitions have consistently enhanced franchise value • Acquisitions are fully integrated into Pacific Premier Bank with a “one bank, one culture” approach • Total Assets have grown 44% compounded annually since 2013 Acquisition Timeline Total February 2011 January 2014 January 2015 January 2016 April 2017 and July 2018 June 2020 Assets Canyon National Infinity Franchise Independence Security California November 2017 Grandpoint Opus Bank Bank ($192MM Holdings ($80MM Bank ($422MM Bancorp ($715MM Heritage Oaks Capital, Inc. ($8.3B assets) $25,000 assets) in FDIC- assets), assets) assets) Bancorp ($2.0B ($3.2B assets) assisted deal a specialty finance assets) and company Plaza Bancorp ($1.3B assets) April 2012 $20,517 $19,844 $20,000 Palm Desert National Bank ($103MM assets) in FDIC-assisted deal $15,000 March 2013 and $11,976 June 2013 $11,487 $11,776 First Associations Bank ($424MM $10,000 assets) and San Diego Trust Bank $8,025 ($211MM assets) $5,000 $4,036 $2,790 $1,714 $2,038 $- 2013 2014 2015 2016 2017 2018 2019 1Q'20 2Q'20 3Q'20 Non-Acquired Acquired Note: All dollars in millions © 2020 Pacific Premier Bancorp, Inc. | All rights reserved 10
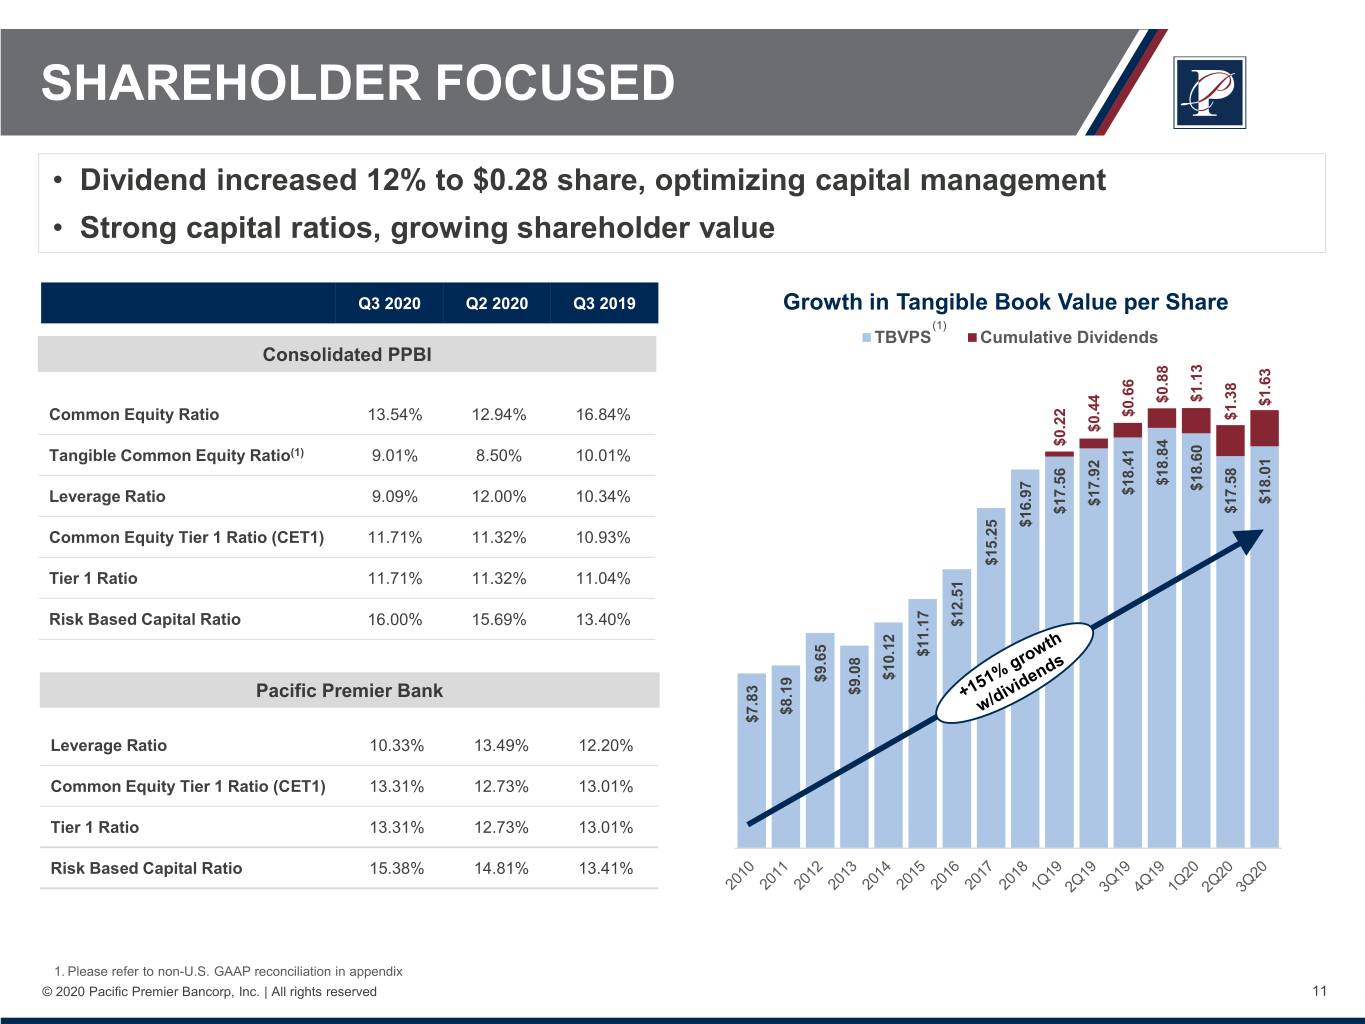
SHAREHOLDER FOCUSED • Dividend increased 12% to $0.28 share, optimizing capital management • Strong capital ratios, growing shareholder value Q3 2020 Q2 2020 Q3 2019 Growth in Tangible Book Value per Share (1) TBVPS Cumulative Dividends Consolidated PPBI $1.13 $0.88 $1.63 $0.66 Common Equity Ratio 13.54% 12.94% 16.84% $1.38 $0.44 $0.22 Tangible Common Equity Ratio(1) 9.01% 8.50% 10.01% $18.84 $18.60 $18.41 $18.01 Leverage Ratio 9.09% 12.00% 10.34% $17.92 $17.58 $17.56 $16.97 Common Equity Tier 1 Ratio (CET1) 11.71% 11.32% 10.93% $15.25 Tier 1 Ratio 11.71% 11.32% 11.04% Risk Based Capital Ratio 16.00% 15.69% 13.40% $12.51 $11.17 $10.12 $9.65 Pacific Premier Bank $9.08 $8.19 $7.83 Leverage Ratio 10.33% 13.49% 12.20% Common Equity Tier 1 Ratio (CET1) 13.31% 12.73% 13.01% Tier 1 Ratio 13.31% 12.73% 13.01% Risk Based Capital Ratio 15.38% 14.81% 13.41% 1. Please refer to non-U.S. GAAP reconciliation in appendix © 2020 Pacific Premier Bancorp, Inc. | All rights reserved 11
PPBI Q3 2020 Financial Overview
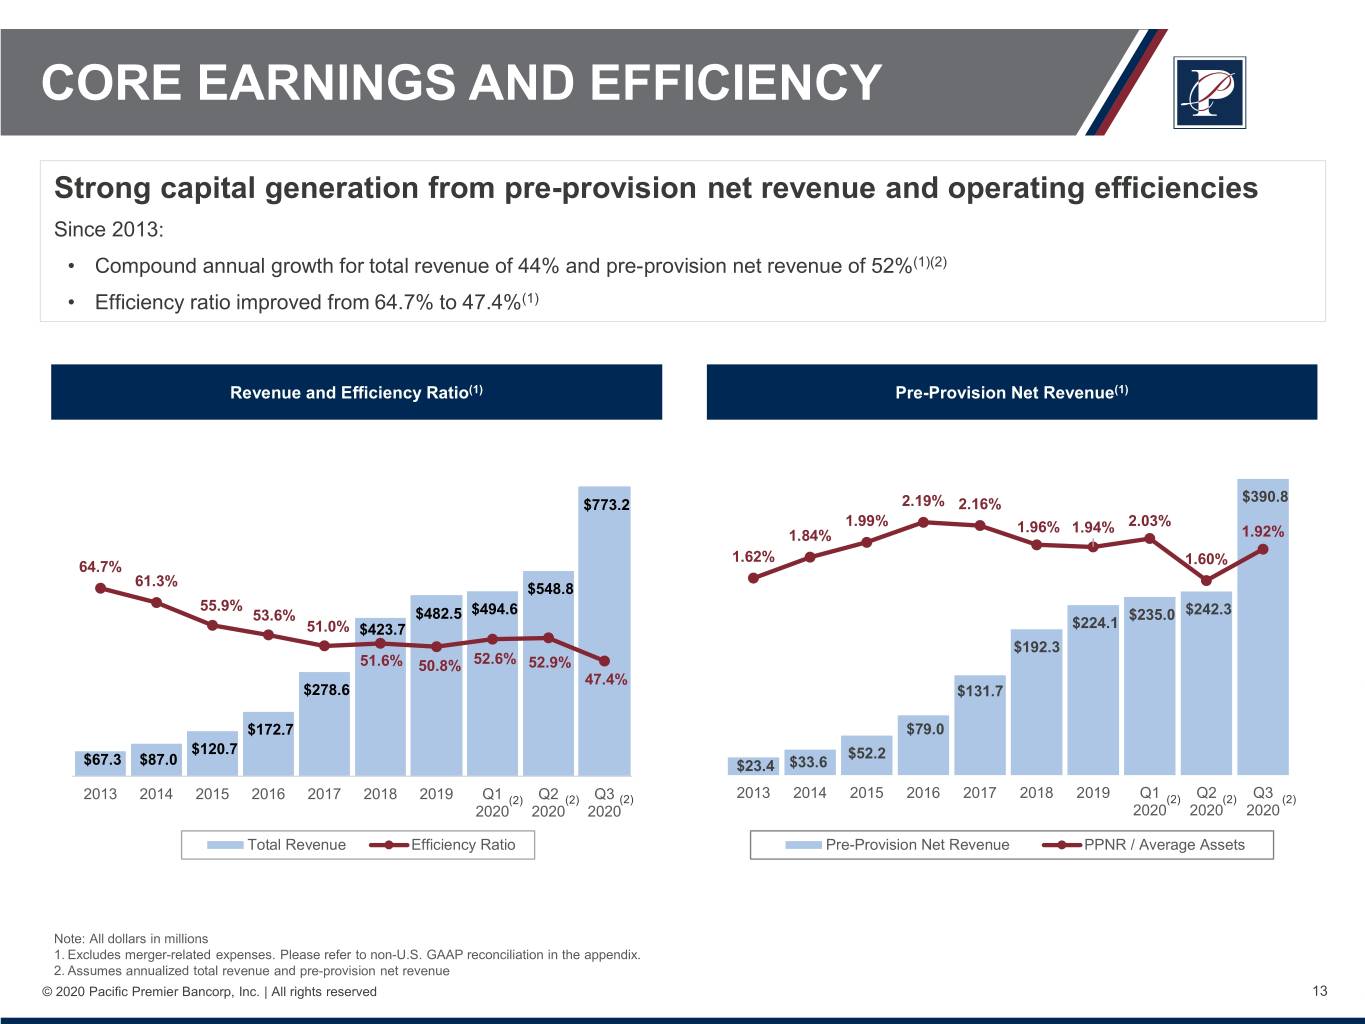
CORE EARNINGS AND EFFICIENCY Strong capital generation from pre-provision net revenue and operating efficiencies Since 2013: • Compound annual growth for total revenue of 44% and pre-provision net revenue of 52%(1)(2) • Efficiency ratio improved from 64.7% to 47.4%(1) Revenue and Efficiency Ratio(1) Pre-Provision Net Revenue(1) $390.8 $773.2 2.19% 2.16% 1.99% 1.96% 1.94% 2.03% 1.84% 1.92% 1.62% 1.60% 64.7% 61.3% $548.8 55.9% 53.6% $482.5 $494.6 $235.0 $242.3 51.0% $423.7 $224.1 $192.3 51.6% 50.8% 52.6% 52.9% 47.4% $278.6 $131.7 $172.7 $79.0 $120.7 $52.2 $67.3 $87.0 $23.4 $33.6 2013 2014 2015 2016 2017 2018 2019 Q1 (2) Q2 (2) Q3 (2) 2013 2014 2015 2016 2017 2018 2019 Q1 (2) Q2 (2) Q3 (2) 2020 2020 2020 2020 2020 2020 Total Revenue Efficiency Ratio Pre-Provision Net Revenue PPNR / Average Assets Note: All dollars in millions 1. Excludes merger-related expenses. Please refer to non-U.S. GAAP reconciliation in the appendix. 2. Assumes annualized total revenue and pre-provision net revenue © 2020 Pacific Premier Bancorp, Inc. | All rights reserved 13
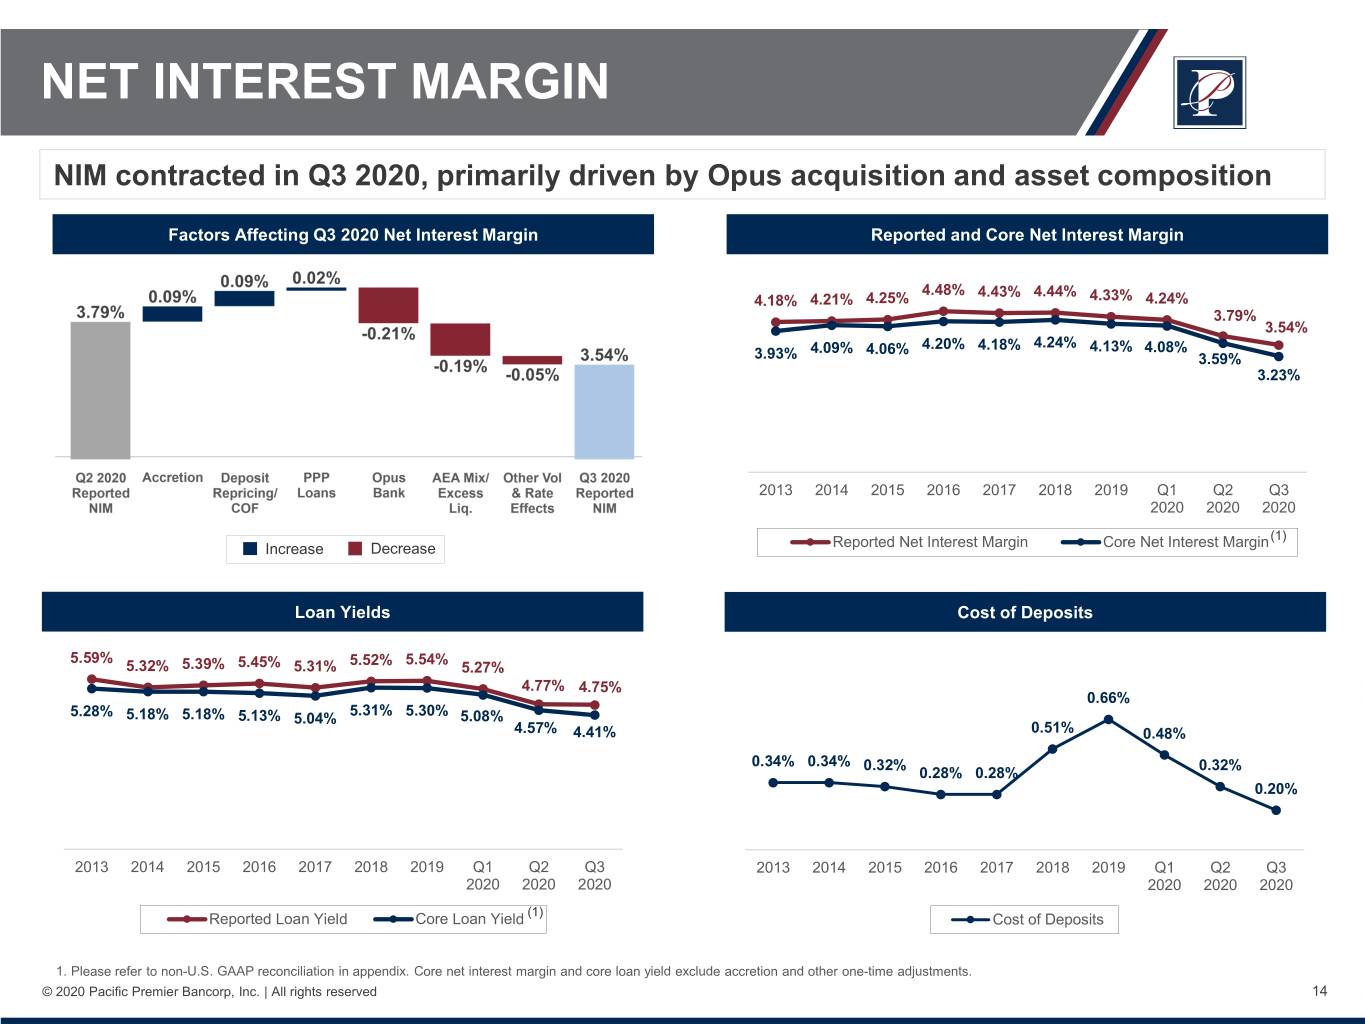
NET INTEREST MARGIN NIM contracted in Q3 2020, primarily driven by Opus acquisition and asset composition Factors Affecting Q3 2020 Net Interest Margin Reported and Core Net Interest Margin 4.48% 4.43% 4.44% 4.18% 4.21% 4.25% 4.33% 4.24% 3.79% 3.54% 4.09% 4.06% 4.20% 4.18% 4.24% 4.13% 4.08% 3.93% 3.59% 3.23% 2013 2014 2015 2016 2017 2018 2019 Q1 Q2 Q3 2020 2020 2020 (1) Increase Decrease Reported Net Interest Margin Core Net Interest Margin Loan Yields Cost of Deposits 5.59% 5.54% 5.32% 5.39% 5.45% 5.31% 5.52% 5.27% 4.77% 4.75% 0.66% 5.31% 5.30% 5.28% 5.18% 5.18% 5.13% 5.04% 5.08% 4.57% 4.41% 0.51% 0.48% 0.34% 0.34% 0.32% 0.32% 0.28% 0.28% 0.20% 2013 2014 2015 2016 2017 2018 2019 Q1 Q2 Q3 2013 2014 2015 2016 2017 2018 2019 Q1 Q2 Q3 2020 2020 2020 2020 2020 2020 (1) Reported Loan Yield Core Loan Yield Cost of Deposits 1. Please refer to non-U.S. GAAP reconciliation in appendix. Core net interest margin and core loan yield exclude accretion and other one-time adjustments. © 2020 Pacific Premier Bancorp, Inc. | All rights reserved 14
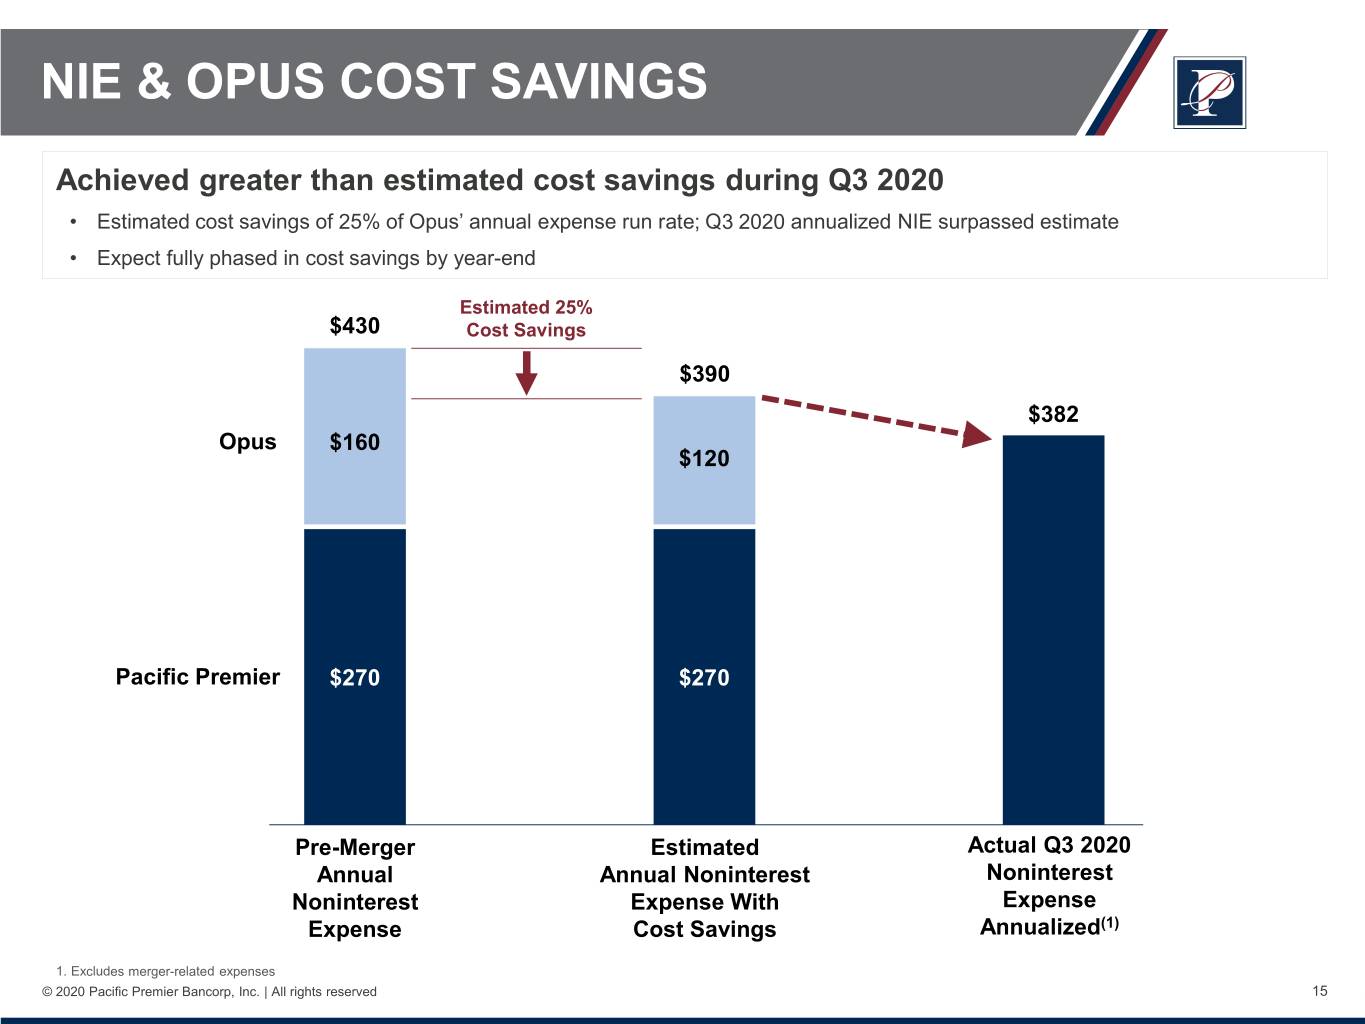
NIE & OPUS COST SAVINGS Achieved greater than estimated cost savings during Q3 2020 • Estimated cost savings of 25% of Opus’ annual expense run rate; Q3 2020 annualized NIE surpassed estimate • Expect fully phased in cost savings by year-end Estimated 25% $430 Cost Savings $390 $382 Opus $160 $120 Pacific Premier $270 $270 Pre-Merger Estimated Actual Q3 2020 Annual Annual Noninterest Noninterest Noninterest Expense With Expense Expense Cost Savings Annualized(1) 1. Excludes merger-related expenses © 2020 Pacific Premier Bancorp, Inc. | All rights reserved 15
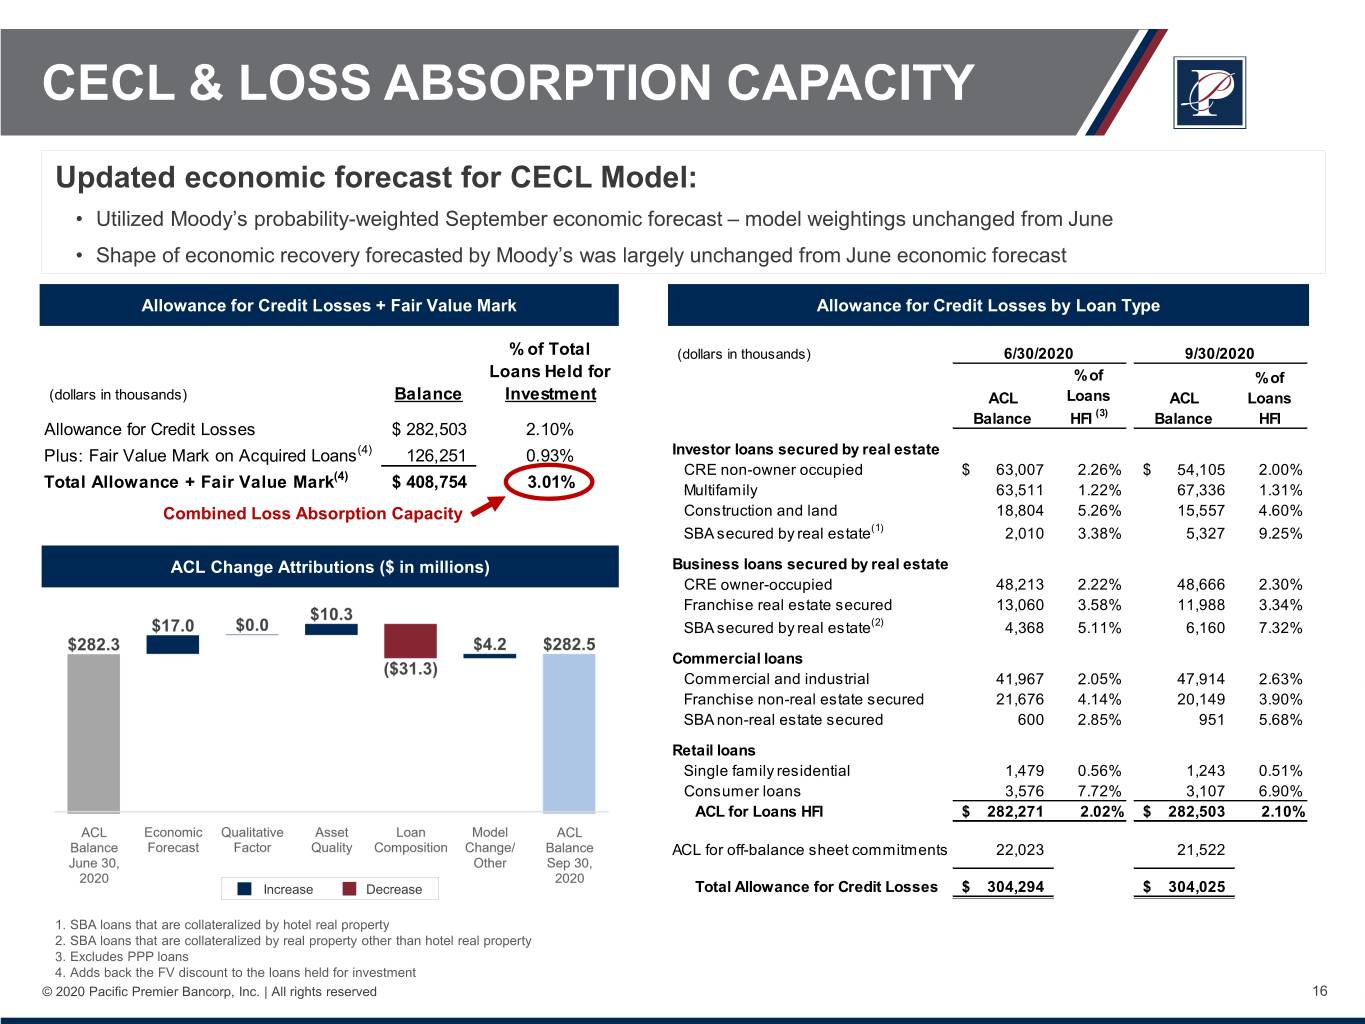
CECL & LOSS ABSORPTION CAPACITY Updated economic forecast for CECL Model: • Utilized Moody’s probability-weighted September economic forecast – model weightings unchanged from June • Shape of economic recovery forecasted by Moody’s was largely unchanged from June economic forecast Allowance for Credit Losses + Fair Value Mark Allowance for Credit Losses by Loan Type % of Total (dollars in thousands) 6/30/2020 9/30/2020 Loans Held for % of % of (dollars in thousands) Balance Investment ACL Loans ACL Loans Balance HFI (3) Balance HFI Allowance for Credit Losses $ 282,503 2.10% Plus: Fair Value Mark on Acquired Loans(4) 126,251 0.93% Investor loans secured by real estate (4) CRE non-owner occupied $ 63,007 2.26% $ 54,105 2.00% Total Allowance + Fair Value Mark $ 408,754 3.01% Multifamily 63,511 1.22% 67,336 1.31% Combined Loss Absorption Capacity Construction and land 18,804 5.26% 15,557 4.60% SBA secured by real estate(1) 2,010 3.38% 5,327 9.25% ACL Change Attributions ($ in millions) Business loans secured by real estate CRE owner-occupied 48,213 2.22% 48,666 2.30% Franchise real estate secured 13,060 3.58% 11,988 3.34% SBA secured by real estate(2) 4,368 5.11% 6,160 7.32% Commercial loans Commercial and industrial 41,967 2.05% 47,914 2.63% Franchise non-real estate secured 21,676 4.14% 20,149 3.90% SBA non-real estate secured 600 2.85% 951 5.68% Retail loans Single family residential 1,479 0.56% 1,243 0.51% Consumer loans 3,576 7.72% 3,107 6.90% ACL for Loans HFI $ 282,271 2.02% $ 282,503 2.10% ACL for off-balance sheet commitments 22,023 21,522 Increase Decrease Total Allowance for Credit Losses $ 304,294 $ 304,025 1. SBA loans that are collateralized by hotel real property 2. SBA loans that are collateralized by real property other than hotel real property 3. Excludes PPP loans 4. Adds back the FV discount to the loans held for investment © 2020 Pacific Premier Bancorp, Inc. | All rights reserved 16
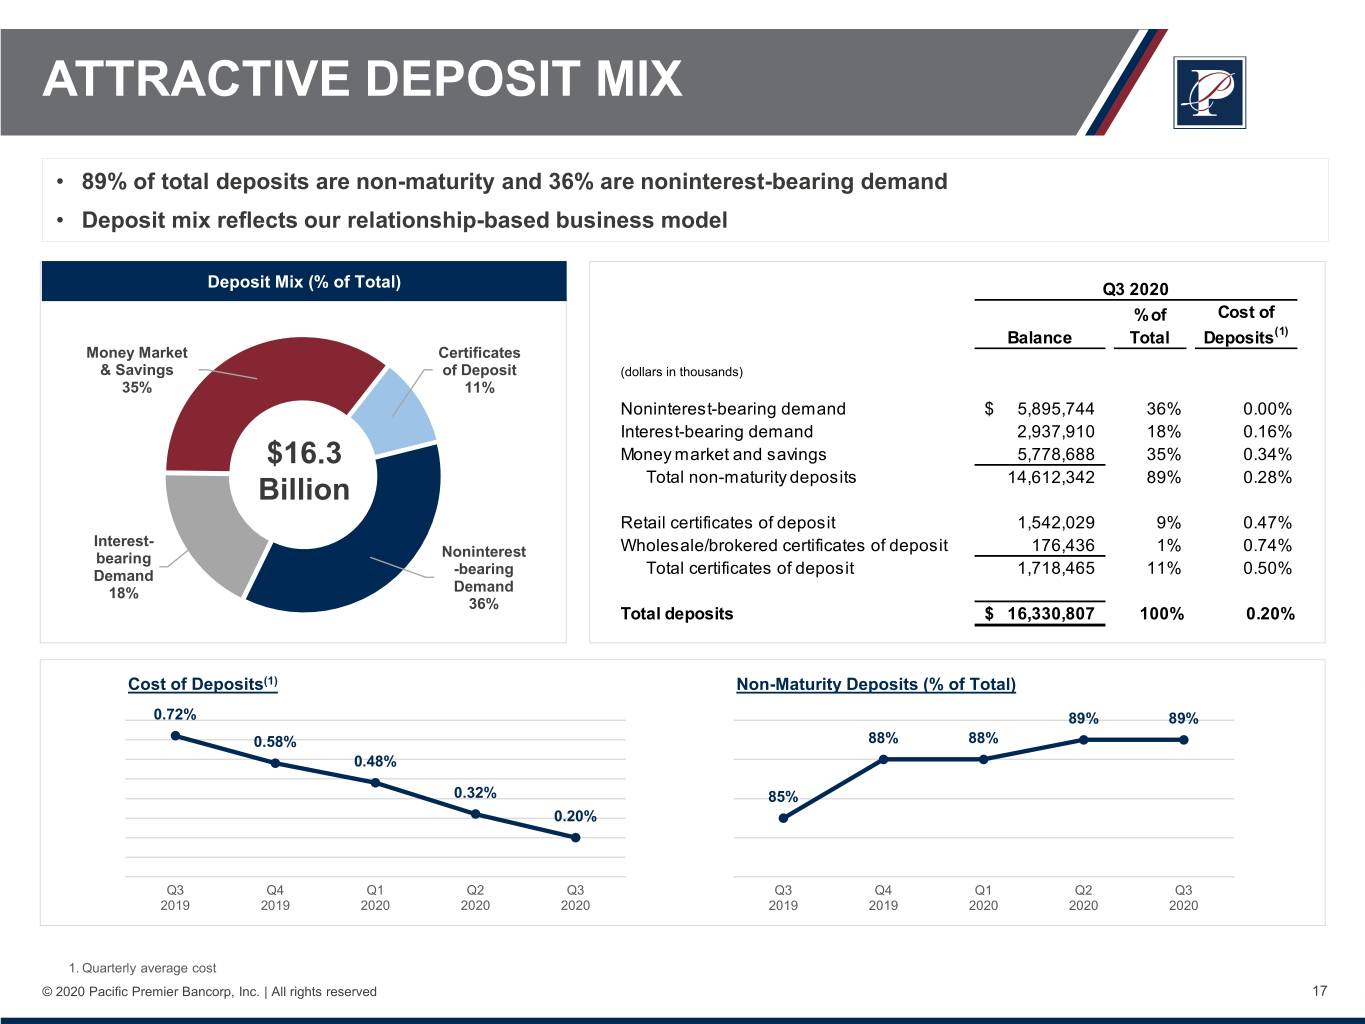
ATTRACTIVE DEPOSIT MIX • 89% of total deposits are non-maturity and 36% are noninterest-bearing demand • Deposit mix reflects our relationship-based business model Deposit Mix (% of Total) Q3 2020 % of Cost of Balance Total Deposits(1) Money Market Certificates & Savings of Deposit (dollars in thousands) 35% 11% Noninterest-bearing demand $ 5,895,744 36% 0.00% Interest-bearing demand 2,937,910 18% 0.16% $16.3 Money market and savings 5,778,688 35% 0.34% Total non-maturity deposits 14,612,342 89% 0.28% Billion Retail certificates of deposit 1,542,029 9% 0.47% Interest- Wholesale/brokered certificates of deposit 176,436 1% 0.74% bearing Noninterest Demand -bearing Total certificates of deposit 1,718,465 11% 0.50% 18% Demand 36% Total deposits $ 16,330,807 100% 0.20% Cost of Deposits(1) Non-Maturity Deposits (% of Total) 0.72% 89% 89% 0.58% 88% 88% 0.48% 0.32% 85% 0.20% Q3 Q4 Q1 Q2 Q3 Q3 Q4 Q1 Q2 Q3 2019 2019 2020 2020 2020 2019 2019 2020 2020 2020 1. Quarterly average cost © 2020 Pacific Premier Bancorp, Inc. | All rights reserved 17
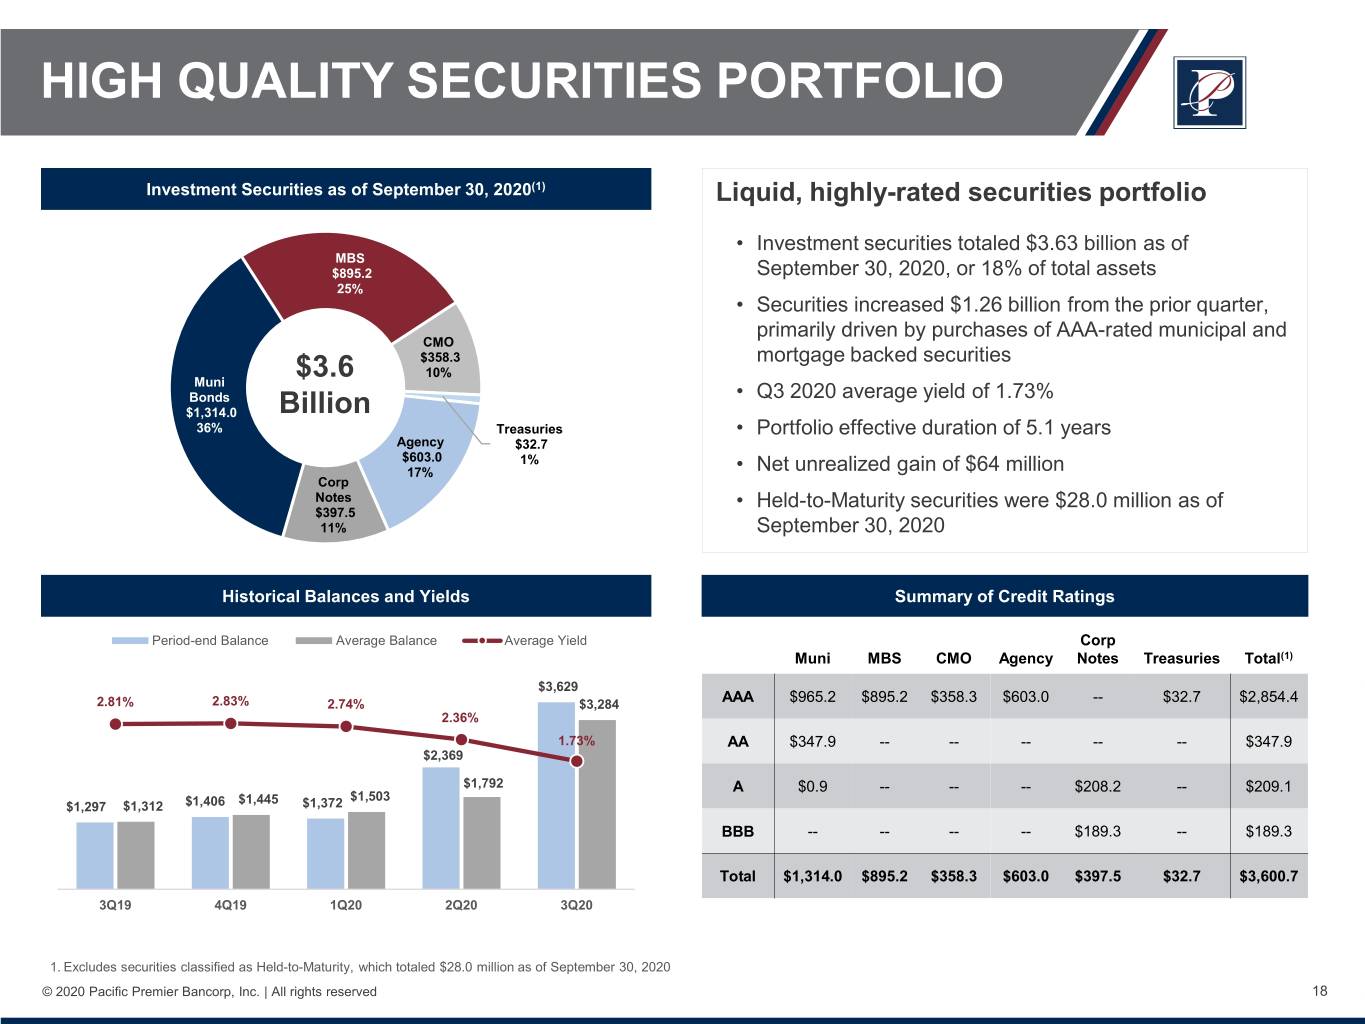
HIGH QUALITY SECURITIES PORTFOLIO Investment Securities as of September 30, 2020(1) Liquid, highly-rated securities portfolio • Investment securities totaled $3.63 billion as of MBS $895.2 September 30, 2020, or 18% of total assets 25% • Securities increased $1.26 billion from the prior quarter, primarily driven by purchases of AAA-rated municipal and CMO $358.3 mortgage backed securities 10% Muni $3.6 Bonds • Q3 2020 average yield of 1.73% $1,314.0 Billion 36% Treasuries • Portfolio effective duration of 5.1 years Agency $32.7 $603.0 1% 17% • Net unrealized gain of $64 million Corp Notes • Held-to-Maturity securities were $28.0 million as of $397.5 11% September 30, 2020 Historical Balances and Yields Summary of Credit Ratings Period-end Balance Average Balance Average Yield Corp Muni MBS CMO Agency Notes Treasuries Total(1) $3,629 $965.2 $895.2 $358.3 $603.0 -- $32.7 $2,854.4 2.81% 2.83% 2.74% $3,284 AAA 2.36% 1.73% AA $347.9 -- -- -- -- -- $347.9 $2,369 $1,792 A $0.9 -- -- -- $208.2 -- $209.1 $1,445 $1,503 $1,297 $1,312 $1,406 $1,372 BBB -- -- -- -- $189.3 -- $189.3 Total $1,314.0 $895.2 $358.3 $603.0 $397.5 $32.7 $3,600.7 3Q19 4Q19 1Q20 2Q20 3Q20 1. Excludes securities classified as Held-to-Maturity, which totaled $28.0 million as of September 30, 2020 © 2020 Pacific Premier Bancorp, Inc. | All rights reserved 18
Loan Portfolio and Credit Quality
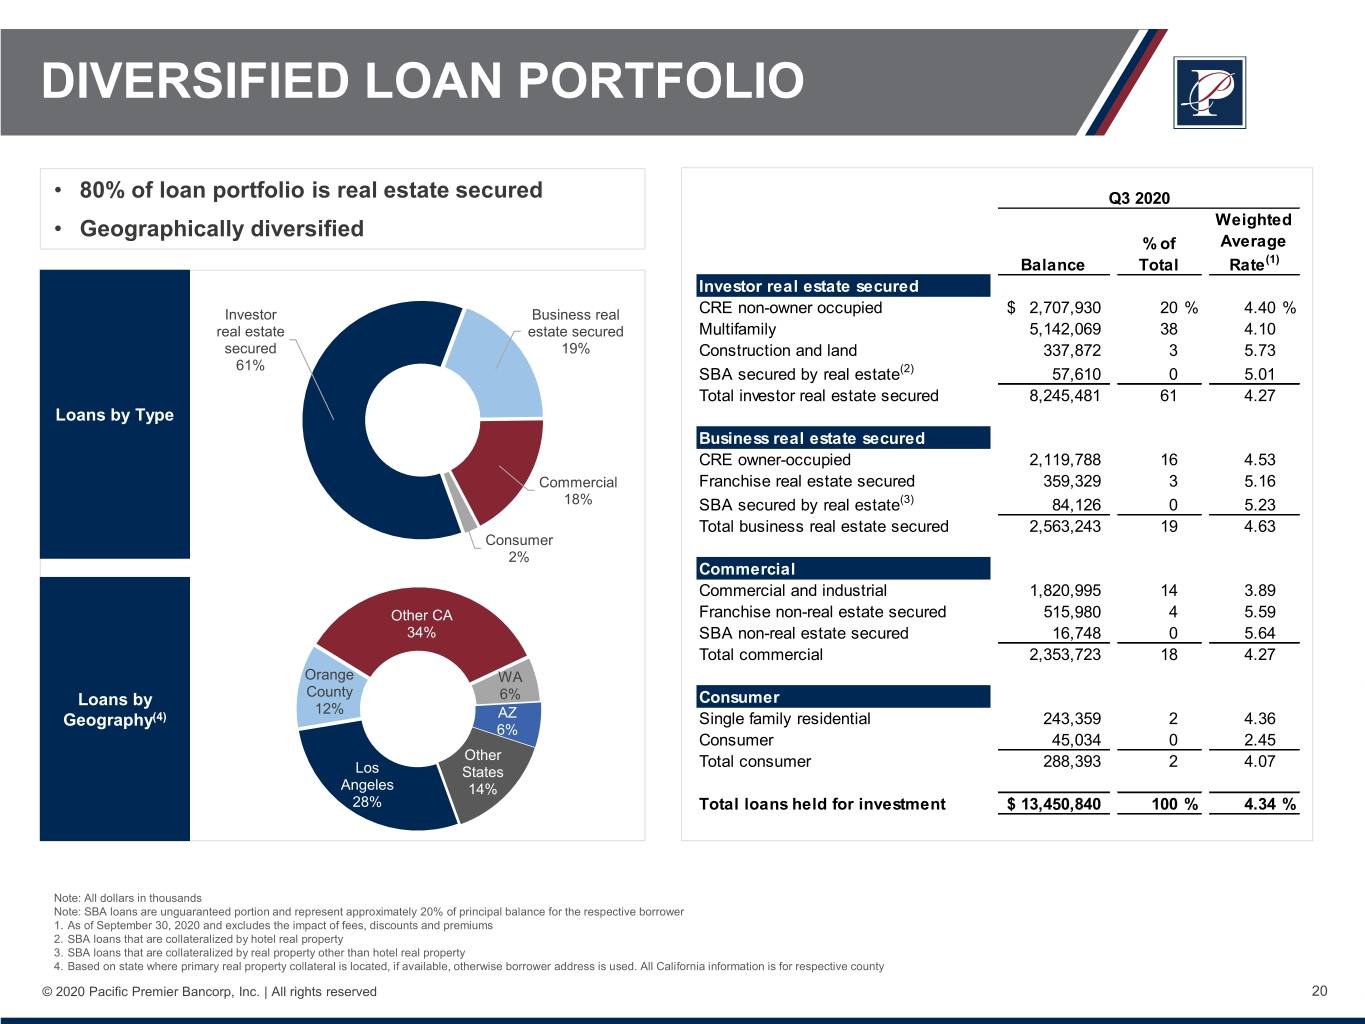
DIVERSIFIED LOAN PORTFOLIO • 80% of loan portfolio is real estate secured Q3 2020 • Geographically diversified Weighted % of Average Balance Total Rate(1) Investor real estate secured Investor Business real CRE non-owner occupied $ 2,707,930 20 % 4.40 % real estate estate secured Multifamily 5,142,069 38 4.10 secured 19% Construction and land 337,872 3 5.73 61% SBA secured by real estate(2) 57,610 0 5.01 Total investor real estate secured 8,245,481 61 4.27 Loans by Type Business real estate secured CRE owner-occupied 2,119,788 16 4.53 Commercial Franchise real estate secured 359,329 3 5.16 18% SBA secured by real estate(3) 84,126 0 5.23 Total business real estate secured 2,563,243 19 4.63 Consumer 2% Commercial Commercial and industrial 1,820,995 14 3.89 Other CA Franchise non-real estate secured 515,980 4 5.59 34% SBA non-real estate secured 16,748 0 5.64 Total commercial 2,353,723 18 4.27 Orange WA County 6% Consumer Loans by 12% Geography(4) AZ Single family residential 243,359 2 4.36 6% Consumer 45,034 0 2.45 Other Total consumer 288,393 2 4.07 Los States Angeles 14% 28% Total loans held for investment $ 13,450,840 100 % 4.34 % Note: All dollars in thousands Note: SBA loans are unguaranteed portion and represent approximately 20% of principal balance for the respective borrower 1. As of September 30, 2020 and excludes the impact of fees, discounts and premiums 2. SBA loans that are collateralized by hotel real property 3. SBA loans that are collateralized by real property other than hotel real property 4. Based on state where primary real property collateral is located, if available, otherwise borrower address is used. All California information is for respective county © 2020 Pacific Premier Bancorp, Inc. | All rights reserved 20
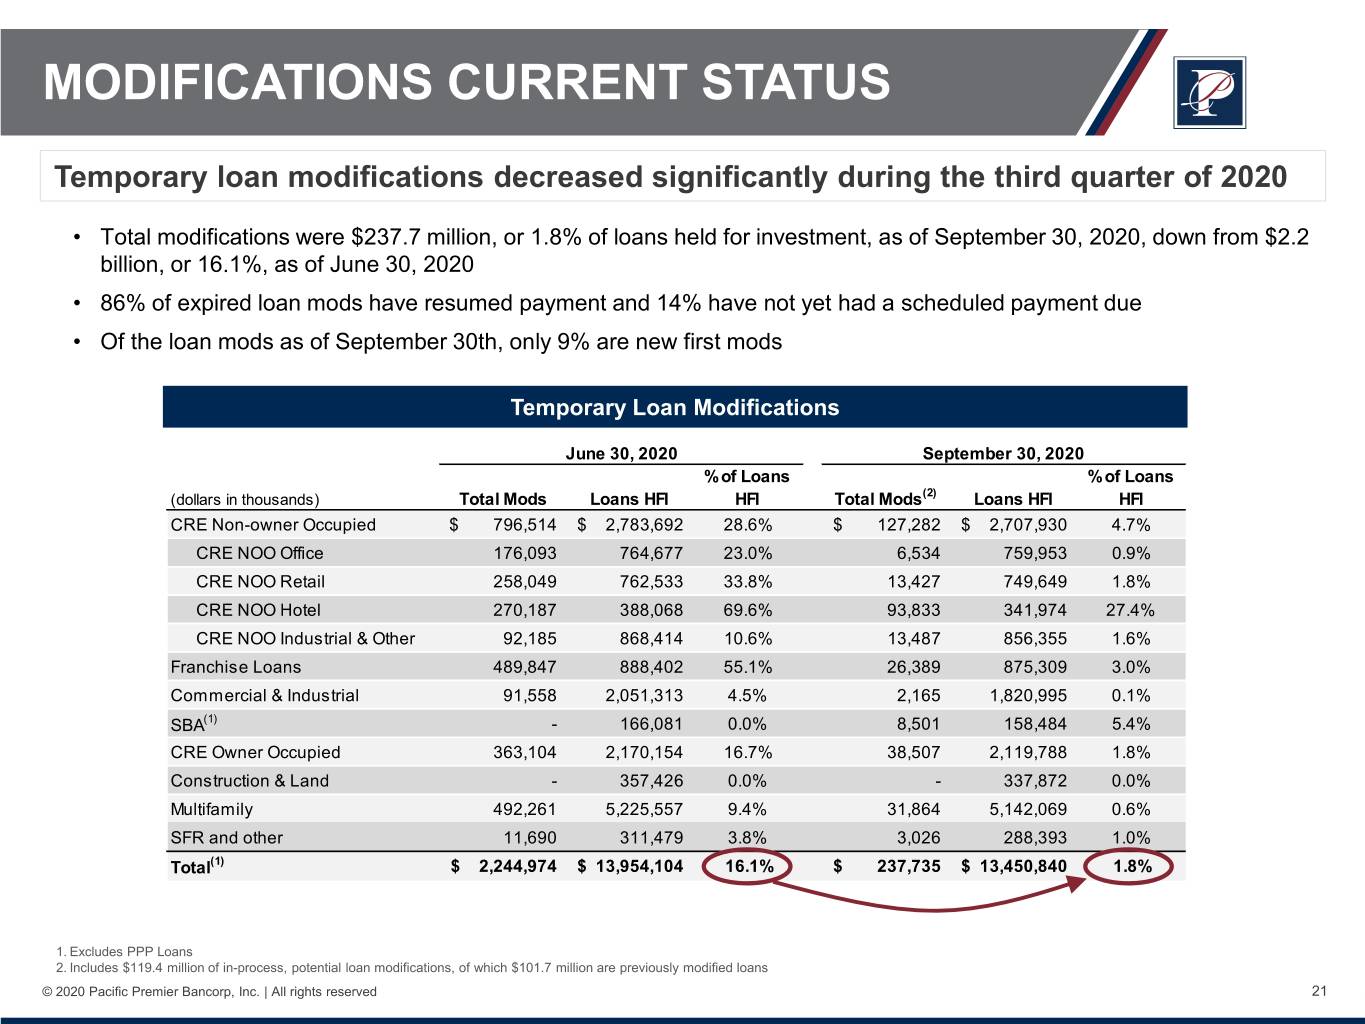
MODIFICATIONS CURRENT STATUS Temporary loan modifications decreased significantly during the third quarter of 2020 • Total modifications were $237.7 million, or 1.8% of loans held for investment, as of September 30, 2020, down from $2.2 billion, or 16.1%, as of June 30, 2020 • 86% of expired loan mods have resumed payment and 14% have not yet had a scheduled payment due • Of the loan mods as of September 30th, only 9% are new first mods Temporary Loan Modifications June 30, 2020 September 30, 2020 % of Loans % of Loans (dollars in thousands) Total Mods Loans HFI HFI Total Mods(2) Loans HFI HFI CRE Non-owner Occupied $ 796,514 $ 2,783,692 28.6% $ 127,282 $ 2,707,930 4.7% CRE NOO Office 176,093 764,677 23.0% 6,534 759,953 0.9% CRE NOO Retail 258,049 762,533 33.8% 13,427 749,649 1.8% CRE NOO Hotel 270,187 388,068 69.6% 93,833 341,974 27.4% CRE NOO Industrial & Other 92,185 868,414 10.6% 13,487 856,355 1.6% Franchise Loans 489,847 888,402 55.1% 26,389 875,309 3.0% Commercial & Industrial 91,558 2,051,313 4.5% 2,165 1,820,995 0.1% SBA(1) - 166,081 0.0% 8,501 158,484 5.4% CRE Owner Occupied 363,104 2,170,154 16.7% 38,507 2,119,788 1.8% Construction & Land - 357,426 0.0% - 337,872 0.0% Multifamily 492,261 5,225,557 9.4% 31,864 5,142,069 0.6% SFR and other 11,690 311,479 3.8% 3,026 288,393 1.0% Total(1) $ 2,244,974 $ 13,954,104 16.1% $ 237,735 $ 13,450,840 1.8% 1. Excludes PPP Loans 2. Includes $119.4 million of in-process, potential loan modifications, of which $101.7 million are previously modified loans © 2020 Pacific Premier Bancorp, Inc. | All rights reserved 21
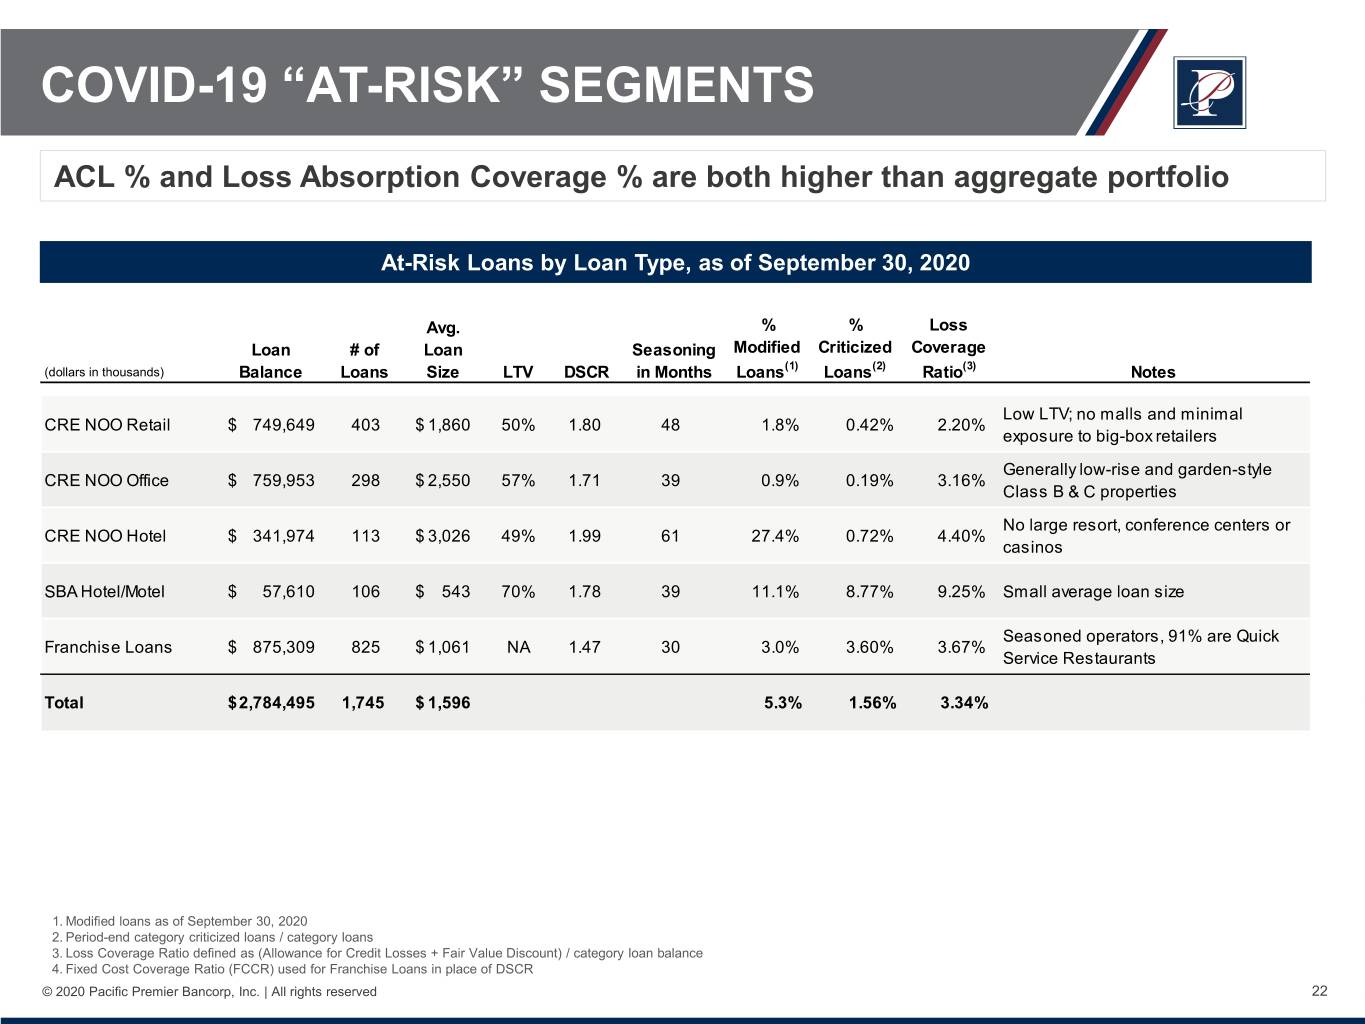
COVID-19 “AT-RISK” SEGMENTS ACL % and Loss Absorption Coverage % are both higher than aggregate portfolio At-Risk Loans by Loan Type, as of September 30, 2020 Avg. % % Loss Loan # of Loan Seasoning Modified Criticized Coverage (dollars in thousands) Balance Loans Size LTV DSCR in Months Loans(1) Loans(2) Ratio(3) Notes Low LTV; no malls and minimal CRE NOO Retail $ 749,649 403 $ 1,860 50% 1.80 48 1.8% 0.42% 2.20% exposure to big-box retailers Generally low-rise and garden-style CRE NOO Office $ 759,953 298 $ 2,550 57% 1.71 39 0.9% 0.19% 3.16% Class B & C properties No large resort, conference centers or CRE NOO Hotel $ 341,974 113 $ 3,026 49% 1.99 61 27.4% 0.72% 4.40% casinos SBA Hotel/Motel $ 57,610 106 $ 543 70% 1.78 39 11.1% 8.77% 9.25% Small average loan size (4) Seasoned operators, 91% are Quick Franchise Loans $ 875,309 825 $ 1,061 NA 1.47 30 3.0% 3.60% 3.67% Service Restaurants Total $ 2,784,495 1,745 $ 1,596 5.3% 1.56% 3.34% 1. Modified loans as of September 30, 2020 2. Period-end category criticized loans / category loans 3. Loss Coverage Ratio defined as (Allowance for Credit Losses + Fair Value Discount) / category loan balance 4. Fixed Cost Coverage Ratio (FCCR) used for Franchise Loans in place of DSCR © 2020 Pacific Premier Bancorp, Inc. | All rights reserved 22
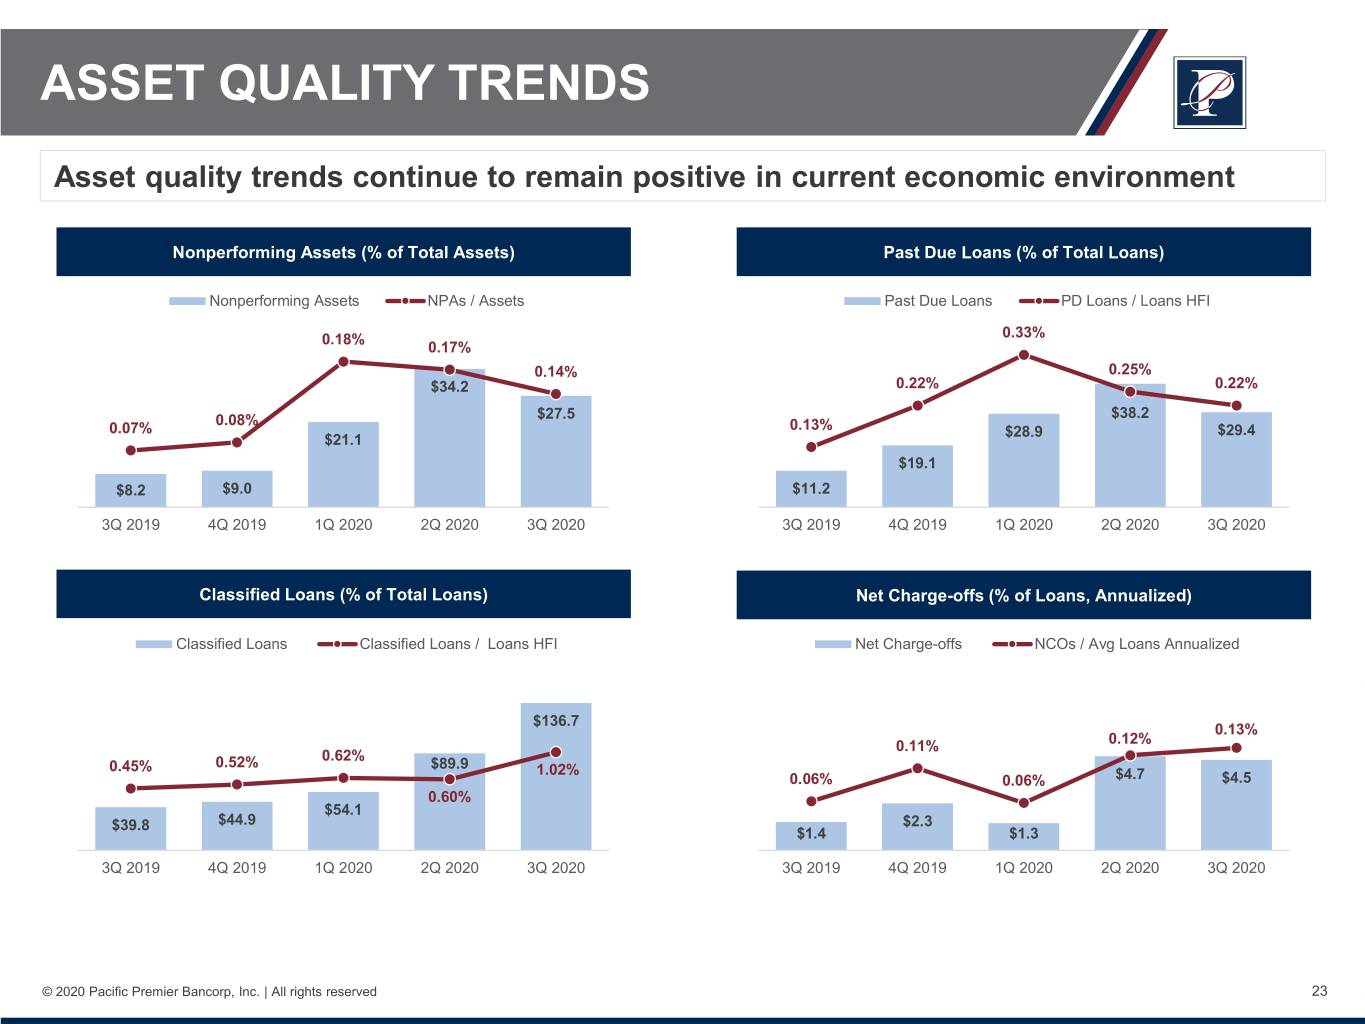
ASSET QUALITY TRENDS Asset quality trends continue to remain positive in current economic environment Nonperforming Assets (% of Total Assets) Past Due Loans (% of Total Loans) Nonperforming Assets NPAs / Assets Past Due Loans PD Loans / Loans HFI 0.18% 0.33% 0.17% 0.14% 0.25% $34.2 0.22% 0.22% 0.08% $27.5 $38.2 0.07% 0.13% $28.9 $29.4 $21.1 $19.1 $8.2 $9.0 $11.2 3Q 2019 4Q 2019 1Q 2020 2Q 2020 3Q 2020 3Q 2019 4Q 2019 1Q 2020 2Q 2020 3Q 2020 Classified Loans (% of Total Loans) Net Charge-offs (% of Loans, Annualized) Classified Loans Classified Loans / Loans HFI Net Charge-offs NCOs / Avg Loans Annualized $136.7 0.13% 0.11% 0.12% 0.62% 0.45% 0.52% $89.9 1.02% 0.06% 0.06% $4.7 $4.5 0.60% $54.1 $39.8 $44.9 $2.3 $1.4 $1.3 3Q 2019 4Q 2019 1Q 2020 2Q 2020 3Q 2020 3Q 2019 4Q 2019 1Q 2020 2Q 2020 3Q 2020 © 2020 Pacific Premier Bancorp, Inc. | All rights reserved 23
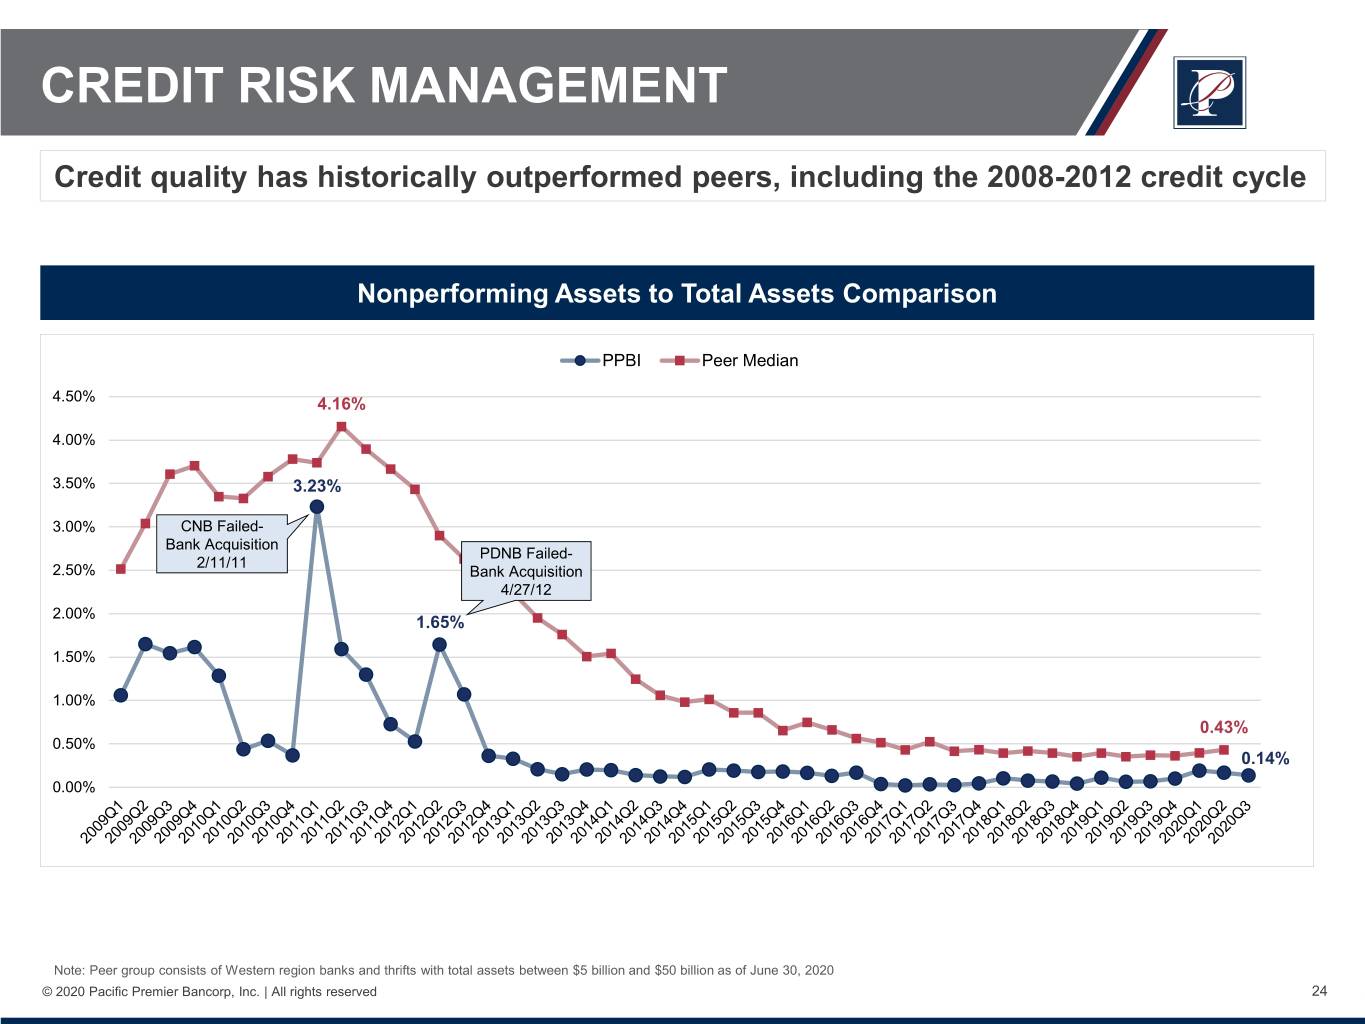
CREDIT RISK MANAGEMENT Credit quality has historically outperformed peers, including the 2008-2012 credit cycle Nonperforming Assets to Total Assets Comparison PPBI Peer Median 4.50% 4.16% 4.00% 3.50% 3.23% 3.00% CNB Failed- Bank Acquisition PDNB Failed- 2/11/11 2.50% Bank Acquisition 4/27/12 2.00% 1.65% 1.50% 1.00% 0.43% 0.50% 0.14% 0.00% Note: Peer group consists of Western region banks and thrifts with total assets between $5 billion and $50 billion as of June 30, 2020 © 2020 Pacific Premier Bancorp, Inc. | All rights reserved 24
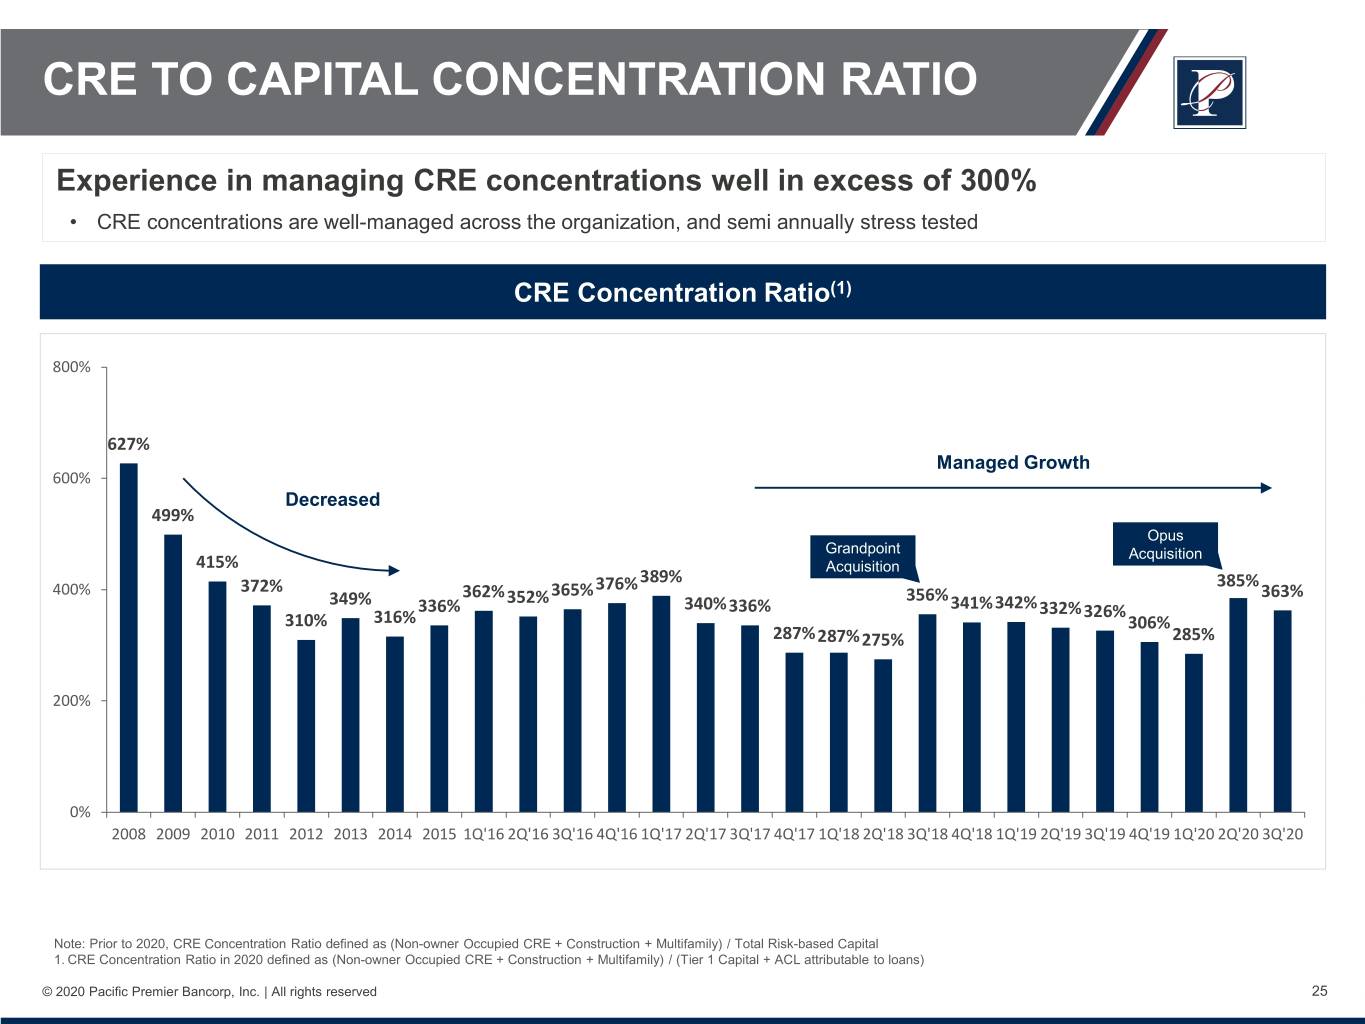
CRE TO CAPITAL CONCENTRATION RATIO Experience in managing CRE concentrations well in excess of 300% • CRE concentrations are well-managed across the organization, and semi annually stress tested CRE Concentration Ratio(1) 800% 627% Managed Growth 600% Decreased 499% Opus Grandpoint Acquisition 415% Acquisition 389% 400% 372% 376% 385% 349% 362%352%365% 356% 363% 336% 340%336% 341%342%332%326% 310% 316% 306% 287%287%275% 285% 200% 0% 2008 2009 2010 2011 2012 2013 2014 2015 1Q'16 2Q'16 3Q'16 4Q'16 1Q'17 2Q'17 3Q'17 4Q'17 1Q'18 2Q'18 3Q'18 4Q'18 1Q'19 2Q'19 3Q'19 4Q'19 1Q'20 2Q'20 3Q'20 Note: Prior to 2020, CRE Concentration Ratio defined as (Non-owner Occupied CRE + Construction + Multifamily) / Total Risk-based Capital 1. CRE Concentration Ratio in 2020 defined as (Non-owner Occupied CRE + Construction + Multifamily) / (Tier 1 Capital + ACL attributable to loans) © 2020 Pacific Premier Bancorp, Inc. | All rights reserved 25

PPBI’s Key Attributes
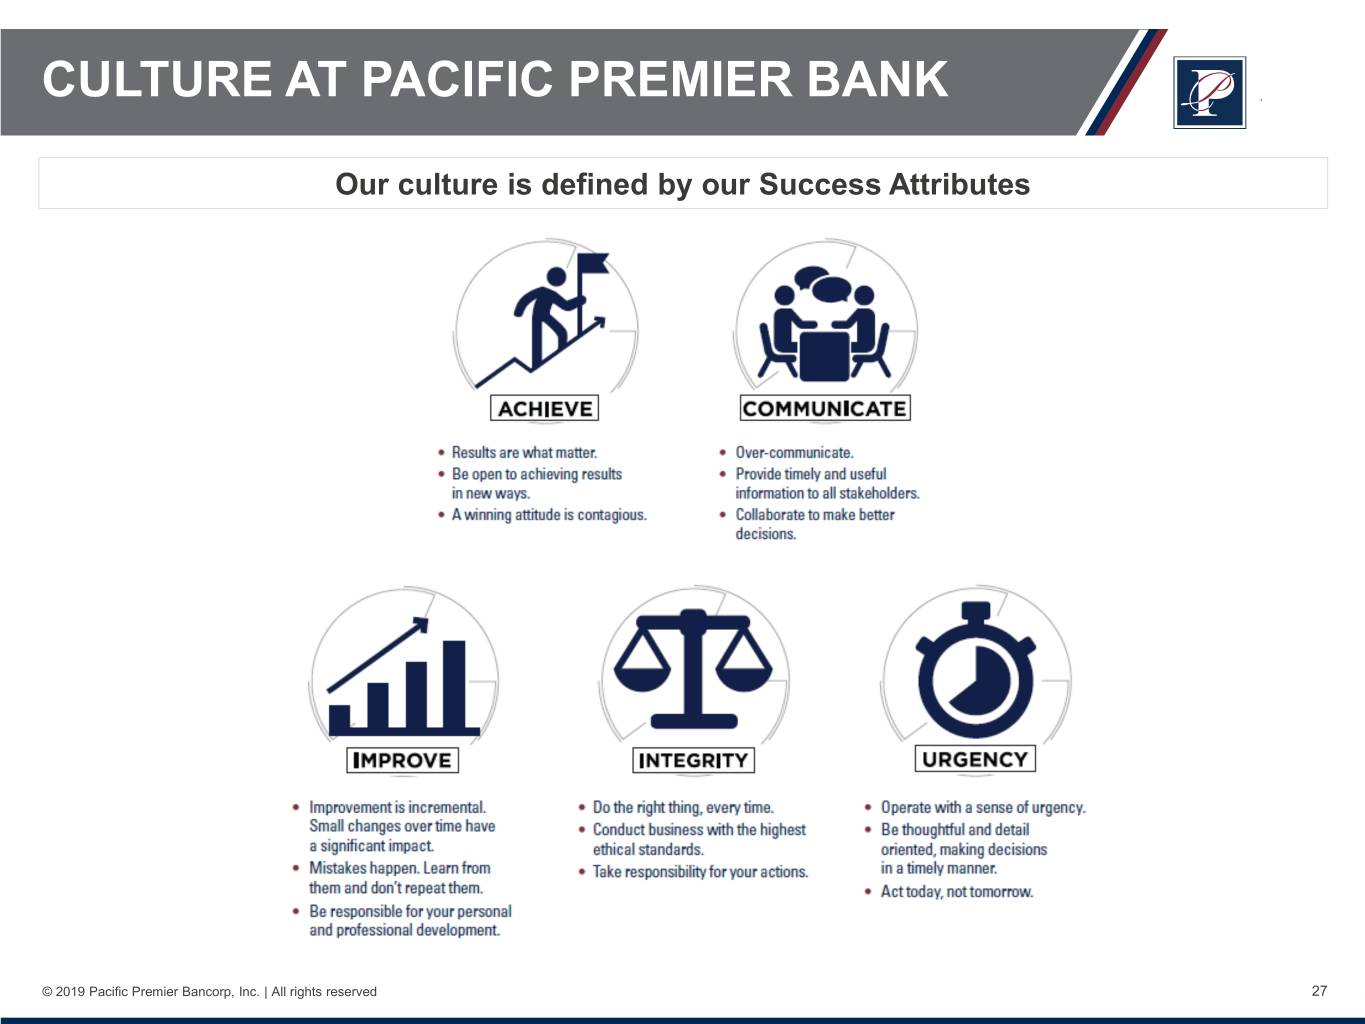
CULTURE AT PACIFIC PREMIER BANK Our culture is defined by our Success Attributes © 2019 Pacific Premier Bancorp, Inc. | All rights reserved 27
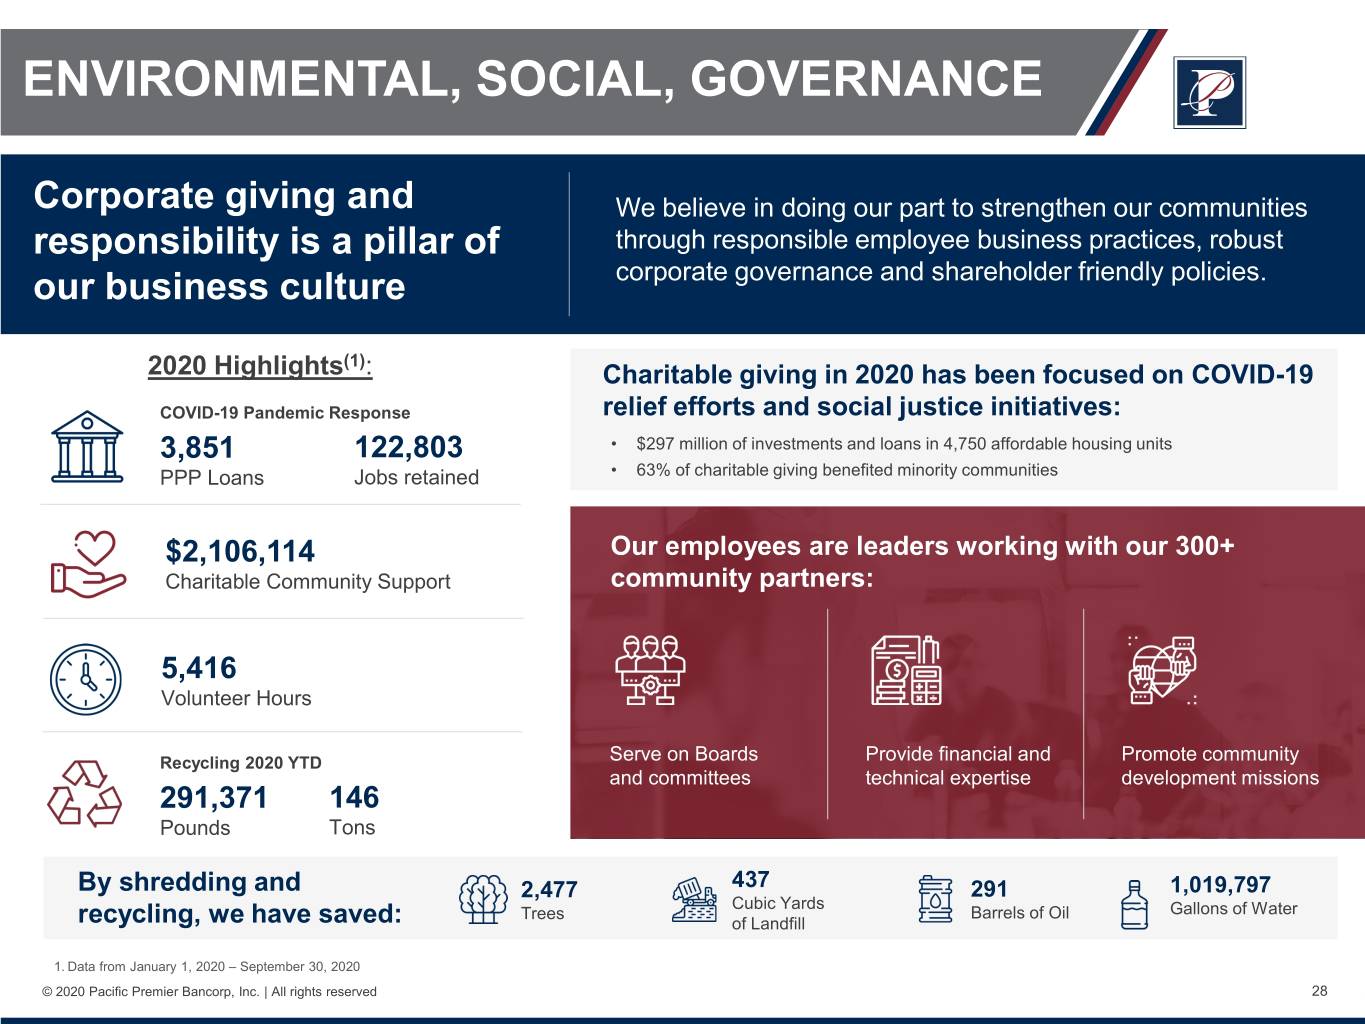
ENVIRONMENTAL, SOCIAL, GOVERNANCE Corporate giving and We believe in doing our part to strengthen our communities responsibility is a pillar of through responsible employee business practices, robust our business culture corporate governance and shareholder friendly policies. (1) 2020 Highlights : Charitable giving in 2020 has been focused on COVID-19 COVID-19 Pandemic Response relief efforts and social justice initiatives: 3,851 122,803 • $297 million of investments and loans in 4,750 affordable housing units PPP Loans Jobs retained • 63% of charitable giving benefited minority communities $2,106,114 Our employees are leaders working with our 300+ Charitable Community Support community partners: 5,416 Volunteer Hours Recycling 2020 YTD Serve on Boards Provide financial and Promote community and committees technical expertise development missions 291,371 146 Pounds Tons By shredding and 2,477 437 291 1,019,797 Cubic Yards Trees Barrels of Oil Gallons of Water recycling, we have saved: of Landfill 1. Data from January 1, 2020 – September 30, 2020 © 2020 Pacific Premier Bancorp, Inc. | All rights reserved 28
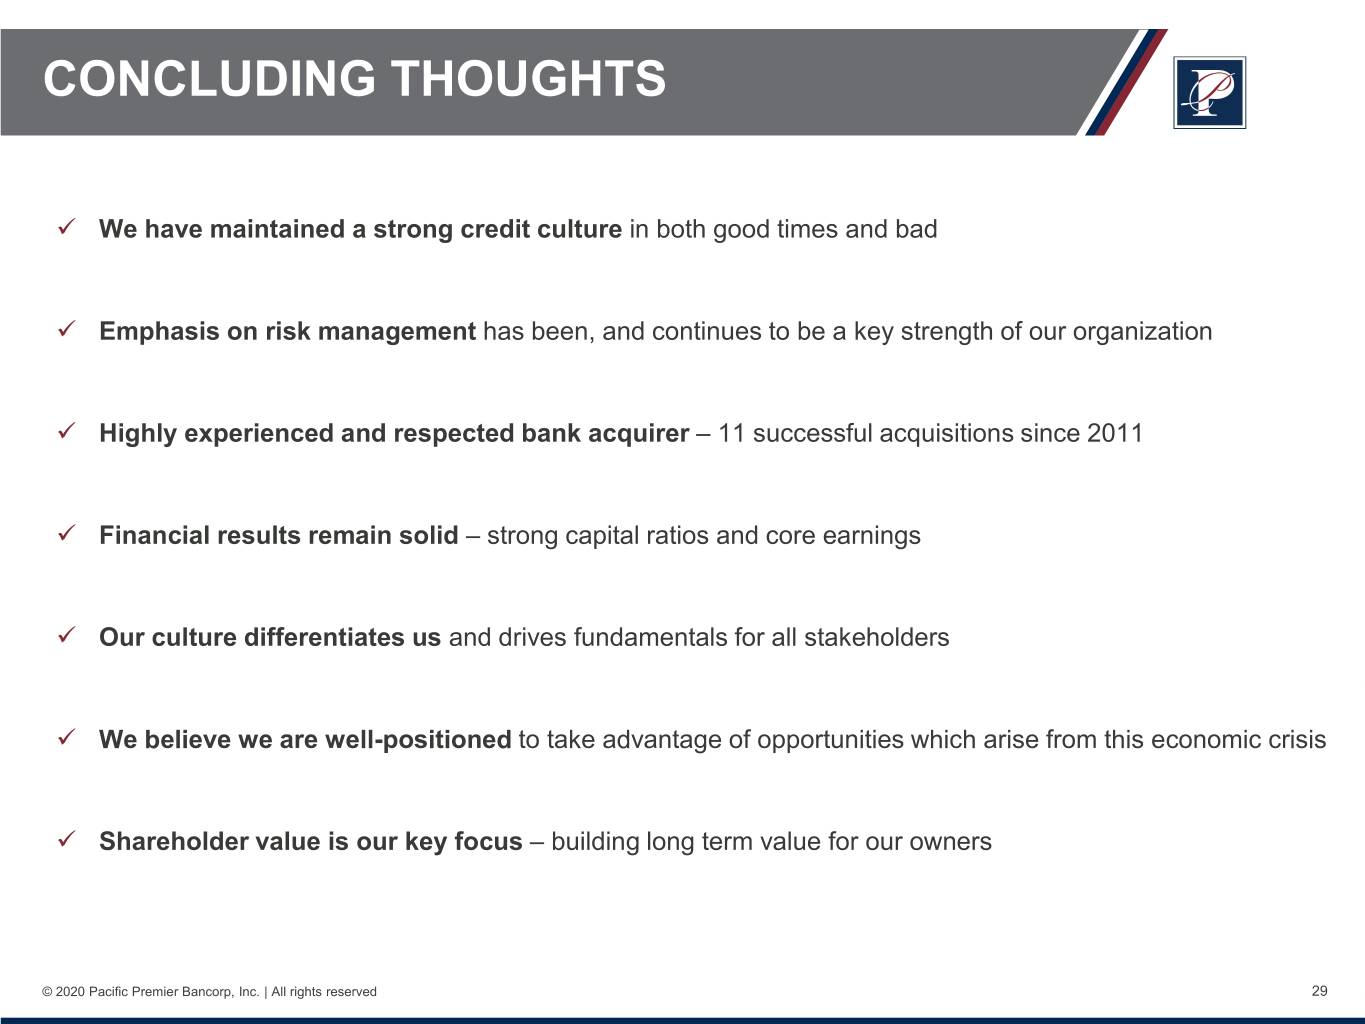
CONCLUDING THOUGHTS We have maintained a strong credit culture in both good times and bad Emphasis on risk management has been, and continues to be a key strength of our organization Highly experienced and respected bank acquirer – 11 successful acquisitions since 2011 Financial results remain solid – strong capital ratios and core earnings Our culture differentiates us and drives fundamentals for all stakeholders We believe we are well-positioned to take advantage of opportunities which arise from this economic crisis Shareholder value is our key focus – building long term value for our owners © 2020 Pacific Premier Bancorp, Inc. | All rights reserved 29
Appendix Material
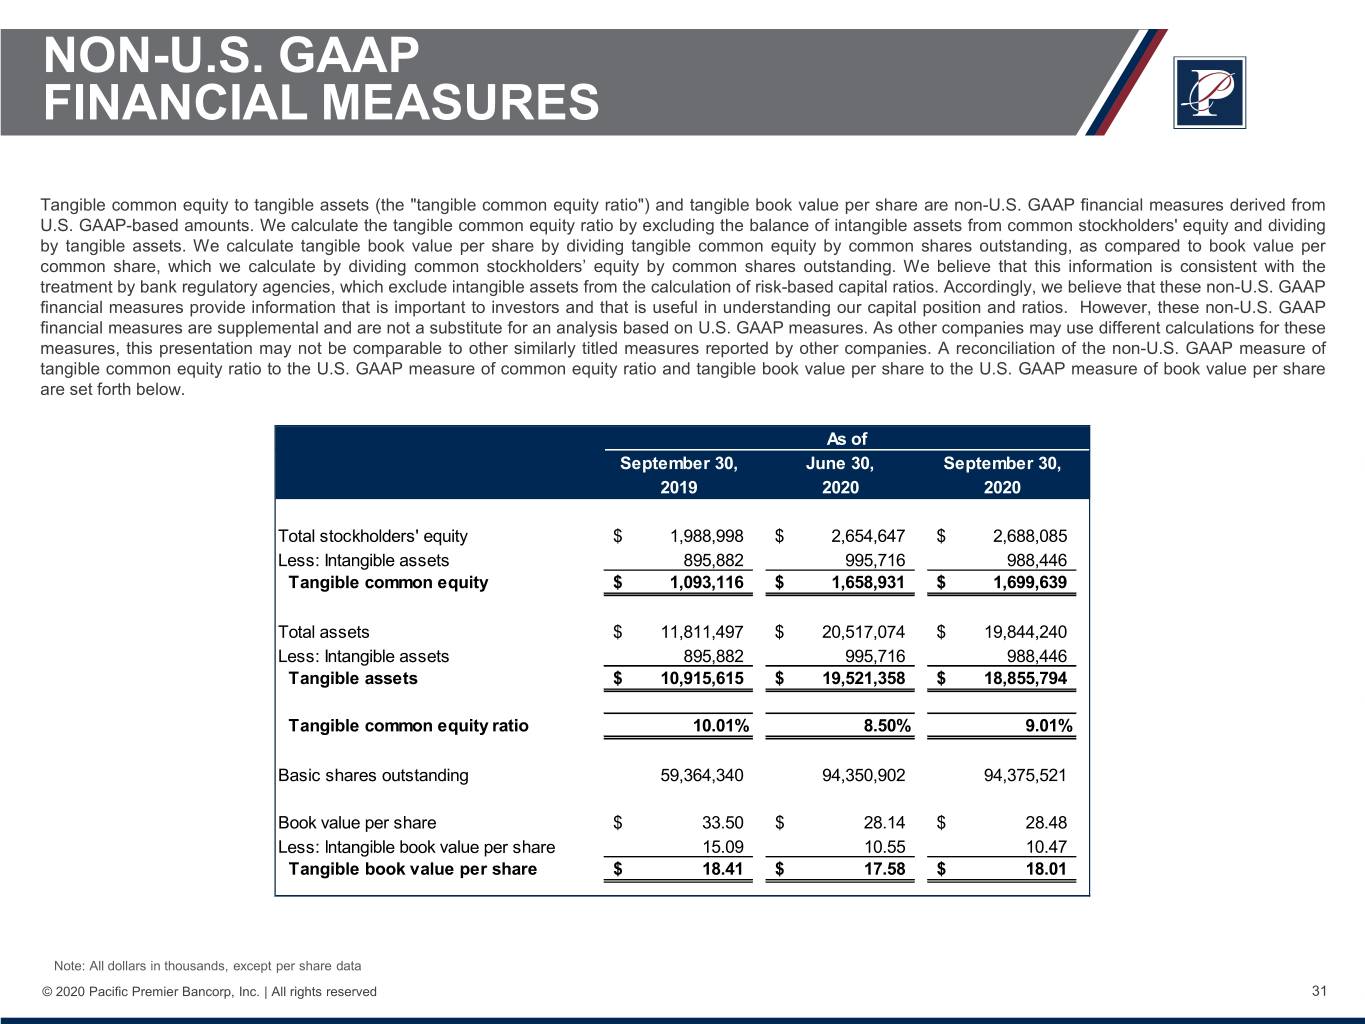
NON-U.S. GAAP FINANCIAL MEASURES Tangible common equity to tangible assets (the "tangible common equity ratio") and tangible book value per share are non-U.S. GAAP financial measures derived from U.S. GAAP-based amounts. We calculate the tangible common equity ratio by excluding the balance of intangible assets from common stockholders' equity and dividing by tangible assets. We calculate tangible book value per share by dividing tangible common equity by common shares outstanding, as compared to book value per common share, which we calculate by dividing common stockholders’ equity by common shares outstanding. We believe that this information is consistent with the treatment by bank regulatory agencies, which exclude intangible assets from the calculation of risk-based capital ratios. Accordingly, we believe that these non-U.S. GAAP financial measures provide information that is important to investors and that is useful in understanding our capital position and ratios. However, these non-U.S. GAAP financial measures are supplemental and are not a substitute for an analysis based on U.S. GAAP measures. As other companies may use different calculations for these measures, this presentation may not be comparable to other similarly titled measures reported by other companies. A reconciliation of the non-U.S. GAAP measure of tangible common equity ratio to the U.S. GAAP measure of common equity ratio and tangible book value per share to the U.S. GAAP measure of book value per share are set forth below. As of September 30, June 30, September 30, 2019 2020 2020 Total stockholders' equity $ 1,988,998 $ 2,654,647 $ 2,688,085 Less: Intangible assets 895,882 995,716 988,446 Tangible common equity $ 1,093,116 $ 1,658,931 $ 1,699,639 Total assets $ 11,811,497 $ 20,517,074 $ 19,844,240 Less: Intangible assets 895,882 995,716 988,446 Tangible assets $ 10,915,615 $ 19,521,358 $ 18,855,794 Tangible common equity ratio 10.01% 8.50% 9.01% Basic shares outstanding 59,364,340 94,350,902 94,375,521 Book value per share $ 33.50 $ 28.14 $ 28.48 Less: Intangible book value per share 15.09 10.55 10.47 Tangible book value per share $ 18.41 $ 17.58 $ 18.01 Note: All dollars in thousands, except per share data © 2020 Pacific Premier Bancorp, Inc. | All rights reserved 31
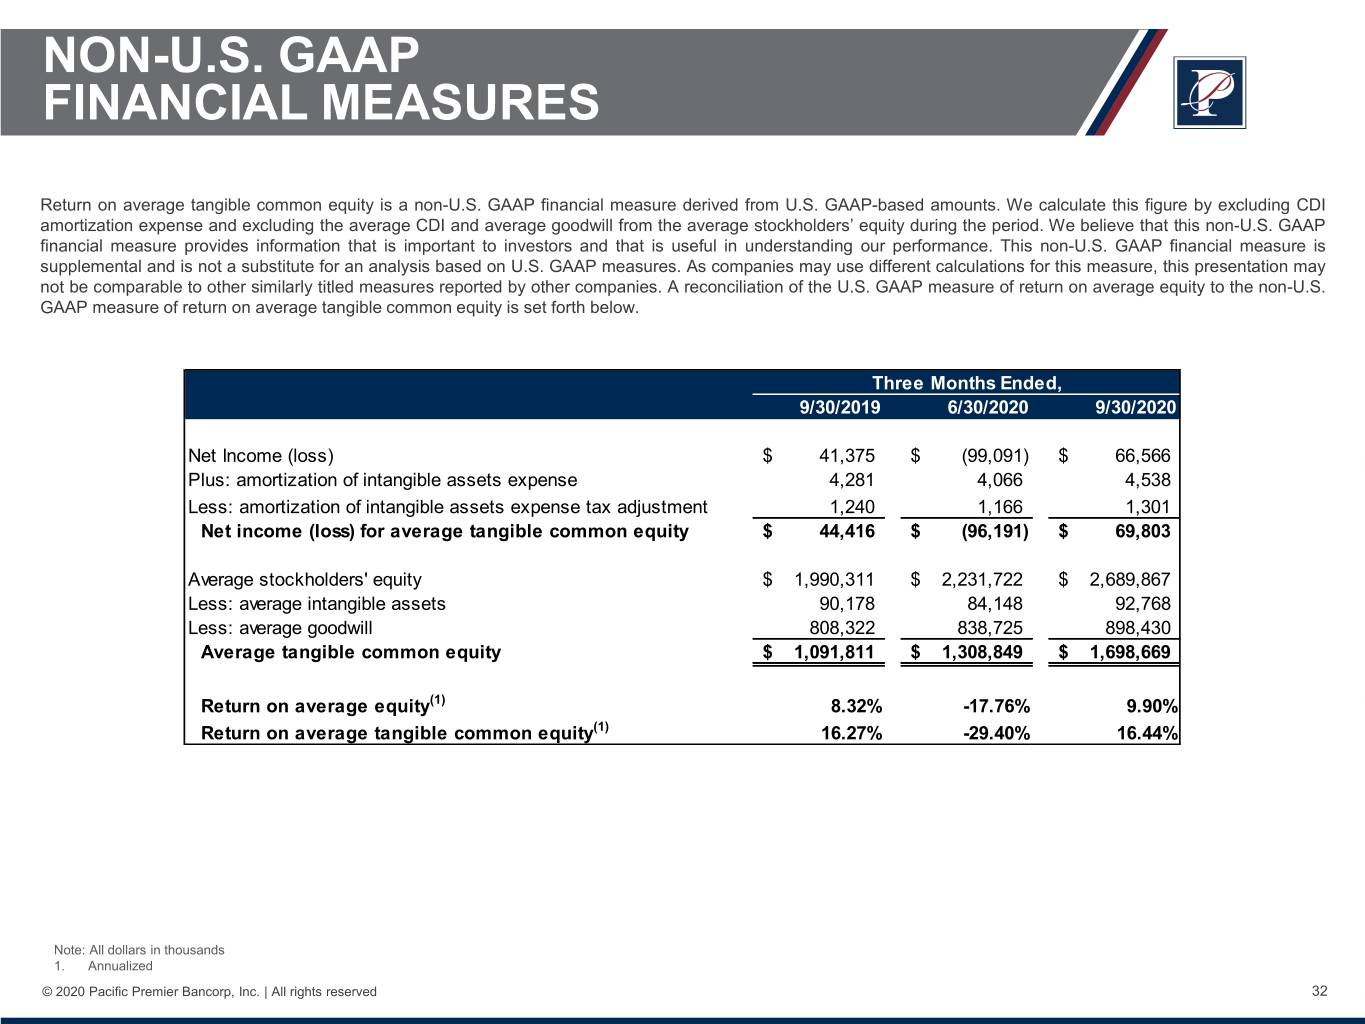
NON-U.S. GAAP FINANCIAL MEASURES Return on average tangible common equity is a non-U.S. GAAP financial measure derived from U.S. GAAP-based amounts. We calculate this figure by excluding CDI amortization expense and excluding the average CDI and average goodwill from the average stockholders’ equity during the period. We believe that this non-U.S. GAAP financial measure provides information that is important to investors and that is useful in understanding our performance. This non-U.S. GAAP financial measure is supplemental and is not a substitute for an analysis based on U.S. GAAP measures. As companies may use different calculations for this measure, this presentation may not be comparable to other similarly titled measures reported by other companies. A reconciliation of the U.S. GAAP measure of return on average equity to the non-U.S. GAAP measure of return on average tangible common equity is set forth below. Three Months Ended, 9/30/2019 6/30/2020 9/30/2020 Net Income (loss) $ 41,375 $ (99,091) $ 66,566 Plus: amortization of intangible assets expense 4,281 4,066 4,538 Less: amortization of intangible assets expense tax adjustment 1,240 1,166 1,301 Net income (loss) for average tangible common equity $ 44,416 $ (96,191) $ 69,803 Average stockholders' equity $ 1,990,311 $ 2,231,722 $ 2,689,867 Less: average intangible assets 90,178 84,148 92,768 Less: average goodwill 808,322 838,725 898,430 Average tangible common equity $ 1,091,811 $ 1,308,849 $ 1,698,669 Return on average equity(1) 8.32% -17.76% 9.90% Return on average tangible common equity(1) 16.27% -29.40% 16.44% Note: All dollars in thousands 1. Annualized © 2020 Pacific Premier Bancorp, Inc. | All rights reserved 32
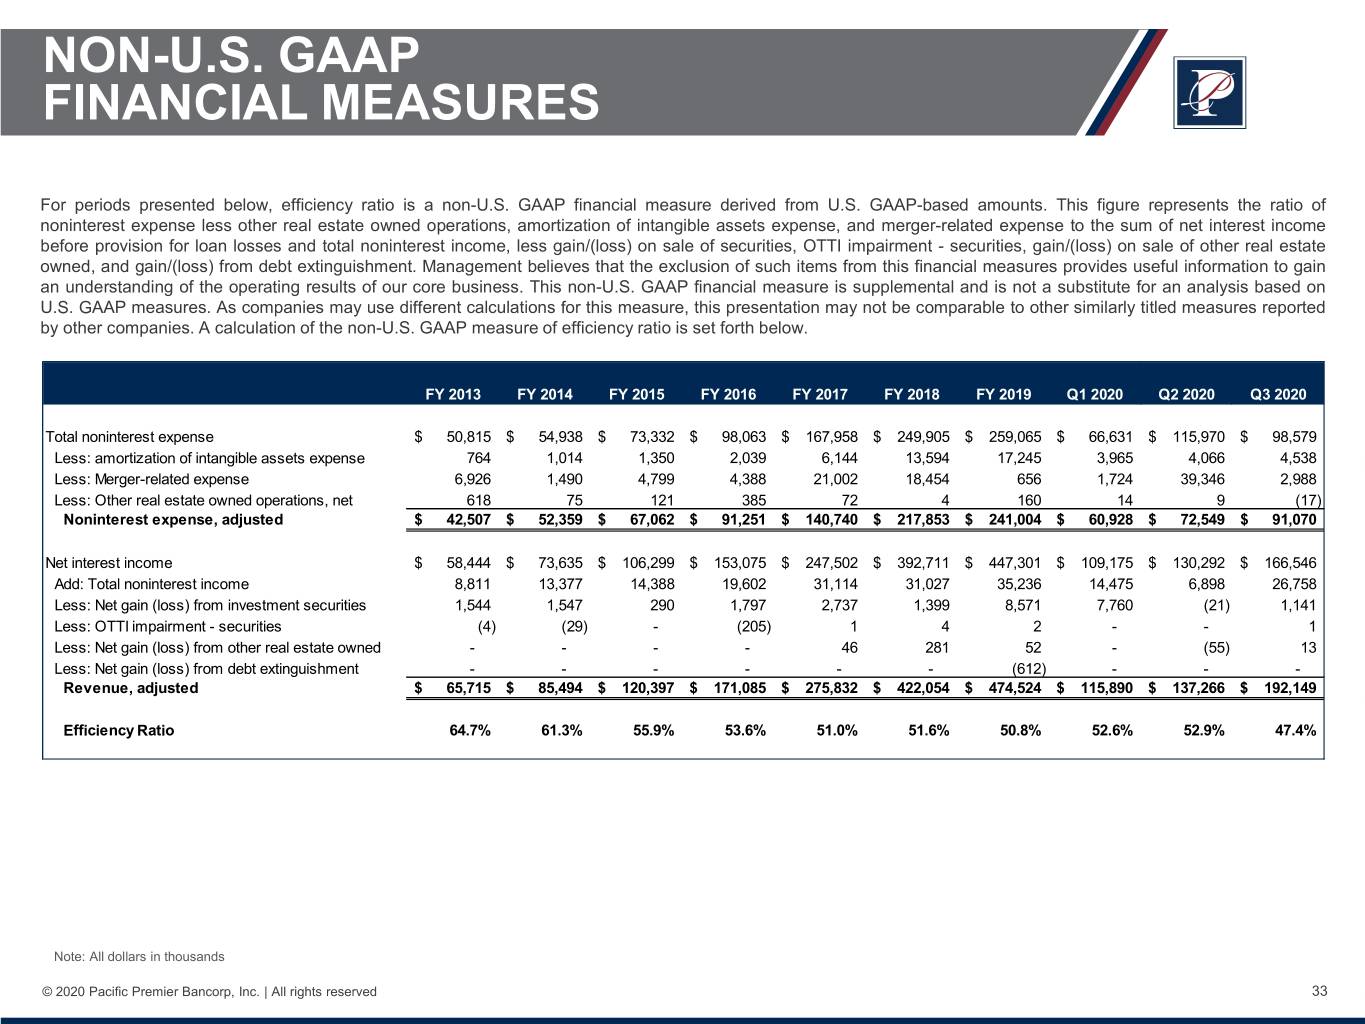
NON-U.S. GAAP FINANCIAL MEASURES For periods presented below, efficiency ratio is a non-U.S. GAAP financial measure derived from U.S. GAAP-based amounts. This figure represents the ratio of noninterest expense less other real estate owned operations, amortization of intangible assets expense, and merger-related expense to the sum of net interest income before provision for loan losses and total noninterest income, less gain/(loss) on sale of securities, OTTI impairment - securities, gain/(loss) on sale of other real estate owned, and gain/(loss) from debt extinguishment. Management believes that the exclusion of such items from this financial measures provides useful information to gain an understanding of the operating results of our core business. This non-U.S. GAAP financial measure is supplemental and is not a substitute for an analysis based on U.S. GAAP measures. As companies may use different calculations for this measure, this presentation may not be comparable to other similarly titled measures reported by other companies. A calculation of the non-U.S. GAAP measure of efficiency ratio is set forth below. FY 2013 FY 2014 FY 2015 FY 2016 FY 2017 FY 2018 FY 2019 Q1 2020 Q2 2020 Q3 2020 Total noninterest expense $ 50,815 $ 54,938 $ 73,332 $ 98,063 $ 167,958 $ 249,905 $ 259,065 $ 66,631 $ 115,970 $ 98,579 Less: amortization of intangible assets expense 764 1,014 1,350 2,039 6,144 13,594 17,245 3,965 4,066 4,538 Less: Merger-related expense 6,926 1,490 4,799 4,388 21,002 18,454 656 1,724 39,346 2,988 Less: Other real estate owned operations, net 618 75 121 385 72 4 160 14 9 (17) Noninterest expense, adjusted $ 42,507 $ 52,359 $ 67,062 $ 91,251 $ 140,740 $ 217,853 $ 241,004 $ 60,928 $ 72,549 $ 91,070 Net interest income $ 58,444 $ 73,635 $ 106,299 $ 153,075 $ 247,502 $ 392,711 $ 447,301 $ 109,175 $ 130,292 $ 166,546 Add: Total noninterest income 8,811 13,377 14,388 19,602 31,114 31,027 35,236 14,475 6,898 26,758 Less: Net gain (loss) from investment securities 1,544 1,547 290 1,797 2,737 1,399 8,571 7,760 (21) 1,141 Less: OTTI impairment - securities (4) (29) - (205) 1 4 2 - - 1 Less: Net gain (loss) from other real estate owned - - - - 46 281 52 - (55) 13 Less: Net gain (loss) from debt extinguishment - - - - - - (612) - - - Revenue, adjusted $ 65,715 $ 85,494 $ 120,397 $ 171,085 $ 275,832 $ 422,054 $ 474,524 $ 115,890 $ 137,266 $ 192,149 Efficiency Ratio 64.7% 61.3% 55.9% 53.6% 51.0% 51.6% 50.8% 52.6% 52.9% 47.4% Note: All dollars in thousands © 2020 Pacific Premier Bancorp, Inc. | All rights reserved 33
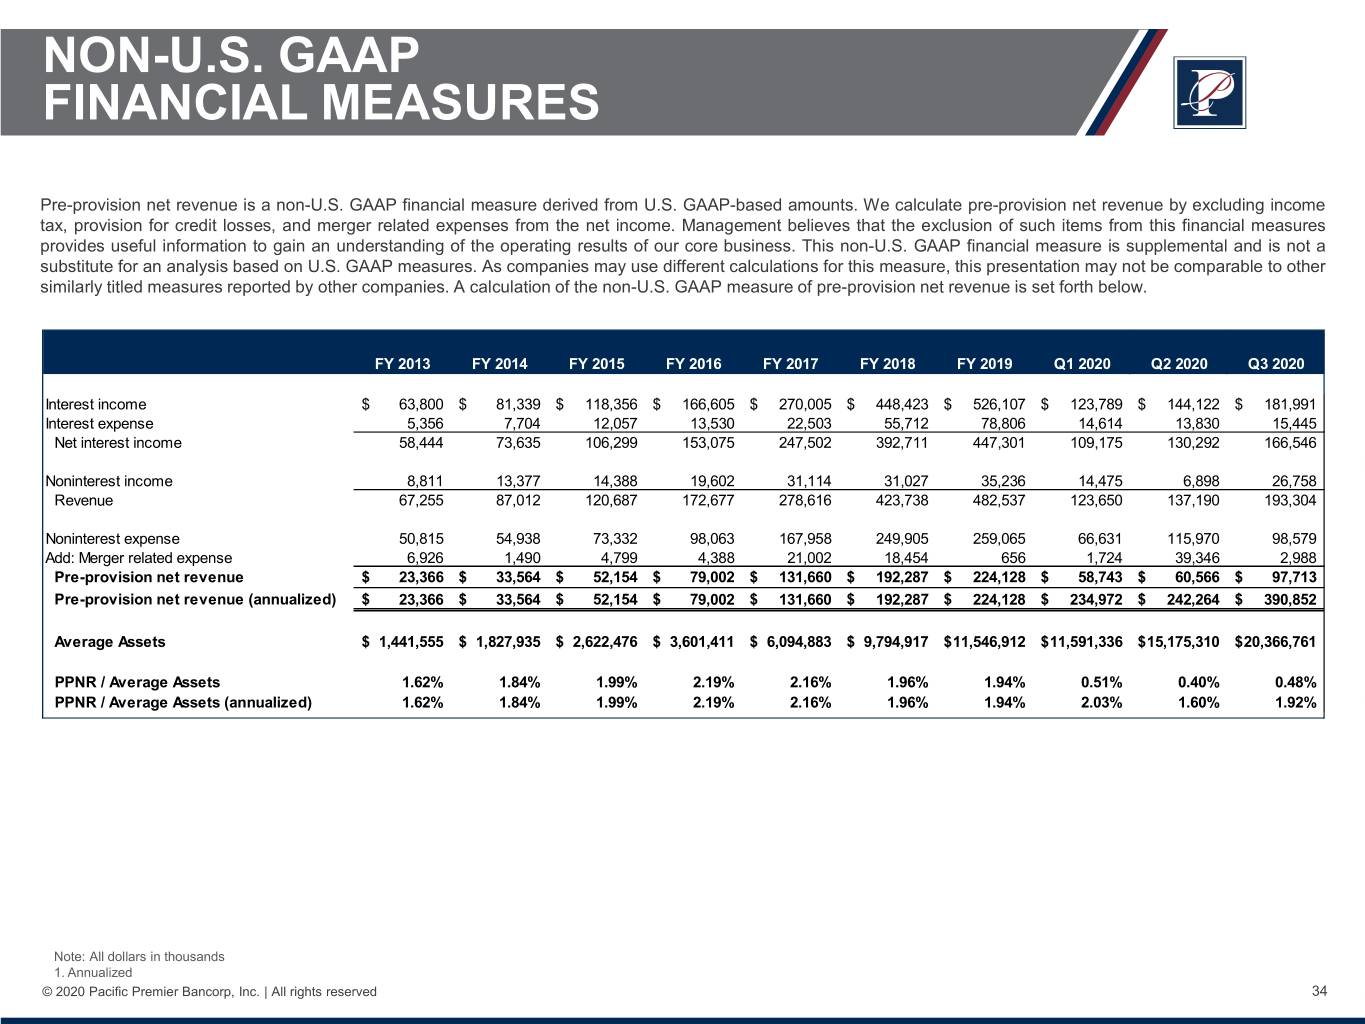
NON-U.S. GAAP FINANCIAL MEASURES Pre-provision net revenue is a non-U.S. GAAP financial measure derived from U.S. GAAP-based amounts. We calculate pre-provision net revenue by excluding income tax, provision for credit losses, and merger related expenses from the net income. Management believes that the exclusion of such items from this financial measures provides useful information to gain an understanding of the operating results of our core business. This non-U.S. GAAP financial measure is supplemental and is not a substitute for an analysis based on U.S. GAAP measures. As companies may use different calculations for this measure, this presentation may not be comparable to other similarly titled measures reported by other companies. A calculation of the non-U.S. GAAP measure of pre-provision net revenue is set forth below. FY 2013 FY 2014 FY 2015 FY 2016 FY 2017 FY 2018 FY 2019 Q1 2020 Q2 2020 Q3 2020 Interest income $ 63,800 $ 81,339 $ 118,356 $ 166,605 $ 270,005 $ 448,423 $ 526,107 $ 123,789 $ 144,122 $ 181,991 Interest expense 5,356 7,704 12,057 13,530 22,503 55,712 78,806 14,614 13,830 15,445 Net interest income 58,444 73,635 106,299 153,075 247,502 392,711 447,301 109,175 130,292 166,546 Noninterest income 8,811 13,377 14,388 19,602 31,114 31,027 35,236 14,475 6,898 26,758 Revenue 67,255 87,012 120,687 172,677 278,616 423,738 482,537 123,650 137,190 193,304 Noninterest expense 50,815 54,938 73,332 98,063 167,958 249,905 259,065 66,631 115,970 98,579 Add: Merger related expense 6,926 1,490 4,799 4,388 21,002 18,454 656 1,724 39,346 2,988 Pre-provision net revenue $ 23,366 $ 33,564 $ 52,154 $ 79,002 $ 131,660 $ 192,287 $ 224,128 $ 58,743 $ 60,566 $ 97,713 Pre-provision net revenue (annualized) $ 23,366 $ 33,564 $ 52,154 $ 79,002 $ 131,660 $ 192,287 $ 224,128 $ 234,972 $ 242,264 $ 390,852 Average Assets $ 1,441,555 $ 1,827,935 $ 2,622,476 $ 3,601,411 $ 6,094,883 $ 9,794,917 $ 11,546,912 $ 11,591,336 $ 15,175,310 $ 20,366,761 PPNR / Average Assets 1.62% 1.84% 1.99% 2.19% 2.16% 1.96% 1.94% 0.51% 0.40% 0.48% PPNR / Average Assets (annualized) 1.62% 1.84% 1.99% 2.19% 2.16% 1.96% 1.94% 2.03% 1.60% 1.92% Note: All dollars in thousands 1. Annualized © 2020 Pacific Premier Bancorp, Inc. | All rights reserved 34
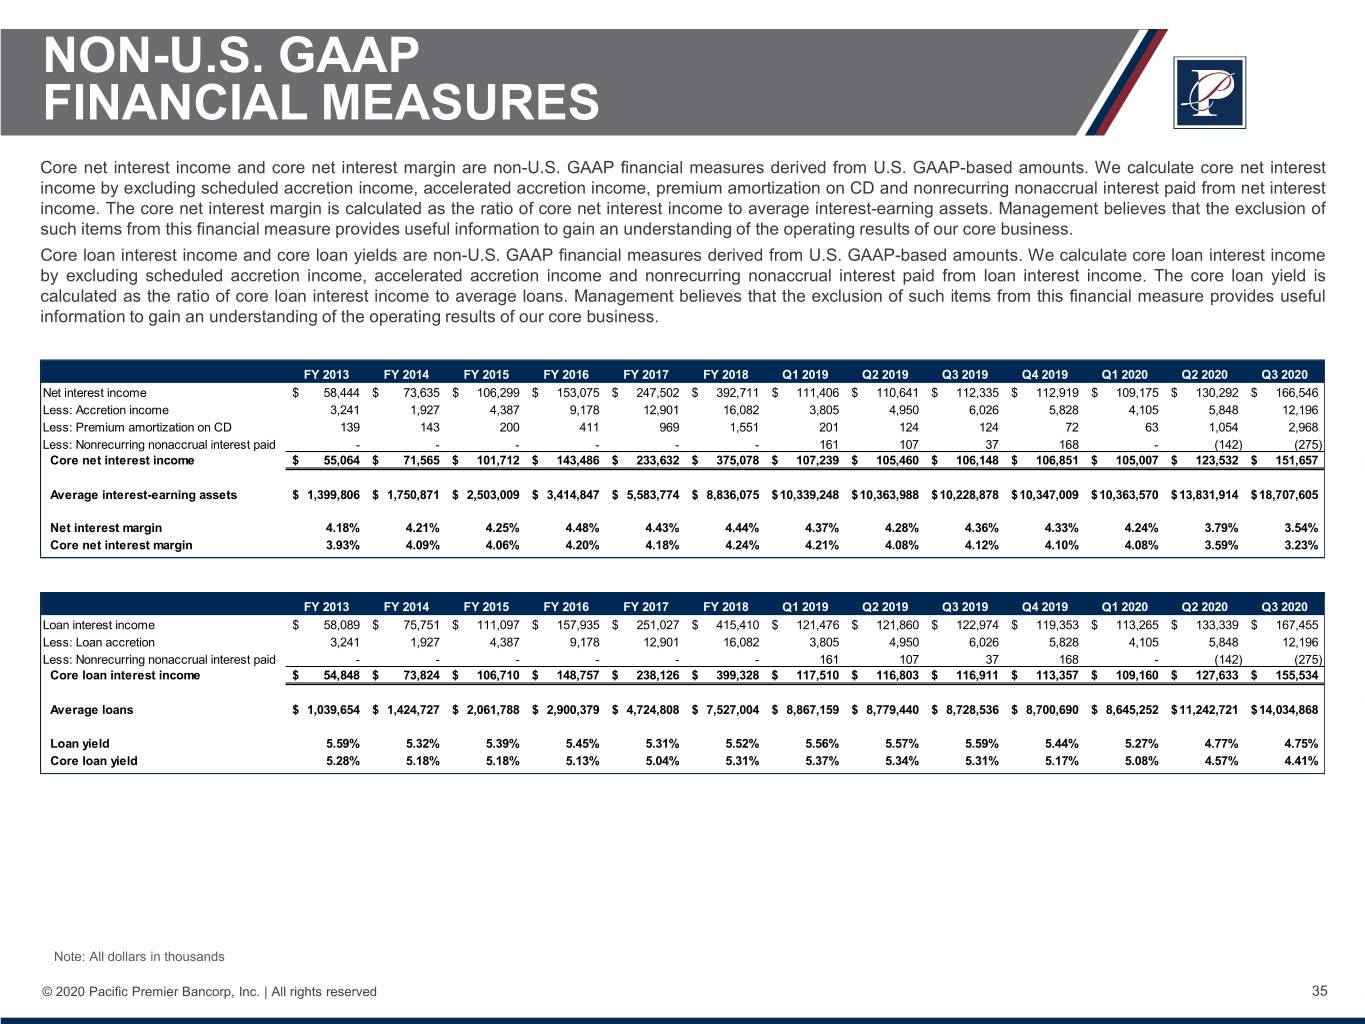
NON-U.S. GAAP FINANCIAL MEASURES Core net interest income and core net interest margin are non-U.S. GAAP financial measures derived from U.S. GAAP-based amounts. We calculate core net interest income by excluding scheduled accretion income, accelerated accretion income, premium amortization on CD and nonrecurring nonaccrual interest paid from net interest income. The core net interest margin is calculated as the ratio of core net interest income to average interest-earning assets. Management believes that the exclusion of such items from this financial measure provides useful information to gain an understanding of the operating results of our core business. Core loan interest income and core loan yields are non-U.S. GAAP financial measures derived from U.S. GAAP-based amounts. We calculate core loan interest income by excluding scheduled accretion income, accelerated accretion income and nonrecurring nonaccrual interest paid from loan interest income. The core loan yield is calculated as the ratio of core loan interest income to average loans. Management believes that the exclusion of such items from this financial measure provides useful information to gain an understanding of the operating results of our core business. FY 2013 FY 2014 FY 2015 FY 2016 FY 2017 FY 2018 Q1 2019 Q2 2019 Q3 2019 Q4 2019 Q1 2020 Q2 2020 Q3 2020 Net interest income $ 58,444 $ 73,635 $ 106,299 $ 153,075 $ 247,502 $ 392,711 $ 111,406 $ 110,641 $ 112,335 $ 112,919 $ 109,175 $ 130,292 $ 166,546 Less: Accretion income 3,241 1,927 4,387 9,178 12,901 16,082 3,805 4,950 6,026 5,828 4,105 5,848 12,196 Less: Premium amortization on CD 139 143 200 411 969 1,551 201 124 124 72 63 1,054 2,968 Less: Nonrecurring nonaccrual interest paid - - - - - - 161 107 37 168 - (142) (275) Core net interest income $ 55,064 $ 71,565 $ 101,712 $ 143,486 $ 233,632 $ 375,078 $ 107,239 $ 105,460 $ 106,148 $ 106,851 $ 105,007 $ 123,532 $ 151,657 Average interest-earning assets $ 1,399,806 $ 1,750,871 $ 2,503,009 $ 3,414,847 $ 5,583,774 $ 8,836,075 $ 10,339,248 $ 10,363,988 $ 10,228,878 $ 10,347,009 $ 10,363,570 $ 13,831,914 $ 18,707,605 Net interest margin 4.18% 4.21% 4.25% 4.48% 4.43% 4.44% 4.37% 4.28% 4.36% 4.33% 4.24% 3.79% 3.54% Core net interest margin 3.93% 4.09% 4.06% 4.20% 4.18% 4.24% 4.21% 4.08% 4.12% 4.10% 4.08% 3.59% 3.23% FY 2013 FY 2014 FY 2015 FY 2016 FY 2017 FY 2018 Q1 2019 Q2 2019 Q3 2019 Q4 2019 Q1 2020 Q2 2020 Q3 2020 Loan interest income $ 58,089 $ 75,751 $ 111,097 $ 157,935 $ 251,027 $ 415,410 $ 121,476 $ 121,860 $ 122,974 $ 119,353 $ 113,265 $ 133,339 $ 167,455 Less: Loan accretion 3,241 1,927 4,387 9,178 12,901 16,082 3,805 4,950 6,026 5,828 4,105 5,848 12,196 Less: Nonrecurring nonaccrual interest paid - - - - - - 161 107 37 168 - (142) (275) Core loan interest income $ 54,848 $ 73,824 $ 106,710 $ 148,757 $ 238,126 $ 399,328 $ 117,510 $ 116,803 $ 116,911 $ 113,357 $ 109,160 $ 127,633 $ 155,534 Average loans $ 1,039,654 $ 1,424,727 $ 2,061,788 $ 2,900,379 $ 4,724,808 $ 7,527,004 $ 8,867,159 $ 8,779,440 $ 8,728,536 $ 8,700,690 $ 8,645,252 $ 11,242,721 $ 14,034,868 Loan yield 5.59% 5.32% 5.39% 5.45% 5.31% 5.52% 5.56% 5.57% 5.59% 5.44% 5.27% 4.77% 4.75% Core loan yield 5.28% 5.18% 5.18% 5.13% 5.04% 5.31% 5.37% 5.34% 5.31% 5.17% 5.08% 4.57% 4.41% Note: All dollars in thousands © 2020 Pacific Premier Bancorp, Inc. | All rights reserved 35
