Attached files
| file | filename |
|---|---|
| EX-32.2 - CERTIFICATION - Greenbacker Renewable Energy Co LLC | f10q0920ex32-2_greenbacker.htm |
| EX-32.1 - CERTIFICATION - Greenbacker Renewable Energy Co LLC | f10q0920ex32-1_greenbacker.htm |
| EX-31.2 - CERTIFICATION - Greenbacker Renewable Energy Co LLC | f10q0920ex31-2_greenbacker.htm |
| EX-31.1 - CERTIFICATION - Greenbacker Renewable Energy Co LLC | f10q0920ex31-1_greenbacker.htm |
| EX-10.2 - FORMOF ADMINISTRATION AGREEMENT BY AND AMONG REGISTRANT, GREENBACKER RENEWABLE E - Greenbacker Renewable Energy Co LLC | f10q0920ex10-2_greenbacker.htm |
| EX-3.1 - FOURTH AMENDED AND RESTATED LIMITED LIABILITY COMPANY OPERATING AGREEMENT OF GRE - Greenbacker Renewable Energy Co LLC | f10q0920ex3-1_greenbacker.htm |
UNITED STATES
SECURITIES AND EXCHANGE COMMISSION
Washington, D.C. 20549
FORM 10-Q
(Mark One)
☒ QUARTERLY REPORT PURSUANT TO SECTION 13 OR 15(d) OF THE SECURITIES EXCHANGE ACT OF 1934
For the quarterly period ended September 30, 2020
OR
☐ TRANSITION REPORT PURSUANT TO SECTION 13 OR 15(d) OF THE SECURITIES EXCHANGE ACT OF 1934
Commission file number: 000-55610
GREENBACKER RENEWABLE ENERGY COMPANY LLC
(Exact Name of Registrant as Specified in its Charter)
| Delaware | 80-0872648 | |
| (State or Other Jurisdiction of | (I.R.S. Employer | |
| Incorporation or Organization) | Identification No.) |
| 11 East 44th Street, 12th Floor |
| New York, NY 10017 |
| Tel (646) 237-7884 |
| (Address, including zip code and telephone number, including area code, of registrants Principal Executive Office) |
Indicate by check mark whether the registrant: (1) has filed all reports required to be filed by Section 13 or 15(d) of the Securities Exchange Act of 1934 during the preceding 12 months (or for such shorter period that the registrant was required to file such reports), and (2) has been subject to such filing requirements for the past 90 days. Yes ☒ No ☐
Indicate by check mark whether the registrant has submitted electronically every Interactive Data File required to be submitted pursuant to Rule 405 of Regulation S-T (§ 232.405 of this chapter) during the preceding 12 months (or for such shorter period that the registrant was required to submit such files). Yes ☒ No ☐
Indicate by check mark whether the registrant is a large accelerated filer, an accelerated filer, a non-accelerated filer, smaller reporting company, or an emerging growth company. See the definitions of “large accelerated filer,” “accelerated filer,” “smaller reporting company,” and “emerging growth company” in Rule 12b-2 of the Exchange Act.
| Large accelerated filer ☐ | Accelerated filer ☐ |
| Non-accelerated filer ☐ | Smaller reporting company ☐ |
| Emerging growth company ☒ |
If an emerging growth company, indicate by check mark if the registrant has elected not to use the extended transition period for complying with any new or revised financial accounting standards provided pursuant to Section 13(a) of the Exchange Act. ☒
Indicate by check mark whether the registrant is a shell company (as defined in Rule 12b-2 of the Exchange Act). Yes ☐ No ☒
Securities registered pursuant to Section 12(b) of the Act:
| Title of each class | Trading Symbol(s) | Name of each exchange on which registered | ||
| Limited liability company interests | N/A | N/A |
As of, November 6, 2020, the registrant had 59,702,581 shares of common interests, $0.001 par value, outstanding.
TABLE OF CONTENTS
i
Item 1. Consolidated Financial Statements
GREENBACKER RENEWABLE ENERGY COMPANY LLC AND SUBSIDIARIES
CONSOLIDATED STATEMENTS OF ASSETS AND LIABILITIES
| September 30, 2020 | December 31, 2019 | |||||||
| (unaudited) | ||||||||
| ASSETS | ||||||||
| Investments in controlled/affiliated portfolios, at fair value (cost of $492,736,695 and $415,905,982, respectively) | $ | 562,850,983 | $ | 452,072,181 | ||||
| Investments in non-controlled/non-affiliated portfolios, at fair value (cost of $31,749,245 and $23,103,690, respectively) | 31,749,245 | 23,103,690 | ||||||
| Swap contracts, at fair value | - | 21,223 | ||||||
| Cash and cash equivalents | 19,556,657 | 8,636,839 | ||||||
| Restricted cash | - | 429,252 | ||||||
| Shareholder receivable | 579,243 | 650,000 | ||||||
| Dividend receivable | 1,726,189 | 620,846 | ||||||
| Deferred tax assets, net of allowance | - | - | ||||||
| Investment sales receivable | 307,602 | 22,013,491 | ||||||
| Other assets | 2,753,150 | 611,560 | ||||||
| Total assets | $ | 619,523,069 | $ | 508,159,082 | ||||
| LIABILITIES | ||||||||
| Swap contracts, at fair value | $ | 11,025,669 | $ | 4,899,566 | ||||
| Deferred tax liabilities | 4,469,501 | 6,500,625 | ||||||
| Payable for investments purchased | 3,714,715 | 7,502,267 | ||||||
| Term note payable, net of financing costs | 69,964,520 | 68,886,785 | ||||||
| Management fee payable | 481,852 | 272,982 | ||||||
| Performance participation fee payable | 2,706,252 | - | ||||||
| Accounts payable and accrued expenses | 675,973 | 419,240 | ||||||
| Shareholder distributions payable | 2,708,124 | 1,784,961 | ||||||
| Interest payable | 14,150 | 11,933 | ||||||
| Payable for repurchases of common stock | 5,958,111 | 2,186,780 | ||||||
| Deferred sales commission payable | 170,155 | 56,483 | ||||||
| Total liabilities | $ | 101,889,022 | $ | 92,521,622 | ||||
| Commitments and contingencies (See Note 2, Note 5 and Note 9) | ||||||||
| MEMBERS’ EQUITY (NET ASSETS) | ||||||||
| Preferred stock, par value, $.001 per share, 50,000,000 authorized; none issued and outstanding | $ | - | $ | - | ||||
| Common stock, par value, $.001 per share, 350,000,000 authorized; 58,066,363 and 47,889,610 shares issued and outstanding, respectively | 58,066 | 47,890 | ||||||
| Paid-in capital in excess of par value | 507,502,160 | 416,611,769 | ||||||
| Accumulated gains (losses)* | 5,324,821 | (7,920,007 | ) | |||||
| Total common members equity | 512,885,047 | 408,739,652 | ||||||
| Special unitholder’s equity | 4,749,000 | 6,897,808 | ||||||
| Total members’ equity (net assets) | 517,634,047 | 415,637,460 | ||||||
| Total liabilities and equity | $ | 619,523,069 | $ | 508,159,082 | ||||
| Net assets, Class A (shares outstanding of 17,036,392 and 17,210,016, respectively) | $ | 147,039,601 | $ | 144,540,863 | ||||
| Net assets, Class C (shares outstanding of 2,750,825 and 2,718,475, respectively) | 23,038,935 | 22,364,784 | ||||||
| Net assets, Class I (shares outstanding of 6,545,697 and 6,693,658, respectively) | 56,472,346 | 56,217,673 | ||||||
| Net assets, Class P-A (shares outstanding of 18,109 and 18,109, respectively) | 157,079 | 152,879 | ||||||
| Net assets, Class P-I (shares outstanding of 31,715,340 and 21,249,352, respectively) | 286,177,086 | 185,463,453 | ||||||
| Total common equityholders’ equity | $ | 512,885,047 | $ | 408,739,652 | ||||
| * | Accumulated deficit, accumulated net realized gain on investments, and accumulated unrealized appreciation (depreciation) on investments, net of deferred taxes, foreign currency translation, and swap contracts are included in accumulated gains (losses). |
The accompanying notes are an integral part of these consolidated financial statements.
1
GREENBACKER RENEWABLE ENERGY COMPANY LLC AND SUBSIDIARIES
CONSOLIDATED STATEMENTS OF OPERATIONS
(unaudited)
| For
the three months ended September 30, 2020 |
For the three months ended September 30, 2019 |
For the nine months ended September 30, 2020 |
For the nine months ended September 30, 2019 |
|||||||||||||
| Investment income: | ||||||||||||||||
| Investment income from controlled, affiliated investments: | ||||||||||||||||
| Dividend income | $ | 4,520,199 | $ | 5,556,784 | $ | 14,599,327 | $ | 11,720,352 | ||||||||
| Interest income | - | 343,116 | 4,579 | 565,809 | ||||||||||||
| Total investment income from controlled, affiliated investments | $ | 4,520,199 | $ | 5,899,900 | $ | 14,603,906 | $ | 12,286,161 | ||||||||
| Investment income from non-controlled, non-affiliated investments: | ||||||||||||||||
| Interest income | 703,437 | 45,744 | 2,129,148 | 278,522 | ||||||||||||
| Total investment income | $ | 5,223,636 | $ | 5,945,644 | $ | 16,733,054 | $ | 12,564,683 | ||||||||
| Operating expenses: | ||||||||||||||||
| Management fee expense | 2,497,596 | 2,228,976 | 7,348,380 | 6,086,107 | ||||||||||||
| Audit and tax expense | 289,909 | 176,000 | 998,233 | 617,554 | ||||||||||||
| Interest and financing expenses | 589,707 | 793,200 | 2,095,925 | 1,790,977 | ||||||||||||
| General and administration expenses | 69,409 | 180,493 | 202,746 | 389,658 | ||||||||||||
| Performance participation fee | 3,453,854 | - | 3,453,854 | - | ||||||||||||
| Legal expenses | 199,892 | 240,411 | 423,955 | 400,717 | ||||||||||||
| Directors fees and expenses | 91,624 | 66,065 | 275,626 | 306,618 | ||||||||||||
| Insurance expense | 30,633 | 59,153 | 109,995 | 126,699 | ||||||||||||
| Transfer agent expense | 114,571 | 119,801 | 346,865 | 357,396 | ||||||||||||
| Other expenses | 619,514 | 56,596 | 1,420,703 | 164,946 | ||||||||||||
| Operating expenses before performance participation fee waiver | 7,956,709 | 3,920,695 | 16,676,282 | 10,240,672 | ||||||||||||
| Performance participation fee waiver | (747,602 | ) | - | (747,602 | ) | - | ||||||||||
| Total operating expenses, net of performance participation fee waiver | 7,209,107 | 3,920,695 | 15,928,680 | 10,240,672 | ||||||||||||
| Net investment income (loss) before taxes | (1,985,471 | ) | 2,024,949 | 804,374 | 2,324,011 | |||||||||||
| Deferred tax (benefit) loss | (2,835,220 | ) | (48,360 | ) | (8,482,792 | ) | (553,652 | ) | ||||||||
| Franchise tax expense | (51,811 | ) | 5,978 | - | 187,966 | |||||||||||
| Net investment income (loss) | 901,560 | 2,067,331 | 9,287,166 | 2,689,697 | ||||||||||||
| Net change in realized and unrealized gain (loss) on investments, foreign currency translation and deferred tax assets: | ||||||||||||||||
| Net realized gain (loss) on investments | (157,084 | ) | 6,683,326 | 6,186,076 | 6,683,326 | |||||||||||
| Net change in unrealized appreciation (depreciation) on: | ||||||||||||||||
| Investments | 10,197,526 | 11,903,224 | 33,921,156 | 30,010,301 | ||||||||||||
| Foreign currency translation | 27,998 | (15,767 | ) | 26,933 | 42,054 | |||||||||||
| Swap contracts | 625,645 | (1,980,844 | ) | (6,147,327 | ) | (6,766,160 | ) | |||||||||
| Change in benefit from deferred taxes on unrealized appreciation (depreciation) on investments | 3,310,682 | (3,573,207 | ) | (6,451,670 | ) | (7,500,774 | ) | |||||||||
| Net increase in net assets resulting from operations | 14,906,327 | 15,084,063 | 36,822,334 | 25,158,444 | ||||||||||||
| Net (increase) decrease in net assets attributed to special unitholder | 4,193,559 | (2,588,895 | ) | (1,154,308 | ) | (4,025,183 | ) | |||||||||
| Net increase in net assets attributed to common members | $ | 19,099,886 | $ | 12,495,168 | $ | 35,668,026 | $ | 21,133,261 | ||||||||
| Common stock per share information —basic and diluted: | ||||||||||||||||
| Net investment income | $ | 0.02 | $ | 0.05 | $ | 0.18 | $ | 0.06 | ||||||||
| Net increase in net assets attributed to common equityholders | $ | 0.34 | $ | 0.28 | $ | 0.69 | $ | 0.49 | ||||||||
| Weighted average common shares outstanding | 56,183,178 | 45,389,517 | 51,980,470 | 42,703,696 | ||||||||||||
The accompanying notes are an integral part of these consolidated financial statements.
2
GREENBACKER RENEWABLE ENERGY COMPANY LLC AND SUBSIDIARIES
CONSOLIDATED STATEMENTS OF CHANGES IN NET ASSETS
For the nine months ended September 30, 2020
(unaudited)
| Common Equityholders | ||||||||||||||||||||||||||||||||||||||||||||
| Shares | Par Value | Paid-in capital in excess of par value | Accumulated deficit | Accumulated net realized gain on investments | Accumulated unrealized appreciation (depreciation) on investments, net of deferred taxes | Accumulated unrealized appreciation (depreciation) on foreign currency translation | Accumulated unrealized appreciation (depreciation) on swap contracts | Common equityholders’ equity | Special unitholder | Total
members’ equity (net assets) | ||||||||||||||||||||||||||||||||||
| Balances December 31, 2019 | 47,889,610 | $ | 47,890 | $ | 416,611,769 | $ | (38,477,220 | ) | $ | 11,963,784 | $ | 22,672,301 | $ | (200,990 | ) | $ | (3,877,882 | ) | $ | 408,739,652 | $ | 6,897,808 | $ | 415,637,460 | ||||||||||||||||||||
| Proceeds from issuance of common stock, net | 1,874,392 | 1,874 | 16,694,020 | - | - | - | - | - | 16,695,894 | - | 16,695,894 | |||||||||||||||||||||||||||||||||
| Issuance of common stock under distribution reinvestment plan | 205,060 | 205 | 1,758,881 | - | - | - | - | - | 1,759,086 | - | 1,759,086 | |||||||||||||||||||||||||||||||||
| Repurchases of common stock | (214,035 | ) | (214 | ) | (1,847,412 | ) | - | - | - | - | - | (1,847,626 | ) | - | (1,847,626 | ) | ||||||||||||||||||||||||||||
| Proceeds from shares transferred | (254 | ) | - | - | - | - | - | - | - | - | - | - | ||||||||||||||||||||||||||||||||
| Shareholder distributions | - | - | - | (7,171,159 | ) | - | - | - | - | (7,171,159 | ) | - | (7,171,159 | ) | ||||||||||||||||||||||||||||||
| Distributions to special unitholder | - | - | - | - | - | - | - | - | - | (1,124,000 | ) | (1,124,000 | ) | |||||||||||||||||||||||||||||||
| Net investment income | - | - | - | 4,805,340 | - | - | - | - | 4,805,340 | - | 4,805,340 | |||||||||||||||||||||||||||||||||
| Net realized gain on investments | - | - | - | - | 4,750,225 | - | - | - | 4,750,225 | 1,652,702 | 6,402,927 | |||||||||||||||||||||||||||||||||
| Net change in unrealized appreciation on investments | - | - | - | - | - | 9,802,188 | - | - | 9,802,188 | 2,298,247 | 12,100,435 | |||||||||||||||||||||||||||||||||
| Net change in unrealized depreciation on foreign currency translation | - | - | - | - | - | - | (52,248 | ) | - | (52,248 | ) | - | (52,248 | ) | ||||||||||||||||||||||||||||||
| Net change in unrealized depreciation on swap contracts | - | - | - | - | - | - | - | (5,053,958 | ) | (5,053,958 | ) | (1,263,490 | ) | (6,317,448 | ) | |||||||||||||||||||||||||||||
| Change in benefit from deferred taxes on unrealized appreciation (depreciation) on investments | - | - | - | - | - | (6,307,217 | ) | - | - | (6,307,217 | ) | - | (6,307,217 | ) | ||||||||||||||||||||||||||||||
| Balances at March 31, 2020 | 49,754,773 | $ | 49,755 | $ | 433,217,258 | $ | (40,843,039 | ) | $ | 16,714,009 | $ | 26,167,272 | $ | (253,238 | ) | $ | (8,931,840 | ) | $ | 426,120,177 | $ | 8,461,267 | $ | 434,581,444 | ||||||||||||||||||||
| Proceeds from issuance of common stock, net | 3,556,523 | $ | 3,557 | $ | 31,534,026 | $ | - | $ | - | $ | - | $ | - | $ | - | $ | 31,537,583 | $ | - | $ | 31,537,583 | |||||||||||||||||||||||
| Issuance of common stock under distribution reinvestment plan | 194,371 | 194 | 1,662,041 | - | - | - | - | - | 1,662,235 | - | 1,662,235 | |||||||||||||||||||||||||||||||||
| Repurchases of common stock | (339,571 | ) | (340 | ) | (2,925,974 | ) | - | - | - | - | - | (2,926,314 | ) | - | (2,926,314 | ) | ||||||||||||||||||||||||||||
| Proceeds from shares transferred | - | - | - | - | - | - | - | - | - | - | - | |||||||||||||||||||||||||||||||||
| Shareholder distributions | - | - | - | (7,157,841 | ) | - | - | - | - | (7,157,841 | ) | - | (7,157,841 | ) | ||||||||||||||||||||||||||||||
| Distributions to special unitholder | - | - | - | - | - | - | - | - | - | (2,179,116 | ) | (2,179,116 | ) | |||||||||||||||||||||||||||||||
| Net investment income | - | - | - | 3,580,266 | - | - | - | - | 3,580,266 | - | 3,580,266 | |||||||||||||||||||||||||||||||||
| Net realized gain on investments | - | - | - | - | (59,767 | ) | - | - | - | (59,767 | ) | - | (59,767 | ) | ||||||||||||||||||||||||||||||
| Net change in unrealized appreciation on investments | - | - | - | - | - | 8,871,682 | - | - | 8,871,682 | 2,751,513 | 11,623,195 | |||||||||||||||||||||||||||||||||
| Net change in unrealized depreciation on foreign currency translation | - | - | - | - | - | - | 51,183 | - | 51,183 | - | 51,183 | |||||||||||||||||||||||||||||||||
| Net change in unrealized depreciation on swap contracts | - | - | - | - | - | - | - | (364,419 | ) | (364,419 | ) | (91,105 | ) | (455,524 | ) | |||||||||||||||||||||||||||||
| Change in benefit from deferred taxes on unrealized appreciation (depreciation) on investments | - | - | - | - | - | (3,455,133 | ) | - | - | (3,455,133 | ) | - | (3,455,133 | ) | ||||||||||||||||||||||||||||||
| Balances at June 30, 2020 | $ | 53,166,096 | $ | 53,166 | $ | 463,487,351 | $ | (44,420,614 | ) | $ | 16,654,242 | $ | 31,583,821 | $ | (202,055 | ) | $ | (9,296,259 | ) | $ | 457,859,652 | $ | 8,942,559 | $ | 466,802,211 | |||||||||||||||||||
| Proceeds from issuance of common stock, net | 5,441,644 | 5,441 | 48,807,974 | - | - | - | - | - | 48,813,415 | - | 48,813,415 | |||||||||||||||||||||||||||||||||
| Issuance of common stock under distribution reinvestment plan | 188,845 | 189 | 1,624,139 | - | - | - | - | - | 1,624,328 | - | 1,624,328 | |||||||||||||||||||||||||||||||||
| Repurchases of common stock | (730,205 | ) | (730 | ) | (6,417,304 | ) | - | - | - | - | - | (6,418,034 | ) | - | (6,418,034 | ) | ||||||||||||||||||||||||||||
| Proceeds from shares transferred | (17 | ) | - | - | - | - | - | - | - | - | - | - | ||||||||||||||||||||||||||||||||
| Shareholder distributions | - | - | - | (8,094,200 | ) | - | - | - | - | (8,094,200 | ) | - | (8,094,200 | ) | ||||||||||||||||||||||||||||||
| Distributions to special unitholder | - | - | - | - | - | - | - | - | - | - | - | |||||||||||||||||||||||||||||||||
| Net investment income | - | - | - | 901,560 | - | - | - | - | 901,560 | - | 901,560 | |||||||||||||||||||||||||||||||||
| Net realized gain on investments | - | - | - | - | (157,084 | ) | - | - | - | (157,084 | ) | - | (157,084 | ) | ||||||||||||||||||||||||||||||
| Net change in unrealized appreciation on investments | - | - | - | - | - | 15,486,334 | - | - | 15,486,334 | (5,288,808 | ) | 10,197,526 | ||||||||||||||||||||||||||||||||
| Net change in unrealized depreciation on foreign currency translation | - | - | - | - | - | - | 27,998 | - | 27,998 | - | 27,998 | |||||||||||||||||||||||||||||||||
| Net change in unrealized depreciation on swap contracts | - | - | - | - | - | - | - | (469,604 | ) | (469,604 | ) | 1,095,249 | 625,645 | |||||||||||||||||||||||||||||||
| Change in benefit from deferred taxes on unrealized appreciation (depreciation) on investments | - | - | - | - | - | 3,310,682 | - | - | 3,310,682 | - | 3,310,682 | |||||||||||||||||||||||||||||||||
| Balances at September 30, 2020 | $ | 58,066,363 | $ | 58,066 | $ | 507,502,160 | $ | (51,613,254 | ) | $ | 16,497,158 | $ | 50,380,837 | $ | (174,057 | ) | $ | (9,765,863 | ) | $ | 512,885,047 | $ | 4,749,000 | $ | 517,634,047 | |||||||||||||||||||
3
GREENBACKER RENEWABLE ENERGY COMPANY LLC AND SUBSIDIARIES
CONSOLIDATED STATEMENTS OF CHANGES IN NET ASSETS
For the nine months ended September 30, 2019
(unaudited)
| Common Equityholders | ||||||||||||||||||||||||||||||||||||||||||||
| Shares | Par Value | Paid-in capital in excess of par value | Accumulated deficit | Accumulated net realized gain on investments | Accumulated unrealized appreciation (depreciation) on investments, net of deferred taxes | Accumulated unrealized appreciation (depreciation) on foreign currency translation | Accumulated unrealized appreciation (depreciation) on swap contracts | Common equityholders’ equity | Special unitholder | Total
members’ equity (net assets) | ||||||||||||||||||||||||||||||||||
| Balances December 31, 2018 | 37,003,502 | $ | 37,004 | $ | 321,741,819 | $ | (19,870,206 | ) | $ | 698,460 | $ | 10,458,111 | $ | (208,579 | ) | $ | 123,962 | $ | 312,980,571 | $ | 1,797,138 | $ | 314,777,709 | |||||||||||||||||||||
| Proceeds from issuance of common stock, net | 4,436,019 | 4,436 | 38,915,071 | - | - | - | - | - | 38,919,507 | - | 38,919,507 | |||||||||||||||||||||||||||||||||
| Issuance of common stock under distribution reinvestment plan | 200,494 | 200 | 1,747,386 | - | - | - | - | - | 1,747,586 | - | 1,747,586 | |||||||||||||||||||||||||||||||||
| Repurchases of common stock | (141,933 | ) | (142 | ) | (1,235,142 | ) | - | - | - | - | - | (1,235,284 | ) | - | (1,235,284 | ) | ||||||||||||||||||||||||||||
| Offering costs | - | - | (292,923 | ) | - | - | - | - | - | (292,923 | ) | - | (292,923 | ) | ||||||||||||||||||||||||||||||
| Shareholder distributions | - | - | - | (5,765,110 | ) | - | - | - | - | (5,765,110 | ) | - | (5,765,110 | ) | ||||||||||||||||||||||||||||||
| Distributions to special unitholder | - | - | - | - | - | - | - | - | - | - | - | |||||||||||||||||||||||||||||||||
| Net investment income | - | - | - | (795,343 | ) | - | - | - | - | (795,343 | ) | - | (795,343 | ) | ||||||||||||||||||||||||||||||
| Net realized gain on investments | - | - | - | - | - | - | - | - | - | - | - | |||||||||||||||||||||||||||||||||
| Net change in unrealized appreciation on investments | - | - | - | - | - | 7,806,688 | - | - | 7,806,688 | 1,858,535 | 9,665,223 | |||||||||||||||||||||||||||||||||
| Net change in unrealized depreciation on foreign currency translation | - | - | - | - | - | - | 29,728 | - | 29,728 | - | 29,728 | |||||||||||||||||||||||||||||||||
| Net change in unrealized depreciation on swap contracts | - | - | - | - | - | - | - | (2,011,390 | ) | (2,011,390 | ) | (402,278 | ) | (2,413,668 | ) | |||||||||||||||||||||||||||||
| Change in benefit from deferred taxes on unrealized appreciation (depreciation) on investments | - | - | - | - | - | (1,367,968 | ) | - | - | (1,367,968 | ) | - | (1,367,968 | ) | ||||||||||||||||||||||||||||||
| Balances at March 31, 2019 | 41,498,082 | $ | 41,498 | $ | 360,876,211 | $ | (26,430,659 | ) | $ | 698,460 | $ | 16,896,831 | $ | (178,851 | ) | $ | (1,887,428 | ) | $ | 350,016,062 | $ | 3,253,395 | $ | 353,269,457 | ||||||||||||||||||||
| Proceeds from issuance of common stock, net | 2,826,332 | 2,826 | 24,749,726 | - | - | - | - | - | 24,752,552 | - | 24,752,552 | |||||||||||||||||||||||||||||||||
| Issuance of common stock under distribution reinvestment plan | 185,559 | 186 | 1,606,825 | - | - | - | - | - | 1,607,011 | - | 1,607,011 | |||||||||||||||||||||||||||||||||
| Repurchases of common stock | (292,954 | ) | (293 | ) | (2,533,689 | ) | - | - | - | - | - | (2,533,982 | ) | - | (2,533,982 | ) | ||||||||||||||||||||||||||||
| Offering costs | - | - | 2,075 | - | - | - | - | - | 2,075 | - | 2,075 | |||||||||||||||||||||||||||||||||
| Shareholder distributions | - | - | - | (6,363,208 | ) | - | - | - | - | (6,363,208 | ) | - | (6,363,208 | ) | ||||||||||||||||||||||||||||||
| Distributions to special unitholder | - | - | - | - | - | - | - | - | - | - | - | |||||||||||||||||||||||||||||||||
| Net investment income | - | - | - | 1,417,709 | - | - | - | - | 1,417,709 | - | 1,417,709 | |||||||||||||||||||||||||||||||||
| Net realized gain on investments | - | - | - | - | - | - | - | - | - | - | - | |||||||||||||||||||||||||||||||||
| Net change in unrealized appreciation on investments | - | - | - | - | - | 8,864,101 | - | - | 8,864,101 | 534,816 | 9,398,917 | |||||||||||||||||||||||||||||||||
| Net change in unrealized depreciation on foreign currency translation | - | - | - | - | - | - | 28,093 | - | 28,093 | - | 28,093 | |||||||||||||||||||||||||||||||||
| Net change in unrealized depreciation on swap contracts | - | - | - | - | - | - | - | (2,773,926 | ) | (2,773,926 | ) | (554,785 | ) | (3,328,711 | ) | |||||||||||||||||||||||||||||
| Change in benefit from deferred taxes on unrealized appreciation (depreciation) on investments | - | - | - | - | - | (2,559,599 | ) | - | - | (2,559,599 | ) | - | (2,559,599 | ) | ||||||||||||||||||||||||||||||
| Balances at June 30, 2019 | 44,217,019 | $ | 44,217 | $ | 384,701,148 | $ | (31,376,158 | ) | $ | 698,460 | $ | 23,201,333 | $ | (150,758 | ) | $ | (4,661,354 | ) | $ | 372,456,888 | $ | 3,233,426 | $ | 375,690,314 | ||||||||||||||||||||
| Proceeds from issuance of common stock, net | 2,021,098 | 2,021 | 17,704,075 | - | - | - | - | - | 17,706,096 | - | 17,706,096 | |||||||||||||||||||||||||||||||||
| Issuance of common stock under distribution reinvestment plan | 187,796 | 188 | 1,596,151 | - | - | - | - | - | 1,596,339 | - | 1,596,339 | |||||||||||||||||||||||||||||||||
| Repurchases of common stock | (297,932 | ) | (298 | ) | (2,552,046 | ) | - | - | - | - | - | (2,552,344 | ) | - | (2,552,344 | ) | ||||||||||||||||||||||||||||
| Proceeds from shares transferred | - | - | - | - | - | - | - | - | - | - | - | |||||||||||||||||||||||||||||||||
| Shareholder distributions | - | - | - | (6,759,498 | ) | - | - | - | - | (6,759,498 | ) | - | (6,759,498 | ) | ||||||||||||||||||||||||||||||
| Distributions to special unitholder | - | - | - | - | - | - | - | - | - | - | - | |||||||||||||||||||||||||||||||||
| Net investment income | - | - | - | 2,067,331 | - | - | - | - | 2,067,331 | - | 2,067,331 | |||||||||||||||||||||||||||||||||
| Net realized gain on investments | - | - | - | - | 6,683,326 | - | - | - | 6,683,326 | - | 6,683,326 | |||||||||||||||||||||||||||||||||
| Net change in unrealized appreciation on investments | - | - | - | - | - | 9,314,329 | - | - | 9,314,329 | 2,985,064 | 12,299,393 | |||||||||||||||||||||||||||||||||
| Net change in unrealized depreciation on foreign currency translation | - | - | - | - | - | - | (15,767 | ) | - | (15,767 | ) | - | (15,767 | ) | ||||||||||||||||||||||||||||||
| Net change in unrealized depreciation on swap contracts | - | - | - | - | - | - | - | (1,980,844 | ) | (1,980,844 | ) | (396,169 | ) | (2,377,013 | ) | |||||||||||||||||||||||||||||
| Change in benefit from deferred taxes on unrealized appreciation (depreciation) on investments | - | - | - | - | - | (3,573,207 | ) | - | - | (3,573,207 | ) | - | (3,573,207 | ) | ||||||||||||||||||||||||||||||
| Balances at September 30, 2019 | 46,127,981 | 46,128 | 401,449,328 | (36,068,325 | ) | 7,381,786 | 28,942,455 | (166,525 | ) | (6,642,198 | ) | $ | 394,942,649 | 5,822,321 | $ | 400,764,970 | ||||||||||||||||||||||||||||
The accompanying notes are an integral part of these consolidated financial statements.
4
GREENBACKER RENEWABLE ENERGY COMPANY LLC AND SUBSIDIARIES
CONSOLIDATED STATEMENTS OF CASH FLOWS
(unaudited)
| For the nine months ended September 30, 2020 | For the nine months ended September 30, 2019 | |||||||
| Operating activities: | ||||||||
| Net increase in net assets from operations | $ | 36,822,334 | $ | 25,158,444 | ||||
| Adjustments to reconcile net increase in net assets from operations to net cash provided by (used in) operating activities: | ||||||||
| Amortization of deferred financing costs | 170,212 | 169,590 | ||||||
| Purchase of investments | (225,472,781 | ) | (207,825,303 | ) | ||||
| Return of capital | 91,973,455 | 84,913,273 | ||||||
| Proceeds from principal payments and sales of investments | 54,209,134 | 16,937,261 | ||||||
| Net realized (gain) on investments | (6,186,076 | ) | (6,683,326 | ) | ||||
| Net change in unrealized (appreciation) on investments | (33,921,156 | ) | (30,010,301 | ) | ||||
| Net change in unrealized (appreciation) depreciation on foreign currency translation | (26,933 | ) | (42,054 | ) | ||||
| Net change in unrealized (appreciation) depreciation on swap contracts | 6,147,327 | 6,766,160 | ||||||
| Deferred tax expense | (2,031,124 | ) | 6,947,122 | |||||
| (Increase) decrease in other assets: | ||||||||
| Receivable for investments sold | 21,705,889 | (15,374,761 | ) | |||||
| Dividend receivable | (1,105,343 | ) | (12,000 | ) | ||||
| Other assets | (2,141,590 | ) | (297,125 | ) | ||||
| Increase (decrease) in other liabilities: | ||||||||
| Payable for investments purchased | (3,787,552 | ) | (8,901 | ) | ||||
| Due to advisor, net | - | (19,181 | ) | |||||
| Management fee payable | 208,870 | (305,784 | ) | |||||
| Performance participation fee payable | 2,706,252 | - | ||||||
| Accounts payable and accrued expenses | 256,733 | 670,943 | ||||||
| Interest payable | 2,217 | 6,330 | ||||||
| Net cash provided by (used in) operating activities | (60,470,132 | ) | (119,009,613 | ) | ||||
| Financing activities: | ||||||||
| Borrowings on Credit facility and term note | 17,220,062 | 38,898,428 | ||||||
| Paydowns on Credit facility and term note | (15,966,292 | ) | (1,231,862 | ) | ||||
| Payments of financing costs | (350,016 | ) | (1,987,153 | ) | ||||
| Proceeds from issuance of shares of common stock, net | 97,675,538 | 81,504,974 | ||||||
| Distributions paid | (17,049,341 | ) | (13,549,879 | ) | ||||
| Offering costs | - | (290,848 | ) | |||||
| Repurchases of common stock | (7,266,137 | ) | (5,108,082 | ) | ||||
| Distribution to special unitholder | (3,303,116 | ) | - | |||||
| Net cash provided by financing activities | 70,960,698 | 98,235,578 | ||||||
| Net increase (decrease) in cash and cash equivalents | 10,490,566 | (20,774,035 | ) | |||||
| Cash, cash equivalents and restricted cash, beginning of period | 9,066,091 | 39,122,635 | ||||||
| Cash, cash equivalents and restricted cash, end of period | $ | 19,556,657 | $ | 18,348,600 | ||||
| Reconciliation of cash, cash equivalents and restricted cash per the Consolidated Statements of Assets and Liabilities | ||||||||
| Cash and Cash equivalents | $ | 19,556,657 | $ | 14,772,600 | ||||
| Restricted Cash | - | 3,576,000 | ||||||
| Total cash, cash equivalents and restricted cash | $ | 19,556,657 | $ | 18,348,600 | ||||
| Supplemental disclosure of cash flow information: | ||||||||
| Shareholder distributions payable | $ | 2,708,124 | $ | 1,647,784 | ||||
| Payable for investment purchased | $ | 3,714,715 | $ | - | ||||
| Shareholder distributions reinvested in common stock | $ | 5,045,649 | $ | 4,950,936 | ||||
| Payable for repurchases of common stock | $ | 5,958,111 | $ | 2,463,337 | ||||
| Cash interest paid during the period | $ | 2,413,442 | $ | 1,360,409 | ||||
| Non cash financing activities | ||||||||
| Shareholder receivable from sale of common stock | $ | 579,243 | $ | 250,000 | ||||
The accompanying notes are an integral part of these consolidated financial statements.
5
GREENBACKER RENEWABLE ENERGY COMPANY LLC AND SUBSIDIARIES
CONSOLIDATED SCHEDULES OF INVESTMENTS
September 30, 2020
(unaudited)
| Investments in controlled/affiliated Portfolios | Interest | Maturity | Shares or Principal Amount | Cost | Fair Value | Percentage of Net Assets (a) |
||||||||||||||||
| Limited Liability Company Member Interests in the United States- Not readily marketable | ||||||||||||||||||||||
| Battery Storage | ||||||||||||||||||||||
| Pacifica Portfolio | 100% Ownership | $ | 8,685,904 | $ | 8,685,904 | 1.7 | % | |||||||||||||||
| Total Battery Storage - 1.7% | $ | 8,685,904 | $ | 8,685,904 | 1.7 | % | ||||||||||||||||
| Biomass | ||||||||||||||||||||||
| Eagle Valley Biomass Portfolio | 100% Ownership | $ | 22,336,352 | $ | 22,336,352 | 4.3 | % | |||||||||||||||
| Total Biomass - 4.3% | $ | 22,336,352 | $ | 22,336,352 | 4.3 | % | ||||||||||||||||
| Commercial Solar | ||||||||||||||||||||||
| Canadian Northern Lights Portfolio (d) | 100% Ownership | $ | 1,603,136 | $ | 1,598,127 | 0.3 | % | |||||||||||||||
| Conic Portfolio | Managing Member, Majority Equity Owner | 12,704,841 | 15,941,621 | 3.1 | % | |||||||||||||||||
| East to West Solar Portfolio | 100% equity ownership or Managing Member, Majority Equity Owner | 24,618,117 | 22,407,183 | 4.3 | % | |||||||||||||||||
| Foresight Solar Portfolio | Managing Member, Majority Equity Owner | 15,390,000 | 21,551,738 | 4.2 | % | |||||||||||||||||
| Golden Horizons Solar Portfolio | 100% Ownership | 9,290,000 | 17,374,205 | 3.4 | % | |||||||||||||||||
| Green Maple Portfolio | 100% Ownership | 26,844,254 | 26,697,418 | 5.2 | % | |||||||||||||||||
| Longleaf Solar Portfolio | Managing Member, Majority Equity Owner | 23,105,319 | 24,488,155 | 4.7 | % | |||||||||||||||||
| Magnolia Sun Portfolio | 100% Ownership | 33,011,197 | 36,577,895 | 7.1 | % | |||||||||||||||||
| Midway III Solar Portfolio | Managing Member, Majority Equity Owner | 11,525,465 | 13,133,551 | 2.5 | % | |||||||||||||||||
| Six States Solar Portfolio | 100% Ownership | 12,470,306 | 12,840,051 | 2.5 | % | |||||||||||||||||
| Sunny Mountain Portfolio | 100% Ownership | 888,081 | 742,853 | 0.1 | % | |||||||||||||||||
| Trillium Portfolio | Managing Member, Majority Equity Owner | 117,549,336 | 150,668,216 | 29.1 | % | |||||||||||||||||
| Total Commercial Solar - 66.5% | $ | 289,000,052 | $ | 344,021,013 | 66.5 | % | ||||||||||||||||
| Wind | ||||||||||||||||||||||
| Greenbacker Wind Portfolio - California | 100% Ownership | $ | 9,500,000 | $ | 9,039,954 | 1.7 | % | |||||||||||||||
| Greenbacker Wind Portfolio - HoldCo | 100% Ownership | 73,920,267 | 78,011,040 | 15.1 | % | |||||||||||||||||
| Greenbacker Wind Portfolio - Massachusetts | Managing Member, Majority Equity Owner | 10,486,133 | 11,861,232 | 2.3 | % | |||||||||||||||||
| Greenbacker Wind Portfolio - Montana | 100% Ownership or Managing Member, Equity Owner | 25,064,201 | 25,790,576 | 5.0 | % | |||||||||||||||||
| Total Wind - 24.1% | $ | 118,970,601 | $ | 124,702,802 | 24.1 | % | ||||||||||||||||
| Pre-Operational Assets | ||||||||||||||||||||||
| Citrine Portfolio | 100% Ownership | $ | 3,189,290 | $ | 3,189,290 | 0.6 | % | |||||||||||||||
| Greenbacker Wind Portfolio - Maine | 100% Ownership | 6,075,587 | 15,976,531 | 3.1 | % | |||||||||||||||||
| SE Solar 2019 Portfolio | 100% Ownership | 10,433,667 | 10,433,667 | 2.0 | % | |||||||||||||||||
| Turquoise Solar Portfolio | 100% Ownership | 24,431,513 | 24,431,513 | 4.7 | % | |||||||||||||||||
| Total Pre-Operational Assets - 10.4% | $ | 44,130,057 | $ | 54,031,001 | 10.4 | % | ||||||||||||||||
| Other Investments | ||||||||||||||||||||||
| Other Portfolios | (c) | $ | 8,834,837 | $ | 8,292,962 | 1.6 | % | |||||||||||||||
| Total Other Investments - 1.6% | $ | 8,834,837 | $ | 8,292,962 | 1.6 | % | ||||||||||||||||
| Energy Efficiency in the United States | ||||||||||||||||||||||
| GREC Energy Efficiency Portfolio | 100% Ownership | $ | 350,252 | $ | 352,309 | 0.1 | % | |||||||||||||||
| Renew AEC One, LLC | 10.25 | %(b) | 2/24/2025 | $428,640 | 428,640 | 428,640 | 0.1 | % | ||||||||||||||
| Total Energy Efficiency - 0.2% | $ | 778,892 | $ | 780,949 | 0.2 | % | ||||||||||||||||
| Total Investments in controlled/affiliated Portfolios | $ | 492,736,695 | $ | 562,850,983 | 108.8 | % | ||||||||||||||||
| Investments in non-controlled/non-affiliated Portfolios | ||||||||||||||||||||||
| Secured Loans - Not readily marketable | ||||||||||||||||||||||
| Encore Loan | 10.00 | % | 2/28/2021 | $ | 7,574,330 | $ | 7,574,330 | $ | 7,574,330 | 1.5 | % | |||||||||||
| Hudson Loan | 8.00 | % | 1/31/2021 | 9,945,275 | 9,945,275 | 9,945,275 | 1.9 | % | ||||||||||||||
| New Market Loan | 9.00 | % | 1/31/2021 | 5,007,350 | 5,007,350 | 5,007,350 | 1.0 | % | ||||||||||||||
| SE Solar Loan | 9.00 | % | 2/21/2021 | 5,005,244 | 5,005,244 | 5,005,244 | 1.0 | % | ||||||||||||||
| TUUSSO Loan | 8.00 | % | 4/30/2021 | 4,217,046 | 4,217,046 | 4,217,046 | 0.8 | % | ||||||||||||||
| Total Secured Loans - Not readily marketable - 6.2% | $ | 31,749,245 | $ | 31,749,245 | 6.2 | % | ||||||||||||||||
| Total Investments in controlled/affiliated Portfolios | $ | 31,749,245 | $ | 31,749,245 | 6.2 | % | ||||||||||||||||
| TOTAL INVESTMENTS: 115.0% | $ | 524,485,940 | $ | 594,600,228 | 115.0 | % | ||||||||||||||||
| LIABILITIES IN EXCESS OF OTHER ASSETS OTHER THAN INVESTMENTS: -15.0% | (76,966,181 | ) | -15.0 | % | ||||||||||||||||||
| TOTAL NET ASSETS: 100.0% | $ | 517,634,047 | 100.0 | % | ||||||||||||||||||
| (a) | Percentages are based on net assets of $517,634,047 as of September 30, 2020. |
| (b) | Per the loan agreement, interest commenced on January 24, 2016. |
| (c) | Includes pre-acquisition and due diligence expenses. |
| (d) | Portfolio is located outside of the United States of America. |
Interest Rate Swaps
| Counterparty | Pay / Receive Floating Rate | Floating Rate Index | Fixed Pay Rate | Payment Frequency | Maturity Date | Notional Amount | Value | Upfront Premiums Paid (Received) | ||||||||||||||||
| Fifth Third Financial Risk Solutions | Receive | 1-MO-USD-LIBOR | 1.110 | % | Monthly | 7/9/2021 | $ | 3,105,556 | $ | (22,791 | ) | $ | - | |||||||||||
| Fifth Third Financial Risk Solutions | Receive | 1-MO-USD-LIBOR | 2.261 | % | Monthly | 2/29/2032 | 17,643,332 | (1,816,804 | ) | - | ||||||||||||||
| Fifth Third Financial Risk Solutions | Receive | 1-MO-USD-LIBOR | 2.648 | % | Monthly | 12/31/2038 | 26,169,703 | (3,823,430 | ) | - | ||||||||||||||
| Fifth Third Financial Risk Solutions | Receive | 1-MO-USD-LIBOR | 2.965 | % | Monthly | 12/31/2038 | 3,767,597 | (693,015 | ) | - | ||||||||||||||
| Fifth Third Financial Risk Solutions | Receive | 1-MO-USD-LIBOR | 2.668 | % | Monthly | 12/31/2034 | 35,418,617 | (4,669,629 | ) | - | ||||||||||||||
| $ | (11,025,669 | ) | $ | - | ||||||||||||||||||||
The accompanying notes are an integral part of these consolidated financial statements.
6
GREENBACKER RENEWABLE ENERGY COMPANY LLC AND SUBSIDIARIES
CONSOLIDATED SCHEDULES OF INVESTMENTS
December 31, 2019
| Investments in controlled/affiliated portfolios | Interest | Maturity | Shares or Principal Amount | Cost | Fair Value | Percentage of Net Assets (a) | ||||||||||||||||
| Limited Liability Company Member Interests in the United States- Not readily marketable | ||||||||||||||||||||||
| Biomass | ||||||||||||||||||||||
| Eagle Valley Biomass Portfolio | 100% Ownership | $ | 21,425,600 | $ | 21,425,600 | 5.2 | % | |||||||||||||||
| Total Biomass - 5.2% | $ | 21,425,600 | $ | 21,425,600 | 5.2 | % | ||||||||||||||||
| Commercial Solar | ||||||||||||||||||||||
| Conic Portfolio | Managing member, majority equity owner | $ | 12,077,823 | $ | 17,828,206 | 4.3 | % | |||||||||||||||
| East to West Solar Portfolio | 100% equity ownership or Managing member, majority equity owner | 39,109,190 | 41,214,191 | 9.9 | % | |||||||||||||||||
| Foresight Solar Portfolio | Managing Member, Majority Equity Owner | 13,790,000 | 14,965,339 | 3.6 | % | |||||||||||||||||
| Golden Horizons Solar Portfolio | 100% Ownership | 9,290,000 | 15,132,017 | 3.6 | % | |||||||||||||||||
| Green Maple Portfolio | 100% Ownership | 26,561,596 | 27,268,058 | 6.6 | % | |||||||||||||||||
| Longleaf Solar Portfolio | Managing member, majority equity owner | 22,797,404 | 24,605,536 | 5.9 | % | |||||||||||||||||
| Magnolia Sun Portfolio | 100% Ownership | 10,775,000 | 6,460,457 | 1.6 | % | |||||||||||||||||
| Midway III Solar Portfolio | Managing member, majority equity owner | 10,575,394 | 11,475,652 | 2.8 | % | |||||||||||||||||
| Six States Solar Portfolio | 100% Ownership | 12,655,306 | 12,799,005 | 3.1 | % | |||||||||||||||||
| Sunny Mountain Portfolio | 100% Ownership | 884,578 | 743,768 | 0.2 | % | |||||||||||||||||
| Total Commercial Solar - 41.5% | $ | 158,516,291 | $ | 172,492,229 | 41.5 | % | ||||||||||||||||
| Residential Solar | ||||||||||||||||||||||
| Canadian Northern Lights Portfolio (d) | 100% Ownership | $ | 1,603,136 | $ | 1,611,955 | 0.4 | % | |||||||||||||||
| Greenbacker Residential Solar Portfolio | 100% Ownership or Managing Member, Majority Equity Owner | 28,100,000 | 32,540,979 | 7.8 | % | |||||||||||||||||
| Greenbacker Residential Solar Portfolio II | Managing Member, Majority Equity Owner | 6,400,000 | 13,279,521 | 3.2 | % | |||||||||||||||||
| Total Residential Solar - 11.4% | $ | 36,103,136 | $ | 47,432,455 | 11.4 | % | ||||||||||||||||
| Wind | ||||||||||||||||||||||
| Greenbacker Wind Portfolio - California | 100% Ownership | $ | 9,500,000 | $ | 8,777,056 | 2.1 | % | |||||||||||||||
| Greenbacker Wind Portfolio - HoldCo | 100% Ownership | 25,753,111 | 35,089,021 | 8.4 | % | |||||||||||||||||
| Greenbacker Wind Portfolio - Iowa | (e) | 20,440,000 | 20,440,000 | 4.9 | % | |||||||||||||||||
| Greenbacker Wind Portfolio - Massachusetts | Managing member, majority equity owner | 10,169,079 | 10,902,726 | 2.6 | % | |||||||||||||||||
| Greenbacker Wind Portfolio - Montana | 100% Ownership or Managing Member, Equity Owner | 24,756,684 | 26,451,773 | 6.4 | % | |||||||||||||||||
| Total Wind - 24.5% | $ | 90,618,874 | $ | 101,660,576 | 24.5 | % | ||||||||||||||||
| Pre-Operational Assets | ||||||||||||||||||||||
| Citrine Portfolio | 100% Ownership | $ | 3,411,249 | $ | 3,411,249 | 0.8 | % | |||||||||||||||
| Colorado CES Portfolio | 100% Ownership | 4,517,354 | 4,517,354 | 1.1 | % | |||||||||||||||||
| Electric City Portfolio | 100% Ownership | 4,208,484 | 4,208,484 | 1.0 | % | |||||||||||||||||
| Omni DG Portfolio | 100% Ownership | 17,900,298 | 17,900,298 | 4.3 | % | |||||||||||||||||
| Opal Portfolio | 100% Ownership | 344,949 | 344,949 | 0.1 | % | |||||||||||||||||
| Oregon Sun Portfolio | 100% Ownership | 5,404,787 | 5,404,787 | 1.3 | % | |||||||||||||||||
| Phoenix Solar Portfolio | 100% Ownership | 4,051,138 | 4,051,138 | 1.0 | % | |||||||||||||||||
| SE Solar 2019 Portfolio | 100% Ownership | 5,000,000 | 5,000,000 | 1.2 | % | |||||||||||||||||
| Trillium Portfolio | Managing member, majority equity owner | 24,277,396 | 24,277,396 | 5.8 | % | |||||||||||||||||
| Turquoise Solar Portfolio | 100% Ownership | 26,602,532 | 26,602,532 | 6.4 | % | |||||||||||||||||
| Total Pre-Operational Assets - 23.0% | $ | 95,718,187 | $ | 95,718,187 | 23.0 | % | ||||||||||||||||
| Other Investments | ||||||||||||||||||||||
| Other Portfolios | (c) | $ | 12,656,710 | $ | 12,473,975 | 3.0 | % | |||||||||||||||
| Total Other Investments - 3.0% | $ | 12,656,710 | $ | 12,473,975 | 3.0 | % | ||||||||||||||||
| Energy Efficiency in the United States | ||||||||||||||||||||||
| GREC Energy Efficiency Portfolio | 100% Ownership | $ | 388,044 | $ | 390,019 | 0.1 | % | |||||||||||||||
| Renew AEC One, LLC | 10.25 | %(b) | 2/24/2025 | $ | 479,140 | 479,140 | 479,140 | 0.1 | % | |||||||||||||
| Total Energy Efficiency - 0.2% | $ | 867,184 | $ | 869,159 | 0.2 | % | ||||||||||||||||
| Total Investments in controlled/affiliated Portfolios | $ | 415,905,982 | $ | 452,072,181 | 108.8 | % | ||||||||||||||||
| Investments in non-controlled/non-affiliated portfolios | ||||||||||||||||||||||
| Secured Loans - Not readily marketable | ||||||||||||||||||||||
| Encore Loan | 10.00 | % | 10/11/2020 | $ | 5,000,680 | $ | 5,000,680 | $ | 5,000,680 | 1.2 | % | |||||||||||
| Hudson Loan | 8.00 | % | 3/31/2020 | 9,481,127 | 9,481,127 | 9,481,127 | 2.3 | % | ||||||||||||||
| New Market Loan | 9.00 | % | 10/3/2020 | 5,000,000 | 5,000,000 | 5,000,000 | 1.2 | % | ||||||||||||||
| SE Solar Loan | 9.00 | % | 2/21/2020 | 1,000,000 | 1,000,000 | 1,000,000 | 0.2 | % | ||||||||||||||
| TUUSSO Loan | 8.00 | % | 6/30/2020 | 2,621,883 | 2,621,883 | 2,621,883 | 0.6 | % | ||||||||||||||
| Total Secured Loans - Not readily marketable - 5.6% | $ | 23,103,690 | $ | 23,103,690 | 5.6 | % | ||||||||||||||||
| Total Investments in non-controlled/non-affiliated portfolios | $ | 23,103,690 | 23,103,690 | 5.6 | % | |||||||||||||||||
| TOTAL INVESTMENTS: 114.3% | $ | 439,009,672 | $ | 475,175,871 | 114.3 | % | ||||||||||||||||
| LIABILITIES IN EXCESS OF OTHER ASSETS OTHER THAN INVESTMENTS: -14.3% | (59,538,411 | ) | -14.3 | % | ||||||||||||||||||
| TOTAL NET ASSETS: 100% | $ | 415,637,460 | 100.0 | % | ||||||||||||||||||
| (a) | Percentages are based on net assets of $415,637,460 as of December 31, 2019. |
| (b) | Per the loan agreement, interest commenced on January 24, 2016. |
| (c) | Includes pre-acquisition and due diligence expenses. |
| (d) | Portfolio is located outside of the United States of America. |
Interest Rate Swaps
| Counterparty | Pay / Receive Floating Rate | Floating Rate Index | Fixed Pay Rate | Payment Frequency | Maturity Date | Notional Amount | Value | Upfront Premiums Paid (Received) | ||||||||||||||||
| Fifth Third Financial Risk Solutions | Receive | 1-MO-USD-LIBOR | 1.110 | % | Monthly | 7/9/2021 | 3,320,556 | $ | 21,223 | $ | - | |||||||||||||
| Fifth Third Financial Risk Solutions | Receive | 1-MO-USD-LIBOR | 2.261 | % | Monthly | 2/29/2032 | 18,981,540 | (611,198 | ) | - | ||||||||||||||
| Fifth Third Financial Risk Solutions | Receive | 1-MO-USD-LIBOR | 2.648 | % | Monthly | 12/31/2038 | 27,662,350 | (1,725,805 | ) | - | ||||||||||||||
| Fifth Third Financial Risk Solutions | Receive | 1-MO-USD-LIBOR | 2.965 | % | Monthly | 12/31/2038 | 3,946,615 | (359,271 | ) | - | ||||||||||||||
| Fifth Third Financial Risk Solutions | Receive | 1-MO-USD-LIBOR | 2.668 | % | Monthly | 12/31/2034 | 37,560,113 | (2,203,292 | ) | - | ||||||||||||||
| $ | (4,878,343 | ) | $ | - | ||||||||||||||||||||
The accompanying notes are an integral part of these consolidated financial statements.
7
GREENBACKER RENEWABLE ENERGY COMPANY LLC AND SUBSIDIARIES
NOTES TO CONSOLIDATED FINANCIAL STATEMENTS
September 30, 2020 (unaudited)
Note 1. Organization and Operations of the Company
Greenbacker Renewable Energy Company LLC (the “LLC”), a Delaware limited liability company, formed in December 2012, is an externally managed energy company that acquires and manages income-generating renewable energy and energy efficiency projects, and other energy-related businesses, as well as finances the construction and/or operation of these and other sustainable development projects and businesses. The LLC conducts substantially all its operations through its wholly owned subsidiary, Greenbacker Renewable Energy Corporation (“GREC”). GREC is a Maryland corporation formed in November 2011 and the LLC currently holds all the outstanding shares of capital stock of GREC. GREC Entity HoldCo LLC (“GREC HoldCo”), a wholly owned subsidiary of GREC, was formed in Delaware in June 2016. GREC Administration LLC and Danforth Shared Services LLC, both wholly-owned subsidiaries of GREC, were formed in Delaware in January 2020 and May 2019, respectively. The use of “we,” “us,” “our” and the “company” refers, collectively, to the LLC, GREC, GREC HoldCo, Danforth Shared Services LLC, and GREC Administration LLC. We are externally managed and advised by our advisor, Greenbacker Capital Management LLC (the “advisor” or “GCM”), a renewable energy, energy efficiency and sustainability related project acquisition, consulting and development company that is registered as an investment adviser under the Investment Advisers Act of 1940, as amended (“Advisers Act”). The LLC’s fiscal year end is December 31.
Pursuant to an initial Registration Statement filed in December 2011 (File No. 333-178786-01) and a second Registration Statement filed in February 2017 (File No. 333-211571), the company offered up to $1,000,000,000 in shares of limited liability company interests, or the shares. As of March 29, 2019, the company terminated its public offering of the shares as well as its privately offered Class P-A shares. While the company publicly offered three classes of shares: Classes A, C and I, currently the company is only privately offering Class P-I shares on a continuous basis. The share classes had different selling commissions, dealer manager fees and there is an ongoing distribution fee with respect to Class C shares. The company has adopted the Distribution Reinvestment Plan (“DRP”) pursuant to which a shareholder owning publicly offered share classes may elect to have the full amount of cash distributions reinvested in additional shares. Following the termination of the company’s public offering of shares, the DRP and the share repurchase plan will continue to be available to existing investors. As of June 4, 2019, pursuant to our Registration Statement on Form S-3 (File No. 333-231960) we are offering a maximum of $10,000,000 in shares to our existing shareholders pursuant to the DRP.
Each quarter, our advisor, utilizing the services of an independent valuation firm, reviews and approves the net asset value for each class of shares, subject to the oversight of the company’s board of directors. To the extent that the net asset value per share on the most recent valuation date increases or decreases, the company will adjust the offering price of the P-I shares to the then net asset value per share. Currently, Class A, C and I shares are offered pursuant to the DRP at a price equal to the net asset value.
As of September 30, 2020, the company has made solar, wind, biomass, battery storage, and energy efficiency investments in 27 portfolios, 26 domiciled in the United States and one in Canada, as well as six secured loans in the United States (See Note 3). As of December 31, 2019, the company had made solar, wind, biomass, and energy efficiency investments in 36 portfolios, 35 domiciled in the United States and one in Canada, as well as six secured loans in the United States.
Note 2. Significant Accounting Policies
Basis of Presentation
The company’s consolidated financial statements are prepared in accordance with U.S. generally accepted accounting principles (“GAAP”), which requires the use of estimates, assumptions, and the exercise of subjective judgment as to future uncertainties. Actual results could differ from those estimates, assumptions, and judgments. Significant items subject to such estimates will include determining the fair value of investments, revenue recognition, income tax uncertainties, and other contingencies. The consolidated financial statements of the company include the accounts of the LLC and its consolidated subsidiaries, GREC, GREC HoldCo, and GREC Administration LLC and Danforth Shared Services LLC, both of which provides administrative services to the company. All intercompany accounts and transactions have been eliminated.
8
The company’s consolidated financial statements are prepared using the specialized accounting principles of Accounting Standards Codification Topic 946, Financial Services—Investment Companies (“ASC Topic 946”). In accordance with this specialized accounting guidance, the company recognizes and carries all its investments, including investments in the underlying operating entities, at fair value with changes in fair value recognized in earnings. Additionally, the company will not apply the equity method of accounting to its investments. The company carries its liabilities at amounts payable, net of unamortized premiums or discounts. The company does not currently plan to elect to carry its non-investment liabilities at fair value. Net assets are calculated as the carrying amounts of assets, including the fair value of investments, less the carrying amounts of its liabilities.
The financial information associated with the September 30, 2020 consolidated financial statements has been prepared by management and, in the opinion of management, contains all adjustments and eliminations necessary for a fair presentation in accordance with GAAP.
Basis of Consolidation
As provided under Regulation S-X and ASC Topic 946, the company will generally not consolidate its investment in a company other than a wholly owned investment company or controlled operating company whose business consists of providing services to the company. Accordingly, the company consolidates in its consolidated financial statements the accounts of certain wholly owned subsidiaries that meet the criteria.
Cash and Cash Equivalents
Cash consists of demand deposits at a financial institution. Such deposits may be in excess of the Federal Deposit Insurance Corporation insurance limits. The company has not experienced any losses in any such accounts.
The company considers all highly liquid investments, purchased with an original maturity of three months or less, to be cash equivalents. As of September 30, 2020, the company had $8,432,696 in cash and $11,123,961 in cash equivalents presented on the Consolidated Statements of Assets and Liabilities. Short-term investments that are cash equivalents, which are considered level 1 investments, are stated at cost, which approximates fair value.
Restricted Cash
Restricted cash consists of cash accounts or letters of credit that are restricted for use on specific investments. As of September 30, 2020, the company did not have any restricted cash accounts.
Foreign Currency Translation
The accounting records of the company are maintained in U.S. Dollars. The fair value of investments and other assets and liabilities denominated in non-U.S. currencies are translated into U.S. Dollars using the exchange rate at the end of each reporting period. Amounts related to the purchases and sales of investments, investment income and expenses are translated at the rates of exchange prevailing on the respective dates of such transactions.
Net unrealized currency gains and losses arising from valuing foreign currency denominated assets and liabilities at the current exchange rate are reflected as part of net change in unrealized appreciation (depreciation) on translation of assets and liabilities denominated in foreign currencies in the consolidated statements of operations.
Foreign security and currency translations may involve certain considerations and risks not typically associated with investing in U.S. companies and U.S. government securities. These risks include, but are not limited to, currency fluctuations and revaluations and future adverse political, social and economic developments, which could cause investments in foreign markets to be less liquid and prices more volatile than those of comparable U.S. companies or U.S. government securities.
9
Valuation of Investments at Fair Value
Accounting Standards Codification Topic 820, Fair Value Measurement (“ASC Topic 820”) defines fair value, establishes a framework for measuring fair value in accordance with GAAP and expands disclosures about fair value. The company recognizes and accounts for its investments at fair value. The fair value of the investments does not reflect transaction costs that may be incurred upon disposition of the investments.
Fair value is defined as the price that would be received to sell an asset or paid to transfer a liability in an orderly transaction between market participants. Fair value is an exchange price notion under which fair value is the price in an orderly transaction between market participants to sell an asset or transfer a liability in the market in which the reporting entity would transact for the asset or liability.
The advisor has established procedures to estimate the fair value of its investments which the company’s board of directors has reviewed and approved. To the extent that such market data is available, the company will use observable market data to estimate the fair value of investments. In the absence of quoted market prices in active markets, or quoted market prices for similar assets in markets that are not active, the company will use the valuation methodologies described below with unobservable data based on the best available information in the circumstances. These methodologies incorporate the company’s assumptions about the factors that a market participant would also use to value the asset.
For investments for which quoted market prices are not available, which will comprise most of our investment portfolio, fair value will be estimated by using the income or market approach. The income approach assumes that value is created by the expectation of future benefits, discounted by a risk premium, to a calculate a current cash value. This estimate is the fair value: the amount an investor would be willing to pay to receive those future benefits. The market approach compares either recent comparable transactions to the investment or an offer to purchase an investment based upon a qualified bid: a signed term sheet and/or a signed purchase agreement. Adjustments to proposed prices are made to account for the probability of the deal closing, changes between proposed and executed terms, and any dissimilarity between the comparable transactions and their underlying investments. If multiple bids are qualified in the same valuation period, a blended market approach will be calculated.
Prior to Q2 2020, pre-operational assets were held at cost, as an approximation of fair value. Beginning in Q2 2020, our advisor evaluated the cash flow projections of pre-operational portfolios internally targeted to reach their commercial operations date (“COD”) within the 6-month period following the reporting quarter end. If the portfolio has any significant portion of value that remains subject to negotiation or contract, the investment may be held at cost, as an approximation of fair value. Otherwise, fair value of the portfolio will be determined based upon a discounted cash flow model methodology, prior to COD. During the two potential qualifying quarters preceding COD, eligible portfolios will be adjusted by construction discount rate premiums to quantify the risk of project delays and changes that continue to diminish as the COD nears. These valuation methodologies involve a significant degree of judgment.
In determining the appropriate fair value of an investment using these approaches, the most significant information and assumptions include, as applicable: available current market data, including relevant and applicable comparable market transactions, applicable market yields and multiples, security covenants, call protection provisions, information rights, the nature and realizable value of any collateral, the investment’s ability to make payments, its earnings and discounted cash flows, the markets in which the project does business, comparisons of financial ratios of peer companies that are public, comparable mergers and acquisitions, the principal market and enterprise values, environmental factors, among other factors.
The estimated fair values will not necessarily represent the amounts that may be ultimately realized due to the occurrence or non-occurrence of future circumstances that cannot be reasonably determined. Because of the inherent uncertainty of the valuation of the investments, the estimate of fair values may differ significantly from the value that would have been used had a broader market for the investments existed.
The authoritative accounting guidance prioritizes the use of market-based inputs over entity-specific inputs and establishes a three-level hierarchy for fair value measurements based upon the transparency of inputs to the valuation. The three levels of valuation hierarchy are defined as follows:
| Level 1: | Unadjusted quoted prices for identical assets or liabilities in active markets. |
| Level 2: | Other significant observable inputs that are sourced either directly or indirectly from publications or pricing services, including dealer or broker markets, for identical or comparable assets or liabilities. Generally, these inputs should be widely accepted and public, non-proprietary, and sourced from an independent third party. |
| Level 3: | Inputs derived from a significant amount of unobservable market data and derived primarily through the use of internal valuation methodologies. |
10
In all cases, the level in the fair value hierarchy within which the fair value measurement in its entirety falls will be determined based on the lowest level of input that is significant to the fair value measurement. Our assessment of the significance of an input to the fair value measurement in its entirety requires judgment and considers factors specific to each investment.
Calculation of Net Asset Value
Net asset value by share class is calculated by subtracting total liabilities for each class from the total carrying amount of all assets for that class, which includes the fair value of investments. Net asset value per share is calculated by dividing net asset value for each class by the total number of outstanding common shares for that class on the reporting date.
Earnings (Loss) per Share
In accordance with the provisions of ASC Topic 260 — Earnings per Share (“ASC Topic 260”), basic earnings per share is computed by dividing earnings available to common members by the weighted average number of shares outstanding during the period. Other potentially dilutive common shares, and the related impact to earnings, are considered when calculating earnings per share on a diluted basis.
The following information sets forth the computation of the weighted average basic and diluted net increase in net assets attributed to common members per share for the three and nine months ended September 30, 2020 and September 30, 2019.
| For the three months ended September 30, 2020 | For the three months ended September 30, 2019 | For the nine months ended September 30, 2020 | For the nine months ended September 30, 2019 | |||||||||||||
| Basic and diluted | ||||||||||||||||
| Net Increase in net assets attributed to common equityholders | $ | 19,099,886 | $ | 12,495,168 | $ | 35,668,026 | $ | 21,133,261 | ||||||||
| Weighted average common shares outstanding | 56,183,178 | 45,389,517 | 51,980,470 | 42,703,696 | ||||||||||||
| Net increase in net assets attributed to common equityholders per share | $ | 0.34 | $ | 0.28 | $ | 0.69 | $ | 0.49 | ||||||||
Revenue Recognition
To the extent the company expects to collect such amounts, interest income is recorded on an accrual basis. If there is reason to doubt an ability to collect such interest, interest receivable on loans and debt securities is not accrued for accounting purposes. Original issue discounts, market discounts or market premiums are accreted or amortized using the effective interest method as interest income. Prepayment premiums on loans and debt securities are recorded as interest income when received. Any application, origination or other fees earned by the company in arranging or issuing debt are amortized over the expected term of the loan.
Loans are placed on non-accrual status when principal and interest are 90 days or more past due, or when there is a reasonable doubt that principal or interest will be collected. Accrued interest is generally reversed when a loan is placed on non-accrual. Interest payments received on non-accrual loans may be recognized as income or applied to principal depending upon management’s judgment regarding collectability. Non-accrual loans are generally restored to accrual status when past due and principal and interest is paid and, in management’s judgment, is likely to remain current.
Dividend income is recorded when dividends are declared and determined that collection is probable. The timing and amount of dividend income is determined on at least a quarterly basis by GREC. This process includes an analysis at the individual project company level based on cash available from operations and working capital needed for the project company operations. Dividend income from our privately held, equity investments are recognized when approved. On a quarterly basis at a minimum, dividends received from the company’s project companies, which generally reflect net cash flow from operations, are declared, accrued, and paid.
11
Net Realized Gains or Losses and Net Change in Unrealized Appreciation or Depreciation on Investments
Without regard to unrealized appreciation or depreciation previously recognized, realized gains or losses will be measured as the difference between the net proceeds from the sale, repayment, or disposal of an asset and the adjusted cost basis of the asset. Net change in unrealized appreciation or depreciation will reflect the change in investment values during the reporting period, including any reversal of previously recorded unrealized appreciation or depreciation when gains or losses are realized.
Payment-in-Kind Interest
For loans and debt securities with contractual payment-in-kind interest, if the fair value of the investment indicates that such interest is collectible, any interest will be added to the principal balance of such investments and be recorded as income.
Distribution Policy
Distributions to members, if any, will be authorized and declared by our board of directors quarterly in advance and paid monthly. From time to time, we may also pay interim special distributions in the form of cash or shares, with the approval of our board of directors. Distributions will be made on all classes of shares at the same time. The cash distributions with respect to the Class C shares will be lower than the cash distributions with respect to the company’s other share classes because of the distribution fee associated with the Class C shares, which is allocated specifically to Class C net assets. Amounts distributed to each class are allocated amongst the holders of the shares in such class in proportion to their shares. Distributions declared by our board of directors are recognized as distribution liabilities on the ex-dividend date.
Organization and Offering Costs
Organization and offering costs (“O&O costs”), other than sales commissions and the dealer manager fee, were initially paid by our advisor and/or dealer manager on behalf of the company. These O&O costs included all costs previously paid or to be paid by the company in connection with its formation and the offering of its shares pursuant to now-terminated Registration Statements on Form S-1 (File No. 333-178786-01 and File No. 333-211571, respectively) and a private placement memorandum.
The company was obligated to reimburse our advisor for O&O costs that it incurred on behalf of the company, in accordance with the advisory agreement. However, with respect to the company’s public offerings, O&O was not to exceed 15% of gross offering proceeds. Total O&O costs related to the terminated Registration Statements amounted to $9.8 million, approximately 3.8% of gross offering proceeds raised pursuant to such Registration Statements.
The costs incurred by our advisor and/or dealer manager are recognized as a liability of the company to the extent that the company is obligated to reimburse our advisor and/or dealer manager. When recognized by the company, organizational costs are expensed and offering costs, excluding selling commissions and dealer manager fees, are recognized as a reduction of the proceeds from the offering. As of December 31, 2019, all the O&O costs incurred by our advisor with respect to the company’s public offerings had been reimbursed in full.
12
Financing Costs
Financing costs incurred by the company for the issuance of debt liabilities are deferred and amortized using the straight-line method over the life of the debt liability. Financing costs related to debt liabilities incurred by the company are presented on the consolidated statements of assets and liabilities as a direct deduction from the carrying amount of that debt liability.
Capital Gains Incentive Allocation and Distribution
Pursuant to the terms of the LLC’s Third amended and restated limited liability company agreement, a capital gains incentive allocation was earned by GREC Advisors, LLC (the “Special Unitholder”), an affiliate of our advisor, on realized gains (net of realized and unrealized losses) since inception from the sale of investments from the company’s portfolio during operations prior to a liquidation of the company. While the terms of the LLC’s amended and restated limited liability company agreement neither include nor contemplate the inclusion of unrealized gains in the calculation of the capital gains incentive allocation, the company included unrealized gains in the calculation of the capital gains incentive distribution. This amount reflected the incentive distribution that would be payable if the company’s entire portfolio was liquidated at its fair value as of the consolidated statements of assets and liabilities date even though the Special Unitholder is not entitled to an incentive distribution with respect to unrealized gains unless and until such gains are realized. Thus, on each date that net asset value was calculated, the company calculated for the capital gains incentive distribution by calculating such distribution as if it were due and payable as of the end of such period and reflected as an allocation of equity between common members and the Special Unitholder. As of December 31, 2019, a capital gains incentive distribution allocation in the amount of $6,897,808, was recorded in the Consolidated Statements of Assets and Liabilities as Special Unitholder’s equity.
In August 2020, the company entered into the LLC’s Fourth amended and restated limited liability company agreement. In such agreement, which was retroactively applied as of April 1, 2020, the incentive fee payable by the Company was simplified to replace the income incentive distribution, and capital gains incentive distribution with one singular performance participation fee, as described in the Performance Participation Fee section below. In connection with the termination of the methodology under the old agreement, a one-time distribution (settlement) in the amount of $4,749,000 was mutually agreed upon by the company and GREC Advisors, LLC (the “Special Unitholder”). The remaining $4,193,559 was written off by reclassing the Special Unitholder’s equity into Common equityholders’ equity upon adoption of the Fourth amended and restated limited liability company agreement. The $4,193,559 is presented on the Consolidated Statements of Operations as the net decrease in net assets attributed to special unitholder for the three months ended September 30, 2020. The $4,749,000 has not been paid as of September 30, 2020 and is recorded as Special Unitholder’s equity on the Consolidated Statements of Assets and Liabilities.
Performance Participation Fee
Under the LLC’s Fourth amended and restated limited liability company agreement made and entered into in August 2020, the incentive fee payable by the Company was simplified to be structured with two components; the performance participation fee, and the liquidation performance participation fee. The performance participation fee under the amended operating agreement is based on the Company’s total return amount during the relevant calculation period. The calculation of the performance participation fee is further detailed in Note 5. Related Party Agreements and Transactions Agreements. The performance participation fee is accounted for and classified as an operating expense and reflected as the performance participation fee on the Consolidated Statements of Operations. Under the new agreement, which as previously discussed was retroactively applied as of April 1, 2020, the performance participation fee payable and due for the second and third quarter was $1,410,527 and $2,043,327, respectively, and the total of $3,453,85 was recorded in the three months ending September 30, 2020. As a result of the revisions to prior period financial statements discussed in Note 11, there were a certain amount of proceeds paid under the company’s share repurchase program that otherwise would not have been paid due to the misstatement historically impacting the company’s offering price. As a result, GREC Advisors, LLC waived $747,602 of performance participation fees for the three and nine months ended September 30, 2020, shown as performance participation fee waiver on the Consolidated Statements of Operations. As of September 30, 2020, the total net amount of $2,706,252 remains unpaid and is reflected as the performance participation fee payable on the Consolidated Statements of Assets and Liabilities.
Deferred Sales Commissions
The company defers certain costs, principally sales commissions and related compensation, which are paid to the dealer manager and may be reallowed to financial advisors and broker/dealers in the future in connection with the sale of shares sold with a reduced front-end load sales charge and a trail fee. The costs expected to be incurred at the time of the sale of these shares are recorded as a liability on the date of sale and are amortized on a straight-line basis over the period beginning at the time of sale and ending on the earlier date of 1) when the maximum amount of sales commission and related compensation is reached under regulatory regulations or 2) the date which approximates an expected liquidity event for the company. As of September 30, 2020, and December 31, 2019, the company recorded a liability for deferred sales commissions in the amount of $170,155 and $56,483, respectively on the Consolidated Statements of Assets and Liabilities.
Reclassifications
Certain prior year amounts have been reclassified to conform with current year presentation. These reclassifications had no impact on prior periods’ results.
13
Derivative Instruments
The company may utilize interest rate swaps to modify interest rate characteristics of existing debt obligations to manage interest rate exposure. These are recorded at fair value either as assets or liabilities in the accompanying consolidated statements of assets and liabilities with changes in the fair value of interest rate swaps during the period recognized as either an unrealized appreciation or depreciation in the accompanying consolidated statements of operations. On the expiration, termination or settlement of a derivatives contract, the company generally records a gain or loss. When there is a master netting agreement with a financial institution, any gain or loss on interest rate swaps with the same financial institution are netted for financial statement presentation.
The fair value of interest rate swap contracts open as of September 30, 2020 is included on the consolidated schedules of investments by contract. For the nine months ended September 30, 2020, the company’s average monthly notional exposure to interest rate swap contracts was $88,501,597.
| Consolidated Statement of Assets and Liabilities - Fair Values of Derivatives at September 30, 2020 |
| Asset Derivates | Liability Derivatives | |||||||||||
| Risk Exposure | Consolidated Statement of Assets and Liabilities Location | Fair Value | Consolidated Statement of Assets and Liabilities Location | Fair Value | ||||||||
| Swaps | ||||||||||||
| Interest Rate Risk | Swap contracts, at fair value | $ | - | Swap contracts, at fair value | $ | 11,025,669 | ||||||
| $ | - | $ | 11,025,669 | |||||||||
| Consolidated Statement of Assets and Liabilities - Fair Values of Derivatives at December 31, 2019 |
| Asset Derivates | Liability Derivatives | |||||||||||
| Risk Exposure | Consolidated
Statement Location | Fair Value | Consolidated Statement of Assets and Liabilities Location | Fair Value | ||||||||
| Swaps | ||||||||||||
| Interest Rate Risk | Swap contracts, at fair value | $ | 21,223 | Swap contracts, at fair value | $ | 4,899,566 | ||||||
| $ | 21,223 | $ | 4,899,566 | |||||||||
14
The effect of derivative instruments on the Consolidated Statement of Operations
| Risk Exposure | Change
in net September 30, | Change
in net months
ended | Change
in net unrealized depreciation on derivative transactions for the nine months ended September 30, 2020 | Change
in net unrealized depreciation on derivative transactions for the nine months ended September 30, 2019 | ||||||||||||
| Swaps | ||||||||||||||||
| Interest Rate Risk | $ | 625,645 | $ | (1,980,844 | ) | $ | (6,147,327 | ) | $ | (6,766,160 | ) | |||||
| $ | 625,645 | $ | (1,980,844 | ) | $ | (6,147,327 | ) | $ | (6,766,160 | ) | ||||||
| Risk Exposure | Other expenses for the three months ended September 30, 2020 | Other expenses for the three months ended September 30, 2019 | Other expenses for the nine months ended September 30, 2020 | Other expenses for the nine months ended September 30, 2019 | ||||||||||||
| Swaps | ||||||||||||||||
| Interest Rate Risk | $ | 529,986 | $ | 28,311 | $ | 1,185,909 | $ | 62,093 | ||||||||
| $ | 529,986 | $ | 28,311 | $ | 1,185,909 | $ | 62,093 | |||||||||
By using derivative instruments, the company is exposed to the counterparty’s credit risk—the risk that derivative counterparties may not perform in accordance with the contractual provisions offset by the value of any collateral received. The company’s exposure to credit risk associated with counterparty non-performance is limited to collateral posted and the unrealized gains inherent in such transactions that are recognized in the consolidated statement of assets and liabilities. As appropriate, the company minimizes counterparty credit risk through credit monitoring procedures and managing margin and collateral requirements.
Regarding our investment in the Canadian Northern Lights Portfolio, we have foreign currency risk related to our revenue and operating expenses which are denominated in the Canadian Dollars as opposed to the U.S. Dollars.
15
Income Taxes
The LLC intends to operate so that it will qualify to be treated as a partnership for U.S. federal income tax purposes under the Internal Revenue Code. As such, it will not be subject to any U.S. federal and state income taxes. In any year, it is possible that the LLC will not meet the qualifying income exception and will not qualify to be treated as a partnership. If the LLC does not meet the qualifying income exception, the members would then be treated as stockholders in a corporation and the company would become taxable as a corporation for U.S. federal income tax purposes under the Internal Revenue Code. The LLC would be required to pay income tax at corporate rates on its net taxable income. To the extent of the company’s earnings and profits and the payment of the distributions would not be deductible by the LLC, distributions to members from the LLC would constitute dividend income taxable to such members
The LLC plans to conduct substantially all its operations through its wholly owned subsidiary, GREC, which is a corporation that is subject to U.S. federal, state, and local income taxes. Accordingly, most of its operations will be subject to U.S. federal, state, and local income taxes. As of September 30, 2020, including territories and provinces, the portfolio resides in 27 states.
Income taxes are accounted for under the assets and liabilities method. Deferred tax assets and liabilities are recorded for the estimated future tax consequences attributable to differences between items that are recognized in the consolidated financial statements and tax returns in different years. Deferred tax assets and liabilities are measured using enacted tax rates expected to apply to taxable income in the years in which those temporary differences are expected to be recovered or settled. The effect on deferred tax assets and liabilities of a change in tax rates is recognized in income in the period that includes the enactment date.
For income tax benefits to be recognized including uncertain tax benefits, a tax position must be more-likely-than-not to be sustained upon examination by taxing authorities. The amount recognized is measured as the largest amount of the benefit that is more-likely-than-not to be realized upon ultimate settlement. A valuation allowance is established against net deferred tax assets if, based on the weight of available evidence, it is more-likely-than-not that some or all of the net deferred tax assets will not be realized. Changes in recognition or measurement are reflected in the period in which the change in judgment occurs. Interest and penalties associated with income taxes, if any, will be recognized in general and administrative expense.
The company does not consolidate its investments for financial statements. The company accounts for its investments at fair value under the specialized accounting of ASC Topic 946. The tax attributes of the individual investments will be considered and incorporated in the company’s fair value estimates for those investments. The amounts recognized in the consolidated financial statements for unrealized appreciation and depreciation will result in a difference between the consolidated financial statements and the cost basis of the assets for tax purposes. These differences will be recognized as deferred tax assets and liabilities. Generally, the entities that hold the company’s investments will be included in the consolidated tax return of GREC and the differences between the amounts recognized for financial statement purposes and the tax return will be recognized as additional deferred tax assets and liabilities.
The company follows the authoritative guidance on accounting for uncertainty in income taxes and concluded it has no material uncertain tax positions to be recognized at this time.
The company assessed its tax positions for all open tax years as of September 30, 2020 for all U.S. federal and state tax jurisdictions for the years 2016 through 2019. The results of this assessment are included in the company’s tax provision and deferred tax assets as of September 30, 2020.
Recently Adopted Accounting Pronouncements
In August 2018, the FASB issued ASU No. 2018-13, “Fair Value Measurement (Topic 820): Disclosure Framework—Changes to the Disclosure Requirements for Fair Value Measurement”, which modifies the disclosure requirements on fair value measurements. The new guidance is effective for fiscal years, and interim periods within those fiscal years, beginning after December 15, 2019 (fiscal 2020 for the company). Upon the effective date, certain provisions are to be applied prospectively, while others are to be applied retrospectively to all periods presented. An entity is permitted to early adopt any removed or modified disclosures upon issuance of this ASU and delay adoption of the additional disclosures until their effective date. Beginning on January 1, 2020, we have adopted ASU 2018-13 on our consolidated financial statements and disclosures.
16
Recently Issued Accounting Pronouncements
In March 2020, the FASB issued ASU No. 2020-04, “Reference Rate Reform (Topic 848): Facilitation of the effects of Reference Rate Reform on Financial Reporting”, which provides companies with optional financial reporting alternatives to reduce the cost and complexity associated with the accounting for contracts and hedging relationships affected by reference rate reform. The amendments in this update are effective for all entities as of March 12, 2020 through December 31, 2022. An entity may elect to apply the amendments for contracts as of any date from the beginning of an interim period that includes or is subsequent to March 12, 2020. As of September 30, 2020, we have not elected to apply the optional amendments and are currently evaluating the impact of the ASU and the effect on our consolidated financial statements.
Revisions to Prior Period Financial Statements
As discussed further in Note 11, we identified errors related to deferred tax assets included in our consolidated financial statements for the quarterly period ended September 30, 2016 and each subsequent quarterly and annual period through the quarterly period ending June 30, 2020. The deferred tax assets error related to the capital gains incentive allocation and distribution (refer to the Capital Gains Incentive Allocation and Distribution section below for more details) earned by GREC Advisors, LLC (or the “Special Unitholder”). The LLC intends to operate so that it will qualify to be treated as a partnership for U.S. federal income tax purposes under the Internal Revenue Code. As such, it will not be subject to any U.S. federal and state income taxes. Since the capital gains incentive allocation and distribution was the responsibility of the LLC, and the LLC is not subject to any income taxes, there should not have been a corresponding deferred tax asset recorded in the consolidated financial statements.
In accordance with the guidance in the FASB ASC Topic 250, Accounting Changes and Error Corrections, ASC Topic 250-10-S99-1, Assessing Materiality, and ASC Topic 250-10-S99-1, Considering the Effects of Prior Year Misstatements in Current Year Financial Statements, we concluded that our previously issued consolidated financial statements were not materially misstated as a result of these errors. We revised our previously reported quarterly and annual consolidated financial statements for the periods since September 30, 2016. The historical periods presented in this Quarterly Report on Form 10-Q have been revised with corresponding adjustment to accumulated gains (losses) on the consolidated statements of assets and liabilities to correct for these errors. See Note 11 for the effect of the revisions on each of the individual effected line items in the consolidated financial statements.
Note 3. Investments
The composition of the company’s investments as of September 30, 2020 by geographic region, at fair value, were as follows:
| Investments at Cost | Investments at Fair Value | Fair Value Percentage of Total Portfolio | ||||||||||
| United States: | ||||||||||||
| East Region | $ | 131,291,439 | $ | 155,625,434 | 26.2 | % | ||||||
| Mid-West Region | 92,263,870 | 101,640,184 | 17.1 | |||||||||
| Mountain Region | 109,721,569 | 125,233,924 | 21.1 | |||||||||
| South Region | 93,912,977 | 97,648,285 | 16.4 | |||||||||
| West Region | 95,692,949 | 112,854,274 | 18.9 | |||||||||
| Total United States | $ | 522,882,804 | $ | 593,002,101 | 99.7 | % | ||||||
| Canada: | 1,603,136 | 1,598,127 | 0.3 | |||||||||
| Total | $ | 524,485,940 | $ | 594,600,228 | 100.0 | % | ||||||
The composition of the company’s investments as of December 31, 2019 by geographic region, at fair value, were as follows:
| Investments at Cost | Investments at Fair Value | Fair Value Percentage of Total Portfolio | ||||||||||
| United States: | ||||||||||||
| East Region | $ | 123,146,232 | $ | 130,572,650 | 27.4 | % | ||||||
| Mid-West Region | 49,208,021 | 55,455,982 | 11.7 | |||||||||
| Mountain Region | 79,975,330 | 87,711,362 | 18.5 | |||||||||
| South Region | 91,932,394 | 93,441,062 | 19.7 | |||||||||
| West Region | 92,944,559 | 106,382,860 | 22.4 | |||||||||
| Total United States | $ | 437,206,536 | $ | 473,563,916 | 99.7 | % | ||||||
| Canada: | 1,603,136 | 1,611,955 | 0.3 | |||||||||
| Total | $ | 439,009,672 | $ | 475,175,871 | 100.0 | % | ||||||
17
The composition of the company’s investments as of September 30, 2020 by industry, at fair value, were as follows:
| Investments at Cost | Investments at Fair Value | Fair Value Percentage of Total Portfolio | ||||||||||
| Battery Storage | 8,685,904 | 8,685,904 | 1.4 | % | ||||||||
| Biomass | 22,336,352 | 22,336,352 | 3.8 | |||||||||
| Commercial Solar* | 320,749,297 | 375,770,258 | 63.2 | |||||||||
| Wind | 118,970,601 | 124,702,802 | 21.0 | |||||||||
| Pre-Operational Assets | 44,130,057 | 54,031,001 | 9.1 | |||||||||
| Other Investments | 8,834,837 | 8,292,962 | 1.4 | |||||||||
| Energy Efficiency | 778,892 | 780,949 | 0.1 | |||||||||
| Total | 524,485,940 | 594,600,228 | 100.0 | % | ||||||||
| * | Denotes an industry that includes secured loan(s). |
The composition of the company’s investments as of December 31, 2019 by industry, at fair value, were as follows:
| Investments at Cost | Investments at Fair Value | Fair Value Percentage of Total Portfolio | ||||||||||
| Biomass | $ | 21,425,600 | $ | 21,425,600 | 4.5 | % | ||||||
| Commercial Solar* | 181,619,981 | 195,595,919 | 41.2 | |||||||||
| Residential Solar | 36,103,136 | 47,432,455 | 10.0 | |||||||||
| Wind | 90,618,874 | 101,660,576 | 21.4 | |||||||||
| Pre-Operational Assets | 95,718,187 | 95,718,187 | 20.1 | |||||||||
| Other Investments | 12,656,710 | 12,473,975 | 2.6 | |||||||||
| Energy Efficiency | 867,184 | 869,159 | 0.2 | |||||||||
| Total | $ | 439,009,672 | $ | 475,175,871 | 100.0 | % | ||||||
| * | Denotes an industry that includes secured loan(s). |
Investments held as of September 30, 2020 and December 31, 2019 are considered Control Investments, which are defined as investments in companies in which the company owns 25% or more of the voting securities of such company, have greater than 50% representation on such company’s board of directors, or investments in limited liability companies for which the company serves as managing member.
Note 4. Fair Value Measurements - Investments
The following table presents fair value measurements of investments, by major class, as of September 30, 2020, according to the fair value hierarchy:
| Valuation Inputs | ||||||||||||||||
| Level 1 | Level 2 | Level 3 | Fair Value | |||||||||||||
| Limited Liability Company Member Interests | $ | - | $ | - | $ | 560,824,216 | $ | 560,824,216 | ||||||||
| Capital Stock ** | - | - | 1,598,127 | $ | 1,598,127 | |||||||||||
| Energy Efficiency Secured Loans | - | - | 428,640 | $ | 428,640 | |||||||||||
| Secured Loans - Other | - | - | 31,749,245 | $ | 31,749,245 | |||||||||||
| Total | $ | - | $ | - | $ | 594,600,228 | $ | 594,600,228 | ||||||||
| Other Financial Instruments* | ||||||||||||||||
| Unrealized appreciation on open swap contracts | $ | - | $ | - | $ | - | $ | - | ||||||||
| Unrealized depreciation on open swap contracts | - | (11,025,669 | ) | - | $ | (11,025,669 | ) | |||||||||
| Total | $ | - | $ | (11,025,669 | ) | $ | - | $ | (11,025,669 | ) | ||||||
| * | Other financial instruments are derivatives, such as futures, forwards, and swaps. These instruments are reflected at the unrealized appreciation (depreciation) on the instrument. |
| ** | Capital Stock class of investment relates to the Company’s Canadian Northern Lights Portfolio on the Consolidated Schedule of Investments. |
18
The following table presents fair value measurements of investments, by major class, as of December 31, 2019, according to the fair value hierarchy:
| Valuation Inputs | ||||||||||||||||
| Level 1 | Level 2 | Level 3 | Fair Value | |||||||||||||
| Limited Liability Company Member Interests | $ | - | $ | - | $ | 449,981,086 | $ | 449,981,086 | ||||||||
| Capital Stock** | - | - | 1,611,955 | 1,611,955 | ||||||||||||
| Energy Efficiency Secured Loans | - | - | 479,140 | 479,140 | ||||||||||||
| Secured Loans - Other | - | - | 23,103,690 | 23,103,690 | ||||||||||||
| Total | $ | - | $ | - | $ | 475,175,871 | $ | 475,175,871 | ||||||||
| Other Financial Instruments* | ||||||||||||||||
| Open swap contracts - assets | $ | - | $ | 21,223 | $ | - | $ | 21,223 | ||||||||
| Open swap contracts - liabilities | - | (4,899,566 | ) | - | (4,899,566 | ) | ||||||||||
| Total | $ | - | $ | (4,878,343 | ) | $ | - | $ | (4,878,343 | ) | ||||||
| * | Other financial instruments are derivatives, such as futures, forward currency contracts and swaps. These instruments are reflected at the unrealized appreciation (depreciation) on the instrument. |
| ** | Capital Stock class of investment relates to the Company’s Canadian Northern Lights Portfolio on the Consolidated Schedule of Investments. |
The following table provides a reconciliation of the beginning and ending balances for investments that use Level 3 inputs for the nine months ended September 30, 2020:
| Balance as of December 31, 2019 | Net
change in unrealized appreciation on investments | Translation
of assets and liabilities denominated in foreign currencies | Purchases | Cost adjustments (1) | Sales
and Repayments of investments (2) | Net
realized gain on investments | Balance as of September 30, 2020 | |||||||||||||||||||||||||
| Limited Liability Company Member Interests | $ | 449,981,086 | $ | 33,961,917 | $ | - | $ | 216,832,470 | $ | (91,973,455 | ) | $ | (54,163,878 | ) | $ | 6,186,076 | $ | 560,824,216 | ||||||||||||||
| Capital Stock | 1,611,955 | (40,761 | ) | 26,933 | - | - | - | - | 1,598,127 | |||||||||||||||||||||||
| Energy Efficiency - Secured Loans | 479,140 | - | - | - | - | (50,500 | ) | - | 428,640 | |||||||||||||||||||||||
| Secured Loans - Other | 23,103,690 | - | - | 8,640,311 | - | 5,244 | - | 31,749,245 | ||||||||||||||||||||||||
| Total | $ | 475,175,871 | $ | 33,921,156 | $ | 26,933 | $ | 225,472,781 | $ | (91,973,455 | ) | $ | (54,209,134 | ) | $ | 6,186,076 | $ | 594,600,228 | ||||||||||||||
| (1) | Includes capitalized deal costs, effects of purchase price adjustments, paid-in-kind interest, and return of capital. |
| (2) | Includes principal repayments on loans. |
The total change in unrealized appreciation included in the Consolidated Statements of Operations within net change in unrealized appreciation on investments and foreign currency translation for the three and nine months ended September 30, 2020 attributable to Level 3 investments still held at September 30, 2020 was $10,225,524 and $45,268,589. There were no reclassifications attributable to Level 3 investments during the nine months ended September 30, 2020. The total net change in unrealized appreciation on investments, foreign currency translation and swap contracts at fair value for the three and nine months ended September 30, 2020 was $10,851,169 and $27,800,762.
19
The following table provides a reconciliation of the beginning and ending balances for investments that use Level 3 inputs for the nine months ended September 30, 2019:
| Balance as of December 31, 2018 | Net
change in unrealized appreciation on investments | Translation
of assets and liabilities denominated in foreign currencies | Purchases | Cost adjustments (1) | Sales
and Repayments of investments (2) | Net
realized gain on investments | Balance as of September 30, 2019 | |||||||||||||||||||||||||
| Limited Liability Company Member Interests | $ | 304,542,921 | $ | 29,981,485 | $ | - | $ | 190,347,124 | $ | (84,913,273 | ) | $ | (16,874,761 | ) | $ | 6,683,326 | $ | 429,766,822 | ||||||||||||||
| Capital Stock | 2,081,554 | 28,816 | 42,054 | - | - | - | - | 2,152,424 | ||||||||||||||||||||||||
| Energy Efficiency - Secured Loans | 551,640 | - | - | - | - | (62,500 | ) | - | 489,140 | |||||||||||||||||||||||
| Secured Loans - Other | - | - | - | 17,478,179 | - | - | - | 17,478,179 | ||||||||||||||||||||||||
| Total | $ | 307,176,115 | $ | 30,010,301 | $ | 42,054 | $ | 207,825,303 | $ | (84,913,273 | ) | $ | (16,937,261 | ) | $ | 6,683,326 | $ | 449,886,565 | ||||||||||||||
| (1) | Includes capitalized deal costs, effects of purchase price adjustments, paid-in-kind interest, and return of capital. |
| (2) | Includes principal repayments on loans. |
The total change in unrealized appreciation included in the consolidated statements of operations within net change in unrealized appreciation on investments and foreign currency translation for the three and nine months ended September 30, 2019 attributable to Level 3 investments still held at September 30, 2019 was $11,887,457 and $30,052,355. Reclassifications impacting Level 3 of the fair value hierarchy are reported as transfers in or out of the Level 3 as of the beginning of the period which the reclassifications occur. There were no reclassifications attributable to Level 3 investments during the nine months ended September 30, 2019. The total net change in unrealized appreciation on investments, foreign currency translation and swap contracts at fair value for the three and nine months ended September 30, 2019 was $9,906,613 and $23,286,195.
As of September 30, 2020, all of company investments utilized Level 3 inputs. The following table presents the quantitative information about Level 3 fair value measurements of the company’s investments as of September 30, 2020:
| Fair Value | Valuation Techniques | Unobservable Inputs | Rates/Assumptions | |||||||
| Battery Storage | $ | 8,685,904 | Transaction cost | Not Applicable | Not Applicable | |||||
| Biomass | $ | 22,336,352 | Transaction cost | Not Applicable | Not Applicable | |||||
| Commercial Solar* | $ | 344,021,013 | Income approach and transaction cost | Discount rate, kWh Production, potential leverage and estimated remaining useful life | Weighted average 7.82%, 0.5% annual degradation in production, 8.7- 40.3 years | |||||
| Wind | $ | 124,702,802 | Income approach and transaction cost | Discount rate, kWh Production, potential leverage and estimated remaining useful life | Weighted average 8.10%, no annual degradation in production, 20- 29.3 years | |||||
| Pre-Operational Assets | $ | 54,031,001 | Transaction cost and income approach | Discount rate, kWh Production, potential leverage and estimated remaining useful life | Weighted average 8.71%, 0-0.5% annual degradation in production, 31.0-35.2 years | |||||
| Other Investments | $ | 8,292,962 | Transaction cost | Not Applicable | Not Applicable | |||||
| Energy Efficiency | $ | 780,949 | Income and collateral based approach | Market yields and value of collateral | 10.25%-20.4% | |||||
| Secured Loans | $ | 31,749,245 | Yield analysis | Market yields | 8%-10% | |||||
| * | Includes assets that have not reached COD that are being recognized at their fair market value. |
20
As of December 31, 2019, all of the company’s portfolio investments utilized Level 3 inputs. The following table presents the quantitative information about Level 3 fair value measurements of the company’s investments as of December 31, 2019:
| Fair Value | Valuation Techniques |
Unobservable Inputs |
Rates/Assumptions | |||||||
| Biomass | $ | 21,425,600 | Transaction Cost | Not Applicable | Not Applicable | |||||
| Commercial Solar | $ | 172,492,229 | Income Approach and Market approach | Discount rate, future kWh production, and estimated remaining useful life | 7.25%-9.25%, 0.5% annual degradation in production, 13.5- 34.3 years | |||||
| Residential Solar | $ | 47,432,455 | Income Approach and Market approach | Discount rate, future kWh production, and estimated remaining useful life | 7.25%-9.25%, 0.5% annual degradation in production, 13.5- 34.3 years | |||||
| Wind | $ | 101,660,576 | Income Approach and Transaction Cost | Discount rate, future kWh production, and estimated remaining useful life | 8.50%, no annual degradation in production, 27.9- 29.0 years | |||||
| Pre-Operational Assets | $ | 95,718,187 | Transaction Cost | Not Applicable | Not Applicable | |||||
| Other Investments | $ | 12,473,975 | Transaction Cost | Not Applicable | Not Applicable | |||||
| Energy Efficiency | $ | 869,159 | Income and Collateral Based Approach | Income Based Approach and Market Yields | 10.25%-20.4% | |||||
| Secured Loans | $ | 23,103,690 | Yield Analysis | Market Yields | 8.0% - 10.0% | |||||
GREC utilizes primarily proprietary discounted cash flow pricing models in the fair value measurement of the company’s investments. Significant unobservable inputs include discount rates and estimates related to the future production of electricity. Significant increases or decreases in discount rates used or actual kilowatt hour (“kWh”) production can significantly increase or decrease the fair value measurement.
21
Note 5. Related Party Agreements and Transactions Agreements
The company has executed advisory and administration agreements with the advisor and Greenbacker Administration, LLC, our administrator, respectively, which entitles the advisor, and certain affiliates of the advisor, to specified fees upon the provision of certain services with regard to the ongoing management of the company as well as reimbursement of O&O costs incurred by the advisor on behalf of the company (as discussed in Note 2) and certain other operating costs incurred by the advisor on behalf of the company. As the company’s continuous public offering was terminated on March 29, 2019, the dealer manager will no longer receive any selling commissions or dealer manager fees. However, the dealer manager will continue to receive distribution fess on Class C shares until the maximum amount of commissions and dealer manager fees permitted by applicable regulation is reached.
The term “Special Unitholder” refers to GREC Advisors, LLC, a Delaware limited liability company, which is a subsidiary of our advisor and “special unit”, refers to the special unit of limited liability company interest in GREC. This entitles the Special Unitholder to an incentive allocation and distribution.
The commissions, fees and reimbursement obligations related to our terminated continuous offering includes Selling Commissions, Dealer Manager fees and Distribution fees payable to the Dealer Manager for Class A, Class C, Class P-A and Class I shares ranging from 1.75% to 7% of gross offering proceeds from the sale of such shares. With respect to Class C shares only, the company pays the dealer manager a distribution fee that accrues daily in an amount equal to 1/365th of 0.80% of the amount of the net asset value for the Class C shares for such day on a continuous basis from year to year. The company will stop paying distribution fees at the earlier of 1) a listing of the Class C shares on a national securities exchange, 2) following the completion of our offering, total underwriting compensation in our offering equals 10% of the gross proceeds from the primary offering of Class C shares or 3) Class C shares are no longer outstanding. The dealer manager may re-allow all or a portion of the distribution fee to participating broker-dealers and servicing broker dealers. The company estimated the amount of distribution fees expected to be paid and recorded that liability at the time of sale. The liability is included in Deferred sales commission payable on the Consolidated Statements of Assets and Liabilities and fees recorded in Paid-in capital in excess of par value (specific to the Class C Shares) on the Consolidated Statements of Assets and Liabilities. The company continues to assess the value of the liability on a regular basis.
The Company also reimbursed the advisor for the O&O costs (other than selling commissions and dealer manager fees) it had incurred on the company’s behalf only to the extent that the reimbursement would not cause the selling commissions, dealer manager fee and the other O&O costs borne by the company to exceed 15.0% of the gross offering proceeds as the amount of proceeds increases. During the initial and secondary offerings approximately 3.8%, or $9.8 million, was charged against gross offering proceeds for O&O costs.
The fees and reimbursement obligations related to our ongoing operation of the company are as follows:
| Type of Compensation and Recipient | Determination of Amount | |
| Base Management Fees — Advisor | The base management fee payable to GCM will be calculated at a monthly rate of 0.167% (2.00% annually) of our gross assets (including amounts borrowed) until gross assets exceed $800M. The base management fee monthly rate will decrease to 0.14583% (1.75% annually) for gross assets between $800,000,001 to $1,500,000, and 0.125% (1.50% annually) for gross assets greater than $1,500,000. For services rendered under the advisory agreement, the base management fee will be payable monthly in arrears, or more frequently as authorized under the advisory agreement. The base management fee will be calculated based on the average of the values of our gross assets for each day of the prior month. Base management fees for any partial period will be appropriately pro-rated. The base management fee may be deferred or waived, in whole or part, at the election of the advisor. All or any part of the deferred base management fee not taken as to any period shall be deferred without interest and may be taken in any period prior to the occurrence of a liquidity event as the advisor shall determine in its sole discretion. |
| Incentive Allocation and Distribution — Special Unitholder (effective through March 31, 2020) | Under the Third Amended and Restated LLC Agreement dated June 27, 2014, the incentive allocation and distribution will have three parts: Income Incentive Distribution, Capital Gains Incentive Distribution and the Liquidation Incentive Distribution. The features of this incentive fee structure are as follows: |
| ● | The Income Incentive Distribution provides for the Special Unitholder, as a member of the Company, to receive, on a quarterly basis, a cash distribution equal to a percentage of the Company’s net investment income (as calculated in accordance with the Operating Agreement) for each quarter, in excess of a specified hurdle rate. |
| ● | The Capital Gains Incentive Distribution provides for the Special Unitholder, as a member of the Company, to receive, on a quarterly basis, a cash distribution equal to a percentage of the Company’s realized capital gains (as calculated in accordance with the Operating Agreement) for each quarter. |
| ● | The Liquidation Incentive Distribution provides for the Special Unitholder to receive a cash distribution equal to a percentage of the difference between the net proceeds from the liquidation of the Company or the exchange listing of its Shares (as calculated in accordance with the Operating Agreement) and the Company’s aggregate NAV immediately prior to the time of such liquidation or listing. |
22
| Type of Compensation and Recipient | Determination of Amount |
| Performance Participation Fees (effective April 1, 2020 and thereafter) | The performance participation fee which the Special Unitholder is entitled to is calculated and payable in arrears, for an amount equal to 12.5% of the total return generated by the Company during the most recently completed fiscal quarter, subject to a hurdle amount of 1.50% (or 6% annualized), a loss carryforward and a fee carryforward amount. The Total Return Amount is defined for each quarterly calculation period, as an amount equal to the sum of
· the aggregate amount of all cash distributions accrued or paid (without duplication) during such quarter on the shares outstanding at the end of such quarter plus · the amount of the change in aggregate NAV of such shares since the beginning of such quarter, before giving effect to (x) changes in the aggregate NAV of such shares during such quarter resulting solely from the net proceeds of issuances and/or repurchase of shares by the company, and (y) the amount of any accrual of the Performance Participation Fee during such quarter.
The calculation of the Total Return Amount for each period shall include any appreciation or depreciation in the NAV of the shares issued during such period but exclude the proceeds from the initial issuance of such shares. The total NAV of the shares outstanding as of the last business day of a calendar quarter shall be the amount against which changes in the total NAV of the shares outstanding during the subsequent calendar quarter is measured. Furthermore, the loss carryforward shall initially equal zero and cumulatively increase in any calendar quarter by the absolute value of any negative total return for such quarter and cumulatively decrease in any calendar quarter by the amount of any positive total return. The fee carryforward amount shall also initially equal zero, and cumulatively increase in any calendar quarter by (i) the amount, if any, by which the hurdle amount (noted above) for such quarter exceeds any positive total return amount for such quarter and (ii) the amount, if any, by which the catch-up amount for such quarter exceeds excess profits for such quarter. The fee carryforward amount shall cumulatively decrease in any calendar quarter by the amount, if any, of the fee carryforward amount paid to the Special Unitholder for such quarter. Neither the loss carryforward nor the fee carryforward amounts shall be less than zero at any given time.
The Special Unitholder shall receive a performance participation fee as follows: |
| ● | if the Total Return Amount for the applicable period exceeds the sum of (x) the Hurdle Amount for such period and (y) the Loss Carryforward Amount for such Period (any such excess, “Excess Profits”), 100% of such Excess Profits until the total amount paid to the Special Unitholder equals 12.5% of the sum of (x) the Hurdle Amount for such period and (y) any amount paid to the Special Unitholder pursuant to this clause (the “Catch-Up Amount”); |
| ● | to the extent there are remaining Excess Profits after payment of the Catch-Up Amount, 100% of such remaining Excess Profits until such amount paid to the Special Unitholder equals the amount of the Fee Carryforward Amount for such period; and |
| ● | to the extent there are remaining Excess Profits after payment of the Catch-Up Amount and the Fee Carryforward Amount (as defined above), 12.5% of such remaining Excess Profits. |
The liquidation performance participation fee payable to the Special Unitholder will equal 20.0% of the net proceeds from a liquidation of the company in excess of adjusted capital, as measured immediately prior to liquidation. Adjusted capital shall mean the Company NAV immediately prior to the time of a liquidation or a listing. In the event of any liquidity event that involves a listing of the company’s shares, or a transaction in which the company’s members receive shares of a company that is listed, on a national securities exchange, the liquidation performance participation fee will equal 20% of the amount, if any, by which the company’s listing value following such liquidity event exceeds the adjusted capital, as calculated immediately prior to such listing (the “listing premium”). Any such listing premium and related liquidation performance participation fee will be determined and payable in arrears 30 days after the commencement of trading following such liquidity event.
The amendments to the incentive fee structure pursuant to the Fourth Amended and Restated LLC Agreement (the “Operating Agreement”) was applied retroactively as of April 1, 2020 and for all periods thereafter. |
23
For the three and nine months ended September 30, 2020, the advisor earned $2,497,596 and $7,348,380 respectively, in management fees. For the three and nine months ended September 30, 2019, the advisor earned $2,228,976 and $6,086,107, respectively, in management fees. As of September 30, 2020, and December 31, 2019, the company owed $481,852 and $272,982, respectively, to the advisor in management fees which amounts are included in management fee payable on the Consolidated Statements of Assets and Liabilities.
The Consolidated Statement of Operations also reflects a $4,193,559 decrease and $1,154,308 increase in incentive allocation for the three and nine months ended September 30, 2020, respectively, shown as net decrease (increase) in net assets attributed to special unitholder. The Consolidated Statement of Operations also reflects a $2,588,895 and a $4,025,183 increase in incentive allocation for the three and nine months ended September 30, 2019, respectively, shown as net decrease (increase) in net assets attributed to special unitholder. There was a capital gains incentive distribution of nil and $3,303,116 for the three and nine months ended September 30, 2020, and none for the nine months ended September 30, 2019. As of September 30, 2020, and December 31, 2019, the company owed $4,749,000 and $6,897,808, respectively, to the advisor in incentive allocation which amounts are included in special unitholders’ equity on the Consolidated Statements of Assets and Liabilities.
As previously discussed, under the amended and restated limited liability company agreement the performance participation fee payable and due for the second and third quarter was $1,410,527 and $2,043,327, respectively, and the total of $3,453,854 was recorded in the three months ending September 30, 2020. As a result of the revisions to prior period financial statements discussed in Note 11, there were a certain amount of proceeds paid under the company’s share repurchase program that otherwise would not have been paid due to the misstatement historically impacting the company’s offering price. To remedy the effect of the overpayment, GREC Advisors, LLC waived $747,602 of performance participation fee for the three and nine months ended September 30, 2020, shown as performance participation fee waiver on the Consolidated Statements of Operations. As of September 30, 2020, the total net amount of $2,706,252 remains unpaid and is reflected as the performance participation fee payable on the Consolidated Statements of Assets and Liabilities.
For the three and nine months ended September 30, 2020, the company paid nil in dealer manager fees and nil in selling commissions to the company’s dealer manager, SC Distributors. For the three and nine months ended September 30, 2019, the company paid nil and $231,892 in dealer manager fees and nil and $594,247, respectively, in selling commissions to the dealer manager. These fees and commissions were paid in connection with the sales of the company’s shares to investors and, as such, were recorded against the proceeds from the issuance of shares, prior to the receipt by the company, and thus are not reflected in the company’s Consolidated Statements of Operations.
As of September 30, 2020, and December 31, 2019, the advisor owned 23,601 Class A shares.
The company entered secured loans to finance the purchase and installation of energy efficient lighting with LED Funding LLC and Renew AEC One LLC (“AEC Companies”). All the loans with LED Funding LLC, an AEC Company, converted to an operating lease on the day the energy efficiency upgrades became operational. AEC Companies are considered related parties as the members of these entities own an indirect, non-controlling ownership interest in the company’s advisor. The loans outstanding between the AEC Companies and the company, and the subsequent operating leases, were negotiated at an arm’s length and contain standard terms and conditions that would be included in third party lending agreements including required security and collateral, interest rates based upon risk of the specific loan, and term of the loan. As of September 30, 2020, all loans and operating leases are considered current per their terms.
The company entered into a transaction with Greenbacker Renewable Opportunity Zone Fund LLC (“GROZ”) to sell the Sol Phoenix Solar LLC investment, included within the Phoenix Solar Portfolio, on September 30, 2019 for an initial sale price of $16,874,761, pending final adjustments. The sales price was adjusted during Q4 2019 and increased to $17,175,554 as of December 31, 2019 and finalized in Q2 2020 to total $18,060,275. The changes to the purchase price were based upon a final fair value determination of the investment as determined by an independent third-party appraiser. GROZ is an affiliate of GREC, as GROZ shares the same advisor as GREC. Since GROZ is an affiliate of the company, the determination of the purchase price was based on the fair value of the investment as determined by an independent third-party appraiser. The purchase was determined by a majority of the company’s board of directors (including a majority of the independent directors) not otherwise interested in the transaction to be fair and reasonable to the company.
The transaction resulted in a realized gain of $7,636,438 of which, nil and $141,974 was recorded in the three and nine months ending September 30, 2020 respectively, in net realized (loss)/gain on investments on the Consolidated Statements of Operations. GROZ paid an initial amount of $1,500,000 at closing with an additional $8,184,393 was paid by GROZ as of December 31, 2019. The transaction resulted in a receivable recorded of nil and $7,491,161 as of September 30, 2020 and December 31, 2019, respectively, in Investment sales receivable on the Consolidated Statements of Assets and Liabilities. As of September 30, 2020, the remaining balance was paid by GROZ.
On December 10, 2019, the company through its wholly owned subsidiary, Citrine Solar LLC, entered into a second transaction with GROZ to sell the Fremont CO I, LLC asset. The asset was originally sold for a purchase price of $5,272,475, which increased to $5,335,009 in Q2 2020, based upon the fair value of the investment as determined by an independent third-party appraiser and a determination by a majority of the company’s board of directors (including a majority of the independent directors) not otherwise interested in the transaction that the purchase price was fair and reasonable to the company.
The transaction resulted in a realized gain of $762,391 of which, nil and ($32,576) was recorded in the three and nine months ending September 30, 2020, respectively, in net realized (loss)/gain on investments on the Consolidated Statements of Operations. As of December 31, 2019, a total of $2,531,000 was paid by GROZ. The transaction resulted in a receivable recorded of nil and $2,741,476 as of September 30, 2020 and December 31, 2019, respectively, in Investment sales receivable on the Consolidated Statements of Assets and Liabilities. As of September 30, 2020, all the remaining balance was paid by GROZ.
24
Note 6. Borrowings
On June 20, 2019, the company, through GREC HoldCo, entered into a new credit agreement among the lenders party thereto and Fifth Third Bank, as administrative agent, as sole lead arranger, sole lead bookrunner, and as swap counterparty. The new credit facility (the “New Credit Facility”) consists of a loan of up to the lesser of $110,000,000 or a borrowing base amount based on various solar projects that act as collateral for the credit facility, of which approximately $58,307,080 was drawn down at closing. The $110,000,000 borrowing base has since been reduced to $73,248,007 as a result of our sale of the Raleigh Portfolio and a portion of the East to West Portfolio and their subsequent removal from the facility and the conversion to a term loan. The New Credit Facility allowed for additional drawdowns through June 20, 2020, at which point the outstanding loans converted to an additional term loan and mature on June 20, 2025. As of September 30, 2020, the facility has converted to a term loan, with no available balance to draw on.
The company will use the net proceeds of borrowings under the New Credit Facility for investment in additional alternative energy power generation assets that are anticipated to become Projects and for other general corporate purposes. Loans made under the New Credit Facility bear interest at 1.75% in excess of the three-month LIBOR. Until the New Credit Facility converts to a term loan, quarterly commitment fees on the average daily unused portion of the Credit Facility are payable at a rate per annum of 0.50%.
Borrowings under the New Credit Facility are secured by all the assets of GREC HoldCo and the equity interests of each direct and indirect subsidiary of the company. The company, GREC HoldCo and each direct and indirect subsidiary of GREC HoldCo are guarantors of the company’s obligations under the New Credit Facility. GREC has pledged all the equity interests of GREC HoldCo as collateral for the New Credit Facility.
As of September 30, 2020, the outstanding balance is approximately $73.2 million. Financing costs of $3.3 million related to the New Credit Facility have been capitalized and are being amortized over the current term of the New Credit Facility.
On January 5, 2018, the company, through GREC HoldCo, entered into a credit agreement by and among the company, the company’s wholly owned subsidiary, GREC, the lenders party thereto and Fifth Third Bank, as administrative agent, as sole lead arranger, sole lead bookrunner, and as swap counterparty. The credit facility (the “Credit Facility”) consisted of a loan of up to the lesser of $60,000,000 or a borrowing base amount based on various solar projects that act as collateral for the credit facility, of which approximately $25.7 million was drawn down at closing. The Credit Facility allowed for additional drawdowns through December 31, 2018 and converted to a term loan with a maturity on January 5, 2024. The New Credit Facility replaced the previous Credit Facility.
Regarding the Credit Facility, the company has entered into five separate interest rate swap agreements. The first swap (“Swap 1”), effective July 13, 2016, has an initial notional amount of $4,300,000 to swap the floating rate interest payments on the original Facility 1 Term Loan for a corresponding fixed payment. The fixed swap rate is 1.11%. The second swap (“Swap 2”), with a trade date of June 15, 2017 and an effective date of June 18, 2018 and an initial notional amount of $20,920,650, was used to swap the floating rate interest payments on an additional principal amount of the Credit Facility, for a corresponding fixed payment. The fixed swap rate is 2.261%. The third swap (“Swap 3”), with a trade date of January 11, 2018 and an effective date of December 31, 2018 and an initial notional amount of $29,624,945 was used to swap the floating rate interest payments on the remaining unhedged portion of the Credit Facility, as well as the estimated additional drawdowns, for a corresponding fixed payment. The fixed swap rate is 2.65%. The fourth swap (“Swap 4”), with a trade date of February 7, 2018 and an effective date of December 31, 2018 and an initial notional amount of $4,180,063 was used to swap the floating rate interest payments on the remaining unhedged portion of the Credit Facility, as well as the estimated additional drawdowns, for a corresponding fixed payment. The fixed swap rate is 2.97%. The fifth swap (“Swap 5”), with a trade date of January 2, 2019 and an effective date of September 30, 2019 and an initial notional amount of $38,203,506 was used to swap the floating rate interest payments on the remaining unhedged portion of the Credit Facility, as well as the estimated additional drawdowns, for a corresponding fixed payment. The fixed swap rate is 2.69%. If an event of default shall occur and be continuing under the New Credit Facility, the commitments under the New Credit Facility may be terminated and the principal amount outstanding under the New Credit Facility, together with all accrued unpaid interest and other amounts owing in respect thereof, may be declared immediately due and payable.
On December 6, 2019, the company entered into a $15,000,000 revolving letter of credit facility agreement (“LC Facility”) with Fifth Third Bank. The LC Facility has a maturity date of December 6, 2020. On January 30, 2020, the amount of $5.6 million was drawn down. On March 18, 2020, a repayment of $1.9 million was made, reducing the outstanding balance of the LC Facility. On June 9, 2020, a repayment of the remaining outstanding balance occurred.
The company’s outstanding debt as of September 30, 2020 and December 31, 2019 was as follows:
| September 30, 2020 | December 31, 2019 | |||||||||||||||||||||||||||||||||||||||
| Aggregate Principal Amount Available | Principal Amount Outstanding | Carrying Value | Deferred Financing Costs | Term Note Payable, Net of Financing Costs | Aggregate Principal Amount Available | Principal Amount Outstanding | Carrying Value | Deferred Financing Costs | Term Note Payable, Net of Financing Costs | |||||||||||||||||||||||||||||||
| Term Loan | $ | 73,248,007 | $ | 73,248,007 | $ | 73,248,007 | $ | 3,283,487 | $ | 69,964,520 | $ | 96,438,316 | $ | 71,990,467 | $ | 71,990,467 | $ | 3,103,681 | $ | 68,886,786 | ||||||||||||||||||||
| LC Facility | $ | 15,000,000 | $ | - | $ | - | $ | - | $ | - | ||||||||||||||||||||||||||||||
| Total | $ | 88,248,007 | $ | 73,248,007 | $ | 73,248,007 | $ | 3,283,487 | $ | 69,964,520 | $ | 96,438,316 | $ | 71,990,467 | $ | 71,990,467 | $ | 3,103,681 | $ | 68,886,786 | ||||||||||||||||||||
25
The following table shows the components of interest expense, commitment fees related to the Credit Facility and LC Facility, amortized deferred financing costs, weighted average stated interest rate and weighted average outstanding debt balance for the credit facility for the three and nine months ended September 30, 2020 and September 30, 2019:
| For the three months Ended
September 30, 2020 | For the nine months Ended
September 30, 2020 | For the three months Ended
September 30, 2019 | For the nine months Ended September 30, 2019 | |||||||||||||
| Credit Facility commitment fee | $ | 10,860 | $ | 32,345 | $ | 10,860 | $ | 32,227 | ||||||||
| Credit Facility Loan interest* | 521,695 | 1,893,368 | 739,411 | 1,360,409 | ||||||||||||
| Amortization of deferred financing costs | 57,152 | 170,212 | 57,151 | 169,590 | ||||||||||||
| Other* | - | - | 391,202 | 767,242 | ||||||||||||
| Total | $ | 589,707 | $ | 2,095,925 | $ | 1,198,624 | $ | 2,329,468 | ||||||||
| Weighted average interest rate on credit facility | 2.29 | % | 2.71 | % | 4.24 | % | 4.47 | % | ||||||||
| Weighted average outstanding balance of credit facility | $ | 75,823,710 | $ | 72,887,858 | $ | 62,453,815 | $ | 44,120,356 | ||||||||
| * | Primarily includes financing costs of credit facility. |
For the year ended December 31, 2019, the weighted average interest rate on credit facility was 4.32% and the weighted average outstanding balance of the credit facility was $53,753,277.
The principal payments due on the Credit Facility for each of the next five years ending December 31 and thereafter, are as follows:
| Year ending December 31: | Principal Payments | |||
| 2020 | $ | 575,098 | ||
| 2021 | 5,890,652 | |||
| 2022 | 5,809,417 | |||
| 2023 | 5,972,031 | |||
| 2024 | 6,205,548 | |||
| Thereafter | 48,795,261 | |||
| $ | 73,248,007 | |||
Note 7. Members’ Equity
General
Pursuant to the terms of the Operating Agreement, the LLC may issue up to 400,000,000 shares, of which 350,000,000 shares are designated as Class A, C, I, P-A and P-I shares (collectively, common shares), and 50,000,000 are designated as preferred shares and one special unit. Each class of common shares will have the same voting rights.
26
Refer to Note 5 for the commissions and fees for each common share class in connection with the company’s continuous public offering pursuant to a Registration Statement on Form S-1 (File No. 333-211571) which terminated on March 29, 2019 as well as the private offering of Class P-A.
Effective March 29, 2019 through September 30, 2020 Class P-A shares were not offered for sale.
Class P-I shares are currently offered at net asset value through a private placement memorandum.
On August 11, 2020, the board of directors authorized three additional share classes, Class P-D, Class P-T and Class P-S, to be offered through a private placement memorandum.
The following table is a summary of the shares issued and repurchased during the period and outstanding as of September 30, 2020:
| Shares Outstanding
as of December 31, 2019 |
Shares Sold During the Period | Shares Issued through Reinvestment of Distributions During the Period | Shares Repurchased During the Period | Shares Transferred During the Period | Shares Outstanding
as of September 30, 2020 |
|||||||||||||||||||
| Class A shares | 17,210,016 | 12,964 | 332,287 | (518,875 | ) | - | 17,036,392 | |||||||||||||||||
| Class C shares | 2,718,475 | - | 70,787 | (25,173 | ) | (13,264 | ) | 2,750,825 | ||||||||||||||||
| Class I shares | 6,693,658 | 5,783 | 185,498 | (352,235 | ) | 12,993 | 6,545,697 | |||||||||||||||||
| Class P-A shares | 18,109 | - | - | - | - | 18,109 | ||||||||||||||||||
| Class P-I shares | 21,249,352 | 10,853,812 | (296 | ) | (387,528 | ) | - | 31,715,340 | ||||||||||||||||
| 47,889,610 | 10,872,559 | 588,276 | (1,283,811 | ) | (271 | ) | 58,066,363 | |||||||||||||||||
The following table is a summary of the shares issued and repurchased during the period and outstanding as of December 31, 2019:
| Shares Outstanding as of December 31, 2018 | Shares
Sold During the Period | Shares
Issued through Reinvestment of Distributions During the Period | Shares
Repurchased During the Period | Shares
Outstanding as of December 31, 2019 | ||||||||||||||||
| Class A shares | 16,714,738 | 596,521 | 457,336 | (558,579 | ) | 17,210,016 | ||||||||||||||
| Class C shares | 2,222,478 | 425,956 | 86,970 | (16,929 | ) | 2,718,475 | ||||||||||||||
| Class I shares | 6,209,416 | 429,923 | 240,190 | (185,871 | ) | 6,693,658 | ||||||||||||||
| Class P-A shares | 15,478 | 2,631 | - | - | 18,109 | |||||||||||||||
| Class P-I shares | 11,841,392 | 9,631,641 | - | (223,681 | ) | 21,249,352 | ||||||||||||||
| 37,003,502 | 11,086,672 | 784,496 | (985,060 | ) | 47,889,610 | |||||||||||||||
27
The proceeds from shares sold and the value of shares issued through the reinvestment of distributions for each class of shares for the nine months ended September 30, 2020 and September 30, 2019 were as follows:
| Class A Shares | Class C Shares | Class I Shares | Class P-A Shares | Class P-I Shares | Total | |||||||||||||||||||
| For the nine months ended September 30, 2020: | ||||||||||||||||||||||||
| Proceeds from Shares Sold | $ | 110,970 | $ | - | $ | 49,850 | $ | - | $ | 96,886,072 | $ | 97,046,892 | ||||||||||||
| Proceeds from Shares Issued through Reinvestment of Distributions | $ | 2,857,125 | $ | 594,890 | $ | 1,593,506 | $ | - | $ | 128 | $ | 5,045,649 | ||||||||||||
| For the nine months ended September 30, 2019: | ||||||||||||||||||||||||
| Proceeds from Shares Sold | $ | 5,256,161 | $ | 3,651,717 | $ | 3,709,174 | $ | 22,875 | $ | 68,738,228 | $ | 81,378,155 | ||||||||||||
| Proceeds from Shares Issued through Reinvestment of Distributions | $ | 2,906,714 | $ | 538,129 | $ | 1,506,093 | $ | - | $ | - | $ | 4,950,936 | ||||||||||||
As of September 30, 2020, and December 31, 2019, none of the LLC’s preferred shares were issued and outstanding.
The Operating Agreement authorizes the board of directors, without approval of any of the members, to increase the number of shares the company is authorized to issue and to classify and reclassify any authorized but unissued class or series of shares into any other class or series of shares having such designations, preferences, right, power and duties as may be specified by the board of directors. The Operating Agreement also authorizes the board of directors, without approval of any of the members, to issue additional shares of any class or series for the consideration and on the terms and conditions established by the board of directors. In addition, the company may also issue additional limited liability company interests that have designations, preferences, right, powers and duties that are different from, and may be senior to, those applicable to the common shares. The Special Unitholder will hold the special unit in the company. Refer to Note 5 for the terms of the special unit. The proceeds related to the shareholder receivable amount of $579,243 presented on the Consolidated Statements of Assets and Liabilities as of September 30, 2020 were subsequently collected on October 1, 2020.
Distribution Reinvestment Plan
The company adopted a DRP through which the company’s Class A, C and I shareholders may elect to purchase additional shares with distributions from the company rather than receiving the cash distributions. Shares issued pursuant to the DRP will have the same voting rights as shares offered pursuant to the company’s prior public offerings. As of June 4, 2019, pursuant to our Registration Statement on Form S-3 (File No. 333-231960) we are offering a maximum of $10,000,000 in shares of our common stock to our existing shareholders pursuant to the DRP. Management plans to increase the size of the offering once the maximum offering amount is reached. During our offering, the purchase price of shares purchased through the DRP will be at a price equal to the then current Monthly Share Value. No dealer manager fees, selling commissions or other sales charges will be paid with respect to shares purchased pursuant to the DRP except for distribution fees on Class C shares issued under the DRP. At its discretion, the board of directors may amend, suspend, or terminate the DRP. A participant may terminate participation in the DRP by written notice to the plan administrator, received by the plan administrator at least 10 days prior to the distribution payment date.
As of September 30, 2020, the company issued 1,920,722 Class A shares, 291,778 Class C shares, and 863,943 Class I shares for a total of 3,076,443 shares issued under the DRP. As of December 31, 2019, the company issued 1,588,435 Class A shares, 220,991 Class C shares, and 678,445 Class I shares for a total of 2,487,871 shares issued under the DRP.
28
Share Repurchase Program
During 2015, the company commenced a “share repurchase program”, pursuant to which quarterly share repurchases will be conducted, on up to approximately 5% of the weighted average number of outstanding shares in any 12-month period, to allow members who hold Class A, C, I, P-A (commencing as of April 16, 2018) or P-I shares (commencing as of October 1, 2017) to sell shares back to the company at a price equal to the then current offering price less the selling commissions and dealer manager fees associated with that class of shares.
The share repurchase program included numerous restrictions that would limit a shareholder’s ability to sell shares. At the sole discretion of the board of directors, the company could have use cash on hand, cash available from borrowings and cash from liquidation of investments to repurchase shares.
Effective September 1, 2020, the company, through approval by its board of directors, adopted an amended share repurchase program, pursuant to which the company will conduct quarterly share repurchases to allow members to sell all or a portion of their shares (of any class) back to the company at a price equal to the then current monthly share value associated with that class of shares. The quarterly share repurchase limits for the company’s new share repurchase program are set forth below.
The shareholders’ right to repurchase is subject to the availability of funds and the other provisions of the share repurchase program. Additionally, a member must hold his or her shares for a minimum of one year before he or she can participate in the share repurchase program, subject to any of the following special circumstances: i) the written request of the estate, heir or beneficiary of a deceased shareholder; ii) a qualifying disability of the shareholder for a non-temporary period of time provided that the condition causing the qualifying disability was not pre-existing on the date that the shareholder became a shareholder; or iii) a determination of incompetence of the shareholder by a state or federal court located in the United States. If a member has made more than one purchase of shares, the one-year holding period will be calculated separately with respect to each purchase.
The company may still fund repurchase requests from sources other than cash flow from operations as previously disclosed. Unless the company’s board of directors determines otherwise, the company will limit the amount of repurchases pursuant to the share repurchase program as follows:
| Quarter-Ending | Share Repurchase Limit(s) | |
| September 30, 2020 | During such fiscal quarter, 1.25% of the weighted average number of shares outstanding in the prior four fiscal quarters | |
| December 31, 2020 | During such fiscal quarter, 1.875% of the weighted average number of shares outstanding in the prior four fiscal quarters | |
| March 31, 2021 | During such fiscal quarter, 2.50% of the weighted average number of shares outstanding in the prior four fiscal quarters | |
| June 30, 2021 | During such fiscal quarter, 3.75% of the weighted average number of shares outstanding in the prior four fiscal quarters | |
| September 30, 2021, and each quarter thereafter | ● During any 12-month period, 20.00% of our weighted average number of outstanding shares
● During any fiscal quarter, 5.00% of the weighted average number of shares outstanding in the prior four fiscal quarters |
29
Note 8. Distributions
On the last business day of each month, with the authorization of the company’s board of directors, the company declares distributions on each outstanding Class A, C, I, P-A and P-I share. These distributions are calculated based on shareholders of record for each day in amounts equal to that exhibited in the table below based upon distribution period and class of share.
| Class of Share | ||||||||||||||||||||||
| Distribution Period | A | C | I | P-A | P-I | |||||||||||||||||
| 1-Nov-17 | 31-Jan-18 | $ | 0.00166900 | $ | 0.00162650 | $ | 0.00166900 | — | $ | 0.00158280 | ||||||||||||
| 1-Feb-18 | 30-Apr-18 | $ | 0.00166900 | $ | 0.00162650 | $ | 0.00166900 | — | $ | 0.00158280 | ||||||||||||
| 1-May-18 | 31-Jul-18 | $ | 0.00166900 | $ | 0.00162650 | $ | 0.00166900 | — | $ | 0.00158280 | ||||||||||||
| 1-Aug-18 | 31-Oct-18 | $ | 0.00166900 | $ | 0.00162650 | $ | 0.00166900 | $ | 0.00164790 | $ | 0.00158280 | |||||||||||
| 1-Nov-18 | 31-Jan-19 | $ | 0.00166900 | $ | 0.00162650 | $ | 0.00166900 | $ | 0.00164790 | $ | 0.00158280 | |||||||||||
| 1-Feb-19 | 30-Apr-19 | $ | 0.00166900 | $ | 0.00162650 | $ | 0.00166900 | $ | 0.00164790 | $ | 0.00158280 | |||||||||||
| 1-May-19 | 31-Jul-19 | $ | 0.00166900 | $ | 0.00162650 | $ | 0.00166900 | $ | 0.00164790 | $ | 0.00158280 | |||||||||||
| 1-Aug-19 | 31-Oct-19 | $ | 0.00166900 | $ | 0.00162650 | $ | 0.00166900 | $ | 0.00164790 | $ | 0.00158280 | |||||||||||
| 1-Nov-19 | 31-Jan-20 | $ | 0.00166900 | $ | 0.00162650 | $ | 0.00166900 | $ | 0.00164790 | $ | 0.00158280 | |||||||||||
| 1-Feb-20 | 30-Apr-20 | $ | 0.00166900 | $ | 0.00162650 | $ | 0.00166900 | $ | 0.00164790 | $ | 0.00158280 | |||||||||||
| 1-May-20 | 30-Jun-20 | $ | 0.00151895 | $ | 0.00148798 | $ | 0.00151895 | $ | 0.00152708 | $ | 0.00158280 | |||||||||||
| 1-Jul-20 | 31-Aug-20 | $ | 0.00151895 | $ | 0.00148798 | $ | 0.00151895 | $ | 0.00152708 | $ | 0.00158280 | |||||||||||
| 1-Sept-20 | 30-Sep-20 | $ | 0.00151895 | $ | 0.00148798 | $ | 0.00151895 | $ | 0.00152708 | $ | 0.00158282 | |||||||||||
| 1-Oct-20 | 28-Feb-21 | $ | 0.00151895 | $ | 0.00148798 | $ | 0.00151895 | $ | 0.00152316 | $ | 0.00158282 | |||||||||||
The following table reflects the distributions declared during the nine months ended September 30, 2020:
| Pay Date | Paid in Cash | Value of Shares Issued under DRP | Total | |||||||||
| February 3, 2020 | $ | 1,788,378 | $ | 603,861 | $ | 2,392,239 | ||||||
| March 2, 2020 | 1,733,079 | 562,148 | 2,295,227 | |||||||||
| April 2, 2020 | 1,890,329 | 593,364 | 2,483,693 | |||||||||
| May 1, 2020 | 1,838,776 | 578,227 | 2,417,003 | |||||||||
| June 1, 2020 | 1,829,781 | 551,532 | 2,381,313 | |||||||||
| July 1, 2020 | 1,827,331 | 532,189 | 2,359,520 | |||||||||
| August 3, 2020 | 2,133,835 | 548,210 | 2,682,045 | |||||||||
| September 1, 2020 | 2,157,292 | 546,746 | 2,704,038 | |||||||||
| October 1, 2020 | 2,178,752 | 529,372 | 2,708,124 | |||||||||
| Total | $ | 17,377,553 | $ | 5,045,649 | $ | 22,423,202 | ||||||
The following table reflects the distributions declared during the nine months ended September 30, 2019:
| Pay Date | Paid in Cash | Value of Shares Issued under DRP | Total | |||||||||
| February 1, 2019 | $ | 1,317,325 | $ | 583,571 | $ | 1,900,896 | ||||||
| March 1, 2019 | 1,247,614 | 552,615 | 1,800,229 | |||||||||
| April 1, 2019 | 1,452,585 | 611,400 | 2,063,985 | |||||||||
| May 1, 2019 | 1,438,057 | 600,614 | 2,038,671 | |||||||||
| June 1, 2019 | 1,553,801 | 622,584 | 2,176,385 | |||||||||
| July 1, 2019 | 1,764,339 | 383,813 | 2,148,152 | |||||||||
| August 1, 2019 | 1,850,929 | 393,237 | 2,244,166 | |||||||||
| September 2, 2019 | 1,664,451 | 613,333 | 2,277,784 | |||||||||
| October 1, 2019 | 1,647,779 | 589,769 | 2,237,548 | |||||||||
| $ | 13,936,880 | $ | 4,950,936 | $ | 18,887,816 | |||||||
All distributions paid for the nine months ended September 30, 2020 are expected to be reported as a return of capital to members for tax reporting purposes and all distributions paid for the nine months ended September 30, 2019 were reported as a return of capital to members for tax purposes.
30
Cash distributions paid during the periods presented were funded from the following sources noted below:
| For the nine months ended September 30, 2020 |
For the nine months ended September 30, 2019 |
|||||||
| Cash from operations | $ | 804,374 | $ | 2,136,045 | ||||
| Offering proceeds | 16,244,967 | 11,800,835 | ||||||
| Total Cash Distributions | $ | 17,049,341 | $ | 13,936,880 | ||||
The company expects to continue to fund distributions from a combination of cash from operations as well as offering proceeds. Due to the company’s change in investment portfolio composition in 2018 to include a greater percentage of pre-operational assets, a significant amount of distributions will continue to be funded from offering proceeds.
Note 9. Commitments and Contingencies
Legal proceedings: The company may become involved in legal proceedings, administrative proceedings, claims and other litigation that arise in the ordinary course of business. Individuals and interest groups may sue to challenge the issuance of a permit for a renewable energy project or seek to enjoin construction of a wind energy project. In addition, we may be subject to legal proceedings or claims contesting the construction or operation of our renewable energy projects. In defending ourselves in these proceedings, we may incur significant expenses in legal fees and other related expenses, regardless of the outcome of such proceedings. Unfavorable outcomes or developments relating to these proceedings, such as judgments for monetary damages, injunctions or denial or revocation of permits, could have a material adverse effect on our business, financial condition and results of operations. In addition, settlement of claims could adversely affect our financial condition and results of operations. As of September 30, 2020, management is not aware of any legal proceedings that might have a significant adverse impact on the company.
Pledge of collateral and unsecured guarantee of loans to subsidiaries: Pursuant to a credit agreement between GREC HoldCo and a financial institution, GREC HoldCo has pledged all operating assets as well as all membership interests in operating subsidiaries owned by GREC HoldCo as collateral for the loan. Pursuant to various loan agreements between the operating entities of the company and various lenders, the operating entities have pledged all operating assets as well as the membership interests in various operating subsidiaries as collateral for the term loans with maturity dates ranging from January 2021 through September 2049.
Investment in to be constructed assets and membership interest purchase commitments: Pursuant to various engineering, procurement and construction contracts and alike agreements to which the company’s operating entities are individually a party, the operating entities, and indirectly the company, have committed an outstanding balance of approximately $70.7 million as of September 30, 2020 to complete construction of the facilities and bring the project assets to operation. Based upon current construction schedules, the expectation is these commitments will be fulfilled throughout the remainder of 2020 and forward. In addition, pursuant to various membership interest purchase agreements to which the company’s operating entities are individually a party, the operating entities, and indirectly the company, have committed an outstanding balance of approximately $195.4 million as of September 30, 2020 to complete the closing pursuant to the membership interest purchase agreements. The company plans to use cash on hand, debt and tax equity financing as well as additional capital raised to fund such commitments.
Unsecured guarantee of subsidiary renewable energy credit (“REC”) forward contracts: For the majority of the forward REC contracts currently effective as of September 30, 2020 where an operating entity of the company is the principal, the company has provided an unsecured guarantee related to the delivery obligations. The amount of the unsecured guaranty related to REC delivery performance obligations is nil as of September 30, 2020.
Pledge of Parent Company Guarantees: Pursuant to various contracts in which the company has provided a parent company guarantee, excluding those discussed above, the operating entities, and indirectly the company, have committed an additional $122.1 million in unsecured guarantees, in the event of a default at the underlying entity.
See Note 1 — Organization and Operations of the Company and Note 5 — Related Party Agreements and Transactions Agreements for an additional discussion of the company’s commitments and contingencies.
31
Note 10. Financial Highlights
The following is a schedule of financial highlights of the company attributed to Class A, C, I, P-A and P-I shares for the nine months ended September 30, 2020.
| For the nine months ended September 30, 2020 | ||||||||||||||||||||
| Class A Shares | Class C Shares | Class I Shares | Class P-A Shares | Class P-I Shares | ||||||||||||||||
| Per share data attributed to common shares (1): | ||||||||||||||||||||
| Net Asset Value at beginning of period | $ | 8.40 | $ | 8.23 | $ | 8.40 | $ | 8.44 | $ | 8.73 | ||||||||||
| Net investment income(3) | 0.18 | 0.18 | 0.18 | 0.18 | 0.18 | |||||||||||||||
| Net realized and unrealized gain on investments, net of incentive allocation to special unitholder | 0.63 | 0.63 | 0.63 | 0.63 | 0.63 | |||||||||||||||
| Change in translation of assets and liabilities denominated in foreign currencies (4) | - | - | - | - | - | |||||||||||||||
| Change in benefit from deferred taxes on unrealized depreciation on investments | (0.12 | ) | (0.12 | ) | (0.12 | ) | (0.12 | ) | (0.12 | ) | ||||||||||
| Net increase in net assets attributed to common stockholders | 0.69 | 0.69 | 0.69 | 0.69 | 0.69 | |||||||||||||||
| Shareholder distributions: | ||||||||||||||||||||
| Distributions from net investment income | (0.02 | ) | (0.02 | ) | (0.02 | ) | (0.02 | ) | (0.02 | ) | ||||||||||
| Distributions from offering proceeds | (0.42 | ) | (0.41 | ) | (0.42 | ) | (0.42 | ) | (0.42 | ) | ||||||||||
| Offering costs and deferred sales commissions | - | (0.09 | ) | - | - | - | ||||||||||||||
| Other(2) | (0.02 | ) | (0.02 | ) | (0.02 | ) | (0.02 | ) | 0.04 | |||||||||||
| Net decrease in members’ equity attributed to common shares | (0.46 | ) | (0.54 | ) | (0.46 | ) | (0.46 | ) | (0.40 | ) | ||||||||||
| Net asset value for common shares at end of period | $ | 8.63 | $ | 8.38 | $ | 8.63 | $ | 8.67 | $ | 9.02 | ||||||||||
| Common equityholders’ equity at end of period | $ | 147,039,601 | $ | 23,038,935 | $ | 56,472,346 | $ | 157,079 | $ | 286,177,086 | ||||||||||
| Common shares outstanding at end of period | 17,036,392 | 2,750,825 | 6,545,697 | 18,109 | 31,715,340 | |||||||||||||||
| Ratio/Supplemental data for common shares (annualized): | ||||||||||||||||||||
| Total return attributed to common shares based on net asset value | 8.08 | % | 7.07 | % | 8.03 | % | 6.70 | % | 8.45 | % | ||||||||||
| Ratio of net investment income to average net assets | 2.81 | % | 2.88 | % | 2.81 | % | 2.80 | % | 2.70 | % | ||||||||||
| Ratio of operating expenses to average net assets | 4.82 | % | 4.94 | % | 4.82 | % | 4.80 | % | 4.62 | % | ||||||||||
| Portfolio turnover rate | 10.32 | % | 10.32 | % | 10.32 | % | 10.32 | % | 10.32 | % | ||||||||||
| (1) | The per share data for Class A, C, I, P-A and P-I Shares were derived by using the weighted average shares outstanding during the period ended September 30, 2020, which were 17,036,392, 2,750,825, 6,545,697, 18,109, and 37,715,340, respectively. |
| (2) | Represents the impact of different share amounts used in calculating certain per share data based on weighted average shares outstanding during the period and the impact of shares at a price other than the net asset value. |
| (3) | Does not reflect any incentive fees that may be payable to the Special Unitholder. |
| (4) | Amount is less than $0.01 per share. |
32
The following is a schedule of financial highlights of the company attributed to Class A, C, I, P-A and P-I shares for the nine months ended September 30, 2019.
| For the nine months ended September 30, 2019 | ||||||||||||||||||||
| Class A Shares | Class C Shares | Class I Shares | Class P-A Shares | Class P-I Shares | ||||||||||||||||
| Per share data attributed to common shares (1): | ||||||||||||||||||||
| Net Asset Value at beginning of period | $ | 8.40 | $ | 8.21 | $ | 8.40 | $ | 8.40 | $ | 8.62 | ||||||||||
| Net investment income(3) | 0.06 | 0.06 | 0.06 | 0.06 | 0.06 | |||||||||||||||
| Net realized and unrealized gain on investments, net of incentive allocation to special unitholder | 0.70 | 0.70 | 0.70 | 0.70 | 0.70 | |||||||||||||||
| Change in translation of assets and liabilities denominated in foreign currencies (4) | - | - | - | - | - | |||||||||||||||
| Change in benefit from deferred taxes on unrealized depreciation on investments | (0.18 | ) | (0.18 | ) | (0.18 | ) | (0.18 | ) | (0.18 | ) | ||||||||||
| Net increase in net assets attributed to common stockholders | 0.58 | 0.58 | 0.58 | 0.58 | 0.58 | |||||||||||||||
| Shareholder distributions: | ||||||||||||||||||||
| Distributions from net investment income | (0.05 | ) | (0.05 | ) | (0.05 | ) | (0.05 | ) | (0.05 | ) | ||||||||||
| Distributions from offering proceeds | (0.40 | ) | (0.38 | ) | (0.40 | ) | (0.39 | ) | (0.37 | ) | ||||||||||
| Offering costs and deferred sales commissions | (0.01 | ) | (0.04 | ) | (0.01 | ) | - | - | ||||||||||||
| Other(2) | (0.08 | ) | (0.05 | ) | (0.08 | ) | (0.07 | ) | (0.03 | ) | ||||||||||
| Net decrease in members’ equity attributed to common shares | (0.54 | ) | (0.52 | ) | (0.54 | ) | (0.51 | ) | (0.45 | ) | ||||||||||
| Net asset value for common shares at end of period | $ | 8.44 | $ | 8.27 | $ | 8.44 | $ | 8.47 | $ | 8.75 | ||||||||||
| Common shareholders’ equity at end of period | $ | 145,295,348 | $ | 22,359,417 | $ | 56,188,814 | $ | 153,410 | $ | 170,945,660 | ||||||||||
| Common shares outstanding at end of period | 17,207,556 | 2,703,122 | 6,654,530 | 18,109 | 19,544,664 | |||||||||||||||
| Ratio/Supplemental data for common shares (annualized): | ||||||||||||||||||||
| Total return attributed to common shares based on net asset value | 5.90 | % | 6.15 | % | 5.90 | % | 4.25 | % | 6.62 | % | ||||||||||
| Ratio of net investment income to average net assets | 1.00 | % | 1.02 | % | 1.00 | % | 1.00 | % | 0.97 | % | ||||||||||
| Ratio of operating expenses to average net assets | 3.81 | % | 3.90 | % | 3.82 | % | 3.80 | % | 3.70 | % | ||||||||||
| Portfolio turnover rate | 4.42 | % | 4.42 | % | 4.42 | % | 4.42 | % | 4.42 | % | ||||||||||
| (1) | The per share data for Class A, C, I, P-A and P-I Shares were derived by using the weighted average shares outstanding during the period ended September 30, 2019, which were 17,207,556, 2,703,122, 6,654,530, 18,109 and 19,544,664, respectively |
| (2) | Represents the impact of different share amounts used in calculating certain per share data based on weighted average shares outstanding during the period and the impact of shares at a price other than the net asset value. |
| (3) | Does not reflect any incentive fees that may be payable to the Special Unitholder. |
| (4) | Amount is less than $0.01 per share. |
| 33 |
Note 11. Revisions to Prior Period Financial Statements
We identified errors related to deferred tax assets included in our consolidated financial statements for the quarterly period ending September 30, 2016 and each subsequent quarterly and annual period through the quarterly period ending June 30, 2020. We concluded that our previously issued consolidated financial statements were not materially misstated as a result of these errors, but the correction would be material to the current period consolidated statements of operations. As such, we revised our previously reported quarterly and annual consolidated financial statements for the periods since September 30, 2016. The historical periods presented in this Quarterly Report on Form 10-Q have been revised with corresponding adjustment to accumulated gains (losses) on the consolidated statements of assets and liabilities to correct for these errors.
The errors resulted in an overstatement of our deferred tax assets, net of allowance, on the consolidated statements of assets and liabilities and also affected the change in benefit from deferred taxes on unrealized appreciation (depreciation) on investments on the consolidated statements of operations.
These errors had no impact on our cash flows, as such, did not impact our consolidated statement of cash flow.
The following tables set forth the effect of the revisions on each of the individual effected line items in the consolidated financial statements:
| Three Months Ended September 30, 2019 | Nine Months Ended September 30, 2019 | |||||||||||||||||||||||
| As Previously Reported | Adjustments | As Revised | As Previously Reported | Adjustments | As Revised | |||||||||||||||||||
| Consolidated Statement of Operations data: | ||||||||||||||||||||||||
| Change in benefit from deferred taxes on unrealized appreciation (depreciation) on investments | $ | (2,463,723 | ) | $ | (1,109,484 | ) | $ | (3,573,207 | ) | $ | (4,543,641 | ) | $ | (2,957,133 | ) | $ | (7,500,774 | ) | ||||||
| Net increase in net assets resulting from operations | 16,193,547 | (1,109,484 | ) | 15,084,063 | 28,115,577 | (2,957,133 | ) | 25,158,444 | ||||||||||||||||
| Net increase in net assets attributed to common equityholders | 13,604,652 | (1,109,484 | ) | 12,495,168 | 24,090,394 | (2,957,133 | ) | 21,133,261 | ||||||||||||||||
| Common stock per share information - basic and diluted: | ||||||||||||||||||||||||
| Net increase in net assets attributed to common members | 0.30 | (0.02 | ) | 0.28 | 0.56 | $ | (0.07 | ) | 0.49 | |||||||||||||||
| Year Ended December 31, 2019 | ||||||||||||
| As Previously Reported | Adjustments | As Revised | ||||||||||
| Consolidated Balance Sheet data: | ||||||||||||
| Deferred tax assets, net of valuation allowance | $ | 1,313,506 | $ | (1,313,506 | ) | $ | - | |||||
| Total assets | 509,472,588 | (1,313,506 | ) | 508,159,082 | ||||||||
| Deferred tax liabilities | - | 6,500,625 | 6,500,625 | |||||||||
| Total liabilities | 86,020,997 | 6,500,625 | 92,521,622 | |||||||||
| Total common members’ equity | 416,553,783 | (7,814,131 | ) | 408,739,652 | ||||||||
| Total members’ equity (net assets) | 423,451,591 | (7,814,131 | ) | 415,637,460 | ||||||||
| Total liabilities and equity | $ | 509,472,588 | $ | (1,313,506 | ) | $ | 508,159,082 | |||||
| 34 |
| Three Months Ended March 31, 2020 | ||||||||||||
| As Previously Reported | Adjustments | As Revised | ||||||||||
| Consolidated Statement of Operations data: | ||||||||||||
| Change in benefit from deferred taxes on unrealized appreciation (depreciation) on investments | $ | (5,222,681 | ) | $ | (1,084,537 | ) | $ | (6,307,218 | ) | |||
| Net increase in net assets resulting from operations | 11,716,325 | (1,084,537 | ) | 10,631,788 | ||||||||
| Net increase in net assets attributed to common equityholders | 9,028,866 | (1,084,537 | ) | 7,944,329 | ||||||||
| Common stock per share information – basic and diluted: | ||||||||||||
| Net increase in net assets attributed to common equityholders | $ | 0.18 | $ | (0.02 | ) | $ | 0.16 | |||||
| March 31, 2020 | ||||||||||||
| As Previously Reported | Adjustments | As Revised | ||||||||||
| Consolidated Balance Sheet data: | ||||||||||||
| Deferred tax liabilities | $ | 677,311 | $ | 8,898,668 | $ | 9,575,979 | ||||||
| Total liabilities | 90,581,230 | 8,898,668 | 99,479,898 | |||||||||
| Total common equityholders’ equity | 435,018,844 | (8,898,668 | ) | 426,120,176 | ||||||||
| Total members’ equity (net assets) | 443,480,111 | (8,898,668 | ) | 434,581,443 | ||||||||
| Total liabilities and equity | $ | 534,061,341 | $ | - | $ | 534,061,341 | ||||||
| Three Months Ended June 30, 2020 | Six Months Ended June 30, 2020 | |||||||||||||||||||||||
| As Previously Reported | Adjustments | As Revised | As Previously Reported | Adjustments | As Revised | |||||||||||||||||||
| Consolidated Statement of Operations data: | ||||||||||||||||||||||||
| Change in benefit from deferred taxes on unrealized appreciation (depreciation) on investments | $ | (1,661,626 | ) | $ | (1,793,506 | ) | $ | (3,455,132 | ) | $ | (6,884,307 | ) | $ | (2,878,043 | ) | $ | (9,762,350 | ) | ||||||
| Net increase in net assets resulting from operations | 13,077,727 | (1,793,506 | ) | 11,284,221 | 24,794,052 | (2,878,043 | ) | 21,916,009 | ||||||||||||||||
| Net increase in net assets attributed to common equityholders | $ | 10,417,319 | $ | (1,793,506 | ) | $ | 8,623,813 | $ | 19,446,185 | $ | (2,878,043 | ) | $ | 16,568,142 | ||||||||||
| Common stock per share information - basic and diluted: | ||||||||||||||||||||||||
| Net increase in net assets attributed to common members | $ | 0.21 | $ | (0.04 | ) | $ | 0.17 | $ | 0.39 | $ | (0.06 | ) | $ | 0.33 | ||||||||||
| June 30, 2020 | ||||||||||||
| As Previously Reported | Adjustments | As Revised | ||||||||||
| Consolidated Balance Sheet data: | ||||||||||||
| Deferred tax assets, net of allowance | $ | 76,771 | $ | (76,771 | ) | $ | - | |||||
| Total assets | 569,194,388 | (76,771 | ) | 569,117,617 | ||||||||
| Deferred tax liabilities | - | 10,615,403 | 10,615,403 | |||||||||
| Total liabilities | 91,700,003 | 10,615,403 | 102,315,406 | |||||||||
| Total common equityholders’ equity | 468,551,826 | (10,692,174 | ) | 457,859,652 | ||||||||
| Total members’ equity (net assets) | 477,494,385 | (10,692,174 | ) | 466,802,211 | ||||||||
| Total liabilities and equity | $ | 569,194,388 | $ | (76,771 | ) | $ | 569,117,617 | |||||
Note 12. Subsequent Events
The company’s management has evaluated subsequent events through the date of issuance of the consolidated financial statements. There have been no subsequent events that occurred during such period that would require disclosure in the consolidated financial statements or would be required to be recognized in the consolidated financial statements as of and for the nine months ended September 30, 2020 (unaudited) other than those disclosed below.
Effective October 18, 2020, the company will begin privately offering Classes P-A, P-T and P-D shares.
With the authorization of the board of directors, the company has declared distributions on each outstanding Class P-T and P-D share. These distributions are calculated based on shareholders of record for each day in amounts equal to $0.00158282 per share of Class P-T and $0.00158282 per share of Class P-D for the period of November 1, 2020 through February 28, 2021.
35
Item 2. Management’s Discussion and Analysis of Financial Condition and Results of Operations
The following discussion and analysis should be read in conjunction with the company’s consolidated financial statements and related notes and other financial information appearing elsewhere in this Quarterly report on Form 10-Q.
Except as otherwise specified, references to “we,” “us,” “our,” or the “company,” refer to Greenbacker Renewable Energy Company LLC.
Forward Looking Statements
Various statements in this quarterly report, including those that express a belief, expectation, or intention, as well as those that are not statements of historical fact, are forward-looking statements. The forward-looking statements may include projections and estimates concerning the timing and success of specific projects, revenues, income, and capital spending. We generally identify forward-looking statements with the words “believe,” “intend,” “expect,” “seek,” “may,” “will,” “should,” “would,” “anticipate,” “could,” “estimate,” “plan,” “predict,” “project” or their negatives, and other similar expressions. All statements we make relating to our estimated and projected earnings, margins, costs, expenditures, cash flows, growth rates and financial results or to our expectations regarding future industry trends are forward-looking statements. These forward-looking statements are subject to risks and uncertainties that may change at any time, and, therefore, our actual results may differ materially from those that we expected. The forward-looking statements contained in this report are largely based on our expectations, which reflect many estimates and assumptions made by our management. These estimates and assumptions reflect our best judgment based on currently known market conditions and other factors. Although we believe such estimates and assumptions are reasonable, we caution that it is very difficult to predict the impact of known factors and it is impossible for us to anticipate all factors that could affect our actual results. In addition, our advisor’s assumptions about future events may prove to be inaccurate. We caution all readers that the forward-looking statements contained in this report are not guarantees of future performance, and we cannot assure any reader that such statements will prove correct or the forward-looking events and circumstances will occur. Actual results may differ materially from those anticipated or implied in the forward-looking statements due to the numerous risks and uncertainties as described under “Risk Factors” and elsewhere in this report. All forward-looking statements are based upon information available to us on the date of this report. We undertake no obligation to update or revise any forward-looking statements as a result of new information, future events or otherwise, except as otherwise required by law. You are advised to consult any additional disclosures that we may make directly to you or through reports that we in the future may file with the SEC, including Annual Reports on Form 10-K, Quarterly Reports on Form 10-Q and Current Reports on Form 8-K. These cautionary statements qualify all forward-looking statements attributable to us, or persons acting on our behalf. The risks, contingencies and uncertainties associated with our forward-looking statements relate to, among other matters, the following:
| ● | changes in the economy; |
| ● | the ability to complete the renewable energy projects in which we invest; |
| ● | our relationships with project developers, lawyers, investment and commercial banks, individual and institutional investors, consultants, diligence specialists, EPC companies, contractors, renewable energy technology manufacturers (such as panel manufacturers), solar insurance specialists, component manufacturers, software providers and other industry participants in the renewable energy, capital markets and project finance sectors; |
| ● | fluctuations in supply, demand, prices and other conditions for electricity, other commodities and renewable energy certificates (“RECs”); |
| ● | public response to and changes in the local, state and federal regulatory framework affecting renewable energy projects, including the potential expiration or extension of the production tax credit (“PTC”), investment tax credit (“ITC”) and the related U.S. Treasury grants and potential reductions in renewable portfolio standards (“RPS”) requirements; |
| ● | competition from other energy developers; |
| ● | the worldwide demand for electricity and the market for renewable energy; |
| ● | the ability or inability of conventional fossil fuel-based generation technologies to meet the worldwide demand for electricity; |
| ● | our competitive position and our expectation regarding key competitive factors; |
36
| ● | risks associated with our hedging strategies; |
| ● | potential environmental liabilities and the cost of compliance with applicable environmental laws and regulations, which may be material; |
| ● | our electrical production projections (including assumptions of curtailment and facility availability) for our renewable energy projects; |
| ● | our ability to operate our business efficiently, manage costs (including general and administrative expenses) effectively and generate cash flow; |
| ● | availability of suitable renewable energy resources and other weather conditions that affect our electricity production; |
| ● | the effects of litigation, including administrative and other proceedings or investigations relating to our renewable energy projects; |
| ● | non-payment by customers and enforcement of certain contractual provisions; |
| ● | risks associated with possible disruption in our operations or the economy generally due to terrorism, or natural disasters; and |
| ● | future changes in laws or regulations and conditions in our operating areas. |
Overview
Greenbacker Renewable Energy Company LLC, (the “LLC”) a Delaware limited liability company, formed in December 2012, is an externally managed energy company that acquires and manages income-generating renewable energy and energy efficiency projects and other energy-related businesses as well as finances the construction and/or operation of these and sustainable development projects and businesses. The LLC conducts substantially all of its operations through its wholly-owned subsidiary, Greenbacker Renewable Energy Corporation (“GREC”).
GREC is a Maryland corporation formed in November 2011 and the LLC currently holds all the outstanding shares of capital stock of GREC. GREC Entity HoldCo LLC, a wholly owned subsidiary of GREC, was formed in Delaware, in June 2016 (“GREC HoldCo”). GREC Administration LLC and Danforth Shared Services LLC, both wholly-owned subsidiaries of GREC, were formed in Delaware, in January 2020 and May 2019, respectively. The LLC, Danforth Shared Services LLC, GREC, GREC Administration LLC, and GREC HoldCo (collectively “we”, “us”, “our”, and the “company”) are managed and advised by Greenbacker Capital Management LLC (the “advisor” or “GCM”), a renewable energy, energy efficiency and sustainability related project acquisition, consulting and development company that is registered as an investment adviser under the Investment Advisers Act of 1940, as amended (“Advisers Act”). The LLC’s fiscal year end is December 31.
Our business objective is to generate attractive risk-adjusted returns for our members, consisting of both current income and long-term capital appreciation, by acquiring, and financing the construction and/or operation of income-generating renewable energy, energy efficiency and sustainable development projects, primarily within North America. The size of our investments generally ranges between approximately $1 million and $100 million. We seek to maximize our risk-adjusted returns by: (1) capitalizing on market opportunities; (2) focusing on real assets that produce dependable cash flows; (3) efficiently utilizing government incentives where available; (4) employing creative deal structuring to optimize capital and ownership structures; (5) partnering with experienced financial, legal, engineering and other professional firms; (6) employing sound due diligence and risk mitigation processes; and (7) monitoring and managing our portfolio of assets on an ongoing basis. We may change our investment policies and strategies without prior notice or member approval.
Our objective has been to assemble a diversified portfolio of renewable energy, energy efficiency and other sustainability related projects and businesses. Renewable energy projects generally earn revenue through the sale of generated electricity as well as frequently through the sale of other commodities such as RECs and EECs. We initially focused on solar energy and wind energy projects as well as energy efficiency projects. In 2019, we invested in our initial biomass facility. In Q2 2020, we invested in our initial battery storage asset.
We believe solar energy projects generally offer more predictable power generation characteristics, due to the relative predictability of sunlight over the course of time compared to other renewable energy classes. Therefore, we expect they will provide more stable income streams. However, technological advances in wind turbines and other energy generation technologies, as well as government incentives make wind energy and other types of projects attractive as well.
Solar energy projects provide maximum energy production during the middle of the day and in the summer months when days are longer and nights shorter. Solar energy projects tend to have minimal environmental impact enabling such projects to be developed close to areas of dense population where electricity demand is highest. Since solar technology is scalable and well-established, it has been a relatively straightforward process to integrate new acquisitions and projects into our portfolio.
Over time, we expect to broaden our strategy to include other types of renewable energy projects and energy efficiency projects and businesses, which may include hydropower assets, and geothermal plants, combined heat and power technology assets, fuel cell assets and other energy efficiency assets, among others. To the extent we deem the opportunity attractive, other energy and sustainability related assets and businesses will be included.
37
Our preferred investment strategy is to acquire controlling equity stakes in our target assets or to be named the managing member of a limited liability company to oversee and supervise their operations. We define controlling equity stakes as companies in which we own 25% or more of the voting securities of such company or have greater than 50% representation on such company’s board of directors. However, we will also provide financing to projects owned by others, including through the provision of secured loans which may or may not include some form of equity participation.
Our strategy will be tailored to balance long-term cash flow certainty, which we can achieve through long-term agreements for our products, with shorter term arrangements that allow us to potentially generate higher risk-adjusted returns. We may provide projects with senior unsecured debt, subordinated secured debt, subordinated unsecured debt, mezzanine debt, convertible debt, convertible preferred equity, and preferred equity, and we may make minority equity investments. We may also participate in projects by acquiring contractual payment rights or rights to receive a proportional interest in the operating cash flow or net income of a project. We may also make equity investments in or loans to parties financing the supply of renewable energy and energy efficiency to residential and commercial customers or the adoption of strategies to reduce the consumption of energy by those customers.
Overall, GCM’s strategy of purchasing smaller renewable energy projects where there is less competition from the larger capital providers has enabled us to build a diversified portfolio of high quality, higher returning assets. Having a portfolio of smaller projects is initially more expensive and time consuming to operate than having a smaller number of much larger projects, as all renewable energy projects have similar onboarding and acquisition costs irrespective of their size. However, at scale there are considerable efficiencies to be obtained on smaller projects through the streamlining of operations, buying insurance and other services in bulk and obtaining much better financing terms and these benefits are then available to be enjoyed over the whole of the economic life of the assets; which in most cases is 30 to 35 years. GCM views the downside of the additional upfront costs as well worth the investment to provide superior returns over the long term. The larger and more efficient the company becomes the more we create a sustainable competitive advantage in the marketplace. There are other advantages of this strategy as well such as wide geographic diversity, which is very important when weather plays such an important part in the generation of our income, credit risk diversity, operational diversity, technology diversity and smoothing the seasonality to name just a few. Another key advantage is that we expect to see more of the investment opportunities in the future in smaller projects as the economy continues to embrace the concept of distributed energy and move away from the traditional centralized generation model. As this trend continues, we expect to see more smaller transactions coming to market and far fewer large transactions. In the year ending December 31, 2019 we executed 12 portfolio acquisition transactions, and four portfolio sales, bringing us to a total of 34 portfolios to date. During the nine months ending September 30, 2020, we executed three additional portfolio acquisition transactions, and two portfolio sales, eight portfolio consolidations, and one portfolio disposal, bringing us to a net total of 27 portfolios. As our access to capital has increased, the average size of the investment has increased from 13.98 MW per portfolio in 2018 to 19.83 MW per portfolio in 2019, a 41.85% increase year over year. As of September 30, 2020, the average size of our investments has increased again to 27.26 MW per portfolio.
Our renewable energy projects generate revenue primarily by selling (1) generated electric power to local utilities and other high quality, utility, municipal, corporate and individual residential counterparties, and (2) in some cases, RECs, EECs, and other commodities associated with the generation or savings of power. We seek to acquire or finance projects that contain transmission infrastructures and access to power grids or networks that will enable the generated power to be sold. We generally expect our projects will have PPAs with one or more counterparties, including local utilities or other high credit quality counterparties, who agree to purchase the electricity generated from the project.
We refer to these PPAs as “must-take contracts,” and we refer to these other counterparties as “off-takers.” These must-take contracts guarantee that all electricity generated by each project will be purchased. Although we intend to work primarily with high credit quality counterparties, if an off-taker cannot fulfill its contractual obligation to purchase the power, we would seek to sell the power to the local utility or other suitable counterparty, which would potentially ensure revenue is generated for all solar electricity generation.
38
We employ a rigorous credit underwriting process for each of our contractual counterparties: (1) identification of high credit quality counterparties with appropriate bonding and insurance capacity; (2) where available, the review of counterparty financial statements and/or publicly available credit rating reports; (3) worst-case analysis testing of assets; (4) ongoing monitoring of acquired assets and counterparty creditworthiness, including monitoring the public credit ratings reports issued by Moody’s and Standard and Poor’s; and (5) individual FICO scores in regard to residential solar where the homeowner is the counterparty.
The following table illustrates the allocation by percentage of the company’s contracted revenue by counterparty type and creditworthiness for the nine months ended September 30, 2020 and the year ended December 31, 2019.
| For the nine months ended September 30, 2020 | For the year ended December 31, 2019 | |||||||
| Investment grade: | ||||||||
| Utility | 64.2 | % | 60.2 | % | ||||
| Municipality | 8.7 | 8.1 | ||||||
| Corporation | 0.7 | 0.2 | ||||||
| Subtotal Investment Grade | 73.6 | % | 68.5 | % | ||||
| Non-investment grade or no rating:** | ||||||||
| Utility | 16.6 | % | 15.0 | % | ||||
| Municipality | 5.2 | 2.4 | ||||||
| Residential* | - | 12.4 | ||||||
| Corporation | 4.6 | 1.7 | ||||||
| Subtotal non-investment grade or no rating | 26.4 | % | 31.5 | % | ||||
| Total | 100.0 | % | 100.0 | % | ||||
| * | Residential amounts include revenue from our Residential Portfolios prior to the sale on March 5, 2020. |
| ** | As of September 30, 2020, there are no non-investment grade off-takers. |
Our PPAs, when structured with utilities and other large commercial users of electricity, are generally long-term in nature, tied to 100% of the output of the specific generating asset, and priced at a rate established pursuant to a formula set by the contract. The formula is often dependent upon the type of subsidies, if any, offered by the local and state governments for project development. Although we focus on projects with long-term contracts that ensure price certainty, we may also look for projects with shorter term arrangements that will allow us to participate in market rate changes which may lead to higher current income.
A number of the PPAs for our projects are structured as “behind the meter” agreements with commercial or government entities. Under the agreements, all electricity generated by a project will be purchased by the off-taker at an agreed upon rate that may be set at a slight discount to the retail electric tariff rate for the off-taker. These agreements also typically provide for annual rate increases over the term of the agreement although that is not a necessary requirement. The behind the meter agreement is generally long-term in nature and further typically provides that, should the off-taker fail to fulfill its contractual obligation, any electricity that is not purchased by the off-taker may be sold to the local utility, usually at an equivalent wholesale spot electric rate.
While we currently do not hold any residential solar assets, we had structured some of our prior investments in residential solar with a similar commercial arrangement to that of the PPAs with utilities and other large commercial users of electricity for our energy projects, as described above. In addition, we had acquired residential solar assets which had a private purchase agreement with the residential homeowner as counterparty as well as leasing the solar assets to residential owners on a long-term basis where the residential owner directly receives the benefit of the electricity generated.
We currently finance energy efficiency projects, which seek to enable businesses and governmental organizations to consume less energy while at the same time providing the same or greater level of amenity. Financing for energy efficiency projects is generally used to pay for energy efficiency retrofits of buildings, homes, businesses, and replacement of other inefficient energy consuming assets with more modern technologies. These projects are structured to provide predictable long-term cash flows by receiving a portion of the energy savings and the potential sale of associated RECs and EECs generated by such installations. In each of our renewable energy and energy efficiency investments, we intend, where appropriate, to maximize the benefits of renewable portfolio standards or RPS as well as other U.S. federal, state and local government support and incentives for the renewable energy industry.
39
The table below sets forth the company’s investments in alternative energy generation portfolios as September 30, 2020.
| Acquisition Date | Industry | Location(s) | Form of Investment*** | Cost**/ Principal Amount* | Assets | Generation Capacity in (MW)* | ||||||||||||
| Pacifica Portfolio | Second quarter
2020 Third quarter 2020 | Battery Storage | California | 100% equity ownership | $ | 8,685,904 | Operating and to-be-constructed battery energy storage facilities | 17.9 | ||||||||||
| Eagle Valley Biomass Portfolio | Second quarter 2019 | Biomass | Colorado | 100% equity ownership | $ | 22,336,352 | Operating biomass facility | 12.0 | ||||||||||
| Canadian Northern Lights Portfolio | Fourth quarter 2014, Fourth quarter 2015 | Commercial Solar | Ontario, Canada | 100% equity ownership | $ | 1,603,136 | Rooftop mounted solar photovoltaic systems | 0.6 | ||||||||||
| Conic Portfolio | First quarter 2018, Second quarter 2018, Fourth quarter 2018 | Commercial Solar | Colorado, North Carolina | Managing member, majority equity owner | $ | 12,704,841 | Commercial ground and roof mounted photovoltaic systems | 37.0 | ||||||||||
| East to West Solar Portfolio | First quarter 2015, Second quarter 2015, Fourth quarter 2015, Second quarter 2018, First quarter 2019 | Commercial Solar | Colorado, Connecticut, Florida, Hawaii, Indiana and North Carolina | 100% equity ownership or Managing member, majority equity owner | $ | 24,618,117 | Commercial ground and roof mounted photovoltaic systems | 14.9 | ||||||||||
| Foresight Solar Portfolio | Fourth quarter 2017 | Commercial Solar | California, Colorado | Managing member, majority equity owner | $ | 15,390,000 | Commercial ground and roof mounted photovoltaic systems | 10.0 | ||||||||||
| Golden Horizons Solar Portfolio | Fourth quarter 2017 | Commercial Solar | California | 100% equity ownership | $ | 9,290,000 | Commercial ground and roof mounted photovoltaic systems | 7.8 | ||||||||||
| Green Maple Portfolio | Fourth quarter 2014, Fourth quarter 2015, Fourth quarter 2019 | Commercial Solar | Vermont | 100% equity ownership | $ | 26,844,254 | Commercial ground and roof mounted photovoltaic systems | 13.1 | ||||||||||
| Longleaf Solar Portfolio | Fourth quarter 2018 | Commercial Solar | North Carolina | Managing member, majority equity owner | $ | 23,105,319 | Commercial ground and roof mounted photovoltaic systems | 21.8 | ||||||||||
| Magnolia Sun Portfolio | Third quarter 2015, Third quarter 2016 | Commercial Solar | California, Massachusetts and Tennessee | 100% equity ownership or Managing Member, Majority Equity Owner | $ | 33,011,197 | Commercial ground and roof mounted photovoltaic systems | 18.5 | ||||||||||
| Midway III Solar Portfolio | Fourth quarter 2017 | Commercial Solar | California | Managing member, majority equity owner | $ | 11,525,465 | Commercial ground and roof mounted photovoltaic systems | 26.0 | ||||||||||
| Six States Solar Portfolio | Fourth quarter 2015, Second quarter 2016, Third quarter 2017, Second quarter 2018 | Commercial Solar | Arizona, California, Colorado, Connecticut, Indiana and North Carolina | 100% equity ownership | $ | 12,470,306 | Ground and roof mounted solar systems | 13.0 | ||||||||||
| Sunny Mountain Portfolio | Third quarter 2014 | Commercial Solar | Colorado | 100% equity ownership | $ | 888,081 | Commercial and residential ground and roof mounted solar photovoltaic systems | 0.8 | ||||||||||
| Trillium Portfolio | Fourth quarter 2019 | Commercial Solar | Arkansas, Colorado, Maryland, New Jersey, Vermont, Washington D.C | Managing member, majority equity owner | $ | 117,549,336 | Commercial ground and roof mounted solar photovoltaic systems | 138.4 | ||||||||||
| Greenbacker Wind Portfolio - California | Fourth quarter 2017 | Wind | California | 100% equity ownership | $ | 9,500,000 | Operating wind power facilities | 6.0 | ||||||||||
| Greenbacker Wind Portfolio - HoldCo | Second quarter 2017, Fourth quarter 2017, Second quarter 2019, Third quarter 2019 | Wind | Idaho, Iowa, Minnesota, and Vermont | 100% equity ownership | $ | 73,920,267 | Operating wind power facilities | 131.3 | ||||||||||
| Greenbacker Wind Portfolio - Massachusetts | Fourth quarter 2019 | Wind | Massachusetts | Managing member, majority equity owner | $ | 10,486,133 | Operating wind power facilities | 5.0 | ||||||||||
| Greenbacker Wind Portfolio - Montana | Fourth quarter 2015, Fourth quarter 2016 | Wind | Montana | Managing member, equity owner | $ | 25,064,201 | Operating wind power facilities | 35.0 | ||||||||||
| Citrine Portfolio | Fourth quarter 2019 | Pre-Operational Assets | California, Massachusetts, and New Jersey | 100% equity ownership | $ | 3,189,290 | Commercial ground and roof mounted photovoltaic systems | 54.3 | ||||||||||
| Greenbacker Wind Portfolio - Maine | First quarter 2020 | Pre-Operational Assets | Maine | 100% equity ownership | $ | 6,075,587 | Pre-operational wind power facilities | 15.3 | ||||||||||
| SE Solar 2019 Portfolio | Fourth quarter 2018 | Pre-Operational Assets | North Carolina | 100% equity ownership | $ | 10,433,667 | Commercial ground and roof mounted photovoltaic systems | 14.4 | ||||||||||
| Turquoise Solar Portfolio | Fourth quarter 2018 | Pre-Operational Assets | Nevada | 100% equity ownership | $ | 24,431,513 | Commercial ground and roof mounted photovoltaic systems | 61.2 | ||||||||||
| Other Portfolios | Third quarter 2018, Fourth quarter 2019 | Pre-Operational Assets | California, Colorado, and North Carolina | 100% equity ownership | $ | 8,834,837 | Commercial ground and roof mounted photovoltaic systems & Biomass facility | N/A | ||||||||||
| GREC Energy Efficiency Portfolio | Third quarter 2015 | Energy Efficiency | Puerto Rico | Capital lease | $ | 350,252 | Energy efficiency LED lighting | N/A | ||||||||||
| Renew AEC One, LLC | Fourth quarter 2015 | Energy Efficiency | Pennsylvania | Secured loan | $ | 428,640 | Energy efficiency LED lighting | N/A | ||||||||||
| Encore Loan | Fourth quarter 2019 | Secured Loan | Vermont | Secured loan | $ | 7,574,330 | Loan | N/A | ||||||||||
| Hudson Loan | Third quarter 2019 | Secured Loan | New York | Secured loan | $ | 9,945,275 | Loan | N/A | ||||||||||
| New Market Loan | Fourth quarter 2019 | Secured Loan | North Carolina | Secured loan | $ | 5,007,350 | Loan | N/A | ||||||||||
| SE Solar Loan | First quarter 2019 | Secured Loan | North Carolina | Secured loan | $ | 5,005,244 | Loan | N/A | ||||||||||
| TUUSSO Loan | Fourth quarter 2019 | Secured Loan | Washington | Secured loan | $ | 4,217,046 | Loan | N/A | ||||||||||
| * | Approximate. |
40
| ** | Does not include assumed project level debt. |
| *** | 100% Equity ownership, majority equity owner (>50%), equity owner (<50%), Managing Member of the Limited Liability Company, secured loan, or a capital lease. |
The investments described above have allowed us to execute on our strategy of constructing a portfolio of projects offering predictable power generation characteristics and generally stable income streams which include seasonal solar generation income (generally stronger in the summer months), wind generation income (generally stronger in the winter months), biomass generation income, and energy efficiency lighting investments.
The LLC conducts a significant portion of its operations through GREC, of which the LLC is the sole shareholder–both of the shares of common stock and the special preferred stock. We intend to continue to operate our business in a manner permitting us to maintain our exemption from registration under the Investment Company Act of 1940, as amended (the “Investment Company Act”). We are not a blank check company within the meaning of Rule 419 of the Securities Act of 1933, as amended (the “Securities Act”) and have no specific intent to engage in a merger or acquisition in the next 12 months.
Pursuant to the now-terminated Registration Statement on Form S-1 (File No. 333-211571), we offered on a continuous basis up to $1,000,000,000 in shares of our limited liability company interests. SC Distributors, LLC was the dealer manager for the primary offering. As of June 4, 2019, pursuant to our Registration Statement on Form S-3 (File No. 333-231960) we are offering a maximum of $10,000,000 in shares to our existing shareholders pursuant to the Dividend Reinvestment Plan (the “DRP”). Shares of the company’s limited liability company interests issued pursuant to the DRP are initially being offered at the price equal to the then-current offering price per each class of shares.
After the finalization of the September 30, 2020 net asset value, the current offering price of the Class P-I shares is $9.02 per share.
As of September 30, 2020, and December 31, 2019, our advisor owned 23,601 shares.
As of September 30, 2020, we had received subscriptions for and issued 61,651,167 of our shares (including shares issued under the DRP) for gross proceeds of $567,749,073 (before dealer-manager fees of $4,307,374 and selling commissions of $14,190,829 for net proceeds of $549,250,870). As of December 31, 2019, we had received subscriptions for and issued 50,190,331 of our shares (including shares issued under the DRP) for gross proceeds of $465,384,994 (before dealer-manager fees of $4,307,374 and selling commissions of $14,190,829 for net proceeds of $446,886,791).
General Market Overview for Solar and Wind Projects
The market for renewable energy projects, particularly Solar and Wind farms continues to be robust, driven by a combination of macro factors such as low interest rates, continued strong economic activity as well as mandates in a number of states requiring a transition to clean energy sources. As a result, GCM continues to find projects that it deems to be attractive for investment.
GCM invests in projects that have long-term contracts to sell electricity to off-takers that we consider to be credit-worthy and sound. While we generally make equity investments in those facilities, the contracted cash flows from our investments bear certain characteristics of fixed rate debt instruments. As interest rates have declined this year, we have seen changes in the discount rate assumptions around Solar and wind which have resulted in increased value of these assets in the market.
There is also what we believe to be a unique opportunity driven by scheduled changes in tax laws. For example, the Production Tax Credit (PTC), a tax benefit for investors in wind projects expired on December 31, 2019. The Investment Tax Credit (ITC), a tax benefit for investors in solar projects is scheduled to decline from its current 30% to 26% for 2020. While these two changes are prospective (meaning that they will not affect assets that have already received the tax benefits) they will impact the pricing of future transactions because there will be less tax equity participation in those future deals. As a result, there is a tremendous amount of development activity this year as well as certain efforts to “safe harbor” projects so that they will qualify for the maximum tax benefits. As a buyer of these types of projects, GCM has experienced tremendous growth in our potential investment pipeline which we anticipate continuing through the end of 2020 at least.
Current Competition in the Alternative Energy - Solar Marketplace
The solar financing market started as a cottage industry where developers would bring together high net worth investors to fund single solar and wind transactions. Though successful in jump starting the industry, true capital formation is a relatively new phenomenon and is not as well developed as in other asset classes. Currently in the alternative energy — solar marketplace, there are several sources of capital:
| ● | Developer/Owner Operators. The major competition we face in the market for the assets we target comes from privately backed developer/owner operators. The capital from these organizations has generally been sourced from a combination of family offices/private equity funds and hedge funds. These organizations are generally set up as developers, with investment return expectations in the 20-30% range.
However, to facilitate the most favorable exit for the sponsors, the developer/owner operators seek to accumulate a significant portfolio of operating assets to provide a base level of stable and predictable earnings for the enterprise. Through a combination of developer profits and leverage they can generate satisfactory ongoing returns with the bulk of the upside being generated for the sponsors through the exit. Particularly in circumstances where equity markets experience a downturn, we are of the opinion this group of buyers will ultimately be capital constrained. |
41
| ● | Single Purpose Limited Partnerships. These entities are typically funded by high net worth individuals or family offices and are generally focused on a small number of deals as they have a limited amount of capital to invest. |
| ● | Utilities. Institutional investors including large life insurance companies, pension funds and infrastructure funds. This sector dominates investment in the larger projects (i.e. $100,000,000 or greater). We tend not to encounter this group in the markets we target because scale is always an important consideration for larger institutions. |
In management’s view, the company has been competitive in bidding for solar assets against all these sources of capital and maintains a significant pipeline of deals which can be consummated as offering proceeds are raised.
Opportunities in Solar Power Today
We believe that the greatest opportunity exists within the Small Utility Scale, Commercial Solar and Community Solar segments of the market. In the Small Utility Scale market, the company can buy assets with similar commercial attributes to the Large Utility Scale projects—Investment Grade off-taker, same equipment and warranties, same operations and maintenance service provider —but where returns are higher.
We have also noted a growing trend among U.S. corporations, to work with developers and financiers to provide renewable power for their operations. Driven by a desire to save money, create certainty around long term electricity prices and support Green marketing initiatives, the Commercial and Industrial (C&I) segment is rapidly becoming one of the most exciting parts of the renewable energy project market. These deals tend to be smaller than Utility Scale solar which fits well with our strategy of focusing on the lower middle market segment of the industry.
A number of U.S. States have adopted programs that encourage the development of Community Solar Projects where groups of companies, municipalities and individuals can buy renewable power from solar and wind plants that are located within the customers utility zone. While there are certain complexities associated with such projects, we are closely monitoring the rapid growth of this segment.
In our view, there is a significant opportunity to aggregate portfolios of high-quality Small Utility Scale, Commercial Solar and Community Solar projects working with experienced developers looking for a reliable and sustainable source of capital to increase the certainty of them closing transactions. As a result, we have been focusing on building relationships with respected developers with a view to acquiring pipelines of projects rather than one-off deals.
By working closely with developers to efficiently close their transactions, we are seeking to create a sustainable competitive advantage which will lead to recurring and consistent deal flow. Importantly our strategy is differentiated from the developer/owner operators mentioned above because we do not seek to compete with the developers. Rather, we work with developers so that they can focus their activities on development while we focus on the financing and long-term ownership of their developments. This alignment of interests is mutually beneficial and symbiotic.
Current Competition in the Alternative Energy — Wind Marketplace
Growth in the Wind Project Market was strong in 2019 and continued in the middle of 2020. According to the American Wind Energy Association’s (AWEA) Wind Powers America Second Quarter 2020 Report, the U.S. wind industry installed 2,546 MW of new wind power capacity in the second quarter of 2020, the highest second quarter on record. Additionally, for the first half of 2020, additions totaled 4,367 MW, also marking the highest first half for installations. For the full year ended December 31, 2019, the industry commissioned 9,143 MW in wind power capacity which is an increase of 20.5% over the year ended December 31, 2018. According to the Energy Information Administration (the “EIA”), wind power has surpassed hydropower as the U.S. grid’s largest source of renewable electricity in 2019. As a result, we continue to see good investment opportunities in the Wind Project Market.
| ● | The EIA reported 10 gigawatts of wind additions in 2019, and projects a record additional 18.5 gigawatts to come online in 2020. If achieved, wind power will surpass the record level of wind capacity annual increase of 13.2 gigawatts from 2012. |
| ● | Renewable portfolio standards are expected to continue to drive development in the wind sector particularly in the Northeast U.S. and California. |
Thus, current market conditions remain favorable for additional wind development in 2020. Particularly for smaller middle market transactions involving assets similar to those in our current portfolio, we believe that we will continue to be competitive in bidding for wind assets. We also believe that we may see opportunities to purchase operating wind assets which have run through their tax credits.
Opportunities in Wind Today
We believe that the middle market segment presents the best opportunities for investment. This sector faces less competition for assets than the large utility scale sector, which tends to be fully banked. Furthermore, we believe that targeted investments in select wind opportunities provides us with increased diversification of cash flows stemming from the fact that wind assets tend to perform better in the winter months while solar tends to perform better in the summer months.
42
We believe that this countercyclical diversification is highly beneficial in managing our cashflows throughout the year. We also believe that we are well positioned to find investable assets in this sector given our track record of purchasing five wind portfolios of this size range over the past four years. These purchases have enabled us to build relationships with respected developers who we may be able to work with in the near future.
General Market Overview for Battery Storage
Battery storage systems are becoming an increasingly important part of the energy mix within the United States. According to the EIA:
“In 2010, 7 battery storage systems accounted for only 59 megawatts (MW) of power capacity, the maximum amount of power output a battery can provide in any instant, in the United States. By 2015, 49 systems accounted for 351 MW of power capacity. This growth continued at an increased rate for the next three years, and the total number of operational battery storage systems has more than doubled to 125 for a total of 869 MW of installed power capacity as of the end of 2018.”
Battery storage system growth has been largely driven by rapidly falling costs as well as state mandates which have driven utilities to begin integrating these systems into their energy mixes. The National Renewable Energy Lab has estimated that the installed cost of Battery Electric Storage (BES) systems will fall from around $400 per kWh in 2019 to just above $200 per kWh in 2030. This rapidly falling price will be a key driver in the propagation of such systems throughout the power grid as such systems will be required to accommodate larger and larger percentages of intermittent energy systems such as solar and wind. This transition will drive combined renewable and storage systems towards parity with baseload generation systems but without the accompanying emissions and other externalities.
Due to its potential for rapid growth, we believe that battery storage represents a large and growing investment opportunity for the foreseeable future.
Factors Impacting Our Operating Results
The results of our operations are affected by a number of factors and will primarily depend on, among other things, the supply of renewable energy assets in the marketplace, the revenues we receive from renewable energy and energy efficiency projects and businesses, the market price of electricity, the availability of government incentives, local, regional and national economies, general market conditions, and the amount of our assets that are operating versus those that are non-operating because they are currently under construction. Additionally, our operations are impacted by interest rates and the cost of financing provided by other financial market participants. Many of the factors that affect our operating results are beyond our control.
Size of portfolio. The size of our portfolio of investments is a key revenue driver. Generally, as the size of our portfolio grows, the amount of income we receive will increase. In addition, our portfolio of investments may grow at an uneven pace as opportunities to make investments in our target assets may be irregularly timed, and the timing and extent of GCM’s success in identifying such assets, and our success in acquiring such assets, cannot be predicted. Lastly, other than management fees, most of our expenses are of a fixed nature. Therefore, expenses as a percentage of net assets are reduced as the net assets of the company increase.
Pre-operational and non-earning assets. The increasing amount of pre-operational and non-earning assets (defined as deposits and other cash investments not currently generating an investment return) in our portfolio is a significant factor in our revenue and net asset value. The amount of cash invested in these pre-operational and non-earning assets reduces investment income until (1) the asset reaches commercial operation date or (2) otherwise begins generating an investment return and commences regular distributions to the company. We believe these assets, once operational or income generating, will provide returns consistent with the company’s investment strategy.
Credit risk. We encounter credit risk relating to: (1) counterparties to the electricity and environmental credit sales agreements (including PPAs) for our projects; (2) counterparties responsible for project construction and hedging arrangements; (3) companies in which we may invest; and (4) any potential debt financing we or our projects may obtain. We seek to mitigate credit risk by entering into contracts with high quality counterparties. However, it is still possible that these counterparties may be unable to fulfill their contractual obligations to us.
If counterparties to the electricity sales agreements for our projects or the companies in which we invest are unable to make payments to us when due, or at all, our financial condition and results of operations could be materially adversely affected. While we seek to mitigate construction-related credit risk by entering into contracts with high quality EPC companies with appropriate bonding and insurance capacity, if EPCs to the construction agreements for our projects are unable to fulfill their contractual obligations to us, our financial condition and results of operation could be materially adversely affected. We seek to mitigate credit risk by deploying a comprehensive review and asset selection process, including worst case analysis, and careful ongoing monitoring of acquired assets as well as mitigation of negative credit effects through back up planning. Nevertheless, unanticipated credit losses may occur which could adversely impact our operating results.
43
Electricity prices. All our projects benefit from take-or-pay agreements with terms structured to take 100% of the power output. On average, the contracts in our existing portfolio have approximately 16 years remaining prior to exposure to market prices. The credit standing of the contract counterparty is a particular focus in situations where the contracts have a price escalator. Escalating contracts create an incentive for the counterparty to not continue to perform if the contract pricing deviates materially from the market price. If the contract is with a public or investment grade entity, we have generally been confident that the contract terms will be honored. The only exception might apply in situations where rising electricity prices could create pressure around a political change at the state or local level.
Due to the take-or-pay nature of the contracts, we believe that the company is largely insulated from the daily volatility of the electricity market prices. Nevertheless, we monitor these markets to stay abreast of developments in the industry as they occur. Over recent years, we have seen a lot of volatility in gas prices. However, that volatility has been slow to translate into movements in the electricity prices.
Electricity pricing is a function of a range of factors. The price of gas is just one component. Electricity prices also include: (1) a recovery of the cost of the generation plant; (2) the labor to operate it; (3) the cost to transport the fuel to the plant; (4) the cost to wheel the power to the customer; and (5) the cost to administer the utility. Thus, gas price volatility is less impactful on the delivered price of electricity than one might expect.
The U.S. Energy Information Agency of the Department of Energy anticipates that electricity prices will rise annually by between 2.5% and 3.0% nationally for the next 20 years (on a nominal basis). Assuming the price at which we sell the power under our contracts is set at a discount to the current electricity price and the escalator (to the extent there is one) is less than 2.5% per annum, we expect the contracted price will remain close to, if not below, the market price of the electricity throughout the entire term of the contract.
Changes in market interest rates. To the extent that we use debt financing with unhedged floating interest rates, or in the case of any refinancing, general increases in interest rates over time may cause the interest expense associated with our borrowings to increase. This would decrease the value of our debt investments. Conversely, general decreases in interest rates over time may cause the interest expense associated with our borrowings to decrease and the value of our debt investments to increase.
Market conditions. We believe that demand for alternative forms of energy from traditional fossil-fuel energy will continue to grow as countries seek to reduce their dependence on outside sources of energy and as the political and social climate continues to demand social responsibility on environmental matters. Notwithstanding this growing demand, particularly with respect to small and mid-sized projects and businesses that are newly developed, we believe that a significant shortage of capital currently exists in the market to satisfy the demands of the renewable energy sector in the United States and around the world.
Many of the traditional sources of equity capital for the renewable energy marketplace were attracted to renewable energy projects based on their ability to utilize ITCs and tax deductions. We believe that due to changes in their taxable income profiles that have made these tax incentives less valuable, these traditional sources of equity capital have withdrawn from the market. In addition, much of the capital that is available is focused on larger projects that have long-term off-take contracts in place and does not allow project owners to take any “merchant” or investment risk with respect to RECs. We believe many project developers are not finding or are encountering delays in accessing capital for their projects. As a result, we believe a significant opportunity exists for us to provide new forms of capital to meet this demand.
Regulatory matters. Regulatory and tax policy at the federal and state levels tends to be forward looking rather than retrospective. As a result, we do not see many regulatory or tax issues impacting any assets we already own or buy during the operation of a particular regulatory or tax regime.
44
Future changes, which could impact the returns on future transactions, will be factored into our buying decisions. In the past, we have seen government policy drive a lot of development activity. For example, when the government announces the phasing out of a tax incentive, developers race to get projects to a stage that ensures the project qualifies for the incentive. Policy driven activity is generally short lived but can skew the investment supply and demand dynamic.
From the federal perspective, changes in tax and regulatory policy could negatively affect prospective returns. Federal tax incentives are comprised of MACRS depreciation and the ITC. MACRS results in accelerated depreciation of renewable assets over a 5.5-year period. Given the wide application of MACRS to other asset classes, we believe it is less susceptible to change than the ITC. The ITC is a tax incentive that allows an investor to take up to 30% of the installed cost of a solar system as a federal tax credit. This rule was extended at the end of 2015 with the credit amounts incrementally lowered over the next few years from 30% in 2016 to 10% in 2022 and beyond.
Other kinds of regulatory changes that could negatively impact returns include the introduction of some kind of value added tax either at the federal or state level, changes to property tax regimes, or any kind of targeted tax on the income of renewable energy generation assets. None of these possible changes appear likely any time soon but it is impossible to predict the future with any real certainty.
Generally, the policy changes that have occurred over the past decade at the U.S. Environmental Protection Agency and U.S. Department of Energy have been very positive for renewables: stronger emission regulations and other mandates improving the case for renewable energy assets. While the current U.S. administration has indicated greater support for traditional sources of energy and the potential reduction in support for alternative energy production, we believe that any changes enacted by the current U.S. administration will not have a material impact on our operations. In addition, in 2018, the U.S. imposed tariffs on photovoltaic (“PV”) panels imported to the U.S. that could have an impact on overall U.S. demand.
The regulatory market for electric power is highly fragmented with each state having significant influence over the functioning of its respective market. The states are the primary regulator for the utilities, and they have implemented widely divergent policies at the state level. For example, some states allow utilities to be vertically integrated: producers of power as well as operators of the grid. Other states have separated those functions entirely.
We believe that this market diversity is a benefit for our program. States have been highly adept at advancing programs designed to benefit renewable energy with or without federal government support. There are currently 29 states that have developed a renewable portfolio standard. As a result, we see state regulatory issues as a shifting mosaic of opportunities where some markets will present opportunities while others become less attractive on a prospective basis.
COVID-19 Impact
In March of 2020, the United States declared a National Emergency concerning the COVID-19 outbreak. This came after the World Health Organization (“WHO”) declared the virus a global pandemic on March 11, 2020.
Since the outbreak of COVID-19 in the United States, the company has generally been able to conduct its business despite the turmoil in markets and the shuttering of many businesses across the country. We have and will continue to assess the current and future business risks related to COVID-19 as new information becomes available, including any potential performance risk of our counterparties. As of the date of the filing we are not aware of any material adverse impact to our financial results.
Critical Accounting Policies and Use of Estimates
The following discussion addresses the accounting policies utilized based on our current operations. Our most critical accounting policies involve decisions and assessments that affect our reported assets and liabilities, as well as our reported revenues and expenses. We believe that all the decisions and assessments upon which our consolidated financial statements are based are reasonable at the time made and based upon information available to us at that time. Our critical accounting policies and accounting estimates may be expanded over time as we continue to implement our business and operating strategy. The material accounting policies and estimates that are most critical to an investor’s understanding of our financial results and condition, as well as those that require complex judgment decisions by our management, are discussed below.
45
Basis of Presentation
Our consolidated financial statements are prepared in accordance with U.S. generally accepted accounting principles (“GAAP”) which requires the use of estimates, assumptions, and the exercise of subjective judgment as to future uncertainties.
Although we are organized and intend to conduct our business in a manner so that we are not required to register as an investment company under the Investment Company Act, our consolidated financial statements are prepared using the specialized accounting principles of Accounting Standards Codification Topic 946, Financial Services — Investment Companies (“ASC Topic 946”). Overall, we believe that the use of investment company accounting makes our consolidated financial statements more useful to investors and other financial statement users since it allows a more appropriate basis of comparison to other entities with similar investment objectives.
Basis of Consolidation
As provided under Regulation S-X and ASC Topic 946, the company will generally not consolidate its investment in a company other than a wholly-owned investment company or controlled operating company whose business consists of providing services to the company. Accordingly, the company consolidated the accounts of its wholly-owned subsidiaries in its consolidated financial statements. All significant intercompany balances and transactions have been eliminated in consolidation.
Investment Classification
We classify our investments by level of control. “Control Investments” are investments in companies in which we own 25% or more of the voting securities of such company, have greater than 50% representation on such company’s board of directors, or that are limited liability companies for which we are the managing member. “Affiliate Investments” are investments in companies in which we own 5% or more and less than 25% of the voting securities of such company. “Non-Control/Non-Affiliate Investments” are investments that are neither Control Investments nor Affiliate Investments. Because our consolidated financial statements are prepared in accordance with ASC Topic 946, we do not consolidate companies in which we have Control Investments, nor do we apply the equity method of accounting to our Control Investments or Affiliate Investments.
Valuation of Investments
Our advisor, in conjunction with an independent valuation firm when necessary, subject to the review and approval of the board of directors, is ultimately responsible for the determination, in good faith, of the fair value of investments. In that regard, the advisor has established policies and procedures which have been reviewed and approved by our board of directors, to estimate the fair value of our investments which are detailed below. Any changes to these policies and procedures are required to be approved by our board of directors, including a majority of our independent directors.
Investments for which market quotations are readily available are valued at such market quotations.
For most of our investments, market quotations will not be available. With respect to investments for which market quotations are not readily available, our board of directors has approved a multi-step valuation process each fiscal quarter, as described below:
| 1. | each investment will be valued by GCM. As part of the valuation process, GCM will prepare the valuations and associated supporting materials for review and approval by the board of directors; |
| 2. | our board of directors has approved the selection of an independent valuation firm to assist with the review of the valuations prepared by GCM. At the direction of our board of directors, the independent valuation firm will review valuations prepared by GCM for the appropriate application of its valuation policies and the appropriateness of significant inputs used in the valuation models by performing certain limited procedures, which will include a review of GCM’s estimates of fair value for each investment and providing an opinion that GCM’s estimate of fair value for each investment is reasonable. The independent valuation firm may also provide direct assistance to GCM in preparing fair value estimates if the board of directors approves such assistance. In the event that the independent valuation firm is directly involved in preparing the fair value estimate, our board of directors has the authority to hire a separate valuation firm to review that opinion of value; |
| 3. | the audit committee of our board of directors reviews and discusses the preliminary valuation prepared by GCM and the report of the independent valuation firm, if any; and |
| 4. | our board of directors reviews the valuations and approves the fair value of each investment in our portfolio in good faith by GCM. |
46
Loan investments are valued utilizing a market approach, an income approach, or both approaches, as appropriate. The market approach uses prices and other relevant information generated by market transactions involving identical or comparable assets or liabilities. The income approach uses valuation techniques to convert future amounts (for example, interest and amortization payments) to a single present value amount (discounted) calculated based on an appropriate discount rate. The measurement is based on the net present value using current market expectations about those future amounts. In following these approaches, the types of factors that we may take into account in determining the fair value of our loans include as applicable: debt covenants, call protection provisions, information rights, the nature and realizable value of any collateral, the project’s ability to make payments, its earnings and discounted cash flows, the markets in which the project does business, comparisons of financial ratios of peer business entities that are public, mergers and acquisitions comparables, the principal market and enterprise values, among other factors.
Equity investments are also valued utilizing a market approach, an income approach, or both approaches, as appropriate. The market approach uses prices and other relevant information generated by market transactions involving identical or comparable assets or liabilities. The income approach uses valuation techniques to convert future amounts (for example net cash flows or earnings) to a single present value amount (discounted) calculated based on an appropriate discount rate. The measurement is based on the net present value using current market expectations about those future amounts. Beginning in Q2 2020 the advisor evaluates the eligibility of pre-operational assets to utilize the income approach versus cost approach as an approximation of fair value. Qualified assets under construction must be targeted for completion within the next 1-6 months following the reporting period and have minimal remaining exposure to valuation adjustments.
In following these approaches, the types of factors that we may take into account in determining the fair value of our equity investments include, as applicable: available current market data, including relevant and applicable market trading and transaction comparables, applicable market yields and multiples, security covenants, the project’s earnings and discounted cash flows, the markets in which the project does business, comparisons of financial ratios of peer business entities that are public, mergers and acquisitions comparables, the principal market and enterprise values, among other factors.
OTC derivatives including swap contracts are valued daily using observable inputs, such as quotations provided by an independent pricing service, the counterparty, broker-dealers, whenever available and considered reliable.
We have adopted Accounting Standards Codification Topic 820, Fair Value Measurement (“ASC Topic 820”), which defines fair value, establishes a framework for measuring fair value in accordance with GAAP and expands disclosures about fair value measurements.
ASC Topic 820 clarifies that the fair value price is the price in an orderly transaction between market participants to sell an asset or transfer a liability in the market in which the reporting entity would transact for the asset or liability, that is, the principal or most advantageous market for the asset or liability. The transaction to sell the asset or transfer the liability is a hypothetical transaction at the measurement date, considered from the perspective of a market participant that holds the asset or owes the liability. ASC Topic 820 provides a consistent definition of fair value which focuses on exit price and prioritizes, within a measurement of fair value, the use of market-based inputs over entity-specific inputs. In addition, ASC Topic 820 provides a framework for measuring fair value and establishes a three-level hierarchy for fair value measurements based upon the transparency of inputs to the valuation of an asset or liability as of the measurement date. The three levels of valuation hierarchy established by ASC Topic 820 are defined as follows:
Level 1: Unadjusted quoted prices for identical assets or liabilities in active markets.
Level 2: Other significant observable inputs that are sourced either directly or indirectly from publications or pricing services, including dealer or broker markets, for identical or comparable assets or liabilities. Generally, these inputs should be widely accepted and public, non-proprietary and sourced from an independent third party.
Level 3: Inputs derived from a significant amount of unobservable market data and derived primarily through the use of internal valuation methodologies.
47
In all cases, the level in the fair value hierarchy within which the fair value measurement in its entirety falls will be determined based on the lowest level of input that is significant to the fair value measurement. Our assessment of the significance of a particular input to the fair value measurement in its entirety requires judgement and considers factors specific to each investment.
Our board of directors has approved the selection of an independent valuation firm to review our advisor’s valuation methodology and to work with our advisor and officers to provide additional inputs for consideration by our audit committee and to work directly with our full board of directors, at the board of directors’ request, with respect to the fair value of investments. For example, our board of directors may determine to engage more than one independent valuation firm in circumstances in which specific expertise of a particular asset or asset class is needed in connection with the valuation of an investment. In addition, GCM will recommend to our board of directors that one quarter of our investments be valued by an independent valuation firm each quarter, on a rotating quarterly basis. Accordingly, each such investment would be reviewed by an independent valuation firm at least once per year.
Our board of directors will have the ability to review our advisor’s valuation methodologies each quarter in connection with GCM’s presentation of its valuation recommendations to the audit committee. If during the period between quarterly board meetings, GCM determines that significant changes have occurred since the prior meeting of the board of directors at which it presented its recommendations on the valuation methodology, then GCM will also prepare and present recommendations to the audit committee of the board of directors of its proposed changes to the current valuation methodology. Any such changes to our valuation methodologies will require the approval of our board of directors, including a majority of our independent directors. We will disclose any change in our valuation methodologies, or any change in our investment criteria or strategies, that would constitute a fundamental change in a registration statement amendment prior to its implementation.
Foreign Currency Translation
The accounting records of the company are maintained in U.S. Dollars. The fair value of investments and other assets and liabilities denominated in non-U.S. currencies are translated into U.S. Dollars using the exchange rate at 4:00 p.m., Eastern Time, at each quarter end. Amounts related to the purchases and sales of investments, investment income and expenses are translated at the rates of exchange prevailing on the respective dates of such transactions.
Net unrealized currency gains and losses arising from valuing foreign currency-denominated assets and liabilities at the current exchange rate are reflected separately as unrealized appreciation/depreciation on translation of assets and liabilities denominated in foreign currencies.
Foreign security and currency translations may involve certain considerations and risks not typically associated with investing in U.S. companies and U.S. government securities. These risks include, but are not limited to, currency fluctuations and revaluations and future adverse political, social and economic developments, which could cause investments in foreign markets to be less liquid and prices more volatile than those of comparable U.S. companies or U.S. government securities.
Calculation of Net Asset Value
We calculate our net asset value per share by subtracting all liabilities from the total carrying amount of our assets, which includes the fair value of our investments, and dividing the result by the total number of outstanding shares on the date of valuation. For purposes of calculating our net asset value, we expect to carry all liabilities at cost.
The determination of the fair value of our investments requires judgment, especially with respect to investments for which market quotations are not available. For most of our investments, market quotations will not be available. Due to the inherent uncertainty of determining the fair value of investments that do not have a readily available market value, the fair value of the investments may differ significantly from the values that would have been used had a readily available market value existed for such investments, and the differences could be material. Because the calculation of our net asset value is based, in part, on the fair value of our investments as determined by our advisor, which is an affiliated entity of the company, our calculation of net asset value is to a degree subjective and could be adversely affected if the determinations regarding the fair value of our investments were materially higher than the values that we ultimately realize upon the disposal of such investments. Furthermore, the fair value of our investments, as reviewed and approved by our board of directors, may be materially different from the valuation as determined by an independent valuation firm.
48
Revenue Recognition
We record interest income on an accrual basis to the extent that we expect to collect such amounts. We do not accrue as a receivable interest on loans and debt securities for accounting purposes if we have reason to doubt our ability to collect such interest. Original issue discounts, market discounts or premiums are accreted or amortized using the effective interest method as interest income. We record prepayment premiums on loans and debt securities as interest income. Any application, origination or other fees earned by the company in arranging or issuing debt are amortized over the expected term of the loan.
We place loans on non-accrual status when principal and interest are past due 90 days or more or when there is a reasonable doubt that we will collect principal or interest. Accrued interest is generally reversed when a loan is placed on non-accrual. Interest payments received on non-accrual loans may be recognized as income or applied to principal depending upon management’s judgment. Non-accrual loans are generally restored to accrual status when past due and principal and interest is paid and, in our management’s judgment, is likely to remain current.
Dividend income is recorded when dividends are declared and determined that collection is probable. The timing and amount of dividend income is determined on at least a quarterly basis by GREC. This process includes an analysis at the individual project company level based on cash available from operations and working capital ratios needed for the project company daily operations. Dividend income from our privately held, equity investments are recognized when approved. Dividends received from the company’s private investments, which generally reflect net cash flow from operations, are declared, accrued and paid on a quarterly basis at a minimum. The proceeds related to the dividend receivable amount of $1,726,189 are presented on the Consolidated Statements of Assets and Liabilities as of September 30, 2020.
Net Realized Gains or Losses and Net Change in Unrealized Appreciation or Depreciation on Investments
We measure realized gains or losses by the difference between the net proceeds from the sale, repayment, or disposal of an asset and the adjusted cost basis of the asset, without regard to unrealized appreciation or depreciation previously recognized. Net change in unrealized appreciation or depreciation will reflect the change in investment values during the reporting period, including any reversal of previously recorded unrealized appreciation or depreciation, when gains or losses are realized.
Organization Costs
Organization costs are expensed on the company’s consolidated statements of operations as incurred.
Offering Costs
Offering costs include all costs to be paid by the company in connection with the offering of its shares, including legal, accounting, printing, mailing and filing fees, transfer agent fees, due diligence expense reimbursements to participating broker-dealers included in detailed and itemized invoices and costs in connection with administrative oversight of the offering and marketing process, and preparing supplemental sales materials, holding educational conferences, and attending retail seminars conducted by broker-dealers. When recognized by the company, offering costs will be recognized as a reduction of the proceeds from the offering.
Deferred Sales Commissions
The company defers certain costs, principally sales commissions and related compensation, which are paid to the dealer manager and may be reallowed to financial advisors and broker/dealers in the future in connection with the sale of shares, sold with a reduced front-end load sales charge and a trail fee. The costs expected to be incurred at the time of the sale of these shares are recorded as a liability on date of sale and are amortized on a straight-line basis over the period beginning on the time of sale and ending on the earlier date of 1) then the maximum amount of sales commission and related compensation is reached under regulatory regulations or 2) the date which approximates an expected liquidity event for the company. As of September 30, 2020, and December 31, 2019, the company recorded a liability for deferred sales commissions in the amount of $170,155 and $56,483, respectively.
49
Financing Costs
Financing costs related to debt liabilities of the company, GREC or GREC HoldCo are presented on the Consolidated Statements of Assets and Liabilities as a direct deduction from the carrying amount of that debt liability. Financing costs are deferred and amortized using the straight-line method over the life of the debt liability.
Recently Adopted Accounting Pronouncements
In August 2018, the FASB issued ASU No. 2018-13, “Fair Value Measurement (Topic 820): Disclosure Framework—Changes to the Disclosure Requirements for Fair Value Measurement”, which modifies the disclosure requirements on fair value measurements. The new guidance is effective for fiscal years, and interim periods within those fiscal years, beginning after December 15, 2019 (fiscal 2020 for the company). Upon the effective date, certain provisions are to be applied prospectively, while others are to be applied retrospectively to all periods presented. An entity is permitted to early adopt any removed or modified disclosures upon issuance of this ASU and delay adoption of the additional disclosures until their effective date. We have adopted ASU 2018-13 on our consolidated financial statements and disclosures.
Recently Issued Accounting Pronouncements
In March 2020, the FASB issued ASU No. 2020-04, “Reference Rate Reform (Topic 848): Facilitation of the effects of Reference Rate Reform on Financial Reporting”, which provides companies with optional financial reporting alternatives to reduce the cost and complexity associated with the accounting for contracts and hedging relationships affected by reference rate reform. The amendments in this update is effective for all entities as of March 12, 2020 through December 31, 2022. An entity may elect to apply the amendments for contract as of any date from the beginning of an interim period that includes or is subsequent to March 12, 2020. As of September 30, 2020, we have not elected to apply the optional amendments and are currently evaluating the impact of the ASU and the effect on our consolidated financial statements.
JOBS Act
We qualify as an “emerging growth company” pursuant to the provisions of the JOBS Act, enacted on April 5, 2012. For as long as we are an “emerging growth company,” we may take advantage of certain exemptions from various reporting requirements that are applicable to other public companies that are not “emerging growth companies,” including, but not limited to, not being required to comply with the auditor attestation requirements of Section 404(b) of the Sarbanes-Oxley Act, reduced disclosure obligations regarding executive compensation in our periodic reports and proxy statements, and exemptions from the requirements of holding advisory “say-on-pay” votes on executive compensation and shareholder advisory votes on golden parachute compensation.
Under the JOBS Act, we will remain an “emerging growth company” until the earliest of:
| ● | the last day of the fiscal year during which we have total annual gross revenues of $1 billion or more; |
| ● | the last day of the fiscal year following the fifth anniversary of the completion of our offering, which occurred on March 29, 2019; |
| ● | the date on which we have, during the previous three-year period, issued more than $1 billion in non-convertible debt; and |
50
| ● | the date on which we are deemed to be a “large accelerated filer” under the Securities Exchange Act of 1934, as amended (the “Exchange Act”). We will qualify as a large accelerated filer as of the first day of the first fiscal year after we have: (1) more than $700,000,000 in outstanding common equity held by our non-affiliates as of the last day of our most recently completed second fiscal quarter; (2) been a public company for at least 12 months; and (3) filed at least one annual report with the SEC. The value of our outstanding common equity will be measured each year on the last day of our second fiscal quarter. |
The JOBS Act also provides that an “emerging growth company” can utilize the extended transition period provided in Section 7(a)(2)(B) of the Securities Act for complying with new or revised accounting standards. However, we are choosing to opt out of that extended transition period. We will comply with new or revised accounting standards on the relevant dates on which adoption of such standards is required for companies that are not “emerging growth companies.” Section 107 of the JOBS Act provides that our decision to opt out of the extended transition period for complying with new or revised accounting standards is irrevocable.
Amendments to the Operating Agreement Related to Incentive Allocations
On August 25, 2020, certain amendments to the Operating Agreement to remove the provisions therein related to the Income Incentive Distribution and the Capital Gains Incentive Distribution, in each case allocable to the Special Unitholder under certain circumstances, and to replace them with provisions for a performance participation fee (the “Performance Participation Fee”) based on the periodic total return generated by the Company, payable under certain circumstances by the Company to the Special Unitholder, was approved by the Company’s shareholders and was applied retroactively on April 1, 2020 and for all periods thereafter. The Liquidation Incentive Distribution provisions in the Operating Agreement was correspondingly amended to reflect that the Liquidation Incentive Distribution will be calculated based on the difference between the Company’s net proceeds from a liquidation or listing of our shares (in either case, as calculated in accordance with the Operating Agreement) and the company’s aggregate NAV immediately prior to the time of such liquidation or listing.
Portfolio and Investment Activity
As of September 30, 2020, the company invested in numerous solar, wind, biomass, battery storage, and energy efficiency projects included in 27 investment portfolios, as well as six secured loans, as follows:
Canadian Northern Lights Portfolio
The company owns a portfolio of 79 rooftop solar photovoltaic systems located within a 60-mile radius of Toronto, Ontario, Canada with a combined generation capacity of approximately 0.6 MW. Lease agreements are in place and the systems sell power directly to the local utility, Ontario Power Authority under their microFIT solar program at a fixed rate.
Conic Portfolio
Colorado CSG II, a major component of the Conic Portfolio, consists of 12 operational community solar projects located in Colorado with a combined generating capacity of approximately 23.1 MW. The Projects all reached commercial operations date between December 2018 and June 2019. The Projects are part of Xcel Energy’s Community Solar Garden program.
Sun Farm V & VI is also included within the Conic Portfolio and consists of two operating solar PV systems, 6.9 MW Sun Farm V and 7.0 MW Sun Farm VI, located in Perquimans County, North Carolina. The projects were placed in service in the fourth quarter of 2018 and sell power to large utility company through a 15-year fixed price PPA.
51
East to West Solar Portfolio
The company owns 11 operating solar power facilities comprising a total of 4.8 MW, located in the states of Colorado, Connecticut, Florida, Hawaii, Indiana and North Carolina (the “MP2” projects). These projects consist of ground and roof mounted solar systems (each, a “System”) located on municipal and commercial properties as follows:
| 1. | Denver International Airport – The Denver International Airport System has a generation capacity of 1.6 MW and is located in Denver, Colorado. The System sells power directly to the City and County of Denver Department of Aviation, under a 25-year fixed rate PPA. The System also sells SRECs directly to the local utility, Xcel Energy, under a 20-year contract. |
| 2. | SunSense I – The SunSense I System has a generation capacity of 0.5 MW and is located in Raleigh, North Carolina. The system sells power directly to the local utility, Duke Energy/Progress Energy Carolinas, Inc., under a 20-year fixed rate PPA. |
| 3. | SunSense II – The SunSense II System has a generation capacity of 0.5 MW and is located in Clayton, North Carolina. The system sells power directly to the local utility, Duke Energy/Progress Energy Carolinas, Inc., under a 20-year fixed rate PPA. |
| 4. | SunSense III – The SunSense III System has a generation capacity of 0.5 MW and is located in Fletcher, North Carolina. The system sells power directly to the local utility, Duke Energy/Progress Energy Carolinas, Inc. under a 20-year fixed rate PPA. |
| 5. | NIPSCO III – The NIPSCO “Turtle Top” System has a generation capacity of 0.4 MW and is located in New Paris, Indiana. The system sells power directly to the local utility, Northern Indiana Public Service Company (NIPSCO), under a 15-year escalating rate PPA. |
| 6. | OUC I – The OUC I System has a generation capacity of 0.4 MW and is located in Orlando, Florida. The system sells power directly to the local utility, Orlando Utilities Commission, under a 25-year fixed rate PPA. |
| 7. | KIUC – The KIUC System has a generation capacity of 0.4 MW and is located in Koloa, Hawaii. The system sells power directly to the local utility, the Kauai Island Utility Cooperative, under a 20-year fixed rate PPA. |
| 8. | TJ Maxx – The TJ Maxx System has a generation capacity of 0.2 MW and is located in Bloomfield, Connecticut. The system sells power directly to the H.G. Conn. Realty Corp under a 15-year escalating rate PPA. |
52
| 9. | Denver Public Schools (Green Valley) – The Green Valley System has a generation capacity of 0.1 MW and is located in Denver, Colorado. The system sells power directly to the Denver Public Schools under a 20-year escalating rate PPA. The System also sells SRECs directly to the local utility, Xcel Energy, under a 20-year fixed rate contract. |
| 10. | Denver Public Schools (Rachel B. Noel) – The Rachel B. Noel System has a generation capacity of 0.1 MW and is located in Denver, Colorado. The system sells power directly to the Denver Public Schools under a 20-year escalating rate PPA. The System also sells SRECs to the local utility, Xcel Energy, under a 20-year fixed rate contract. |
| 11. | Denver Public Schools (Greenwood) – The Greenwood System has a generation capacity of 0.1 MW and is located in Denver, Colorado. The system sells power directly to the Denver Public Schools under a 20-year escalating rate PPA. The System also sells SRECs directly to the local utility, Xcel Energy, under a 20-year fixed rate contract. |
Separately, the company owns two additional operating solar PV systems comprising a total of 2.1 MW, located in Gainesville, Florida (the “Gainesville Solar” facilities). Details of Gainesville Solar, which are included in the East to West Solar Portfolio, are as follows:
| 1. | MLH2 – The MLH2 System has a generation capacity of 1.0 MW and is located in Gainesville, Florida, on land owned by the company. The system sells power directly to the local utility, Gainesville Regional Utility, under a 20-year fixed rate PPA. |
| 2. | MLH3 – The MLH3 System has a generation capacity of 1.1 MW and is located in Gainesville, Florida. The system sells power directly to the local utility, Gainesville Regional Utility, under a 20-year fixed rate PPA. |
The company owns an operating solar PV system comprising a total of 1.3 MW, Person County Solar Park 2 (PCIP) located in Timberlake, North Carolina. The system sells power directly to the local utility, Duke Energy/Progress Energy under a 20-year escalating rate PPA.
In addition, the company owns Phelps 158 Solar Farm, LLC a solar photovoltaic system with capacity of approximately 6.7 MW that sells power to Dominion Energy. The project is located in Conway, North Carolina. Phelps 158 Solar Farm, LLC is included in the East to West Solar Portfolio.
Foresight Solar Portfolio
The Foresight Solar Portfolio is a 10.0 MW portfolio of operating solar projects located in California and Colorado. The portfolio consists of six operating ground mount systems between 0.5 MW and 2.0 MW which have been operational since Q3 2013 through Q4 2014.
Golden Horizons Portfolio
The Golden Horizons Portfolio consists of two operating solar photovoltaic PV systems comprising 7.8 MW located in North Palm Springs, California. The projects were placed in service during 2011 and sell power to California utility through a 20-year PPA.
Green Maple Portfolio
The company originally acquired nine solar power facilities in various locations in the state of Vermont, totaling 7.4 MW (the “Green Maple Portfolio”). In Q4 2019, an additional asset, Brattleboro, comprising 5.7 MW was purchased. A brief summary of each project is as follows:
| 1. | Charter Hill Solar – The Charter Hill System has a generation capacity of 1.1 MW and is located in Rutland, Vermont. The system sells power directly to the local utility, Green Mountain Power, under a 25-year fixed rate PPA. |
53
| 2. | Williamstown Solar – The Williamstown System has a generation capacity of 0.8 MW and is located in Williamstown, Vermont. The system sells power to a commercial off-taker under a 20-year fixed rate PPA. |
| 3. | GLC Chester Solar – The GLC Chester System has a generation capacity of 0.8 MW and is located in Chester Township, Vermont. The system sells power to various municipal off-takers under 20-year fixed rate PPAs. |
| 4. | Pittsford Solar – The Pittsford system has a generation capacity of 0.7 MW and is located in Pittsford Township, Vermont. The system sells power to various commercial off-takers under 20-year fixed rate PPAs. |
| 5. | Novus Royalton Solar – The Novus Royalton system has a generation capacity of 0.7 MW and is located in Royalton, Vermont. The system sells power to various municipal off-takers under 20-year fixed rate PPAs. |
| 6. | Proctor GLC Solar LLC – The Proctor GLC system has a generation capacity of 0.7 MW and is located in Proctor, Vermont. The system sells power to a municipal off-taker under a 20-year fixed rate PPA. |
| 7. | Hartford Solarfield LLC – The Hartford Solarfield system has a generation capacity of 0.7 MW and is located in Hartford, Vermont. The system sells power to a municipal off-taker under a 20-year fixed rate PPA. |
| 8. | 46 Precision Drive LLC – The 46 Precision Drive system has a generation capacity of 0.7 MW and is located in North Springfield, Vermont. The system sells power to a municipal off-taker under a 20-year fixed rate PPA. |
| 9. | City Garden Solar LLC – The City Garden system has a generation capacity of 1.2 MW and is located in Rutland, Vermont. The system sells power directly to the local utility, Green Mountain Power, under a 25-year fixed rate PPA. | |
| 10. | Brattleboro – Additionally, the company purchased a 5.7 MW portfolio solar project (“Brattleboro”). Brattleboro has been operating since July 2018. The project is located in Brattleboro, Vermont. The project is contracted for 20 years through a PPA with Windham Solid Waste Management District. |
Longleaf Portfolio
The company purchased and constructed a 21.8 MW portfolio of three solar projects (“Longleaf Portfolio”) located in Camden, Jamesville and Martin counties, North Carolina. All three facilities reached commercial operations during Q3 2019. The Longleaf Portfolio sells all power generated to an investment grade utility off-taker through a 15-year fixed price PPA.
Magnolia Sun Portfolio
| 1. | Powerhouse One — The company owns four solar facilities located in Tennessee, with a total generation capacity of 3.0 MW. The facilities consist of commercial grade, ground mounted solar systems located on leased property within a five-mile radius in Fayetteville, Tennessee. The systems sell power directly to two local utilities; Tennessee Valley Authority and Fayetteville Public Utilities under long term PPAs. |
| 2. | CaMa Solar — The company owns two solar facilities in California, and one in Massachusetts, with a total generation capacity of 0.6 MW. The California systems sell power to municipal off-takers; Santa Cruz City Schools, and Petaluma City Schools of Sonoma County, under long-term PPAs. The Massachusetts systems sells power to the WGBH Educational Foundation, located in Boston, under a long-term PPA. |
| 3. | SolaVerde — The company owns eleven solar facilities in Tennessee with a total capacity of 1.7 MW. Eight of the systems sell power directly to the local utility, Tennessee Valley Authority, under a long-term PPA. Three of the systems sell power to municipal off-takers. |
| 4. | HESP — In the first quarter of 2020, the company purchased an operating solar portfolio that consists of 7 assets that are located across New York, New Jersey, and Washington D.C. The HESP portfolio totals 6.9 MW and originally achieved commercial operations between Q4 2017 and Q1 2018. The projects sell power to credit worthy municipalities, schools, and corporate off-takers. | |
| 5. | Rockville — Lastly, the company purchased the managing member interest for a 6.3 MW portfolio of two utility scale solar projects (“Rockville Portfolio”). The Rockville Portfolio projects have been operating since 2014. The projects consist of 3.1 MW site ground-mounted project and a 3.2 MW roof-mounted project, both located in Indianapolis, Indiana. The projects are contracted for 15 years through PPAs with Indianapolis Power & Light. |
54
Midway III Portfolio
The Midway III portfolio, located in California, was operational as of September 6, 2018. It encompasses an approximate generation capacity of 26.0 MW, with all power sold to large utility company in California.
Six States Solar Portfolio
The company previously leased 13.0 MW of operating solar power facilities located on 27 sites in the states of Arizona, California, Colorado, Connecticut, Indiana, and North Carolina under a master lease agreement. During the remaining term of the lease, which is approximately 12 years, there is the potential for the company to purchase these assets directly upon agreement and consent of the parties, with over 82% of the contracted revenues from investment grade counterparties. During June 2018 the company acquired twelve solar systems comprising 4.6 MW that were previously leased. The Six States Solar Portfolio now consists of these 13 facilities plus the remaining fourteen facilities that continue to be leased along with the Floyd Road project noted below.
The owned Six States Solar Portfolio consists of 4.6 MW of ground and roof mounted solar units located on municipal and commercial properties generally described as follows:
| 1. | The Town of Newington — Newington Public Schools - Newington Public Schools (“Newington”). The Newington system has generation capacity of 0.2 MW and is located in the Town of Newington, Connecticut. The system sells power to the Town of Newington, which encompasses seven schools that serve approximately 4,200 students from kindergarten through 12th grade, which are accredited by the New England Association of Schools & Colleges. |
| 2. | Regional School Department — Northwestern Regional School District #7 — Northwestern Regional School District (“Northwestern”). The Northwestern system has generation capacity of 0.4 MW and is located in Winsted, Connecticut. The system sells power to the Northwestern Regional School District which serves the total Regional Community with emphasis on middle school and high school students. |
| 3. | City of Winters — The City of Winters (“Winters”). The Winters system has generation capacity of 0.3 MW and is located in Winters, California. The system sells power to the City of Winters which is part of the Sacramento-Arden-Arcade-Yuba City, California-Nevada region. |
| 4. | Adams State College — Adams State College (“Adams”). The Adams system has generation capacity of 0.3 MW and is located in Alamosa, Colorado. The system sells power to Adams State College, a state-supported liberal arts university established in 1921. Additionally, RECs are sold to the local utility, Xcel Energy |
| 5. | Sacramento County Water Agency — Sacramento County Water Agency (“SCWA”). The SCWA system has generation capacity of 0.9 MW and is located in Sacramento, California. The system sells power to the Sacramento County Waste Authority (“SCWA”) which was established in 1952 with the passage of the Sacramento County Water Agency Act and a commitment to providing safe and reliable drinking water to over 55,000 homes and businesses. Additionally, performance-based incentives are sold to the Sacramento Municipality Utility District (“SMUD”). |
| 6. | Tanque Verde School District — Tanque Verde School District (“TVSD”). The TVSD system is comprised of four systems located in Tucson, Arizona with a total generation capacity of 1.2 MW. The systems sell power to the TVSD, which encompasses four schools. Additionally, RECs are sold to the local utility, Tuscan Electric Power. |
| 7. | Northern Indiana Public Service Company — Northern Indiana Public Service Company (“NIPSCO”). The NIPSCO system comprised of three systems located in Goshen, Milford, and Topeka, Indiana with a total generation capacity of 1.3 MW. The systems sell power to NIPSCO, Indiana’s largest natural gas distributor and second-largest distributor of electricity serving more than one million customers. |
The leased Six States Solar Portfolio consists of approximately 8.4 MW of ground and roof mounted solar units located on municipal and commercial properties generally described as follows:
| 1. | South Adams County Water and Sanitation District — The South Adams County Water and Sanitation District (“South Adams”). The South Adams system has generation capacity of 0.2 MW and is located in Commerce City, Colorado. The system sells power under a long-term PPA to the South Adams County Water and Sanitation District, formed in 1953 under the State of Colorado Special District provisions to serve nearly 50,000 customers. Additionally, RECs are sold to the local utility, Xcel Energy. |
55
| 2. | Floyd Road Solar Portfolio — The Floyd Road Solar Portfolio (“Floyd Road”) – The Floyd Road system has generation capacity of 6.7 MW and is located in Gaston, North Carolina. The system sells power directly to the local utility, Dominion Energy, under a 15-year PPA. Additionally, RECs are sold to a third-party. The system achieved commercial operation in the second quarter of 2017. On July 14, 2017, the company sold Floyd Road for approximately $11,400,000 and leased the facility back for a period of 24 years. De Lage Landen Financial Services was the sale/leaseback entity. |
| 3. | Denver Public Schools — Denver Public Schools (“DPS”). The DPS system is comprised of 13 systems located in Denver, Colorado with a total generation capacity of 1.5 MW. The systems sell power to DPS, which encompasses 185 schools that serve 90,150 students. Additionally, RECs are sold to the local utility, Xcel Energy. |
Sunny Mountain Portfolio
The residential portion of the Sunny Mountain portfolio is comprised of twelve systems located across eight towns in Colorado with a total generation capacity of 0.1 MW while the commercial portion of the portfolio is comprised of nine systems located in Boulder and Broomfield, Colorado with a total generation capacity of 0.7 MW. The systems sell power to various commercial and municipal off-takers under long-term PPAs.
Trillium Portfolio
The Trillium portfolio consists primarily of operating and to-be-constructed commercial solar projects.
| 1. | In Q1 2020 the company included within the Trillium Portfolio, 10 operating solar projects, totaling 23.0 MW; seven of these assets were moved from the Citrine Portfolio. The projects are located across Arkansas, Colorado, Maryland, New Jersey, Vermont, and Washington D.C. The projects will sell their generated electricity to a variety of municipal, commercial, and utility grade off-takers through PPA contracts that range 15-28 years. All projects were operational as of Q2 2020. |
| 2. | In Q2 2020 a 3.8 MW commercial solar asset was added to the Trillium Portfolio. This project, Mid-River is located in Northampton County, Pennsylvania. It reached COD in Q3 2020 and has a 21-year PPA with an investment-grade off-taker. |
| 3. | In Q2 2020 an additional 19 assets comprising 68.9 MW of to-be-constructed commercial solar assets were added to Trillium; nine of these assets were moved from the Citrine Portfolio. The projects are located across nine states, California, Colorado, Maryland, Massachusetts, Michigan, North Carolina, New Jersey, Oregon, and Vermont. They were all set to achieve commercial operations in Q3 2020 and Q4 2020 and have secured PPA agreements ranging 13-25 years. |
| 4. | In Q3 2020 an additional nine assets comprising 41.5 MW of pre-operating and operational commercial solar assets and 1.2 MW of battery storage assets were added to the Trillium Portfolio, eight from the Citrine Portfolio and one from the Colorado CES Portfolio These projects are located across California, Colorado, and Vermont. They have secured PPA contracts that range from 20-25 years. The assets are expected to achieve commercial operations throughout Q3 2020 to Q1 2021. |
As of September 30, 2020, the company moved a total of 12 additional assets into the Trillium Portfolio, eight from the Citrine Portfolio and four from the Opal Portfolio. The assets have signed MIPAs but have not yet closed. Eleven of these assets are valued using the income approach to fair value, and one is valued using the cost approach to fair value.
With the inclusion of owned and leased assets, the company owns and/or operates approximately 138.4 MW of commercial solar power facilities throughout the United States as of September 30, 2020.
Greenbacker Wind — California Portfolio
Wagner Wind, purchased on December 26, 2017, is a 6.0 MW project located in Riverside, California that sells power directly to the City of Riverside California under a 15-year escalating rate PPA. The project consists of two 3.0 MW Vestas V90 turbines. The project was originally placed in service in the fourth quarter of 2012.
GB Wind HoldCo Portfolio
The GB Wind HoldCo Portfolio is comprised of the following four projects, Fossil Gulch Wind Park (Wind – Idaho), Georgia Mountain Community Wind (Wind – Vermont), Elk & Hawkeye (Wind – Iowa) and Community Wind South (Wind – Minnesota).
56
| 1. | Wind – Idaho- The company acquired this 10.5 MW project located in Hagerman, Idaho, which sells power directly to the local public utility, Idaho Power Company, under a 20-year escalating PPA. Additionally, RECs are sold to a third party under a fixed-rate contract. The facility originally commenced operations in the third quarter of 2005, and it has been operated continuously since that date. |
| 2. | Wind – Vermont. This 10.0 MW project was purchased in December 2017, and is located in Mendon, Vermont that sells power directly to the City of Burlington Electric Department under a 25-year escalating rate PPA. The project consists of four 2.5 MW Goldwind turbines. The project was originally placed in service in the fourth quarter of 2012. |
| 3. | Wind – Iowa. In Q1 2020, the company acquired an interest in two operating wind projects, Elk and Hawkeye. Elk is a 42.5 MW operating wind farm located in Delaware County, Iowa, and Hawkeye is a 37.5 MW operating wind farm located in Fayette County, Iowa. Elk and Hawkeye reached their COD in 2011 and 2012, respectively, and originally secured 20 and 25-year busbar PPA with an investment-grade utility. This acquisition has received regulatory approval in December 2019 and closed in January of 2020. |
| 4. | Wind – Minnesota. In August 2019, the company acquired an interest in Community Wind South, a 30.8 MW operating wind farm located in Nobles County, Minnesota (“CWS”). The project reached Commercial Operations (“COD”) in December 2012 and has 20-year busbar power and REC contracts with Northern States Power (A2/A-), a wholly owned subsidiary of Xcel Energy. |
Greenbacker Wind — Massachusetts
In May 2019, the company entered into a short-term secured loan agreement with Holiday Hill Community Wind, LLC. In Q4 of 2019, the loan was settled and the underlying asset, Holiday Hill Community Wind was purchased. The 5.0 MW project is in Massachusetts and sells power to Russel Municipal Light Department through a 25-year PPA contract. Additionally, RECs are sold to Chicopee Municipal Lighting Plant, and City of Westfield Gas & Electric Department.
Greenbacker Wind — Montana Portfolio
The Fairfield Wind Project is a 10.0 MW facility located in Teton County, Montana. The project sells power to NorthWestern Energy under a 20-year fixed-rate PPA. Additionally, RECs are sold to NorthWestern Energy under an escalating capped fixed-rate contract. The facility originally commenced operations in the second quarter of 2014.
The Greenfield Wind Project is a 25.0 MW facility located in Teton County, Montana. The project sells power to NorthWestern Energy under a 25-year fixed-rate PPA, which includes the sale of RECs. The facility originally commenced operation in the fourth quarter of 2016.
The company currently operates approximately 177.3 MW of operating wind power facilities throughout the United States.
EVCE Biomass Portfolio
The EVCE Biomass Portfolio is currently comprised of an operating 12.0 MW biomass facility located in Gypsum, Colorado.
The company currently operates approximately 12.0 MW of biomass generation: an operating biomass facility in Colorado.
Pacifica Portfolio
The original Pacifica Portfolio was a 7.9 MW portfolio, comprised of 16 operating, and to-be-constructed battery energy storage facilities located in California. The original 16 assets were acquired in Q2 2020.
In Q3 2020 an additional 20 projects also located in California were acquired, comprising an additional 10.0 MW of battery storage assets. The facilities are contracted to sell power to commercial offtakers for a 10-year term. This transaction resulted in contingent consideration recorded of $2,308,871 as of September 30, 2020, in payable for investments purchased on the Consolidated Statements of Assets and Liabilities and investments in controlled/affiliated portfolios, at fair value on the Consolidated Statements of Assets and Liabilities.
The company currently owns approximately 17.9 MW of battery storage assets throughout the United States.
Citrine Portfolio
The Citrine Portfolio consists of costs associated with approximately 54.3 MW to-be-constructed solar projects located in California and New York. The projects are expected to be placed in service throughout 2021. As of September 30, 2020, 32 projects were moved from Citrine to Trillium as these investments transitioned valuation methodology from the cost approach to the income approach to fair value. For further detail on these assets, please refer to the Trillium Portfolio breakdown above.
57
SE Solar 2019 Portfolio
SE Solar 2019 Portfolio is comprised of 14.4 MW of solar projects located in North Carolina. The Portfolio is expected to reach commercial operations in late 2020.
Turquoise Solar Portfolio
The company purchased Turquoise Nevada LLC (“Turquoise Solar”), a to-be-constructed 61.2 MW solar project located in Washoe County, Nevada. Turquoise Solar started construction during 2019 and is set to achieve commercial operations in Q4 2020. Once operational, Turquoise Nevada will sell 100% of generated electricity through a 25-year fixed-price PPA with a large regulated utility.
Greenbacker Wind Portfolio - Maine
In March 2020, the company purchased a 15.3 MW to-be-constructed wind farm located in Roxbury, Maine. The project began construction in 2020 and is expected to reach commercial operations in Q3 2021.The project will sell power under a 20-year PPA with four investment grade, local municipal light departments.
The company has under contract approximately 145.2 MW of pre-operational assets related to future commercial solar and wind power facilities throughout the United States that are expected to become operational in 2020 and beyond.
Other
The other portfolio is currently comprised of acquisition costs related to energy projects being acquired in the United States. Additionally, the company has invested capital to acquire and safe harbor panels that will be used in the construction of various pipeline projects.
GREC Energy Efficiency Portfolio
The company maintains three capital leases with AEC-LEDF, LLC related to the ownership of energy efficient lighting fixtures in three commercial locations in Puerto Rico, United States. The lease period under each of the master lease agreements correspond with underlying equipment service agreements between LED Funding LLC, the seller of the equipment to GREC Energy Efficiency Portfolio, and the owners of the commercial locations. The equipment service agreement terms range from 7 to 10 years. At the end of each of the lease terms, ownership of the fixtures is retained by the owners of the commercial locations.
Renew AEC One, LLC
In September 2015, the company entered into a secured loan agreement with Renew AEC One, LLC to fund the installation and purchase of energy efficiency lighting in a warehouse in Pennsylvania. The loan bears an interest rate of 10.25% per annum with principal amortization over a 10-year period ending in February 2025.
58
LED Funding LLC and Renew AEC One LLC (the “AEC Companies”) are considered related parties as the members of these entities own an indirect, non-controlling ownership interest in the company’s advisor. The loans and capital leases outstanding between the AEC Companies and the company were negotiated at an arm’s length and contain standard terms and conditions that would be included in third party lending agreements including required security and collateral, interest rates based upon risk of the specific loan, and term of the loan. As of March 31, 2020, all loans and capital leases were considered current per their terms.
SE Solar Loan
In February 2019, the company entered into a short-term secured loan agreement with SunEnergy1, LLC. The loan bears an interest rate of 9% and matures on February 21, 2021.
Encore Loan
In October 2019, the company entered into a short-term secured loan agreement with Encore Equipment, LLC. The loan bears an interest rate of 10% and matures on February 28, 2021.
Hudson Loan
In June 2019, the company entered into a short-term secured loan agreement with Hecate Energy New York Holdings LLC. The loan bears an interest rate of 8% and matures on January 31, 2021.
New Market Loan
In October 2019, the company entered into a short-term secured loan agreement with New Market Solar, LLC. The loan bears an interest rate of 9% and matures on January 31, 2021.
TUUSSO Loan
In November 2019, the company entered into a short-term secured loan agreement with TUUSSO Energy, LLC. The loan bears an interest rate of 8% and matures on April 30, 2021.
Portfolio Disposals
The following portfolios were sold during the nine months ended September 30, 2020:
Residential Portfolios
On March 5, 2020, the company closed a transaction to sell the entirety of its investments in the Greenbacker Residential Solar Portfolio and the Greenbacker Residential Solar Portfolio II (collectively the “Residential Portfolios”). The Residential Portfolios comprised 3,668 individual residential sites which were accumulated through a series of transactions from October 2016 to July 2017. The purchase price consideration for this transaction was $43,048,326 which resulted in a gain of $8,283,326 as it relates to the sale. The realized gain (loss) of $(157,084) and $8,126,241 was recorded for the three and nine months ending September 30, 2020, respectively, in net realized (loss)/gain on investments on the Consolidated Statements of Operations. The transaction resulted in a receivable of nil as of September 30, 2020.
East to West Portfolio Assets
On January 10, 2020, the company closed a transaction to sell three assets North Carolina I, North Carolina II, and South Robeson, all included within the East to West Portfolio. The portfolio consisted of systems that comprised 11.35 MW of commercial solar photovoltaic systems. The purchase price consideration for this transaction was $11,084,803, which resulted in a realized loss of $1,574,616 as it relates to the sale. The realized loss of nil and $1,574,616 was recorded for the three and nine months ending September 30, 2020, respectively, in net realized (loss)/gain on investments on the Consolidated Statements of Operations.
59
The following portfolios were sold during the year ended December 31, 2019:
Raleigh Portfolio
On December 24, 2019, the company entered into an agreement to sell 100% of the equity interests in Holocene Renewable Energy Fund 3, LLC. (“Raleigh Portfolio”). The Raleigh Portfolio was comprised of 26 MW of commercial ground and roof mounted solar photovoltaic systems located in North Carolina. The purchase price consideration for this transaction was $24,200,000 plus working capital, which resulted in a gain of $3,544,782 as it relates to the sale. During 2020, the company finalized the working capital adjustment for the sale and it resulted in a realized loss of nil and $398,151 for the three and nine months ending September 30, 2020, respectively, recorded in net realized (loss)/gain on investments on the Consolidated Statements of Operations. This transaction resulted in a receivable recorded of nil and $11,780,854 as of September 30, 2020 and December 31, 2019, respectively, in Investment sales receivable on the Consolidated Statements of Assets and Liabilities.
Enfinity Colorado DHA Portfolio
On October 18, 2019, the company entered into an agreement to sell 100% of the equity of Enfinity Colorado DHA 1, LLC which was comprised of 666 residential rooftop solar systems, totaling 2.5 MW located in and around Denver, Colorado. The purchase price consideration for this transaction was $6,972,240 plus working capital. The transaction resulted in a gain of $606,580 recorded in the Consolidated Statement of Operations. During 2020, the company finalized the working capital adjustment for the sale and it resulted in a realized loss of nil and $76,797 for the three and nine months ending September 30, 2020, recorded in net realized (loss)/gain on investments on the Consolidated Statements of Operations.
Phoenix Portfolio
The company entered into a transaction with Greenbacker Renewable Opportunity Zone Fund LLC (“GROZ”) to sell the Sol Phoenix Solar LLC investment, included within the Phoenix Solar Portfolio, on September 30, 2019 for an initial sale price of $16,874,761, pending final adjustments. The sale price was adjusted during Q4 2019 and increased to total $17,175,554 as of December 31, 2019 and finalized in Q2 2020 to total $18,060,275. The changes to the purchase price were based upon a final fair value determination of the investment as determined by an independent third-party appraiser. GROZ is an affiliate of GREC, as GROZ shares the same advisor as GREC. Since GROZ is an affiliate of the company, the determination of the purchase price was based on the fair value of the investment as determined by an independent third-party appraiser. The purchase was determined by a majority of the company’s board of directors (including a majority of the independent directors) not otherwise interested in the transaction to be fair and reasonable to the company.
The transaction resulted in a realized gain of $7,636,438 of which, nil, and $141,974 was recorded in the three and nine months ending September 30, 2020. GROZ paid an initial amount of $1,500,000 at closing with an additional $8,184,393 was paid by GROZ as of December 31, 2019. The transaction resulted in a receivable recorded of nil and $7,491,161 as of September 30, 2020 and December 31, 2019, respectively, in Investment sales receivable on the Consolidated Statements of Assets and Liabilities. As of September 30, 2020, the remaining balance was paid by GROZ.
Fremont Portfolio
On December 10, 2019, the company through its wholly owned subsidiary, Citrine Solar LLC, entered into a second transaction with GROZ to sell the Fremont CO I, LLC asset. The asset originally sold for a purchase price of $5,272,475, which increased to $5,335,009 in Q2 2020, based upon the fair value of the investment as determined by an independent third-party appraiser and a determination by a majority of the company’s board of directors (including a majority of the independent directors) not otherwise interested in the transaction that the purchase price was fair and reasonable to the company.
The transaction resulted in a realized gain of $762,391 of which, nil and $(32,576) was recorded in the three and nine months ending September 30, 2020 respectively, in net realized (loss)/gain on investments on the Consolidated Statements of Operations. As of December 31, 2019, a total of $2,531,000 was paid by GROZ. The transaction resulted in a receivable recorded of nil and $2,741,476 as of September 30, 2020 and December 31, 2019, respectively, in Investment sales receivable on the Consolidated Statements of Assets and Liabilities. As of September 30, 2020, the remaining balance was paid by GROZ.
60
Investment Summary
The following table presents the gross purchases of the gross funding of additional capital for new or existing investments for the nine months ended September 30, 2020 and September 30, 2019:
| For the nine months ended September 30, 2020 | For the nine months ended September 30, 2019 | |||||||
| Battery Storage | ||||||||
| Pacifica Portfolio | $ | 8,575,524 | $ | - | ||||
| Biomass | ||||||||
| Eagle Valley Biomass Portfolio | 1,380,896 | 20,773,245 | ||||||
| Commercial Solar | ||||||||
| Conic Portfolio | 992,217 | 14,740,000 | ||||||
| East to West Solar Portfolio | 6,980,815 | 2,050,000 | ||||||
| Foresight Solar Portfolio | 1,655,500 | 590,000 | ||||||
| Green Maple Portfolio | 838,269 | 90,000 | ||||||
| Longleaf Portfolio | 40,000 | 56,589,297 | ||||||
| Magnolia Sun Portfolio | 14,049,046 | - | ||||||
| Midway III Solar Portfolio | 1,010,071 | 535,000 | ||||||
| Raleigh Portfolio | - | 150,000 | ||||||
| Six States Solar Portfolio | 287,000 | 500,000 | ||||||
| Trillium Portfolio | 62,675,093 | - | ||||||
| Residential Solar | ||||||||
| Enfinity Colorado DHA Portfolio | - | 505,000 | ||||||
| Greenbacker Residential Solar Portfolio | 13,000 | - | ||||||
| Greenbacker Residential Solar Portfolio II | 265,000 | 25,000 | ||||||
| Wind | ||||||||
| Greenbacker Wind Portfolio - California | 50,000 | - | ||||||
| Greenbacker Wind Portfolio - HoldCo | 30,044,050 | - | ||||||
| Greenbacker Wind Portfolio - Iowa | - | 5,440,000 | ||||||
| Greenbacker Wind Portfolio - Massachusetts | 550,415 | 10,250,000 | ||||||
| Greenbacker Wind Portfolio - Minnesota | - | 29,000,000 | ||||||
| Greenbacker Wind Portfolio - Montana | 1,067,217 | 777,000 | ||||||
| Pre-Operational Assets | ||||||||
| Citrine Portfolio | 30,839,687 | - | ||||||
| Colorado CES Portfolio | 5,298,673 | 2,782,246 | ||||||
| Electric City Portfolio | 7,150,812 | - | ||||||
| Greenbacker Wind Portfolio - Maine | 5,829,080 | - | ||||||
| Omni Portfolio | 6,622,528 | 12,430,700 | ||||||
| Oregon Sun Portfolio | 3,346,465 | 3,091,407 | ||||||
| Phoenix Solar Portfolio | 2,774,443 | 16,744,932 | ||||||
| SE Solar Portfolio | 9,913,695 | 3,000,000 | ||||||
| Turquoise Solar Portfolio | 3,620,822 | 16,162,631 | ||||||
| Other Investments | ||||||||
| Other Portfolios | 10,962,150 | 4,370,666 | ||||||
| Secured Loans | ||||||||
| Encore Loan | 2,573,651 | - | ||||||
| Hudson Loan | 464,149 | 2,228,179 | ||||||
| New Market Loan | 7,350 | - | ||||||
| SE Solar Loan | 4,000,000 | 5,000,000 | ||||||
| TUUSSO Loan | 1,595,163 | - | ||||||
| $ | 225,472,781 | $ | 207,825,303 | |||||
For the nine months ending September 30, 2020, we executed an additional three acquisition transactions, and two portfolio sales, eight portfolio consolidations, and one portfolio disposal, bringing us to a net total of 27 portfolios. As our access to capital has increased, the average size of the investment has increased from 13.98 MW per portfolio in 2018 to 19.83 MW per portfolio in 2019, a 41.85% increase year over year. As of September 30, 2020, the average size of our investment has increased again to 27.26 MW per portfolio.
For the year ended December 31, 2019, we made an additional 12 portfolio company investments, and four portfolio sales, causing a net increase of our total portfolio investments to 34. In addition to the new portfolios purchased, throughout the year we also added four additional tax equity partnerships that collectively own 12 projects, as of December 31, 2019. As a result of these investments our total gross assets purchased reached $353,585,860, an increase year-over-year of 160% over 2018. Additionally, as our capital resources have increased, the average size of the investment has increased from 13.98 MW per portfolio in 2018 to 19.83 MW per portfolio in 2019, a 41.85% increase year-over-year.
61
The composition of the company’s investments as of September 30, 2020, at fair value, were as follows:
| Investments at Cost | Investments at Fair Value | Fair Value Percentage of Total Portfolio | ||||||||||
| Battery Storage | ||||||||||||
| Pacifica Portfolio | $ | 8,685,904 | $ | 8,685,904 | 1.5 | % | ||||||
| Subtotal | $ | 8,685,904 | $ | 8,685,904 | 1.5 | % | ||||||
| Biomass | ||||||||||||
| Eagle Valley Biomass Portfolio | $ | 22,336,352 | $ | 22,336,352 | 3.8 | % | ||||||
| Subtotal | $ | 22,336,352 | $ | 22,336,352 | 3.8 | % | ||||||
| Commercial Solar: | ||||||||||||
| Canadian Northern Lights Portfolio | $ | 1,603,136 | $ | 1,598,127 | 0.3 | % | ||||||
| Conic Portfolio | 12,704,841 | 15,941,621 | 2.7 | |||||||||
| East to West Solar Portfolio | 24,618,117 | 22,407,183 | 3.8 | |||||||||
| Foresight Solar Portfolio | 15,390,000 | 21,551,738 | 3.6 | |||||||||
| Golden Horizons Solar Portfolio | 9,290,000 | 17,374,205 | 2.9 | |||||||||
| Green Maple Portfolio | 26,844,254 | 26,697,418 | 4.5 | |||||||||
| Longleaf Solar Portfolio | 23,105,319 | 24,488,155 | 4.1 | |||||||||
| Magnolia Sun Portfolio | 33,011,197 | 36,577,895 | 6.2 | |||||||||
| Midway III Solar Portfolio | 11,525,465 | 13,133,551 | 2.2 | |||||||||
| Six States Solar Portfolio | 12,470,306 | 12,840,051 | 2.2 | |||||||||
| Sunny Mountain Portfolio | 888,081 | 742,853 | 0.1 | |||||||||
| Trillium Portfolio | 117,549,336 | 150,668,216 | 25.4 | |||||||||
| Subtotal | $ | 289,000,052 | $ | 344,021,013 | 58.0 | % | ||||||
| Wind: | ||||||||||||
| Greenbacker Wind Portfolio - California | $ | 9,500,000 | $ | 9,039,954 | 1.5 | % | ||||||
| Greenbacker Wind Portfolio - HoldCo | 73,920,267 | 78,011,040 | 13.0 | |||||||||
| Greenbacker Wind Portfolio - Massachusetts | 10,486,133 | 11,861,232 | 2.0 | |||||||||
| Greenbacker Wind Portfolio - Montana | 25,064,201 | 25,790,576 | 4.3 | |||||||||
| Subtotal | $ | 118,970,601 | $ | 124,702,802 | 20.8 | % | ||||||
| Pre-Operational Assets: | ||||||||||||
| Citrine Portfolio | $ | 3,189,290 | $ | 3,189,290 | 0.5 | % | ||||||
| Greenbacker Wind Portfolio - Maine | 6,075,587 | 15,976,531 | 2.7 | |||||||||
| SE Solar 2019 Portfolio | 10,433,667 | 10,433,667 | 1.8 | |||||||||
| Turquoise Solar Portfolio | 24,431,513 | 24,431,513 | 4.0 | |||||||||
| Subtotal | $ | 44,130,057 | $ | 54,031,001 | 9.0 | % | ||||||
| Other Investments: | ||||||||||||
| Other Portfolios | $ | 8,834,837 | $ | 8,292,962 | 1.4 | % | ||||||
| Subtotal | $ | 8,834,837 | $ | 8,292,962 | 1.4 | % | ||||||
| Energy Efficiency: | ||||||||||||
| GREC Energy Efficiency Portfolio | $ | 350,252 | $ | 352,309 | 0.1 | % | ||||||
| Renew AEC One, LLC | 428,640 | 428,640 | 0.1 | |||||||||
| Subtotal | $ | 778,892 | $ | 780,949 | 0.2 | % | ||||||
| Secured Loans: | ||||||||||||
| Encore Loan | $ | 7,574,330 | $ | 7,574,330 | 1.3 | % | ||||||
| Hudson Loan | 9,945,275 | 9,945,275 | 1.7 | |||||||||
| New Market Loan | 5,007,350 | 5,007,350 | 0.8 | |||||||||
| SE Solar Loan | 5,005,244 | 5,005,244 | 0.8 | |||||||||
| TUUSSO Loan | 4,217,046 | 4,217,046 | 0.7 | |||||||||
| Subtotal | $ | 31,749,245 | $ | 31,749,245 | 5.3 | % | ||||||
| Total | $ | 524,485,940 | $ | 594,600,228 | 100.0 | % | ||||||
62
The composition of the company’s investments as of December 31, 2019, at fair value, were as follows:
| Investments at Cost | Investments at Fair Value | Fair
Value Percentage of Total Portfolio | ||||||||||
| Biomass: | ||||||||||||
| Eagle Valley Biomass Portfolio | 21,425,600 | 21,425,600 | 4.5 | % | ||||||||
| Subtotal | $ | 21,425,600 | $ | 21,425,600 | 4.5 | % | ||||||
| Commercial Solar: | ||||||||||||
| Conic Portfolio | $ | 12,077,823 | $ | 17,828,206 | 3.8 | % | ||||||
| East to West Solar Portfolio | 39,109,190 | 41,214,191 | 8.7 | |||||||||
| Foresight Solar Portfolio | 13,790,000 | 14,965,339 | 3.1 | |||||||||
| Golden Horizons Solar Portfolio | 9,290,000 | 15,132,017 | 3.2 | |||||||||
| Green Maple Portfolio | 26,561,596 | 27,268,058 | 5.7 | |||||||||
| Longleaf Portfolio | 22,797,404 | 24,605,536 | 5.2 | |||||||||
| Magnolia Sun Portfolio | 10,775,000 | 6,460,457 | 1.4 | |||||||||
| Midway III Solar Portfolio | 10,575,394 | 11,475,652 | 2.4 | |||||||||
| Six States Solar Portfolio | 12,655,306 | 12,799,005 | 2.6 | |||||||||
| Sunny Mountain Portfolio | 884,578 | 743,768 | 0.2 | |||||||||
| Subtotal | $ | 158,516,291 | $ | 172,492,229 | 36.3 | % | ||||||
| Residential Solar: | ||||||||||||
| Canadian Northern Lights Portfolio | $ | 1,603,136 | $ | 1,611,955 | 0.3 | % | ||||||
| Greenbacker Residential Solar Portfolio | 28,100,000 | 32,540,979 | 6.9 | |||||||||
| Greenbacker Residential Solar Portfolio II | 6,400,000 | 13,279,521 | 2.8 | |||||||||
| Subtotal | $ | 36,103,136 | $ | 47,432,455 | 10.0 | % | ||||||
| Wind: | ||||||||||||
| Greenbacker Wind Portfolio - California | $ | 9,500,000 | $ | 8,777,056 | 1.8 | % | ||||||
| Greenbacker Wind Portfolio - HoldCo | 25,753,111 | 35,089,021 | 7.4 | |||||||||
| Greenbacker Wind Portfolio - Iowa | 20,440,000 | 20,440,000 | 4.3 | |||||||||
| Greenbacker Wind Portfolio - Massachusetts | 10,169,079 | 10,902,726 | 2.3 | |||||||||
| Greenbacker Wind Portfolio - Montana | 24,756,684 | 26,451,773 | 5.6 | |||||||||
| Subtotal | $ | 90,618,874 | $ | 101,660,576 | 21.4 | % | ||||||
| Pre-Operational Assets: | ||||||||||||
| Citrine Solar Portfolio | $ | 3,411,249 | $ | 3,411,249 | 0.7 | % | ||||||
| Colorado CES Portfolio | 4,517,354 | 4,517,354 | 1.0 | |||||||||
| Electric City Portfolio | 4,208,484 | 4,208,484 | 0.9 | |||||||||
| Omni DG Portfolio | 17,900,298 | 17,900,298 | 3.8 | |||||||||
| Opal Portfolio | 344,949 | 344,949 | 0.1 | |||||||||
| Oregon Sun Portfolio | 5,404,787 | 5,404,787 | 1.1 | |||||||||
| Phoenix Solar Portfolio | 4,051,138 | 4,051,138 | 0.8 | |||||||||
| SE Solar 2019 Portfolio | 5,000,000 | 5,000,000 | 1.1 | |||||||||
| Trillium Portfolio | 24,277,396 | 24,277,396 | 5.0 | |||||||||
| Turquoise Solar Portfolio | 26,602,532 | 26,602,532 | 5.6 | |||||||||
| Subtotal | $ | 95,718,187 | $ | 95,718,187 | 20.1 | % | ||||||
| Other Investments: | ||||||||||||
| Other Portfolios | $ | 12,656,710 | $ | 12,473,975 | 2.6 | % | ||||||
| Subtotal | $ | 12,656,710 | $ | 12,473,975 | 2.6 | % | ||||||
| Energy Efficiency: | ||||||||||||
| GREC Energy Efficiency Portfolio | $ | 388,044 | $ | 390,019 | 0.1 | % | ||||||
| Renew AEC One, LLC | 479,140 | 479,140 | 0.1 | |||||||||
| Subtotal | $ | 867,184 | $ | 869,159 | 0.2 | % | ||||||
| Secured Loans | ||||||||||||
| Encore Loan | $ | 5,000,680 | $ | 5,000,680 | 1.1 | % | ||||||
| Hudson Loan | 9,481,127 | 9,481,127 | 2.0 | |||||||||
| New Market Loan | 5,000,000 | 5,000,000 | 1.1 | |||||||||
| SE Solar Loan | 1,000,000 | 1,000,000 | 0.2 | |||||||||
| TUUSSO Loan | 2,621,883 | 2,621,883 | 0.5 | |||||||||
| Subtotal | $ | 23,103,690 | $ | 23,103,690 | 4.9 | % | ||||||
| Total | $ | 439,009,672 | $ | 475,175,871 | 100.0 | % | ||||||
63
Results of Operations
A discussion of the results of operations for the three and nine months ended September 30, 2020 and three and nine months ended September 30, 2019 are as follows:
Revenues. As the majority of our assets consist of equity investments in entities established to own and operate our renewable energy projects, the majority of the revenue we generate is in the form of dividend income. Dividend income is not equivalent to the gross revenue produced at the project level but is instead the amount of free cash that is distributed from the project entities to the company from time to time after paying for all project level expenses and complying with any specific project level debt and tax equity covenants. Thus, the presentation of investment income in our financial statements differ from the traditional presentation shown in the financial statements or entities not prepared in accordance with ASC 946 and, most notably, is not equivalent to revenue as one might expect to see in financial statements not prepared in accordance with ASC 946.
The timing and amount of dividend income to be distributed to the company is determined on at least a quarterly basis by the company. This process includes an analysis at the individual project entity level of the cash available from operations and necessary working capital needed for the proper daily operations of the project. As a general rule, the dividend income from our equity investments is recognized as income only when it is received by the company whereas the undistributed income is retained within the project entities (i.e., included in working capital of the project company) and is added to the carrying value of those investments on the balance sheet. The other major component of our revenue is interest income earned on our debt investments, including loans to developers and loans made directly or indirectly to renewable energy projects. Dividend income for the three and nine months ended September 30, 2020 totaled $4,520,199 and $14,599,327, respectively, while interest income earned on our cash, cash equivalents, and secured loans (including the amortization of origination and other fees) amounted to $703,437 and $2,133,727, respectively. Dividend income for the three and nine months ended September 30, 2019 totaled $5,556,784 and $11,720,352, respectively, while interest income earned on our cash, cash equivalents, and secured loans (including the amortization of origination and other fees) amounted to $388,860 and $844,331, respectively.
The decrease in dividend income from the three months ended September 30, 2019 to the three months ended September 30, 2020 was primarily attributable to increases in overhead costs and the timing of collecting receivables that hindered the amount of cash the underlying equity investments were able to distribute. The increase in dividend income from the nine months ended September 30, 2019 to the nine months ended September 30, 2020 was primarily attributable to the acquisition of operating assets and completion of construction assets through the end of 2019 and 2020 as well as, the increased production in YTD for Q3 2020 compared to Q3 2019.
The increase in the interest income for the three and nine months ended September 30, 2020 versus the three and nine months ended September 30, 2019 was primarily attributed to the increase in the balances of our interest-bearing loans to unaffiliated entities.
During 2020, our investments increased from $475.1 million as of December 31, 2019 to $594.6 million as of September 30, 2020, or a 25.13% increase. As of September 30, 2020, and December 31, 2019, we had approximately $134,639,978 and $128,632,161 in pre-operational and non-earning assets, which amounted to 14.04% and 19.08% of our gross investment amounts, respectively. We expect that the majority, but not all, of the assets that are currently pre-operational and non-earning to become revenue generating throughout the remainder of 2020 and into 2021 but we also expect to continue to make new investments in projects prior to the commencement of construction. As noted above, the strategy of investing in projects prior to the commencement of construction resulted in an increase in costs with no immediate increase in dividend income from those projects. However, during the year ended December 31, 2019 we were able to transition 17 projects, comprising four portfolios, from the construction phase to the commencement of operations. Managing projects through the construction phase to commercial operation date during the year ended December 31, 2019 has delivered both realized and unrealized gains of $8,289,121, and $5,216,936, respectively, which are now all incorporated in the current net asset value of the company.
64
| Balance | 9/30/2020 | 12/31/2019 | 12/31/2018 | |||||||||
| Investments in controlled/affiliated and non-controlled/non-affiliated portfolios at fair value | $ | 594,600,228 | $ | 475,175,871 | $ | 307,176,115 | ||||||
| Notes payable balances of the company and its’ operating entities | $ | 418,040,395 | $ | 261,850,711 | $ | 92,631,639 | ||||||
| Cash, cash equivalents and restricted cash | $ | 19,556,657 | $ | 9,066,091 | $ | 39,122,635 | ||||||
| Less: Notes payable balance of the company | $ | (73,248,007 | ) | $ | (71,990,467 | ) | $ | (30,665,460 | ) | |||
| Gross Investment Amount | $ | 958,949,273 | $ | 674,102,206 | $ | 408,264,929 | ||||||
| Additional Metrics | ||||||||||||
| Pre-operational and Non-earning Assets | $ | 134,639,978 | $ | 128,632,161 | $ | 51,632,387 | ||||||
| Pre-operational and Non-earning Assets as a % of Gross Investment Amount | 14.04 | % | 19.08 | % | 12.65 | % | ||||||
Expenses. For the three and nine months ended September 30, 2020, the company incurred $7,209,107 and $15,928,680 in operating expenses, respectively, including the management fees earned by the advisor. For the three and nine months ended September 30, 2019, the company incurred $3,920,695 and $10,240,672 in operating expenses, respectively, including the management fees earned by the advisor.
For the three and nine months ended September 30, 2020, the advisor earned $2,497,596 and $7,348,380, respectively, in management fees due to the increase in total assets. The consolidated financial statements reflect a $4,193,559 decrease and $(1,154,308) increase, respectively, in incentive allocation for the three and nine months ended September 30, 2020 based primarily upon net unrealized appreciation. The decrease in incentive allocation for the three months ended September 30, 2020 was a result of the termination of the previous incentive fee methodology and adoption of the new performance participation fee, as previously discussed in Note 2 – Capital Gains Incentive Allocation and Distribution. For the three and nine months ended September 30, 2019, the advisor earned $2,228,976 and $6,086,107, respectively, in management fees due to the increase in total assets. The consolidated financial statements reflect a $2,588,895 and $4,025,183 increase, respectively, in incentive allocation for the three and nine months ended September 30, 2019 based primarily upon net unrealized appreciation. The consolidated financial statements reflect a $59,210 decrease and $899,624 increase in incentive allocation for the three and nine months ended September 30, 2019 based primarily upon net unrealized appreciation (depreciation).
Lastly, for the three and nine months ended September 30, 2020, the company generated a tax (benefit) expense from operations in the amount of $(2,835,220) and $(8,482,792), respectively. For the three and nine months ended September 30, 2019, the company generated a tax (benefit) expense from operations in the amount of $(48,360) and $(553,652), respectively. The deferred tax expense is mainly derived from net operating losses incurred and investment tax credit carryforwards related to the company’s investments which, unlike for financial statement purposes under GAAP, are consolidated for tax purposes offset by unrealized tax basis gains on the company’s investments.
For the three and nine months ended September 30, 2020, the net investment income (loss) was $1,125,749 and $9,287,166, respectively, or $0.02 and $0.18, respectively, per share. For the three and nine months ended September 30, 2019, the net investment income (loss) was $ 2,067,331 and $2,689,697, respectively, or $0.05 and $0.06, respectively, per share.
Going forward, we expect our primary expenses to be the payment of asset management fees under our advisory agreement with the advisor. We will bear other expenses, which are expected to include, among other things:
| ● | the cost of calculating our net asset value, including the related fees and cost of retaining third-party valuation services; |
65
| ● | the cost of effecting sales and repurchases of units; |
| ● | fees payable to third parties relating to, or associated with our financial and legal affairs, making investments, and valuing investments, including fees and expenses associated with performing due diligence reviews of prospective investments and sub-advisors; | |
| ● | fees payable to our advisor; | |
| ● | interest payable on debt incurred to finance our investments; |
| ● | transfer agent and custodial fees; |
| ● | federal and state registration fees; |
| ● | costs of board meetings, unitholders’ reports and notices and any proxy statements; |
| ● | directors’ and officers’ errors and omissions liability insurance and other types of insurance; |
| ● | direct costs, including those relating to printing of unitholder reports and advertising or sales materials, mailing, telephone and staff; |
| ● | fees and expenses associated with independent audits and outside legal costs, including compliance with the Sarbanes-Oxley Act of 2002 and applicable federal and state securities laws; and |
| ● | all other expenses incurred by us or the advisor or sub-advisors in connection with administering our investment portfolio, including expenses incurred by our advisor in performing certain of its obligations under the advisory agreement. |
Net Realized Gains or Losses and Net Change in Unrealized Appreciation or Depreciation on Investments and Translation of Assets and Liabilities Denominated in Foreign Currencies. Net realized and unrealized gains and losses from our investments and net realized and unrealized foreign currency gains and losses on translation of assets and liabilities denominated in foreign currencies are reported separately on the Consolidated Statements of Operations. We measure realized gains or losses as the difference between the net proceeds from the sale, repayment, or disposal of an asset and the adjusted cost basis of the asset, without regard to unrealized appreciation or depreciation previously recognized. Net change in unrealized appreciation or depreciation will reflect the change in investment values during the reporting period, including any reversal of previously recorded unrealized appreciation or depreciation, when gains or losses are realized.
For the three and nine months ended September 30, 2020, we recognized $(157,084) and $6,186,076, respectively, of realized gain (loss) on the sale of investment related to the sale of Greenbacker Residential Solar Portfolio I, Greenbacker Residential Solar Portfolio II, Sol Phoenix, Fremont and East to West Portfolio Assets, a net change in unrealized appreciation of $10,851,169 and $27,800,762, respectively, was recorded of which $10,197,526 and $33,921,156 of unrealized appreciation, respectively, related to the change in value of investments and $27,988 and $26,933 of unrealized appreciation, respectively, related to the change in value based upon changes in foreign currency exchange rates and $625,645 and $(6,147,327) of unrealized appreciation (depreciation), respectively, related to the change in value of swap contracts.
For the three and nine months ended September 30, 2019, we recognized $6,683,326 realized gain on the sale of an investment, a net change in unrealized appreciation of $9,906,613 and $23,286,195, respectively, was recorded of which $11,903,224 and $30,010,301 of unrealized appreciation, respectively, related to the change in value of investments and $(15,767) and $42,054 of unrealized appreciation (depreciation), respectively, related to the change in value based upon changes in foreign currency exchange rates and $(1,980,844) and $(6,766,160) of unrealized (depreciation), respectively, related to the change in value of swap contracts.
Changes in Net Assets from Operations. For the three and nine months ended September 30, 2020, we recorded a net increase in net assets resulting from operations of $14,906,327 and $36,822,334, respectively. For the three and nine months ended September 30, 2019, we recorded a net increase in net assets resulting from operations of $15,084,063 and $25,158,444, respectively. The increase in net assets primarily relates to our net investment income earned during the year and unrealized appreciation related to the change in value of investments.
66
Dividend Coverage Ratio and Realized Gains
An analysis of the effect of realized gains on the company’s dividend coverage ratio is as follows:
| (in 000’s) | ||||||||||||||||||||||||
| Description | 9/30/20 | 2019 | 2018 | 2017 | 2016 | 2015 | ||||||||||||||||||
| Net Investment Income before taxes | $ | 804.73 | $ | 4,213.80 | $ | 9,681.31 | $ | 7,459.04 | $ | 3,749.56 | $ | 216.54 | ||||||||||||
| Shareholder Distributions (total including DRP) | $ | 22,423.20 | $ | 25,884.10 | $ | 17,738.13 | $ | 11,403.61 | $ | 6,717.87 | $ | 1,990.14 | ||||||||||||
| Dividend Coverage Ratio (net investment income/total distributions) | 3.59 | % | 16.28 | % | 54.58 | % | 65.41 | % | 55.81 | % | 10.88 | % | ||||||||||||
| Realized Gains | $ | 6,186.08 | $ | 12,915.74 | $ | - | $ | 694.00 | $ | - | $ | - | ||||||||||||
| Gross Dividend Coverage Ratio (Net Investment Income and Realized Gains/Total Shareholder Distributions) | 31.18 | % | 66.18 | % | 54.58 | % | 71.49 | % | 55.81 | % | 10.88 | % | ||||||||||||
The company has built its business around investing in long-term income producing assets in the renewable energy industry utilizing the cash flow associated with those assets to pay monthly distributions to our investors. When fully invested, we will measure success based upon generating a consolidated cash flow stream which enables the company to pay all shareholder distributions through the operating returns of the company’s projects. As such, our long-term goal has always been to achieve a distribution coverage ratio of at least 1:1 and to grow that ratio meaningfully over time, so we can increase long term returns to investors either through distribution growth or by growing the net asset value of our shares through reinvestment on net investment income.
Investment Company Accounting Considerations
Since the company’s consolidated financial statements are prepared using the specialized accounting principles of ASC Topic 946, our investment advisor produces an estimate of the fair market value of each of our investments quarterly. When valuing our investments under the income method, net operating earnings generated at the project level are included in our valuation models. While the valuation models take into account all revenue, Distribution Income recorded from each of our project companies may be more or less than that included in our valuation models each period due to various cash flow considerations. As an example, since many of our projects are held in tax partnership structures, or in related entities with bank financed project level debt, the company may be contractually limited in its’ ability to make dividend distributions from project companies to the company. Since project entities are not consolidated with the company under ASC Topic 946, in many cases not all net income from operations earned by a project company is distributed to the company. While this non-distributed income is included in the calculation of fair market value and unrealized gain / loss on investments, it is not included in Net Investment Income on the Statement of Operations, and therefore not included in our dividend coverage ratio.
Investing in Asset Classifications other than Operating Assets
We believe that the hallmark of a good investment strategy is the ability to take advantage of new opportunities and adjust to changing market conditions. Towards the end of 2017, our investment advisor began to observe an increase in the opportunities to participate in projects that were largely similar to our operating assets in terms of the long-term risks, but which promised additional returns if we could manage some additional risks in the early stages of the investment lifecycle. As a result, we determined that we should expand our investment capabilities to include four basic investment categories:
| 1. | Operating Assets – As a continuation of our initial strategy, the company will continue to invest in solar, wind and other alternative energy assets that are already in commercial operation and generating investment returns through the sale of contracted electricity and environmental attributes. |
67
| 2. | Commercial Operation Date (“COD”) – The company will also purchase assets that have been constructed by developers but have not been placed in service. Functionally these assets are generally ready to generate electricity and have reached a milestone known as the COD While we have determined that a modest investment premium could be obtained by investing at COD, most importantly the term of the contracted cashflows is maximized through this strategy. |
| 3. | Notice to Proceed (“NTP”) – We further determined that it could invest in assets that had not yet been constructed but had received substantially all of the permits necessary to begin construction, a milestone known as NTP. While potentially riskier than operating or COD projects due to the level of construction risk, we believe that the additional return associated with these projects more than compensates for the additional risk. Furthermore, when we invest in NTP assets we have the added benefit of having more control of equipment selection and implementation of construction best practices which positively affects the long-term performance of our plants. With the continued growth of the renewable energy market, driven by increases in the level of Renewable Portfolio Standards in several states and the planned wind down of federal tax incentives, we identified a significant number of NTP transactions coming to market and an opportunity to develop strong pipeline type relationships with the developers of these projects. Besides increasing returns to investors, this has enabled management to substantially increase our access to a proprietary pipeline of sound projects. |
| 4. | Special Situations –We also determined there are market opportunities for selected projects driven by either technical or financial issues, either at the project or owner level, that can be relatively easily resolved by accessing the broad range of expertise we have in-house to deal with our day to day operations. Therefore, we determined that on a limited basis the company would seek investments that had these characteristics since by resolving the issues we have the potential to generate above market returns. |
In order to execute on this strategy, management recognized the need to build a dedicated team of technical asset management professionals. Starting in late 2017, Greenbacker Administration began hiring a team of experienced engineers and construction managers which enabled the company to expand our investment focus into these additional categories of investment. Having access to the technical expertise enabled the company to purchase operationally challenged solar and wind farms while having a sound financial understanding of the costs and time required to resolve the issues. Having an in-house team of technical asset management professionals also increases our ability to extract revenue from aging solar assets through repowers and plant optimization. It also allows us to capitalize on acquisition of “distressed” assets as the number of those assets exponentially increases over the coming years. Lastly, it enabled the company to invest in earlier stage projects where the projects were fully permitted, but construction had not yet commenced. Having access to this level and breath of expertise is a major competitive advantage for the company in the marketplace.
Strategic Considerations of Investing in NTP Projects
We believe that investing across the four investment categories discussed above provides the best opportunity for the company to generate superior investment returns over the medium term, diversify its portfolio, and create a proprietary pipeline of sound investment opportunities for future growth. The downside of this approach is that investing in pre-operational solar and wind projects that are underperforming has a negative impact on near term cashflows and dividend coverage. To minimize the downside effects of the strategy, management has continued to explore more sophisticated financing tools to enable us to direct more of our investable capital into current income generating investments going forward. As the size of our portfolio grows, our ability to access the more sophisticated financial products increases.
68
History of Distribution Coverage
2014 - 2017
During the period from April 2014, when we started raising capital, through the end of 2017, our investment strategy consisted wholly of purchasing operating renewable energy projects that were in-service and generating income from the sale of electricity under long-term power purchase contracts. By investing exclusively in operating assets, the company was able to demonstrate steady improvement in distribution coverage through that period. This initial operational period also corresponded to a significant increase in assets under management as well as the deployment of capital in income producing renewable energy operating assets.
2018
The company began to expand its investment focus during 2018 with the purchase of the Midway III project in September 2018. There were no assets under construction in 2017, whereas by December 31, 2018 the company’s investment portfolio included a total of $67.13 million of to-be-constructed assets. Given the substantial increase in non-income generating assets, the distribution coverage ratio fell to 54.58% on average assets by December 31, 2018.
2019
By December 31, 2019, total capital deployed in pre-operational and non-earning assets reached approximately $128.6 million or 19.08% of Gross Investment Amount. In addition, Greenbacker Administration costs increased approximately $3 million year over year due to the increase in specialist headcount to manage the construction and operational risks associated with these in investment initiatives. These increased costs directly reduced the operating cash flows from project level entities that would otherwise have been available to distribute to the company as dividend income. When these projects commenced operations, any increase in the fair value of the project was recognized as an unrealized gain in the statement of operations, not as investment income. Thus, while costs incurred prior to operation reduce the dividend coverage ratio, any unrealized gains on the value of the project after reaching operations has no effect on the dividend coverage ratio.
2020
As of September 30, 2020, total capital deployed in pre-operational and non-earning assets reached approximately $134.64 million or 14.04% of Gross Investment Amount. In addition, Greenbacker Administration costs increased due to the increase in specialist headcount to manage the construction and operational risks associated with these investment initiatives. These increased costs directly reduced the operating cash flows from project level entities that would otherwise have been available to distribute to the company as dividend income.
Demonstrating Value Creation Through Selected Asset Sales
During 2019, we determined that the company would engage in a process of selling selected projects that it considered to be non-core investments or for which there were compelling opportunities to sell at prices in excess of original cost.
69
In the nine months ended September 30, 2020, the company sold two operating portfolios and a portion of another operating portfolio. A discussion of the acquisition and sale process for the operating portfolios sold in 2020 are as follows:
Residential Portfolios:
Origination Process: Greenbacker Residential Solar I Portfolio:
In Second Quarter of 2016, the company purchased 1,610 operating residential photovoltaic solar systems from One Roof Energy (“ORE”) located in California, Connecticut, Massachusetts, New Jersey and New York. While Greenbacker had focused exclusively upon purchasing commercial and utility solar projects since commencement of operations, the deal team identified an opportunity to purchase these assets from ORE at a price that was extremely attractive, especially given the high credit quality of the homeowners (Average FICO Score of 740). The company was able to purchase an additional 1,015 residential solar systems early in early 2017 as ORE experienced financial problems that forced it to cease operations. These portfolios provided an attractive cash flow from operations as well as higher than average cash yield
Origination Process: Greenbacker Residential Solar II Portfolio:
Having successfully purchased and managed a portfolio of residential solar assets, earlier in the year, the Company sought to increase its scale and take advantage of dislocations in the residential solar market so it agreed to purchase an additional 1,250 operating residential photovoltaic solar systems, located in California, Arizona, New York, New Jersey, Massachusetts, Maryland, Nevada, and Connecticut from Terraform, a residential solar developer whose parent company, SunEdison, had gone into bankruptcy. While the transaction was very complex, we were highly attracted to this portfolio due to the high credit quality of the residential homeowners and felt that the price we paid for the portfolio was well below the market prices we had observed in other residential solar portfolio sales and securitizations. Lastly, there was estimated to be considerable upside in this portfolio if we could complete construction of some of the to-be-built residential solar projects. Through active management we were able to complete construction and operate a number of additional projects that were purchased alongside the operating projects and were also able to improve the overall management of the portfolio.
Sale Process:
In the third quarter of 2019, the company decided to explore the potential exit of the entirety of its residential solar business to take advantage of market yield compression and our estimation that the market had reached the late stage of a bull market cycle. Management’s view was that maintaining exposure to consumer credit in the form of residential rooftop power contracts was increasingly imprudent. The company began a process in the final quarter of 2019 with a dedicated buyer and was able to complete the sale of the portfolio in Q1 2020.
70
East to West Portfolio Assets:
Origination Process:
In February 2015, the company purchased a portfolio of 13 commercial solar systems located in various states across the US from MP2 Capital and Blu Leaf Ventures which we subsequently described as the “East to West Portfolio”. The portfolio included two 2.0 MWac commercial solar systems located in North Carolina. Then in December 2015 the company purchased a portfolio of two commercial solar systems from Heelstone Energy, LLC including one 5.0 MWac system located in North Carolina which we added to the East to West Portfolio. All three projects were placed in service from 2011 to 2013 and sold 100% of the power produced to Duke Energy, an investment grade off-taker, through 15-20-year PPA’s. The projects were accumulated as part of the process of adding affordable operating solar projects with solid offtakes to our portfolio in the very early phases of our investment activity.
Sale Process:
In mid-2019, we began discussions with USF Holdings Corp to sell 100% of our interest in the Raleigh Portfolio which was comprised five projects in North Carolina together with three of the projects in the East to West Portfolio located in North Carolina, all of which were selling power to Duke Energy. The transaction was structured with two separate closings, the first of which occurred in December 2019 in respect of the Raleigh Portfolio and the second in January 2020 in respect of the three projects from the East to West Portfolio. As these projects were nearing the 10-year mark of their remaining PPA terms, the company was looking to sell the Raleigh Portfolio and three projects from the East to West Portfolio to reinvest the proceeds into projects with longer term contacted cashflows. The second close of the transaction, which included the three projects from the East to West Portfolio, occurred in January 2020.
During the year ended December 31, 2019, the company sold two portfolios at commercial operation date, as well as two operating portfolios. A discussion of the acquisition and sale process for two operating portfolios sold in 2019 are as follows:
Enfinity Colorado DHA Portfolio:
Origination Process:
In the first quarter of 2017, the company purchased a 2.5 MW portfolio of residential assets in Denver, CO. determining there were numerous investment merits that made this project a desirable portfolio company. Unlike other residential portfolios which have standalone PPAs with individuals and are rated using FICO scores, this portfolio had a single off-taker, the Denver Housing Authority (“DHA”), an entity providing public housing in the City of Denver. This portfolio provided an attractive cash flow from operations as well as cash yield. Lastly, the company had a positive relationship with the operations and maintenance provider reducing our operational risk.
Sale Process:
In the third quarter of 2019, the company decided to explore the potential exit of the residential solar business to take advantage of market yield compression and a healthy economy. Through ongoing contact during the life of our ownership, the company was aware that DHA was interested in purchasing the project and was willing to purchase at a competitive price. The company managed the due diligence process for the potential sale throughout the summer of 2019, culminating in the execution of a purchase and sale agreement in October 2019 and a final closing in December 2019.
Raleigh Portfolio:
Origination Process:
In the third quarter of 2017, the company purchased a 27.8 MW portfolio comprised of five commercial solar systems located in North Carolina from Conergy Projects, Inc. The projects were placed in service throughout 2015 and sold 100% of the power produced to Duke Energy, an investment grade off-taker, through a 15-year PPA. We were able to purchase this asset as a part of the global orderly wind down of Conergy, Inc., a multinational EPC, developer and owner of utility scale solar projects. Additionally, the company purchased the asset unlevered which provided immediate flexibility to leverage the asset.
71
Sale Process:
In mid-2019, we began discussions with USF Holdings Corp to sell 100% of our interest in the five Raleigh projects, in addition to three other projects included in the company’s East to West Portfolio in two separate closings. As these projects were nearing the 10-year mark of their remaining respective PPA terms, the company was looking to sell the Raleigh Portfolio and recirculate the sales proceeds into projects with longer term contracts. The initial close of the Raleigh Portfolio, which included five projects, occurred in December 2019.
| Portfolio | Cost Basis of Investment | Sale Proceeds | Realized
Gain (Loss) | Realized Gain (Loss)/Cost | ||||||||||||
| Greenbacker Residential Solar Portfolios* | $ | 34,765,000 | $ | 42,891,241 | $ | 8,126,241 | 23.4 | % | ||||||||
| East to West Portfolio Assets | $ | 12,659,419 | $ | 11,084,803 | $ | (1,574,616 | ) | (12.4 | )% | |||||||
| Enfinity Colorado DHA Portfolio* | $ | 6,288,864 | $ | 6,895,444 | $ | 606,580 | 9.6 | % | ||||||||
| Raleigh Portfolio* | $ | 20,977,199 | $ | 24,521,981 | $ | 3,544,782 | 16.9 | % | ||||||||
| * | Updated for final proceeds after net working capital true up calculations. |
Electricity Production by Our Investments
Between 2017 through the end of 2019, we observed a 181% year-over-year growth on total MWh production output across all renewable energy projects in our investment portfolio, resulting in a corresponding growth of revenues earned by our investments. This growth was due in large part to the increase in the capital we deployed in commercial solar and wind projects while increasing the diversification of our portfolio geographically, technologically and across various investment grade off-takers. Also contributing to year-over-year growth was the purchase of our first Biomass power plant asset in 2019 where we took advantage of a “special situation” investment opportunity and further increased the technology diversification within our portfolio.
Our strategy of purchasing smaller sub-utility-scale projects where there is less competition from large capital providers continues to enable us to build a highly diversified portfolio. While buying and operating smaller projects creates a lot of challenges versus buying large single projects, we see significant benefits in terms of the investment return potential, the ability to buy pipelines of deals from developers, and the overall scalability of the asset class where solar and wind projects can be purchased to match capital inflows.
The most significant growth by segment over the last three years was in commercial solar with a 272% increase in MWh production from 2017 through 2019. This increase is largely due to our 26 MW utility-scale solar photovoltaic project in California (Midway III) and the 25 MW portfolio of community solar gardens in Colorado (Colorado CSG which is part of the Conic Portfolio) achieving commercial operations status towards the end of 2018 and beginning of 2019. Residential solar notably achieved very little growth (9% year over year) during this same period, which is reflective of our prioritization of large utility and commercial scale wind and solar investments. Towards the end of 2019, we increased our wind portfolio capacity by 188% which will significantly increase our wind production and resulting revenues in 2020. Also, at the end of 2019, we had 19 solar assets under construction which is expected to result in an 80% increase in the value of our commercial solar portfolio in 2020. These projects are expected to achieve commercial operations throughout 2020 and will contribute to the continued growth of production and revenues across our entire portfolio.
For the nine months ended September 30, 2020 and September 30, 2019, the total megawatt hours produced across all renewable energy projects in our investment portfolio were 700,416 MWh and 399,666 MWh respectively. We observed growth of 75% from Q3 2019 to Q3 2020. The most significant growth by segment for the first nine months of 2020 as compared to the first nine months of 2019 was in wind. This increase of 207% year-over-year was largely due to our 30.8 MW project in Minnesota, and our 80.0 MW projects in Iowa, all three of which are included in our Greenbacker Wind Portfolio – Holdco portfolio.
| MWh by Segment | Nine months
ended September 30, 2020 | Nine months
ended September 30, 2019 | Twelve months ended December 31, 2019 | Twelve months ended December 31, 2018 | ||||||||||||
| Commercial Solar | 225,551 | 196,220 | 245,015 | 140,040 | ||||||||||||
| Residential Solar | 4,058 | 27,929 | 32,934 | 30,175 | ||||||||||||
| Wind | 402,447 | 131,271 | 271,118 | 174,765 | ||||||||||||
| Biomass | 68,360 | 44,246 | 67,892 | - | ||||||||||||
| Total | 700,416 | 399,666 | 616,959 | 344,980 | ||||||||||||
72
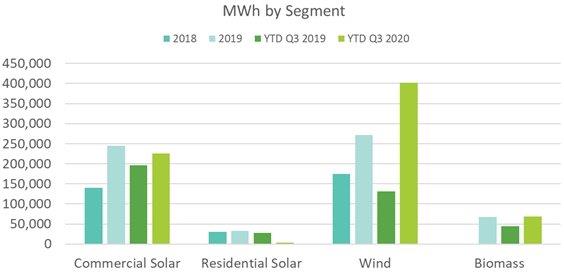
Offering Prices of Our Shares
Based on the net asset value for each quarter ended since Commencement of Operations, the offering price of our shares was adjusted to ensure that the net proceeds per share are no more or less than the then current net asset value per share. The offering prices since inception, and the dates they were effective, are as follows:
| Period | Class | |||||||||||||||||||||
| From | To | A | C | I | P-A | P-I | ||||||||||||||||
| 03-Nov-17 | 05-Feb-18 | $ | 9.74 | $ | 9.09 | $ | 8.94 | N/A | $ | 8.75 | ||||||||||||
| 06-Feb-18 | 06-May-18 | $ | 9.78 | $ | 9.09 | $ | 8.98 | $ | 9.65 | * | $ | 8.81 | ||||||||||
| 07-May-18 | 02-Aug-18 | $ | 9.80 | $ | 9.12 | $ | 9.01 | $ | 9.68 | $ | 8.84 | |||||||||||
| 03-Aug-18 | 31-Oct-18 | $ | 9.83 | $ | 9.17 | $ | 9.03 | $ | 9.69 | $ | 8.90 | |||||||||||
| 01-Nov-18 | 06-Feb-19 | $ | 9.79 | $ | 9.15 | $ | 8.99 | $ | 9.68 | $ | 8.89 | |||||||||||
| 07-Feb-19 | 06-May-19 | $ | 9.63 | $ | 9.01 | $ | 8.84 | $ | 9.50 | ** | $ | 8.76 | ||||||||||
| 07-May-19 | 01-Aug-19 | N/A | N/A | N/A | N/A | $ | 8.76 | |||||||||||||||
| 02-Aug-19 | 08-Nov-19 | N/A | N/A | N/A | N/A | $ | 8.77 | |||||||||||||||
| 09-Nov-19 | 19-Mar-20 | N/A | N/A | N/A | N/A | $ | 8.93 | |||||||||||||||
| 20-Mar-20 | 18-May-20 | N/A | N/A | N/A | N/A | $ | 8.90 | |||||||||||||||
| 19-May-20 | 20-Aug-20 | N/A | N/A | N/A | N/A | $ | 8.95 | |||||||||||||||
| 21-Aug-20 | 01-Nov-20 | N/A | N/A | N/A | N/A | $ | 9.02 | |||||||||||||||
| 02-Nov-20 | - | N/A | N/A | N/A | N/A | $ | 9.02 | |||||||||||||||
| * | Effective April 16, 2018 |
| ** | Ceased February 8, 2019 |
Liquidity and Capital Resources
As of September 30, 2020, and December 31, 2019, the company had $19,556,657 and $9,066,091 in cash and cash equivalents, and restricted cash, respectively. Our current cash balance is generally reflective of the cash necessary to fund normal operations. In 2020, we anticipate continuing to (1) increase our draw on current financing facilities; (2) enter into new financing arrangements and (3) raise additional equity through our current private placement. We use our cash and additional liquidity facilities to fund the acquisition, construction and operation of renewable energy and energy efficiency and sustainable development projects, make investments in renewable energy businesses, repay principal and interest on our borrowings, make distributions to our members and fund our operations. Our primary sources of cash generally consist of:
| ● | the net proceeds from the current offering; |
| ● | dividends, fees, and interest earned from our portfolio of investments, as a result of, among other things, cash flows from a project’s power sales; |
| ● | proceeds from sales of assets and capital repayments from investments; |
| ● | financing fees, retainers and structuring fees; | |
| ● | tax equity capital contributions in partnerships where the company is the managing member; and |
| ● | borrowing capacity under current and future financing sources. |
73
Operating entities of the company, which are accounted for as investments using fair value in the company’s consolidated financial statements under ASC 820, had $344,792,388 and $189,860,244 in outstanding notes payable collateralized by certain assets and membership interests in limited liability companies included in the East to West, Foresight Solar, Conic, Midway III, Eagle Valley, GB Wind HoldCo, Greenbacker Wind – Montana, Trillium, and Turquoise Portfolios as of September 30, 2020 and December 31, 2019, respectively.
Since the company maintains operating control over all entities with debt outstanding, we have included the total amount of the debt outstanding in the below table summarizing notes payable associated with the company’s operating entities as well as the company.
On June 20, 2019, the company, through GREC HoldCo, entered into a new credit agreement, the lenders party thereto and Fifth Third Bank, as administrative agent, as sole lead arranger and sole lead bookrunner, as well as swap counterparty. Since then, the borrowing base amount of the new credit facility (the “New Credit Facility”) based on various solar projects (the “Projects”) that act as collateral for the credit facility has been reduced to $73,248,007 as a result of the revolving loan converting to a term loan. The New Credit Facility allowed for additional drawdowns through June 20, 2020, at which point the outstanding loans converted to a term loan and matures on June 20, 2025.
The company will use the net proceeds of borrowings under the New Credit Facility for investment in additional alternative energy power generation assets that are anticipated to become Projects and for other general corporate purposes. Loans made under the New Credit Facility bear interest at 1.75% in excess of the three-month LIBOR. Until the New Credit Facility converts to a term loan, quarterly commitment fees on the average daily unused portion of the Credit Facility are payable at a rate per annum of 0.50%. In addition to the New Credit Facility, the company has entered into an interest rate swap to hedge the variable interest rate risk on a portion of the New Credit Facility, with current plans to fully hedge the exposure.
Borrowings under the New Credit Facility are back leveraged and secured by all of the assets of GREC HoldCo and the equity interests of each direct and indirect subsidiary of the company. The company, Greenbacker Renewable Energy Corporation and each direct and indirect subsidiary of the company are guarantors of the company’s obligations under the New Credit Facility, and Greenbacker Renewable Energy Corporation has pledged all of the equity interests of the GREC HoldCo as collateral for the New Credit Facility.
As of September 30, 2020, the outstanding balance is approximately $73.2 million. Financing costs of $3.3 million related to the New Credit Facility have been capitalized and are being amortized over the current term of the New Credit Facility.
On January 5, 2018, the company, through GREC HoldCo, entered into a credit agreement by and among the company, the company’s wholly owned subsidiary, GREC, the lenders party thereto and Fifth Third Bank, as administrative agent, as sole lead arranger and sole lead bookrunner, as well as swap counterparty. The credit facility (the “Credit Facility”) consisted of a loan of up to the lesser of $60,000,000 or a borrowing base amount based on various solar projects that act as collateral for the credit facility, of which approximately $25.7 million was drawn down at closing. The Credit Facility allows for additional drawdowns through December 31, 2018 and is scheduled to convert to a term loan with a maturity on January 5, 2024. The New Credit Facility replaced the previous Credit Facility.
In regard to the Credit Facility, the company has entered into five separate interest rate swap agreements. The first swap (“Swap 1”), effective July 29, 2016, has an initial notional amount of $4,300,000 to swap the floating rate interest payments on the original Facility 1 Term Loan for a corresponding fixed payment. The fixed swap rate is 1.11%. The second swap (“Swap 2”), with a trade date of June 15, 2017 and an effective date of June 18, 2018 and an initial notional amount of $20,920,650, was used to swap the floating rate interest payments on an additional principal amount of the Credit Facility, for a corresponding fixed payment. The fixed swap rate is 2.261%. The third swap (“Swap 3”), with a trade date of January 11, 2018 and an effective date of December 31, 2018 and an initial notional amount of $29,624,945 was used to swap the floating rate interest payments on the remaining unhedged portion of the Credit Facility, as well as the estimated additional drawdowns, for a corresponding fixed payment. The fixed swap rate is 2.65%. The fourth swap (“Swap 4”), with a trade date of February 7, 2018 and an effective date of December 31, 2018 and an initial notional amount of $4,180,063 was used to swap the floating rate interest payments on the remaining unhedged portion of the Credit Facility, as well as the estimated additional drawdowns, for a corresponding fixed payment. The fixed swap rate is 2.97%. The fifth swap (“Swap 5”), with a trade date of January 2, 2019 and an effective date of September 30, 2019 and an initial notional amount of $38,203,506 was used to swap the floating rate interest payments on the remaining unhedged portion of the Credit Facility, as well as the estimated additional drawdowns, for a corresponding fixed payment. The fixed swap rate is 2.69%.
If an event of default shall occur and be continuing under the New Credit Facility, the commitments under the New Credit Facility may be terminated and the principal amount outstanding under the New Credit Facility, together with all accrued unpaid interest and other amounts owing in respect thereof, may be declared immediately due and payable.
On December 6, 2019, the company entered into a $15,000,000 revolving letter of credit facility agreement (“LC Facility”) with Fifth Third Bank. The LC Facility has a maturity date of December 6, 2020. On January 30, 2020, the amount of $5.6 million was drawn down. On March 18, 2020, a repayment of $1.9 million was made, reducing the outstanding balance of the facility. On June 9, 2020, a repayment of the remaining outstanding balance occurred. As of September 30, 2020, no additional amounts were drawn down on the LC Facility and the balance of nil remains.
74
The weighted average interest rate on all notes payable outstanding at the company’s operating entities was 2.91% as of September 30, 2020.
The following table summarizes the notes payable balances of the company and its operating entities as of September 30, 2020:
| Interest Rates | ||||||||||||
| Range | Weighted Average | Maturity Dates | September 30, 2020 | |||||||||
| Fixed rate notes payable | 1.905% - 9.088% | 4.20 | % | 12/30/2020 - 9/29/2049 | 62,601,113 | |||||||
| Floating rate notes payable | 1.621% - 4.030% | 2.68 | % | 3/30/2021 - 12/29/2044 | 355,439,282 | |||||||
| 418,040,395 | ||||||||||||
The principal payments due on the notes payable for the company and its’ operating entities for each of the next five years ending December 31 and thereafter are as follows:
| Year ending December 31: | Principal Payments | |||
| 2020 | 47,224,413 | |||
| 2021 | 22,149,424 | |||
| 2022 | 20,035,883 | |||
| 2023 | 20,445,330 | |||
| 2024 | 20,685,654 | |||
| Thereafter | 287,499,691 | |||
| $ | 418,040,395 | |||
In the future, we expect that our ongoing sources of financing will be through corporate-level credit facilities or other secured and unsecured borrowings. In addition, we expect to use other financing methods at the project level as necessary, including joint venture structures, construction loans, property mortgages, letters of credit, sale and leaseback transactions, other lease transactions and other arrangements, any of which may be unsecured or may be secured by mortgages or other interests in our assets. Other sources of capital may include tax equity financings, whereby an investor receives an allocation of tax benefits as well as cash distribution and governmental grants.
Tax equity investors are passive investors, usually large tax-paying financial entities such as banks, insurance companies and utility affiliates that use these investments to reduce future tax liabilities. Depending on the arrangement, until the tax equity investors achieve their agreed upon rate of return, they may be entitled to substantially all of the applicable project’s operating cash flow, as well as substantially all of the project’s ITCs, accelerated depreciation and taxable income or loss. Typically, tax equity financing transactions are structured so that the tax equity investors reach their target return between five and ten years after the applicable project achieves commercial operation.
As a result, a tax equity financing may substantially reduce the cash distributions from the applicable project available for debt service and the period during which the tax equity investors receive most of the cash distributions may last longer than expected if the portfolio company’s energy projects perform below our expectations. While the terms of a tax equity financing may cause cash to be diverted away from the company to the tax equity investor for certain periods specified in the financing arrangement (often five to ten years, measured from commencement of the tax equity financing), then we expect to couple investments where cash is so restrained with other cash flowing investments so as to provide cash for distributions to investors. To maintain a mix of cash flowing and non-cash flowing investments, our investment strategy will involve a combination of several types of investments.
Hedging Activities
In regard to the New Credit Facility, the company has entered into five separate interest rate swap agreements. The first swap (“Swap 1”), effective July 29, 2016, has an initial notional amount of $4,300,000 to swap the floating rate interest payments on the original Facility 1 Term Loan for a corresponding fixed payment. The fixed swap rate is 1.11%. The second swap (“Swap 2”), with a trade date of June 15, 2017 and an effective date of June 18, 2018 and an initial notional amount of $20,920,650, was used to swap the floating rate interest payments on an additional principal amount of the Credit Facility, for a corresponding fixed payment. The fixed swap rate is 2.261%. The third swap (“Swap 3”), with a trade date of January 11, 2018 and an effective date of December 31, 2018 and an initial notional amount of $29,624,945 was used to swap the floating rate interest payments on the remaining unhedged portion of the Credit Facility, as well as the estimated additional drawdowns, for a corresponding fixed payment. The fixed swap rate is 2.65%.
The fourth swap (“Swap 4”), with a trade date of February 7, 2018 and an effective date of December 31, 2018 and an initial notional amount of $4,180,063 was used to swap the floating rate interest payments on the remaining unhedged portion of the Credit Facility, as well as the estimated additional drawdowns, for a corresponding fixed payment. The fixed swap rate is 2.97%. The fifth swap (“Swap 5”), with a trade date of January 2, 2019 and an effective date of September 30, 2019 and an initial notional amount of $38,203,506 was used to swap the floating rate interest payments on the remaining unhedged portion of the Credit Facility, as well as the estimated additional drawdowns, for a corresponding fixed payment. The fixed swap rate is 2.69%.
75
In regard to our investment in the Canadian Northern Lights Portfolio, with 79 solar assets located in and around Toronto, Ontario, Canada, we have foreign currency risk related to our revenue and operating expenses which are denominated in the Canadian Dollars as opposed to the U.S. Dollars. While we are currently of the opinion that the currency fluctuation between the Canadian and U.S. Dollar will not have a material impact on our operating results, we may in the future hedge this risk through the use of currency swap transactions or other financial instruments if the impact on our results of operations becomes material.
Contractual Obligations
While the company does not include a contractual obligations table herein as all obligations of the company are short-term, we have included the following information related to commitments of the company to further assist investors in understanding our outstanding commitments.
Advisory Agreement - GCM, a private firm that is registered as an investment adviser under the Advisers Act, serves as our advisor. Under the direction of our board of directors, GCM manages our day-to-day operations and provides advisory and management services to us. The advisory agreement was previously approved by our board of directors and became effective on April 25, 2014. Unless earlier terminated, the advisory agreement will remain in effect for successive one-year periods if approved annually by a majority of our independent directors. The advisory agreement was most recently re-approved in February 2020, for the one-year period commencing April 24, 2020.
Pursuant to the advisory agreement, GCM is authorized to retain one or more sub-advisors with expertise in our target assets to assist GCM in fulfilling its responsibilities under the advisory agreement. However, GCM will be required to monitor any sub-advisor to ensure that material information discussed by management of any sub-advisor is communicated to our board of directors, as appropriate. If GCM retains any sub-advisor, our advisor will pay such sub-advisor a portion of the fees that it receives from us. We will not pay any additional fees to a sub-advisor. While our advisor will oversee the performance of any sub-advisor, our advisor will remain primarily liable to us to perform all of its duties under the advisory agreement, including those delegated to any sub-advisor. As of September 30, 2020, no sub-advisors have been retained by GCM.
We pay GCM a base management fee for advisory and management services. The base management fee is calculated at a monthly rate of 0.167% (2.00% annually) of our gross assets as defined under the advisory agreement (including certain amounts borrowed). The base management fee monthly rate decreased to 0.14583% (1.75% annually) for gross assets between $800,000,001 to $1,500,000, and 0.125% (1.50% annually) for gross assets greater than $1,500,000. The Special Unitholder, an entity affiliated with our advisor, will hold the special unit in our company entitling it to a performance participation fee, as well as a liquidation performance participation fee, payable upon a listing or a liquidation.
Administration Agreement - Greenbacker Administration serves as our Administrator. Since commencement of operations, Greenbacker Administration delegated certain of its administrative functions to U.S. Bancorp Fund Services, LLC (doing business as “U.S. Bank Global Fund Services”). Greenbacker Administration may enter into similar arrangements with other third-party administrators, including with respect to fund accounting and administrative services. Greenbacker Administration performs certain asset management, compliance and oversight services, as well as asset accounting and administrative services, for the company’s investments. The fee for these services, is billed at cost to the company’s individual investments.
Pledge of Collateral and Unsecured Guarantee of Loans to Subsidiaries: Borrowings under the New Credit Facility are secured by the assets, cash, agreements and equity interests in GREC HoldCo and its subsidiaries. The LLC and GREC are guarantors of GREC HoldCo’s obligations under the New Credit Facility. The amount of the unsecured guaranty on the outstanding principal of the New Credit Facility is approximately $73 million as of September 30, 2020. Pursuant to various loan agreements between the operating entities of the company and various lenders, the operating entities have pledged all operating assets as well as the membership interests in various operating subsidiaries as collateral for the term loans with maturity dates ranging from January 2021 through September 2049.
Investment in to be constructed assets and membership interest purchase commitments: Pursuant to various engineering, procurement and construction contracts and alike agreements to which the company’s operating entities are individually a party, the operating entities, and indirectly the company through pledge of parent company guarantees, have committed an outstanding balance of approximately $70.7 million as of September 30, 2020 to complete construction of the facilities and bring the projects to operation. Based upon current construction schedules, the expectation is these commitments will be fulfilled throughout the remainder of 2020 and forward. In addition, pursuant to various membership interest purchase agreements to which the company’s operating entities are individually a party, the operating entities, and indirectly the company through the pledge of parent company guarantees, have committed an outstanding balance of approximately $195.4 million as of September 30, 2020 to complete the closing pursuant to the membership interest purchase agreements. The company plans to use debt and tax equity financing as well as additional capital raised to fund such commitments.
Renewable Energy Credits: For certain solar power systems in the Conic, East to West Solar, Green Maple, Greenbacker Wind – Massachusetts, Longleaf Solar, Magnolia Sun, Six States, and Trillium Portfolios (the “Portfolios”), the company has received incentives in the form of RECs. In certain cases, the Portfolios have entered into fixed price, fixed volume forward sale transactions to monetize these RECs for specific entities. If we are unable to satisfy the transaction requirements due to lack of production, we may have to purchase RECs on the spot market and/or pay specified replacement cost damages. Based upon current production projection, we do not expect a requirement to purchase RECs to fulfill our current REC sales contracts. If RECs earned by the Portfolios are not sold on a forward basis, they are sold in the spot market with revenue recorded in the accounts of the underlying investment when received.
76
Recording of a sale of RECs under GAAP is accounted for under Accounting Standards Codification Topic 606, Revenue Recognition. There are no differences in the process and related revenue recognition between REC sales to utilities and non-utility customers. Revenue is recorded in our wholly owned, single member LLCs when all revenue recognition criteria are met, including that: there is persuasive evidence that an arrangement exists (typically through a contract), services rendered through the production of electricity, pricing is fixed and determinable under the contract and collectability is reasonably assured. The accounting policy adopted by our wholly owned, single member LLC related to RECs is that the revenue recognition criteria are met when the energy is produced, and a REC is created and transferred to a third party.
If any of our REC counterparties fail to satisfy their contractual obligations, our costs may increase under replacement agreements that may be required. We would also likely incur expenses in locating alternative parties to provide the services we expect to receive under our advisory agreement. For the majority of the forward REC contracts currently effective as of September 30, 2020, GREC and/or the company has provided an unsecured guaranty related to the delivery obligations under these contracts. The amount of the unsecured guaranty on REC contracts is nil as of September 30, 2020.
Pledge of Parent Company Guarantees: Pursuant to various contracts in which the company has provided a parent company guarantee, excluding those discussed above, the operating entities, and indirectly the company, have committed an additional $122.1 million in unsecured guarantees.
We currently have no off-balance sheet arrangements, including any risk management of commodity pricing or other hedging practices.
Distributions
Subject to the board of directors’ review and approval and applicable legal restrictions, we intend to authorize and declare distributions on a quarterly basis and pay distributions on a monthly basis. We will calculate each member’s specific distribution amount for the period using record and declaration dates, and each member’s distributions will begin to accrue on the date we accept each member’s subscription for shares. From time to time, we may also pay interim special distributions in the form of cash or shares, with the approval of our board of directors.
Distributions will be made on all classes of our shares at the same time. The cash distributions with respect to the Class C shares are lower than the cash distributions with respect to Class A, I, P-A and P-I shares because of the distribution fee relating to Class C shares, which will be allocated as a Class C-specific charge. Amounts distributed to each class will be allocated among the holders of our shares in such class in proportion to their shares.
Cash distributions paid during the periods presented were funded from the following sources noted below:
| For the nine months ended September 30, 2020 |
For the nine months ended September 30, 2019 |
|||||||
| Cash from operations | $ | 804,374 | $ | 2,136,045 | ||||
| Offering proceeds | 16,244,967 | 11,800,835 | ||||||
| Total Cash Distributions | $ | 17,049,341 | $ | 13,936,880 | ||||
The company expects to continue to fund distributions from a combination of cash from operations as well as offering proceeds. Due to the company’s change in investment portfolio composition in 2018 to include a greater percentage of pre-operational assets, a significant amount of distributions will continue to be funded from offering proceeds. We expect distributions to generally continue at the current level and we do not currently anticipate significant changes in the level of distributions in future periods.
Inflation
We do not anticipate that inflation will have a significant effect on our results of operations. However, in the event of a significant increase in inflation, interest rates could rise, and our projects and investments may be materially adversely affected.
Seasonality
Certain types of renewable power generation may exhibit seasonal behavior. For example, wind power generation is generally stronger in winter than in summer as wind speed tends to be higher when the weather is colder. In contrast, solar power generation is typically stronger in the summer than in the winter. This is primarily due to the brighter sunshine, longer days and shorter nights of the summer months, which generally result in the highest power output of the year for solar power. Because these seasonal variations are relatively predictable for these types of assets, we factor in the effects of seasonality when analyzing a potential investment in these target assets. Therefore, the impact that seasonality may have on our business, including the cash flows from our investments in our target assets, will depend on the diversity of our investments in renewable energy, energy efficiency and other sustainability related projects in our overall portfolio at such time as we have fully invested the proceeds from our offering.
77
Item 3. Quantitative and Qualitative Disclosures About Market Risk
The following qualitative disclosures regarding our market risk exposures — except for (i) those disclosures that are statements of historical fact and (ii) the descriptions of how we, along with our advisor, manage our primary market risk exposures, constitute forward-looking statements within the meaning of Section 27A of the Securities Act and Section 21E of the Exchange Act. Our primary market risk exposures as well as the strategies used and to be used by the advisor managing such exposures are subject to numerous uncertainties, contingencies and risks, any one of which could cause the actual results of our risk controls to differ materially from the objectives of such strategies. Government interventions, defaults and expropriations, illiquid markets, the emergence of dominant fundamental factors, political upheavals, changes in historical price relationships, an influx of new market participants, increased regulation and many other factors could result in material losses as well as in material changes to our risk exposures and risk management strategies. There can be no assurance that our current market exposure and/or risk management strategies will not change materially or that any such strategies will be effective in either the short or long term. Investors must be prepared to lose all or substantially all their investment in the shares.
We anticipate that our primary market risks will be related to commodity prices, the credit quality of our counterparties and project companies and market interest rates. We will seek to manage these risks while, at the same time, seeking to provide an opportunity for members to realize attractive returns through ownership of our shares.
Commodity price risk. Investments in renewable energy and energy efficiency projects and businesses expose us to volatility in the market prices of electricity. To stabilize our revenue, we generally expect our projects will have PPAs with local utilities and off-takers that ensure that all or most of electricity generated by each project will be purchased at the contracted price. In the event any electricity is not purchased by the off-taker or the energy produced exceeds the off-taker’s capacity, we generally will sell that excess energy to the local utility or another suitable counterparty, which would ensure revenue is generated for all electricity produced. We may be exposed to the risk that the off-taker will fail to perform under the PPA, with the result that we will have to sell our electricity at the market price, which could be disadvantageous.
In regard to the market price of oil, our investments are little effected by the volatility in this market as most oil consumed in the U.S. today is used for transportation infrastructure and not for the generation of electricity.
Credit risk. Through our investments in our target assets, we expect to be indirectly exposed to credit risk relating to counterparties to the electricity sales agreements (including PPAs) for our projects as well as the businesses in which we invest. If counterparties to the electricity sales agreements for our projects or the businesses in which we invest are unable to make payments to us when due, or at all, our financial condition and results of operations could be materially adversely affected. GCM will seek to mitigate this risk by deploying a comprehensive review and asset selection process and careful ongoing monitoring of acquired assets. In addition, we expect our projects will seek contracts with high credit quality counterparties. Nevertheless, unanticipated credit losses could occur which could adversely impact our operating results.
Changes in market interest rates. With respect to our proposed business operations, general increases in interest rates over time may cause the interest expense associated with our borrowings to increase, and the value of our debt investments to decline. Conversely, general decreases in interest rates over time may cause the interest expense associated with our borrowings to decrease, and the value of our debt investments to increase.
Changes in government incentives. Retrospective changes in the levels of government incentives may have a negative impact on current investments. Prospective changes in the levels of government incentives, including renewable energy credits and investment tax credits, may impact the relative attractiveness of future investments in various renewable energy projects, which could make it difficult for GCM to find suitable investments in the sector.
78
Item 4. Controls and Procedures
Disclosure Controls
In accordance with Rules 13a-15(b) and 15d-15(b) of the Securities Exchange Act of 1934, as amended (the “Exchange Act”), we, under the supervision and with the participation of our Chief Executive Officer and Chief Financial Officer, carried out an evaluation of the effectiveness of our disclosure controls and procedures (as defined in Rule 13a-15(e) and Rule 15d-15(e) of the Exchange Act) as of the end of the period covered by this Quarterly Report on Form 10-Q and determined that the disclosure controls and procedures are effective. Our disclosure controls and procedures are designed to provide reasonable assurance that information we are required to disclose in the reports that we file or submit under the Exchange Act are recorded, processed and summarized and reported within the time period specified in the applicable rules and forms.
Change in Internal Control Over Financial Reporting
No change occurred in our internal control over financial reporting (as defined in Rule 13a-15(f) and 15d-15(f) of the Exchange Act) during the period ended September 30, 2020, that has materially affected, or is reasonably likely to materially affect, our internal control over financial reporting.
Limitations on the Effectiveness of Controls
Any control system, no matter how well designed and operated, can only provide reasonable (but not absolute) assurance that its objectives will be met. Furthermore, no evaluation of controls can provide absolute assurance that all control issues and instances of fraud, if any, have been detected.
79
None of us, GCM, or the Administrator, is currently subject to any material legal proceedings, nor, to our knowledge, is any material legal proceeding threatened against us, or against GCM or the Administrator.
There have been no material changes from the risk factors disclosed under the heading “Risk Factors” in the LLC’s annual report on Form 10-K for the year ended December 31, 2019, except as noted below.
Our business is subject to the risk of a potential public health crisis.
A public health crisis, pandemic, epidemic or outbreak of a contagious disease, such as the recent global outbreak of a disease caused by a novel and highly contagious form of coronavirus (COVID-19), could have an adverse impact on global, national and local economies, which in turn could negatively impact us. An outbreak such as COVID-19, and the reactions to such an outbreak, are expected to adversely affect the performance of the U.S. and global economies, including due to market volatility, market and business uncertainty and closures, supply chain and travel interruptions, the need for employees to work at external locations and extensive medical absences among the workforce. Disruptions to commercial activity relating to the imposition of quarantines, stay-at-home orders or travel restrictions (or more generally, a failure of containment efforts) may adversely impact our investments, including by causing supply chain disruptions or by causing staffing shortages, which may negatively impact construction timelines for certain of our to-be-constructed investments. In addition, such restrictions may significantly impair the ability of GCM’s personnel to travel in connection with potential or existing investments of ours or to GCM’s offices, which could negatively impact the ability of GCM to effectively identify, monitor, operate and dispose of investments.
Also, the outbreak of COVID-19 has contributed to, and may continue to contribute to, volatility in financial markets, including changes in interest rates. A continued outbreak may reduce the availability of debt financing to us and potential purchasers of our investments, which could have material and adverse impact on our returns.
As a reaction to such an outbreak, it is possible that governmental fiscal and economic measures will lead to an increase in spending and other forms of financial stimuli, and it is difficult to predict what effect such measures will have on our business. The market for electricity generation and consumption projects is influenced by U.S. federal, state and local government regulations and policies concerning the electric utility industry, and it is unclear the extent to which any new governmental measures in response to the COVID-19 outbreak will address the risks faced by the renewable energy industry.
The impact of a public health crisis such as COVID-19 (or any future pandemic, epidemic or outbreak of a contagious disease) is difficult to predict, which presents material uncertainty and risk with respect to our performance.
Item 2. Unregistered Sales of Equity Securities and Use of Proceeds
During the nine months ended September 30, 2020, the company sold 10,853,812 Class P-I shares under a private placement memorandum. During the year ended December 31, 2019, the company sold 2,631 Class P-A shares and 9,631,640 Class P-I shares under a private placement memorandum. During the year ended December 31, 2018, the company sold 15,478 Class P-A shares and 8,469,306 Class P-I shares under a private placement memorandum. During the year ended December 31, 2017, the company sold 3,092 Class P-A shares and 3,198,559 Class P-I shares under a private placement memorandum.
Item 3. Defaults Upon Senior Securities
Not applicable.
Item 4. Mine Safety Disclosures
Not applicable.
Not applicable.
80
| * | Filed previously. |
| ** | Filed herewith. |
81
Pursuant to the requirements of the Securities Exchange Act of 1934, the registrant has duly caused this report to be signed on its behalf by the undersigned, thereunto duly authorized.
| Date: November 17, 2020 | By | /s/ Charles Wheeler |
| Charles Wheeler | ||
| Chief Executive Officer and Director | ||
| (Principal Executive Officer) | ||
| Greenbacker Renewable Energy Company LLC | ||
| Date: November 17, 2020 | By | /s/ Richard C. Butt |
| Richard C. Butt | ||
| Chief
Financial Officer and Principal Accounting Officer | ||
| (Principal Financial and Accounting Officer) | ||
| Greenbacker Renewable Energy Company LLC |
82