Attached files
| file | filename |
|---|---|
| 8-K - 8-K - UWM Holdings Corp | d72619d8k.htm |
Exhibit 99.1 ANALYST DAY Analyst Day Nov 2020 1Exhibit 99.1 ANALYST DAY Analyst Day Nov 2020 1

DISCLAIMER This presentation contains forward-looking information within the meaning of applicable United States securities legislation. All information contained in this presentation, other than statements of current and historical fact, is forward- looking information. Often, but not always, forward-looking information can be identified by the use of words such as “plans”, “expects”, “budget”, “guidance”, “scheduled”, “estimates”, “forecasts”, “strategy”, “target”, “intends”, “objective”, “goal”, “understands”, “anticipates” and “believes” (and variations of these or similar words) and statements that certain actions, events or results “may”, “could”, “would”, “should”, “might” “occur” or “be achieved” or “will be taken” (and variations of these or similar expressions). All of the forward-looking information in this presentation is qualified by this cautionary note. This information involves known and unknown risks, uncertainties and other important factors that may cause our actual results, performance or achievements to be materially different from those set forth in the preceding forward-looking statements. Important factors that could cause our results to vary from expectations include, but are not limited to (1) our dependence on macroeconomic and U.S. residential real estate market conditions, including changes in U.S. monetary policies that affect interest rates, (2) changes in the GSEs’, FHA, USDA and VA guidelines or GSE and Ginnie Mae guarantees, (3) our inability to continue to grow, or to effectively manage the growth of, our loan origination volume, (4) our ability to continue to attract and retain our broker and loan officer relationships, (5) fines or other penalties associated with the conduct of Independent Mortgage Advisors, (6) the unique challenges posed to our business by the COVID-19 pandemic and the impact of governmental actions taken in response to the pandemic on our ability to originate mortgages, our servicing operations, our liquidity and our employees, (7) the occurrence of a data breach or other failure of our cybersecurity, (8) losses of key management, (9) our inability to recover servicing advances, (10) intense competition in the mortgage industry, (11) our ability to adapt to and implement technological change, (12) loss of intellectual property rights, (13) risks arising from the reliance on our proprietary technology to manage and grow our business, (14) risk of counterparty terminating servicing rights and contracts, (15) our reliance on our warehouse facilities to fund mortgage loans and otherwise operate our business, leveraging of assets under these facilities and the risk of a decrease in the value of the collateral underlying certain of our facilities causing an unanticipated margin call, (16) our ability to sell loans in the secondary market, including to the GSEs (Fannie Mae and Freddie Mac), and to securitize our loans into MBS through the GSEs and Ginnie Mae, (17) the risk that an increase in the value of the MBSs we sell in forward markets to hedge our pipeline may result in an unanticipated margin call, (18) errors or the ineffectiveness of internal and external models we rely on to manage risk and make business decisions, (19) noncompliance with an increasing and inconsistent body of complex laws and regulations regarding data privacy, at the U.S. federal, state and local levels, (20) our ability to continue to comply with the complex state and federal laws regulations or practices applicable to mortgage loan origination and servicing in general, including maintaining the appropriate state licenses, managing the costs and operational risk associated with material changes to such laws, (21) liability to third parties as a result of a data breach or misappropriation of personal information and (22) other factors referenced in or reasonably inferred from the offering memorandum. These factors should not be construed as exhaustive and should be read in conjunction with the other cautionary statements that are included in the offering memorandum. All of the factors are difficult to predict, contain uncertainties that may materially affect actual results, and may be beyond our control. New factors emerge from time to time, and it is not possible for our management to predict all such factors or to assess the effect of each such new factor on our business. Although we believe that the assumptions underlying the forward-looking statements contained herein are reasonable, any of the assumptions could be inaccurate, and therefore any of these statements included herein may prove to be inaccurate. In light of the significant uncertainties inherent in the forward-looking statements included herein, the inclusion of such information should not be regarded as a representation by us or any other person that the results or conditions described in such statements or our objectives and plans will be achieved. If one or more of these or other risks or uncertainties materialize or if our underlying assumptions prove to be incorrect, our actual results may vary materially from what we may have expressed or implied by these forward-looking statements. We caution that you should not place undue reliance on any of our forward-looking statements. You should specifically consider the factors identified in the offering memorandum that could cause actual results to differ. This presentation contains Non-GAAP financial metrics including, but not limited to Adjusted EBITDA. For a detailed description of Adjusted EBITDA, please refer to the appendix section of this presentation. Analyst Day Nov 2020 2DISCLAIMER This presentation contains forward-looking information within the meaning of applicable United States securities legislation. All information contained in this presentation, other than statements of current and historical fact, is forward- looking information. Often, but not always, forward-looking information can be identified by the use of words such as “plans”, “expects”, “budget”, “guidance”, “scheduled”, “estimates”, “forecasts”, “strategy”, “target”, “intends”, “objective”, “goal”, “understands”, “anticipates” and “believes” (and variations of these or similar words) and statements that certain actions, events or results “may”, “could”, “would”, “should”, “might” “occur” or “be achieved” or “will be taken” (and variations of these or similar expressions). All of the forward-looking information in this presentation is qualified by this cautionary note. This information involves known and unknown risks, uncertainties and other important factors that may cause our actual results, performance or achievements to be materially different from those set forth in the preceding forward-looking statements. Important factors that could cause our results to vary from expectations include, but are not limited to (1) our dependence on macroeconomic and U.S. residential real estate market conditions, including changes in U.S. monetary policies that affect interest rates, (2) changes in the GSEs’, FHA, USDA and VA guidelines or GSE and Ginnie Mae guarantees, (3) our inability to continue to grow, or to effectively manage the growth of, our loan origination volume, (4) our ability to continue to attract and retain our broker and loan officer relationships, (5) fines or other penalties associated with the conduct of Independent Mortgage Advisors, (6) the unique challenges posed to our business by the COVID-19 pandemic and the impact of governmental actions taken in response to the pandemic on our ability to originate mortgages, our servicing operations, our liquidity and our employees, (7) the occurrence of a data breach or other failure of our cybersecurity, (8) losses of key management, (9) our inability to recover servicing advances, (10) intense competition in the mortgage industry, (11) our ability to adapt to and implement technological change, (12) loss of intellectual property rights, (13) risks arising from the reliance on our proprietary technology to manage and grow our business, (14) risk of counterparty terminating servicing rights and contracts, (15) our reliance on our warehouse facilities to fund mortgage loans and otherwise operate our business, leveraging of assets under these facilities and the risk of a decrease in the value of the collateral underlying certain of our facilities causing an unanticipated margin call, (16) our ability to sell loans in the secondary market, including to the GSEs (Fannie Mae and Freddie Mac), and to securitize our loans into MBS through the GSEs and Ginnie Mae, (17) the risk that an increase in the value of the MBSs we sell in forward markets to hedge our pipeline may result in an unanticipated margin call, (18) errors or the ineffectiveness of internal and external models we rely on to manage risk and make business decisions, (19) noncompliance with an increasing and inconsistent body of complex laws and regulations regarding data privacy, at the U.S. federal, state and local levels, (20) our ability to continue to comply with the complex state and federal laws regulations or practices applicable to mortgage loan origination and servicing in general, including maintaining the appropriate state licenses, managing the costs and operational risk associated with material changes to such laws, (21) liability to third parties as a result of a data breach or misappropriation of personal information and (22) other factors referenced in or reasonably inferred from the offering memorandum. These factors should not be construed as exhaustive and should be read in conjunction with the other cautionary statements that are included in the offering memorandum. All of the factors are difficult to predict, contain uncertainties that may materially affect actual results, and may be beyond our control. New factors emerge from time to time, and it is not possible for our management to predict all such factors or to assess the effect of each such new factor on our business. Although we believe that the assumptions underlying the forward-looking statements contained herein are reasonable, any of the assumptions could be inaccurate, and therefore any of these statements included herein may prove to be inaccurate. In light of the significant uncertainties inherent in the forward-looking statements included herein, the inclusion of such information should not be regarded as a representation by us or any other person that the results or conditions described in such statements or our objectives and plans will be achieved. If one or more of these or other risks or uncertainties materialize or if our underlying assumptions prove to be incorrect, our actual results may vary materially from what we may have expressed or implied by these forward-looking statements. We caution that you should not place undue reliance on any of our forward-looking statements. You should specifically consider the factors identified in the offering memorandum that could cause actual results to differ. This presentation contains Non-GAAP financial metrics including, but not limited to Adjusted EBITDA. For a detailed description of Adjusted EBITDA, please refer to the appendix section of this presentation. Analyst Day Nov 2020 2
PROXY SOLICITATION Additional Information about the Proposed Business Combination and Where to Find It On October 2, 2020, and as amended on November 6, 2020, the Company filed with the Securities and Exchange Commission (the “SEC”) a preliminary proxy statement in connection with the proposed business combination contemplated by the Business Combination Agreement and will mail a definitive proxy statement and other relevant documents to its stockholders once it is available. The definitive proxy statement will contain important information about the proposed business combination contemplated by the Business Combination Agreement and the other matters to be voted upon at a meeting of stockholders of the Company to be held to approve the proposed business combination contemplated by the Business Combination Agreement and other matters (the “Special Meeting”). Company stockholders and other interested persons are advised to read the preliminary proxy statement, as well as any amendments or supplements thereto, and the definitive proxy statement, when available, in connection with the Company’s solicitation of proxies for the Special Meeting because they will contain important information about the proposed business combination. When available, the definitive proxy statement will be mailed to the Company’s stockholders as of a record date to be established for voting on the proposed business combination contemplated by the Business Combination Agreement and the other matters to be voted upon at the Special Meeting. Company stockholders will also be able to obtain copies of the proxy statement, without charge, once available, at the SEC’s website at www.sec.gov or by directing a request to: Gores Holdings IV, Inc., 9800 Wilshire Boulevard, Beverly Hills, CA 90212, attention: Jennifer Kwon Chou (jchou@gores.com). Participants in Solicitation The Company, UWM and their respective directors and officers may be deemed participants in the solicitation of proxies of Company stockholders in connection with the proposed business combination. Company stockholders and other interested persons may obtain, without charge, more detailed information regarding the directors and officers of the Company in the Company’s Annual Report on Form 10-K for the fiscal year ended December 31, 2019, which was filed with the SEC on March 27, 2020. Information regarding the persons who may, under SEC rules, be deemed participants in the solicitation of proxies to Company stockholders in connection with the proposed business combination contemplated by the Business Combination Agreement and other matters to be voted upon at the Special Meeting will be set forth in the proxy statement for the proposed business combination when available. Additional information regarding the interests of participants in the solicitation of proxies in connection with the proposed business combination will be included in the proxy statement that the Company intends to file with the SEC. Analyst Day Nov 2020 3PROXY SOLICITATION Additional Information about the Proposed Business Combination and Where to Find It On October 2, 2020, and as amended on November 6, 2020, the Company filed with the Securities and Exchange Commission (the “SEC”) a preliminary proxy statement in connection with the proposed business combination contemplated by the Business Combination Agreement and will mail a definitive proxy statement and other relevant documents to its stockholders once it is available. The definitive proxy statement will contain important information about the proposed business combination contemplated by the Business Combination Agreement and the other matters to be voted upon at a meeting of stockholders of the Company to be held to approve the proposed business combination contemplated by the Business Combination Agreement and other matters (the “Special Meeting”). Company stockholders and other interested persons are advised to read the preliminary proxy statement, as well as any amendments or supplements thereto, and the definitive proxy statement, when available, in connection with the Company’s solicitation of proxies for the Special Meeting because they will contain important information about the proposed business combination. When available, the definitive proxy statement will be mailed to the Company’s stockholders as of a record date to be established for voting on the proposed business combination contemplated by the Business Combination Agreement and the other matters to be voted upon at the Special Meeting. Company stockholders will also be able to obtain copies of the proxy statement, without charge, once available, at the SEC’s website at www.sec.gov or by directing a request to: Gores Holdings IV, Inc., 9800 Wilshire Boulevard, Beverly Hills, CA 90212, attention: Jennifer Kwon Chou (jchou@gores.com). Participants in Solicitation The Company, UWM and their respective directors and officers may be deemed participants in the solicitation of proxies of Company stockholders in connection with the proposed business combination. Company stockholders and other interested persons may obtain, without charge, more detailed information regarding the directors and officers of the Company in the Company’s Annual Report on Form 10-K for the fiscal year ended December 31, 2019, which was filed with the SEC on March 27, 2020. Information regarding the persons who may, under SEC rules, be deemed participants in the solicitation of proxies to Company stockholders in connection with the proposed business combination contemplated by the Business Combination Agreement and other matters to be voted upon at the Special Meeting will be set forth in the proxy statement for the proposed business combination when available. Additional information regarding the interests of participants in the solicitation of proxies in connection with the proposed business combination will be included in the proxy statement that the Company intends to file with the SEC. Analyst Day Nov 2020 3

Analyst Day Nov 2020 4Analyst Day Nov 2020 4

AGENDA Company & Industry Overview 01 Mat Ishbia | President & CEO Underwriting, Operations & Client Experience 02 Melinda Wilner | EVP, Chief Operating Officer Technology Featuring: Jason Bressler | EVP, Chief Technology Officer 03 Interviewed By: Sarah DeCiantis | EVP, Chief Marketing Officer Client Growth Alex Elezaj | EVP, Chief Strategy Officer 04 Financial Review Tim Forrester | EVP, Chief Financial Officer 05 Matt Roslin | EVP, Investor Relations & Legal Affairs Q & A 06 Moderated By: Lee Jelenic | EVP, Chief Innovation Officer Analyst Day Nov 2020 5AGENDA Company & Industry Overview 01 Mat Ishbia | President & CEO Underwriting, Operations & Client Experience 02 Melinda Wilner | EVP, Chief Operating Officer Technology Featuring: Jason Bressler | EVP, Chief Technology Officer 03 Interviewed By: Sarah DeCiantis | EVP, Chief Marketing Officer Client Growth Alex Elezaj | EVP, Chief Strategy Officer 04 Financial Review Tim Forrester | EVP, Chief Financial Officer 05 Matt Roslin | EVP, Investor Relations & Legal Affairs Q & A 06 Moderated By: Lee Jelenic | EVP, Chief Innovation Officer Analyst Day Nov 2020 5
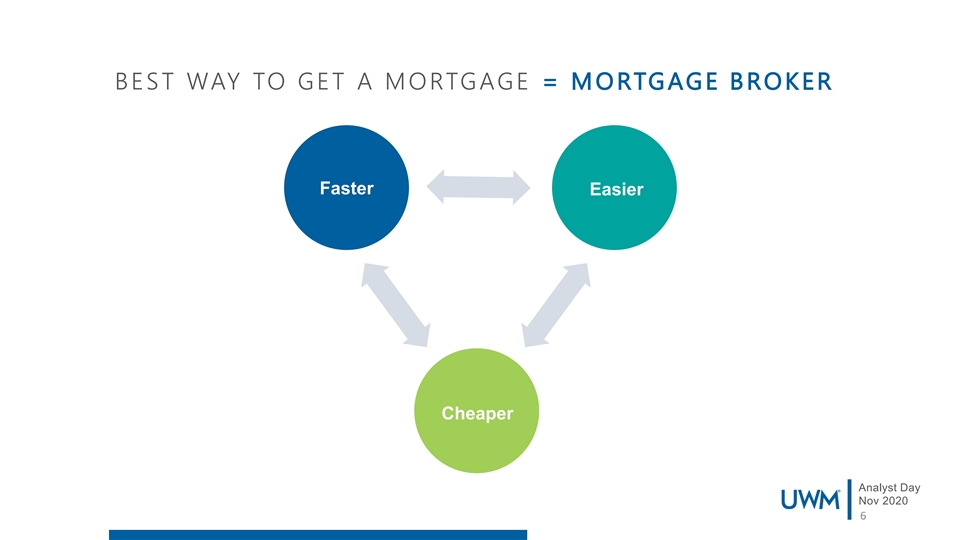
BEST WAY TO GET A MORTGAGE = MORTGAGE BROKER Faster Easier Cheaper Analyst Day Nov 2020 6BEST WAY TO GET A MORTGAGE = MORTGAGE BROKER Faster Easier Cheaper Analyst Day Nov 2020 6

UWM IS THE LARGEST WHOLESALE ORIGINATOR WITH DOMINANT MARKET POSITION th • Company was started in 1986 – Mat joins UWM in 2003 as the 12 person (1) • We are the #2 mortgage originator and the 33% $2.0B #1 wholesale originator in the U.S. Wholesale mortgage Book Value originations through Q3 2020 • Originated $54B in 3Q20 for an annualized run-rate Q2 2020 of $216B in production volume • Mission driven to serve independent mortgage advisors across all 50 states and Washington D.C. • B2B model resulting in direct relationship with +86 $2.0B 30,000+ loan officers (2) Net Promoter Score YTD Q3 2020 • Best-In-Class technology and service offering driven by 1,005 Earnings technology professionals • High-velocity, low credit risk balance sheet • Single campus, based In Pontiac, Michigan; 7,080 team members Analyst Day Source: HMDA, IMF, company materials Nov 2020 Notes: 1. Represents direct lenders market share as of Q2 2020 | 2. UWM NPS calculated as a simple avg. of 2017-2020YTD 7UWM IS THE LARGEST WHOLESALE ORIGINATOR WITH DOMINANT MARKET POSITION th • Company was started in 1986 – Mat joins UWM in 2003 as the 12 person (1) • We are the #2 mortgage originator and the 33% $2.0B #1 wholesale originator in the U.S. Wholesale mortgage Book Value originations through Q3 2020 • Originated $54B in 3Q20 for an annualized run-rate Q2 2020 of $216B in production volume • Mission driven to serve independent mortgage advisors across all 50 states and Washington D.C. • B2B model resulting in direct relationship with +86 $2.0B 30,000+ loan officers (2) Net Promoter Score YTD Q3 2020 • Best-In-Class technology and service offering driven by 1,005 Earnings technology professionals • High-velocity, low credit risk balance sheet • Single campus, based In Pontiac, Michigan; 7,080 team members Analyst Day Source: HMDA, IMF, company materials Nov 2020 Notes: 1. Represents direct lenders market share as of Q2 2020 | 2. UWM NPS calculated as a simple avg. of 2017-2020YTD 7

IMPORTANCE OF COMPANY CULTURE Capitalizing on lessons learned by being on an NCAA National Championship basketball team, UWM is run like a successful sports team with captains, daily huddles and a team culture. Analyst Day Nov 2020 8IMPORTANCE OF COMPANY CULTURE Capitalizing on lessons learned by being on an NCAA National Championship basketball team, UWM is run like a successful sports team with captains, daily huddles and a team culture. Analyst Day Nov 2020 8

Our Pillars PILLAR 1 PILLAR 2 Our people are Service is everyone’s UWM’s our greatest asset responsibility VALUE SYSTEM Our Mission Statement PILLAR 4 PILLAR 3 We are dream makers united to make dreams We are We are thumb pointers come true relationship driven, not not transaction finger pointers for homeowners, mortgage brokers, our driven community, our team members and their families. PILLAR 5 PILLAR 6 Continuous Our path is paved with fun improvement is and friendship essential for long term Analyst Day success Nov 2020 9Our Pillars PILLAR 1 PILLAR 2 Our people are Service is everyone’s UWM’s our greatest asset responsibility VALUE SYSTEM Our Mission Statement PILLAR 4 PILLAR 3 We are dream makers united to make dreams We are We are thumb pointers come true relationship driven, not not transaction finger pointers for homeowners, mortgage brokers, our driven community, our team members and their families. PILLAR 5 PILLAR 6 Continuous Our path is paved with fun improvement is and friendship essential for long term Analyst Day success Nov 2020 9
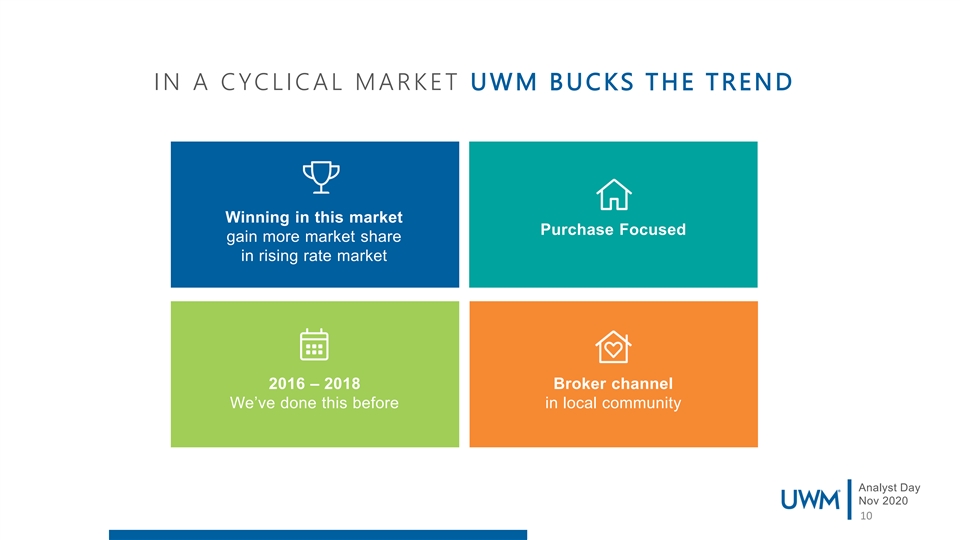
IN A CYCLICAL MARKET UWM BUCKS THE TREND Winning in this market Purchase Focused gain more market share in rising rate market 2016 – 2018 Broker channel We’ve done this before in local community Analyst Day Nov 2020 10IN A CYCLICAL MARKET UWM BUCKS THE TREND Winning in this market Purchase Focused gain more market share in rising rate market 2016 – 2018 Broker channel We’ve done this before in local community Analyst Day Nov 2020 10

FASTER EASIER Closings Technology UWM - 17 days Process Industry - 47 days Service UWM’s MODEL IS TIED TO MORTGAGE CHEAPER BROKERS Q3 Interest Rates UWM - 2.83% Retail - 3.13% Analyst Day Nov 2020 11FASTER EASIER Closings Technology UWM - 17 days Process Industry - 47 days Service UWM’s MODEL IS TIED TO MORTGAGE CHEAPER BROKERS Q3 Interest Rates UWM - 2.83% Retail - 3.13% Analyst Day Nov 2020 11

WHOLESALE CHANNEL SHARE OF THE MORTGAGE MARKET 35% 33% 33% 33% + 32% 30% 30% 28% 27% 26% 25% 23% 21% 20% 19% 20% 17% 16% 16% 15% 15% 15% 14% 14% 15% 10% 5% 0% 2008 2009 2010 2011 2012 2013 2014 2015 2016 2017 2018 2019 2020E 2021E 2022E 2023E 2024E 2025E 2026E Analyst Day Source: Inside Mortgage Finance; Wholesale Channel Market Share of Direct Funded Loans Nov 2020 12WHOLESALE CHANNEL SHARE OF THE MORTGAGE MARKET 35% 33% 33% 33% + 32% 30% 30% 28% 27% 26% 25% 23% 21% 20% 19% 20% 17% 16% 16% 15% 15% 15% 14% 14% 15% 10% 5% 0% 2008 2009 2010 2011 2012 2013 2014 2015 2016 2017 2018 2019 2020E 2021E 2022E 2023E 2024E 2025E 2026E Analyst Day Source: Inside Mortgage Finance; Wholesale Channel Market Share of Direct Funded Loans Nov 2020 12

Wholesale Share of Overall Market and UWM Share 33% 33% DOMINATE WITH 21% 22% 20% SERVICE, 17% 16% 15% 15% 14% TECHNOLOGY 15% 11% & PARTNERSHIP 8% 7% 2014 2015 2016 2017 2018 2019 2020E 2026E Analyst Day Source: IMF data (historicals), Wall Street Research, MBA and Fannie Mae estimates (overall market), Company estimates (wholesale share) Nov 2020 13Wholesale Share of Overall Market and UWM Share 33% 33% DOMINATE WITH 21% 22% 20% SERVICE, 17% 16% 15% 15% 14% TECHNOLOGY 15% 11% & PARTNERSHIP 8% 7% 2014 2015 2016 2017 2018 2019 2020E 2026E Analyst Day Source: IMF data (historicals), Wall Street Research, MBA and Fannie Mae estimates (overall market), Company estimates (wholesale share) Nov 2020 13

1 2 3 LEVEL Access to Liquidity Servicing Resources THE 4 5 PLAYING Borrower Technology Education FIELD Analyst Day Nov 2020 141 2 3 LEVEL Access to Liquidity Servicing Resources THE 4 5 PLAYING Borrower Technology Education FIELD Analyst Day Nov 2020 14

BE THE BEST TOGETHER WE WILL NEVER RELAX Analyst Day Nov 2020 15BE THE BEST TOGETHER WE WILL NEVER RELAX Analyst Day Nov 2020 15

Analyst Day Nov 2020 16Analyst Day Nov 2020 16

FASTER, EASIER & CHEAPER Faster Close Time More Efficient Application to Ready-to-Close 2019 Avg. Loans per Month per Production Team Member ~17 Days 8.8 Application to Ready-to-Close 6.7 29 Days 2.3 Application to Ready-to-Close Industry Avg. ~47 Days UWM Rocket MBA Avg. Analyst Day Source: MBA; Ellie Mae Origination Insight Report Sept. 2020; Rocket S-1 Nov 2020 Notes: 1. UWM data represents LTM July 2020; Rocket data represents 2020 Q1 17FASTER, EASIER & CHEAPER Faster Close Time More Efficient Application to Ready-to-Close 2019 Avg. Loans per Month per Production Team Member ~17 Days 8.8 Application to Ready-to-Close 6.7 29 Days 2.3 Application to Ready-to-Close Industry Avg. ~47 Days UWM Rocket MBA Avg. Analyst Day Source: MBA; Ellie Mae Origination Insight Report Sept. 2020; Rocket S-1 Nov 2020 Notes: 1. UWM data represents LTM July 2020; Rocket data represents 2020 Q1 17
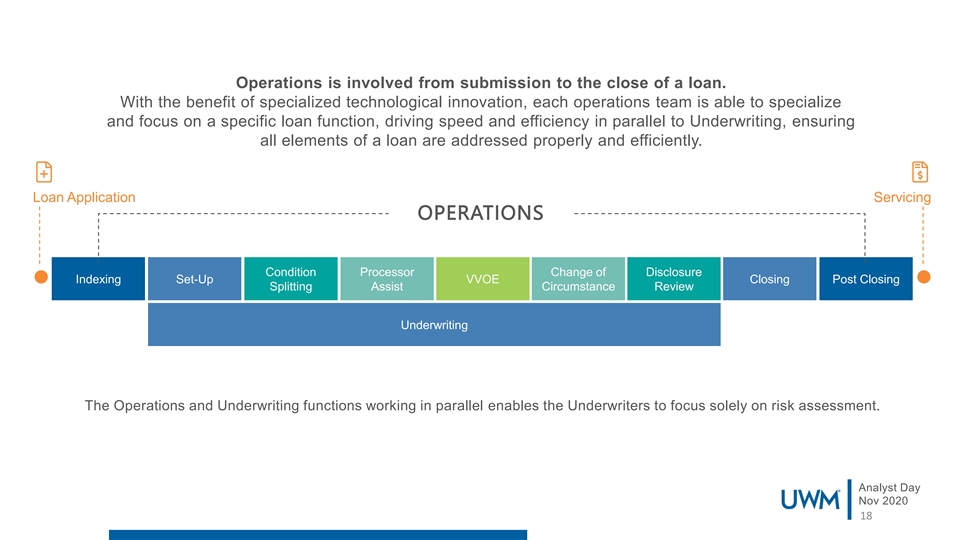
Operations is involved from submission to the close of a loan. With the benefit of specialized technological innovation, each operations team is able to specialize and focus on a specific loan function, driving speed and efficiency in parallel to Underwriting, ensuring all elements of a loan are addressed properly and efficiently. Loan Application Servicing OPERATIONS a a Condition Processor Change of Disclosure Indexing Set-Up VVOE Closing Post Closing Splitting Assist Circumstance Review Underwriting The Operations and Underwriting functions working in parallel enables the Underwriters to focus solely on risk assessment. Analyst Day Nov 2020 18Operations is involved from submission to the close of a loan. With the benefit of specialized technological innovation, each operations team is able to specialize and focus on a specific loan function, driving speed and efficiency in parallel to Underwriting, ensuring all elements of a loan are addressed properly and efficiently. Loan Application Servicing OPERATIONS a a Condition Processor Change of Disclosure Indexing Set-Up VVOE Closing Post Closing Splitting Assist Circumstance Review Underwriting The Operations and Underwriting functions working in parallel enables the Underwriters to focus solely on risk assessment. Analyst Day Nov 2020 18

SCALE & CONSISTENCY DELIVERS SPEED Efficiency Training The Underwriting training process is ongoing, holistic and made to scale UWM Operations and Underwriting team members are the most efficient in the industry averaging about 3.5 times 280 51 the industry production hours of hours of continuous initial training training annually per Underwriter per Underwriter Analyst Day Source: MBA, Internal data Nov 2020 19SCALE & CONSISTENCY DELIVERS SPEED Efficiency Training The Underwriting training process is ongoing, holistic and made to scale UWM Operations and Underwriting team members are the most efficient in the industry averaging about 3.5 times 280 51 the industry production hours of hours of continuous initial training training annually per Underwriter per Underwriter Analyst Day Source: MBA, Internal data Nov 2020 19

LO A N QU ALIT Y High Quality Credit Focus • Our focus on high quality borrowers and lower risk loans 757 drives tremendous scalability FICO Average • Underwriting quality and speed are not mutually exclusive 36%71% Loan-to- • Average FICO consistently top 3 amongst peers Debt-to- Value (LTV) Income (DTI) Average Average Analyst Day Note: Averages are 2020 YTD through October Nov 2020 20LO A N QU ALIT Y High Quality Credit Focus • Our focus on high quality borrowers and lower risk loans 757 drives tremendous scalability FICO Average • Underwriting quality and speed are not mutually exclusive 36%71% Loan-to- • Average FICO consistently top 3 amongst peers Debt-to- Value (LTV) Income (DTI) Average Average Analyst Day Note: Averages are 2020 YTD through October Nov 2020 20
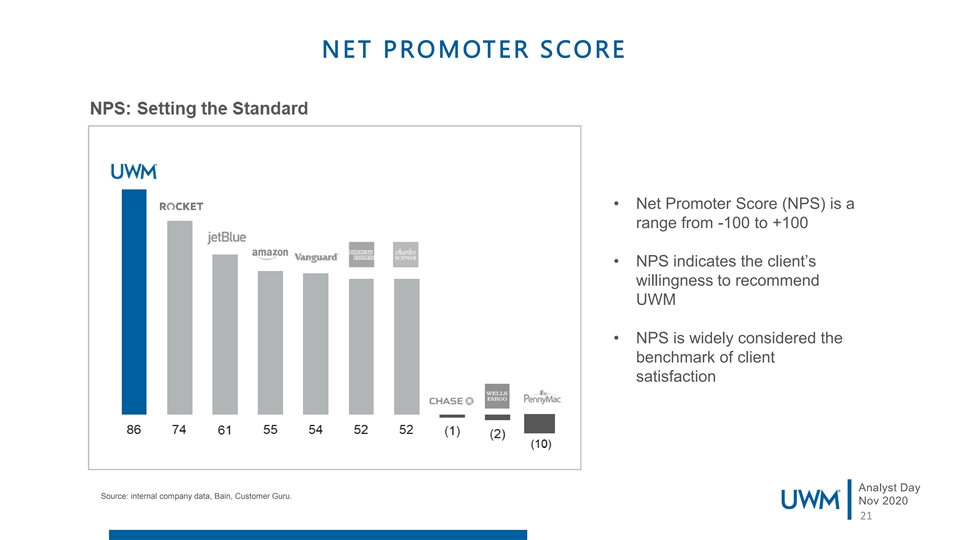
NET PROMOTER SCORE • Net Promoter Score (NPS) is a range from -100 to +100 • NPS indicates the client’s willingness to recommend UWM • NPS is widely considered the benchmark of client satisfaction Analyst Day Source: internal company data, Bain, Customer Guru. Nov 2020 21NET PROMOTER SCORE • Net Promoter Score (NPS) is a range from -100 to +100 • NPS indicates the client’s willingness to recommend UWM • NPS is widely considered the benchmark of client satisfaction Analyst Day Source: internal company data, Bain, Customer Guru. Nov 2020 21

CLIENT EXPERIENCE DRIVING SATISFACTION & LOYALT Y No Call Left Behind Client Request (CR) Platform A homegrown system where clients Every inbound call to can send specific requests to any Add visual What UWM is answered team within the company, regarding a by a human being question or issue on a loan. Our SLA is 4 hours, with 85% solved in 2 hours Every client, every CRs have proven to be our the most Why issue, deserves a efficient form of client engagement. human touch We close 4,000 plus per day It starts with a warm Clients choose from a menu of transfer to ‘the right How categories and sub-categories, which person’ from our in- are routed to the appropriate team house call center Analyst Day Nov 2020 22CLIENT EXPERIENCE DRIVING SATISFACTION & LOYALT Y No Call Left Behind Client Request (CR) Platform A homegrown system where clients Every inbound call to can send specific requests to any Add visual What UWM is answered team within the company, regarding a by a human being question or issue on a loan. Our SLA is 4 hours, with 85% solved in 2 hours Every client, every CRs have proven to be our the most Why issue, deserves a efficient form of client engagement. human touch We close 4,000 plus per day It starts with a warm Clients choose from a menu of transfer to ‘the right How categories and sub-categories, which person’ from our in- are routed to the appropriate team house call center Analyst Day Nov 2020 22

Faster Easier Mortgage OUR Broker WINNING FORMULA Cheaper Analyst Day Nov 2020 23Faster Easier Mortgage OUR Broker WINNING FORMULA Cheaper Analyst Day Nov 2020 23

Analyst Day Nov 2020 24Analyst Day Nov 2020 24

Analyst Day Nov 2020 25Analyst Day Nov 2020 25
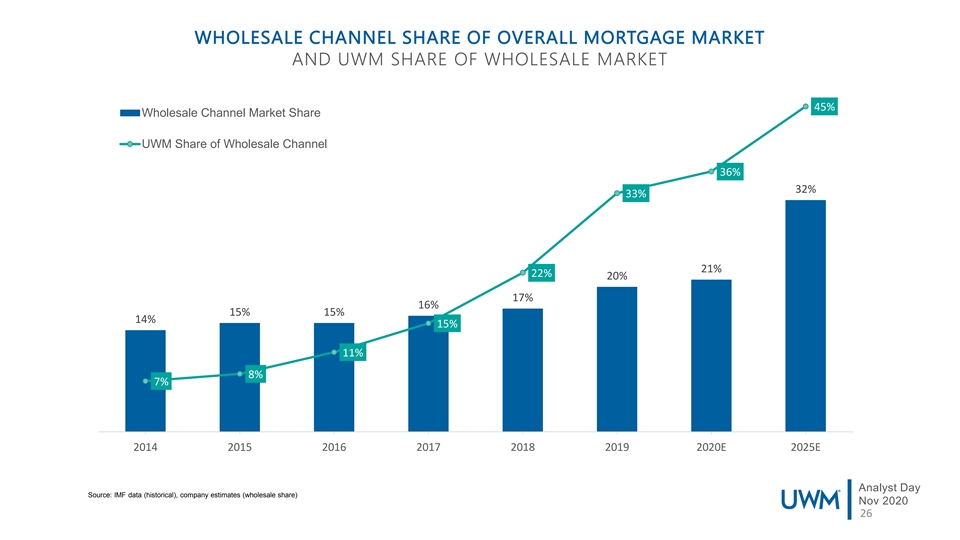
WHOLESALE CHANNEL SHARE OF OVERALL MORTGAGE MARKET AND UWM SHARE OF WHOLESALE MARKET 45% Wholesale Channel Market Share UWM Share of Wholesale Channel 36% 32% 33% 21% 22% 20% 17% 16% 15% 15% 14% 15% 11% 8% 7% 2014 2015 2016 2017 2018 2019 2020E 2025E Analyst Day Source: IMF data (historical), company estimates (wholesale share) Nov 2020 26WHOLESALE CHANNEL SHARE OF OVERALL MORTGAGE MARKET AND UWM SHARE OF WHOLESALE MARKET 45% Wholesale Channel Market Share UWM Share of Wholesale Channel 36% 32% 33% 21% 22% 20% 17% 16% 15% 15% 14% 15% 11% 8% 7% 2014 2015 2016 2017 2018 2019 2020E 2025E Analyst Day Source: IMF data (historical), company estimates (wholesale share) Nov 2020 26

UWM DELIVERS A BEST -IN-CL ASS BROKER EXPERIENCE With Plenty of Room to Grow White Glove Service at Lightning Speed Leading Edge Technology 100% Focused on the Broker Channel Unique Loan Officers and Further Growth Opportunity Diversified Platform 70,000 2020 YTD Revenue Contribution 63,000 60,000 48,749 50,000 Top 5 Brokers 4% 40,000 Top 6-20 Brokers 6% 35,000 32,212 32,226 All Other Brokers 90% 29,521 26,717 30,000 23,661 20,518 20,000 20,000 16,519 13,115 12,456 10,544 6,820 10,000 5,075 3,671 2,461 0 2015 2016 2017 2018 2019 2020E Active LOs with UWM Submitted >1 Loan LOs submitted >6 Loans with UWM Analyst Day Nov 2020 Source: Internal data 27UWM DELIVERS A BEST -IN-CL ASS BROKER EXPERIENCE With Plenty of Room to Grow White Glove Service at Lightning Speed Leading Edge Technology 100% Focused on the Broker Channel Unique Loan Officers and Further Growth Opportunity Diversified Platform 70,000 2020 YTD Revenue Contribution 63,000 60,000 48,749 50,000 Top 5 Brokers 4% 40,000 Top 6-20 Brokers 6% 35,000 32,212 32,226 All Other Brokers 90% 29,521 26,717 30,000 23,661 20,518 20,000 20,000 16,519 13,115 12,456 10,544 6,820 10,000 5,075 3,671 2,461 0 2015 2016 2017 2018 2019 2020E Active LOs with UWM Submitted >1 Loan LOs submitted >6 Loans with UWM Analyst Day Nov 2020 Source: Internal data 27

Continuous monitoring of broker wallet share TECHNOLOGY AND DATA & ANALY TICS... Sophisticated and dynamic pricing Engine customized for various broker cohorts Daily market surveillance and monitoring allows UWM Data-driven client segmentation and to appropriately price, track & engage with brokers Sales Force team mapping Operational Efficiency Price Sensitivity Overall Size of Client Purchase vs. Refi Mix Preferred Lenders Market Share Opportunities Prepayment Speed Experience Analyst Day Nov 2020 28Continuous monitoring of broker wallet share TECHNOLOGY AND DATA & ANALY TICS... Sophisticated and dynamic pricing Engine customized for various broker cohorts Daily market surveillance and monitoring allows UWM Data-driven client segmentation and to appropriately price, track & engage with brokers Sales Force team mapping Operational Efficiency Price Sensitivity Overall Size of Client Purchase vs. Refi Mix Preferred Lenders Market Share Opportunities Prepayment Speed Experience Analyst Day Nov 2020 28

GROWING THE BROKER CHANNEL LO Partner Points Success Track Broker Services Program for client’s to earn points No-cost training designed to by taking advantage of products & accelerate a client’s business Recruiting Coach services designed to get the whether they are experienced, borrower to the closing table faster transitioning from retail or new Marketing Coach and ultimately grower the client’s to the industry. business. Compliance Support Courses developed for broker Points are redeemable for benefits owners, loan officers and Licensing Help such as fast passes, marketing processors. coaching and closing gifts for borrowers. Analyst Day Nov 2020 29GROWING THE BROKER CHANNEL LO Partner Points Success Track Broker Services Program for client’s to earn points No-cost training designed to by taking advantage of products & accelerate a client’s business Recruiting Coach services designed to get the whether they are experienced, borrower to the closing table faster transitioning from retail or new Marketing Coach and ultimately grower the client’s to the industry. business. Compliance Support Courses developed for broker Points are redeemable for benefits owners, loan officers and Licensing Help such as fast passes, marketing processors. coaching and closing gifts for borrowers. Analyst Day Nov 2020 29

FINDAMORTGAGEBROKER.COM A An na ally ys stt D Da ay y N No ov v 2 20 02 20 0 30FINDAMORTGAGEBROKER.COM A An na ally ys stt D Da ay y N No ov v 2 20 02 20 0 30

BEAMORTGAGEBROKER.COM A An na ally ys stt D Da ay y N No ov v 2 20 02 20 0 31BEAMORTGAGEBROKER.COM A An na ally ys stt D Da ay y N No ov v 2 20 02 20 0 31
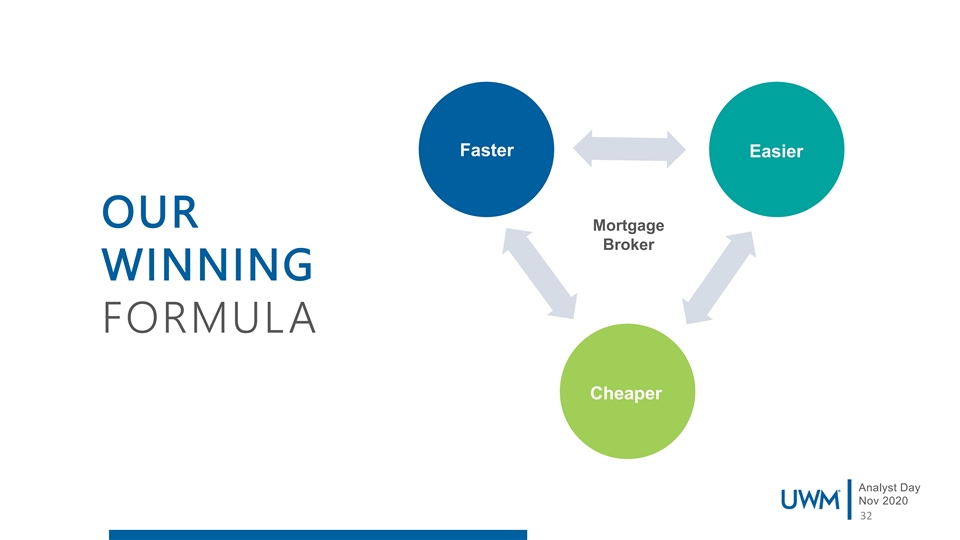
Faster Easier OUR Mortgage Broker WINNING FORMULA Cheaper Analyst Day Nov 2020 32Faster Easier OUR Mortgage Broker WINNING FORMULA Cheaper Analyst Day Nov 2020 32

Analyst Day Nov 2020 33Analyst Day Nov 2020 33

UWM PROJECTIONS LESS AGGRESSIVE THAN Q32020 ANNUALIZED PERFORMANCE …IN LINE WITH LAST TWELVE MONTHS (LTM) Q3 2020 Annualized 2021 Projected 2022 Projected Volume ($Bn) 54,289 217,158 210,000 240,000 Gain Margin ($MM) 1,724 6,896 3,785 3,986 Gain on Sale (%) 3.18% 3.18% 1.80% 1.66% Net Revenue ($MM) 1,834 7,337 4,694 5,357 Expenses ($MM) 383 1,530 2,358 2,941 EBITDA ($MM) 1,452 5,807 2,456 2,542 Pro Forma Inc Tax ($MM) (392) (1,568) (632) (666) Pro Forma Net Inc. ($MM) 1,060 4,239 1,690 1,763 Analyst Day Source: Internal data Nov 2020 Gain margin and gain of sale are operational metrics and defined as loan production income divided by loans funded 34UWM PROJECTIONS LESS AGGRESSIVE THAN Q32020 ANNUALIZED PERFORMANCE …IN LINE WITH LAST TWELVE MONTHS (LTM) Q3 2020 Annualized 2021 Projected 2022 Projected Volume ($Bn) 54,289 217,158 210,000 240,000 Gain Margin ($MM) 1,724 6,896 3,785 3,986 Gain on Sale (%) 3.18% 3.18% 1.80% 1.66% Net Revenue ($MM) 1,834 7,337 4,694 5,357 Expenses ($MM) 383 1,530 2,358 2,941 EBITDA ($MM) 1,452 5,807 2,456 2,542 Pro Forma Inc Tax ($MM) (392) (1,568) (632) (666) Pro Forma Net Inc. ($MM) 1,060 4,239 1,690 1,763 Analyst Day Source: Internal data Nov 2020 Gain margin and gain of sale are operational metrics and defined as loan production income divided by loans funded 34

IMPACT OF FURTHER GAIN MARGIN COMPRESSION PRIMARILY OFFSET BY LOWER MSR AMORTIZATION (PAID IN FULL) Q3 Margin was 318 BPS 2021 2022 Projected Margins 180 166 EBIT 2,341 2,465 If gain margins decline: • Amortization/PIF materially slows • MSR values increase significantly Source: Internal data Gain margin and gain of sale are operational metrics and defined as loan production income divided by loans funded. IMPACT OF FURTHER GAIN MARGIN COMPRESSION PRIMARILY OFFSET BY LOWER MSR AMORTIZATION (PAID IN FULL) Q3 Margin was 318 BPS 2021 2022 Projected Margins 180 166 EBIT 2,341 2,465 If gain margins decline: • Amortization/PIF materially slows • MSR values increase significantly Source: Internal data Gain margin and gain of sale are operational metrics and defined as loan production income divided by loans funded.

UWM REALIZED CONTINUAL IMPROVEMENTS IN FIXED COST PER LOAN Cost Per Loan 3,000 2,500 2,000 1,500 1,000 500 0 2015 2016 2017 2018 2019 2020 YTD Cost Per Loan - Fixed Cost Per Loan - Variable Analyst Day Source: Internal data Nov 2020 36UWM REALIZED CONTINUAL IMPROVEMENTS IN FIXED COST PER LOAN Cost Per Loan 3,000 2,500 2,000 1,500 1,000 500 0 2015 2016 2017 2018 2019 2020 YTD Cost Per Loan - Fixed Cost Per Loan - Variable Analyst Day Source: Internal data Nov 2020 36

LOWER COST ($) Costs to Originate (2019) 8,872 8,402 7,282 Current: 6,625 UWM Wholesale Channel Retail Channel Source: Internal data and Stratmor and Company dataLOWER COST ($) Costs to Originate (2019) 8,872 8,402 7,282 Current: 6,625 UWM Wholesale Channel Retail Channel Source: Internal data and Stratmor and Company data

UWM PURCHASE MORTGAGE PRODUCTION GROWTH CONSISTENTLY OUTPACES NATIONAL MARKET National Mortgage Market 2015 2016 2017 2018 2019 Refinance 776 999 616 467 1,028 Annual Growth (%) - 28.7% -38.3% -24.2% 120.1% Purchase 903 1,052 1,143 1,209 1,225 Annual Growth (%) - 16.5% 8.7% 5.8% 1.3% UWM Mortgage Production 2015 2016 2017 2018 2019 Refinance 7.2 13.8 12.4 12.2 57.9 Annual Growth (%) - 91% -10% -2% 374% Purchase 5.9 9.2 17.1 29.3 49.8 Annual Growth (%) - 57% 85% 72% 70% Source: Internal data, IMF and NBA data.UWM PURCHASE MORTGAGE PRODUCTION GROWTH CONSISTENTLY OUTPACES NATIONAL MARKET National Mortgage Market 2015 2016 2017 2018 2019 Refinance 776 999 616 467 1,028 Annual Growth (%) - 28.7% -38.3% -24.2% 120.1% Purchase 903 1,052 1,143 1,209 1,225 Annual Growth (%) - 16.5% 8.7% 5.8% 1.3% UWM Mortgage Production 2015 2016 2017 2018 2019 Refinance 7.2 13.8 12.4 12.2 57.9 Annual Growth (%) - 91% -10% -2% 374% Purchase 5.9 9.2 17.1 29.3 49.8 Annual Growth (%) - 57% 85% 72% 70% Source: Internal data, IMF and NBA data.

UWM PURCHASE MORTGAGE PRODUCTION GROWTH CONSISTENTLY OUTPACES NATIONAL MARKET Annual Growth - Purchase Mortgage Originations UWM Market Share - Purchase Mortgage Originations 100% 4.0% 90% 3.5% 80% 3.0% 70% 60% 2.5% 50% 2.0% 40% 1.5% 30% 20% 1.0% 10% 0.5% 0% 2015 2016 2017 2018 2019 0.0% -10% 2015 2016 2017 2018 2019 National Purchase Growth UWM Purchase Growth Analyst Day Source: Internal data, MBA data. Nov 2020 UWM market share of all purchase mortgage originations 39UWM PURCHASE MORTGAGE PRODUCTION GROWTH CONSISTENTLY OUTPACES NATIONAL MARKET Annual Growth - Purchase Mortgage Originations UWM Market Share - Purchase Mortgage Originations 100% 4.0% 90% 3.5% 80% 3.0% 70% 60% 2.5% 50% 2.0% 40% 1.5% 30% 20% 1.0% 10% 0.5% 0% 2015 2016 2017 2018 2019 0.0% -10% 2015 2016 2017 2018 2019 National Purchase Growth UWM Purchase Growth Analyst Day Source: Internal data, MBA data. Nov 2020 UWM market share of all purchase mortgage originations 39
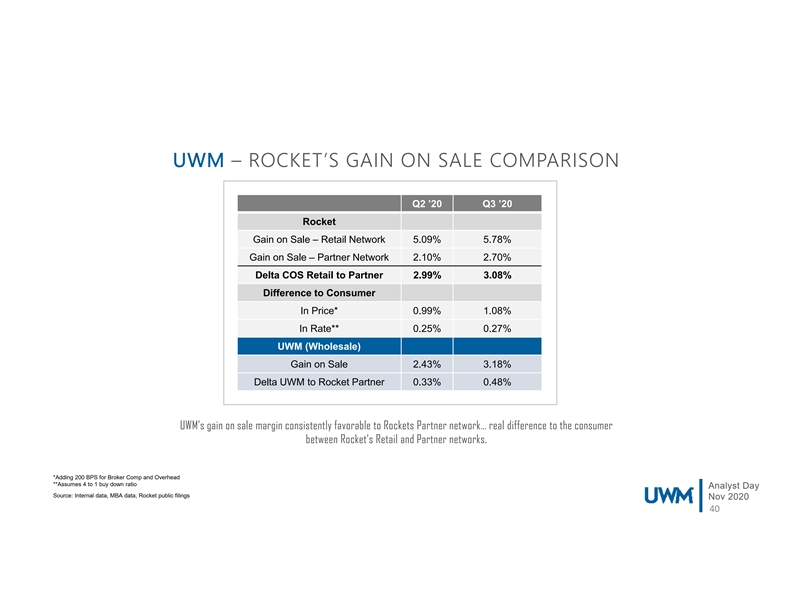
UWM – ROCKET’S GAIN ON SALE COMPARISON Q2 ’20 Q3 ’20 Rocket Gain on Sale – Retail Network 5.09% 5.78% Gain on Sale – Partner Network 2.10% 2.70% Delta COS Retail to Partner 2.99% 3.08% Difference to Consumer In Price* 0.99% 1.08% In Rate** 0.25% 0.27% UWM (Wholesale) Gain on Sale 2.43% 3.18% Delta UWM to Rocket Partner 0.33% 0.48% UWM’s gain on sale margin consistently favorable to Rockets Partner network… real difference to the consumer between Rocket’s Retail and Partner networks. *Adding 200 BPS for Broker Comp and Overhead **Assumes 4 to 1 buy down ratio Analyst Day Source: Internal data, MBA data, Rocket public filings Nov 2020 40UWM – ROCKET’S GAIN ON SALE COMPARISON Q2 ’20 Q3 ’20 Rocket Gain on Sale – Retail Network 5.09% 5.78% Gain on Sale – Partner Network 2.10% 2.70% Delta COS Retail to Partner 2.99% 3.08% Difference to Consumer In Price* 0.99% 1.08% In Rate** 0.25% 0.27% UWM (Wholesale) Gain on Sale 2.43% 3.18% Delta UWM to Rocket Partner 0.33% 0.48% UWM’s gain on sale margin consistently favorable to Rockets Partner network… real difference to the consumer between Rocket’s Retail and Partner networks. *Adding 200 BPS for Broker Comp and Overhead **Assumes 4 to 1 buy down ratio Analyst Day Source: Internal data, MBA data, Rocket public filings Nov 2020 40

AN INTERWOVEN FOCUS UWM is 100% committed to Brokers BROKERS ARE who are motivated to find the best BETTER deal for their borrowers Brokers are Better HIGH QUALITY UWM focuses only on high credit quality Better government backed, QM loans LOANS Pricing To The High Quality Consumers UWM provides the best service Loans BETTER SERVICE in the industry which is enabled by our laser focus By focusing on one channel and a tight LOWER COST credit box UWM can originate and deliver Lower loans at a lower cost than competitors Better Cost Service By having a lower cost to originate and deliver BETTER PRICING TO UWM can offer better pricing to the consumer THE CONSUMERS which makes brokers even better Analyst Day UWM’s delivery chain for a commoditized product outpaces all competitors Nov 2020 41AN INTERWOVEN FOCUS UWM is 100% committed to Brokers BROKERS ARE who are motivated to find the best BETTER deal for their borrowers Brokers are Better HIGH QUALITY UWM focuses only on high credit quality Better government backed, QM loans LOANS Pricing To The High Quality Consumers UWM provides the best service Loans BETTER SERVICE in the industry which is enabled by our laser focus By focusing on one channel and a tight LOWER COST credit box UWM can originate and deliver Lower loans at a lower cost than competitors Better Cost Service By having a lower cost to originate and deliver BETTER PRICING TO UWM can offer better pricing to the consumer THE CONSUMERS which makes brokers even better Analyst Day UWM’s delivery chain for a commoditized product outpaces all competitors Nov 2020 41

1 2 3 Reliable Dominant player that is laser dividend Strong balance sheet focused on one market supported by consistent positioned to withstand (wholesale), with significant earnings despite industry market risks upside ahead cycles WHY 4 5 INVEST? Continued focus on managing for the long term Growth in book value/equity • controlling expenses, declining cost per loan • strengthening the broker channel with training, technology and service Analyst Day Nov 2020 421 2 3 Reliable Dominant player that is laser dividend Strong balance sheet focused on one market supported by consistent positioned to withstand (wholesale), with significant earnings despite industry market risks upside ahead cycles WHY 4 5 INVEST? Continued focus on managing for the long term Growth in book value/equity • controlling expenses, declining cost per loan • strengthening the broker channel with training, technology and service Analyst Day Nov 2020 42

Analyst Day Nov 2020 5Analyst Day Nov 2020 5

Analyst Day Nov 2020 6Analyst Day Nov 2020 6

Analyst Day Nov 2020 7Analyst Day Nov 2020 7

APPENDIX Analyst Day Nov 2020APPENDIX Analyst Day Nov 2020

FINANCIALS: BALANCE SHEET Analyst Day Nov 2020FINANCIALS: BALANCE SHEET Analyst Day Nov 2020

FINANCIALS: INCOME STATEMENT Analyst Day Nov 2020FINANCIALS: INCOME STATEMENT Analyst Day Nov 2020

FINANCIALS: EQUITY/RETAINED EARNINGS Analyst Day Nov 2020FINANCIALS: EQUITY/RETAINED EARNINGS Analyst Day Nov 2020

NON-GAAP RECONCILIATION The following table presents a reconciliation of Adjusted EBITDA to net income, the most directly comparable GAAP financial measure. For the three For the nine For the twelve For the year ended months ended months ended months ended December 31, September 30, September 30, September 30, Reconciliation of net income to Adjusted EBITDA: 2017 2018 2019 2019 2020 2019 2020 2020 ($ in thousands) (unaudited) (unaudited) Net income $114,601 $ 91,316 $415,057 $197,987 $1,450,883 $266,199 $2,010,719 $ 2,159,577 Interest expense on non- funding debt 2,720 8,211 16,781 3,882 4,374 9,589 16,140 23,332 Income tax provision 363 57 — — 750 — 1,500 1,500 Depreciation and amortization of property and equipment 11,130 5,456 9,405 2,491 2,749 6,787 8,071 10,688 Impairment/(recovery) of (1) MSRs — — 20,559 21,827 (84,519) 62,190 32,162 (9,470) Deferred compensation, (2) net — — 11,000 1,649 16,967 1,649 28,265 37,616 Adjusted EBITDA $128,814 $105,040 $472,802 $227,836 $1,391,204 $346,414 $2,096,857 $ 2,223,243 (1) Reflects recorded temporary impairments recorded quarterly as valuation allowance against the value of MSR, and corresponding subsequent recoveries. (2) Reflects management incentive bonuses under UWM’s long-term incentive plan that are accrued when earned net of cash payments Analyst Day Nov 2020NON-GAAP RECONCILIATION The following table presents a reconciliation of Adjusted EBITDA to net income, the most directly comparable GAAP financial measure. For the three For the nine For the twelve For the year ended months ended months ended months ended December 31, September 30, September 30, September 30, Reconciliation of net income to Adjusted EBITDA: 2017 2018 2019 2019 2020 2019 2020 2020 ($ in thousands) (unaudited) (unaudited) Net income $114,601 $ 91,316 $415,057 $197,987 $1,450,883 $266,199 $2,010,719 $ 2,159,577 Interest expense on non- funding debt 2,720 8,211 16,781 3,882 4,374 9,589 16,140 23,332 Income tax provision 363 57 — — 750 — 1,500 1,500 Depreciation and amortization of property and equipment 11,130 5,456 9,405 2,491 2,749 6,787 8,071 10,688 Impairment/(recovery) of (1) MSRs — — 20,559 21,827 (84,519) 62,190 32,162 (9,470) Deferred compensation, (2) net — — 11,000 1,649 16,967 1,649 28,265 37,616 Adjusted EBITDA $128,814 $105,040 $472,802 $227,836 $1,391,204 $346,414 $2,096,857 $ 2,223,243 (1) Reflects recorded temporary impairments recorded quarterly as valuation allowance against the value of MSR, and corresponding subsequent recoveries. (2) Reflects management incentive bonuses under UWM’s long-term incentive plan that are accrued when earned net of cash payments Analyst Day Nov 2020