Attached files
| file | filename |
|---|---|
| 8-K - 8-K - COUSINS PROPERTIES INC | cuz-20201117.htm |

INVESTOR PRESENTATION November 2020
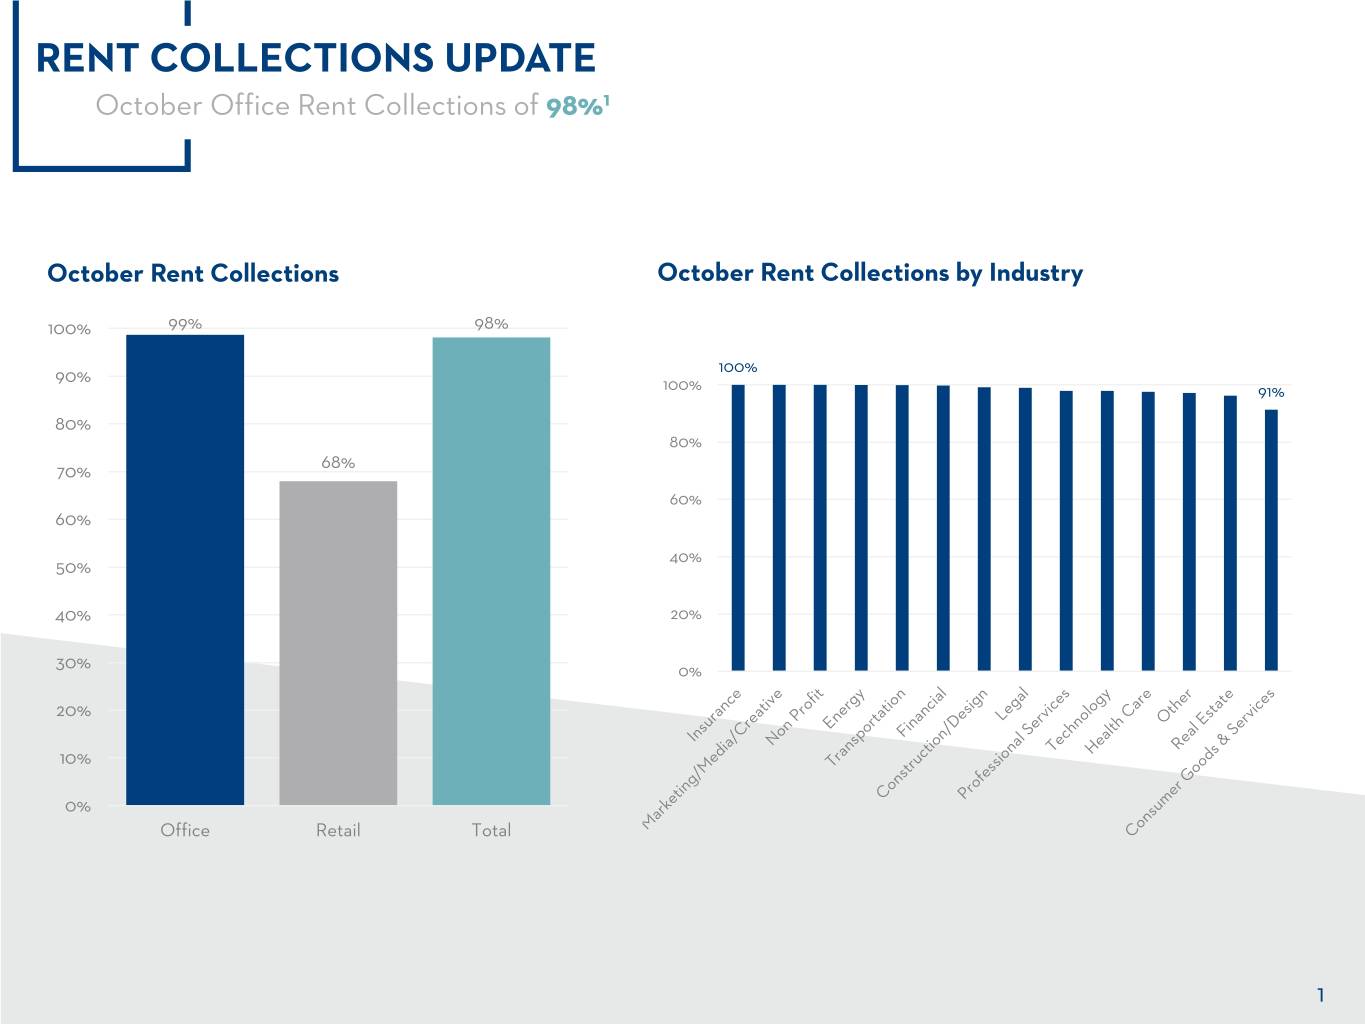
RENT COLLECTIONS UPDATE October Office Rent Collections of 98%1 October Rent Collections October Rent Collections by Industry 100% 99% 98% 100% 90% 100% 91% 80% 80% 70% 68% 60% 60% 40% 50% 40% 20% 30% 0% 20% 10% 0% Office Retail Total 1
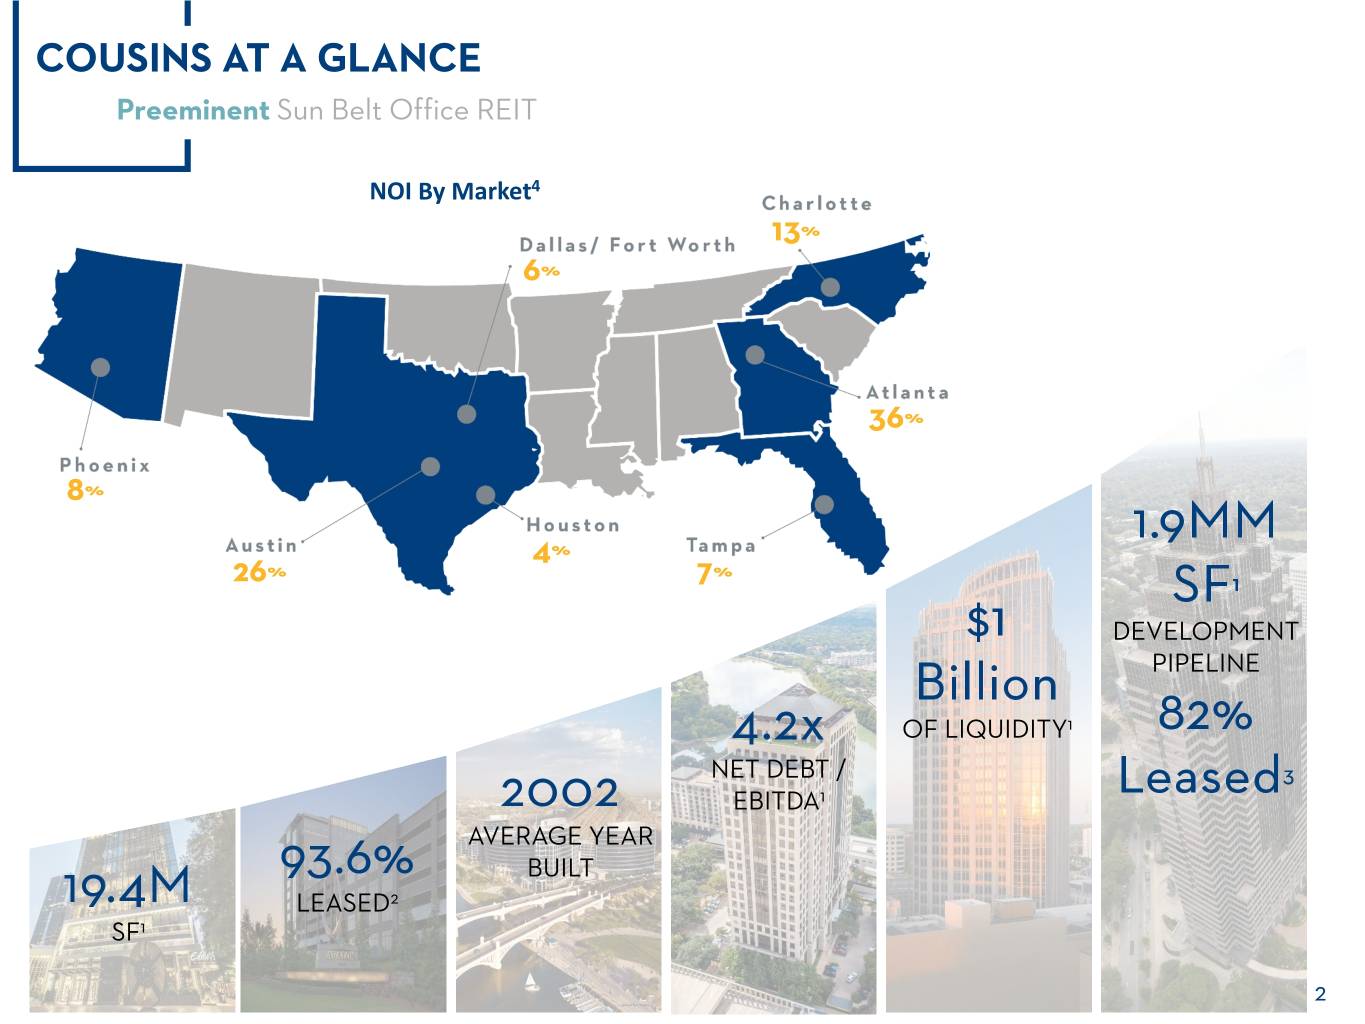
COUSINS AT A GLANCE Preeminent Sun Belt Office REIT NOI By Market4 13 6 36 8 1.9MM 4 26 7 SF1 $1 DEVELOPMENT Billion PIPELINE 4.2x OF LIQUIDITY1 82% NET DEBT / 3 2002 EBITDA1 Leased AVERAGE YEAR 93.6% BUILT 19.4M LEASED2 SF1 25
WHY COUSINS? RESILIENT MARKET FUNDAMENTALS PREMIER SUN BELT PORTFOLIO COMPELLING GROWTH OPPORTUNITIES SIMPLE STRONG BALANCE SHEET 3
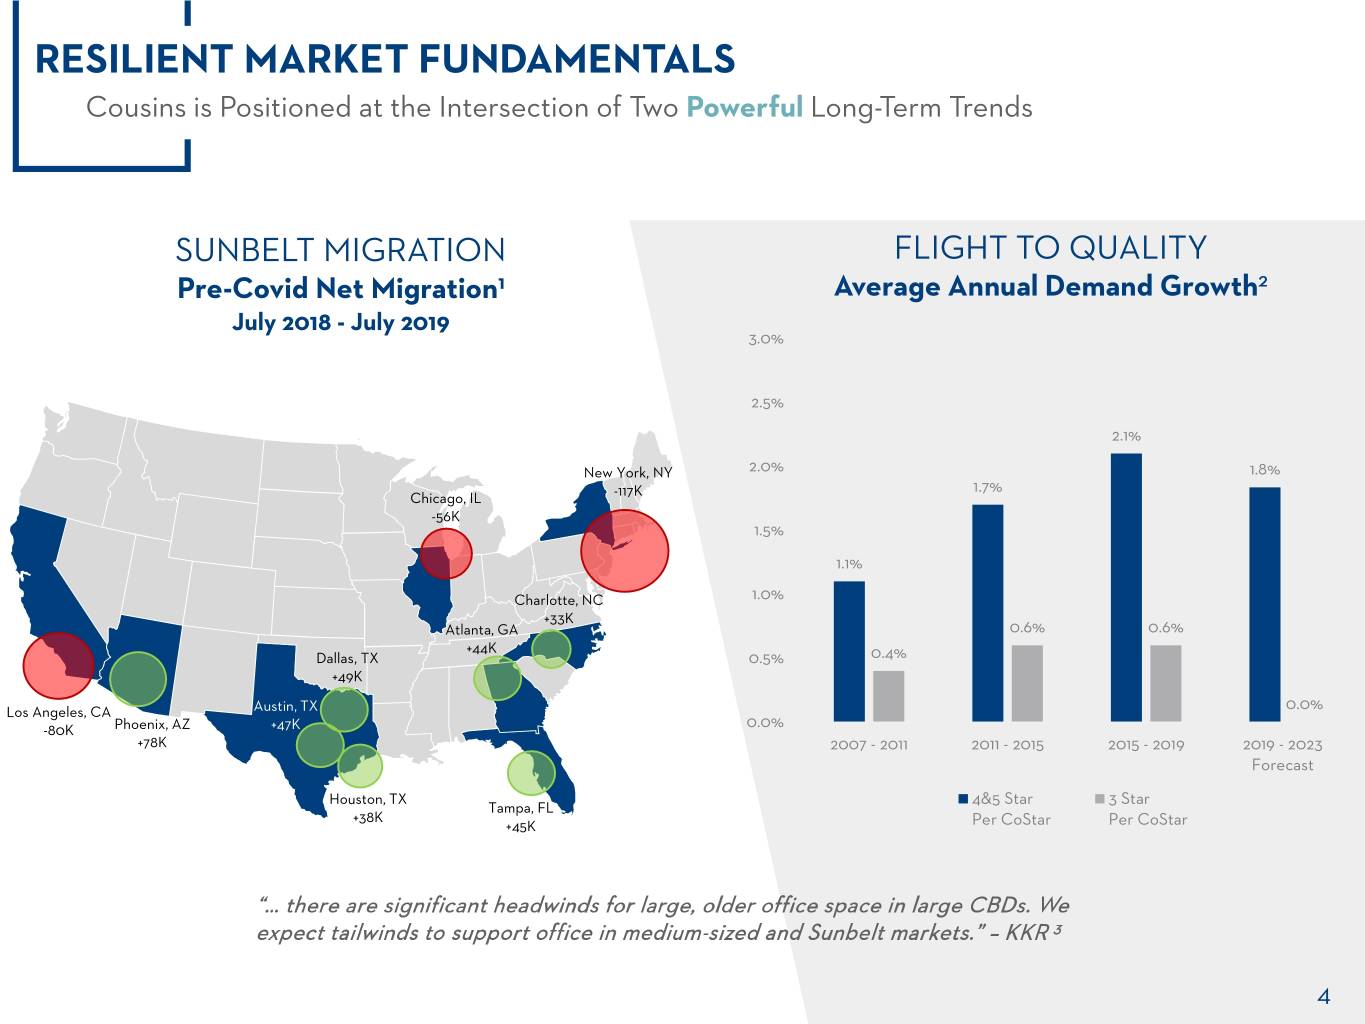
RESILIENT MARKET FUNDAMENTALS Cousins is Positioned at the Intersection of Two Powerful Long-Term Trends SUNBELT MIGRATION FLIGHT TO QUALITY Pre-Covid Net Migration1 Average Annual Demand Growth2 July 2018 - July 2019 3.0% 2.5% 2.1% New York, NY 2.0% 1.8% 1.7% Chicago, IL -117K -56K 1.5% 1.1% Charlotte, NC 1.0% +33K Atlanta, GA 0.6% 0.6% +44K Dallas, TX 0.5% 0.4% +49K Los Angeles, CA Austin, TX 0.0% -80K Phoenix, AZ +47K 0.0% +78K 2007 - 2011 2011 - 2015 2015 - 2019 2019 - 2023 Forecast Houston, TX 4&5 Star 3 Star Tampa, FL +38K +45K Per CoStar Per CoStar “… there are significant headwinds for large, older office space in large CBDs. We expect tailwinds to support office in medium-sized and Sunbelt markets.” – KKR 3 4
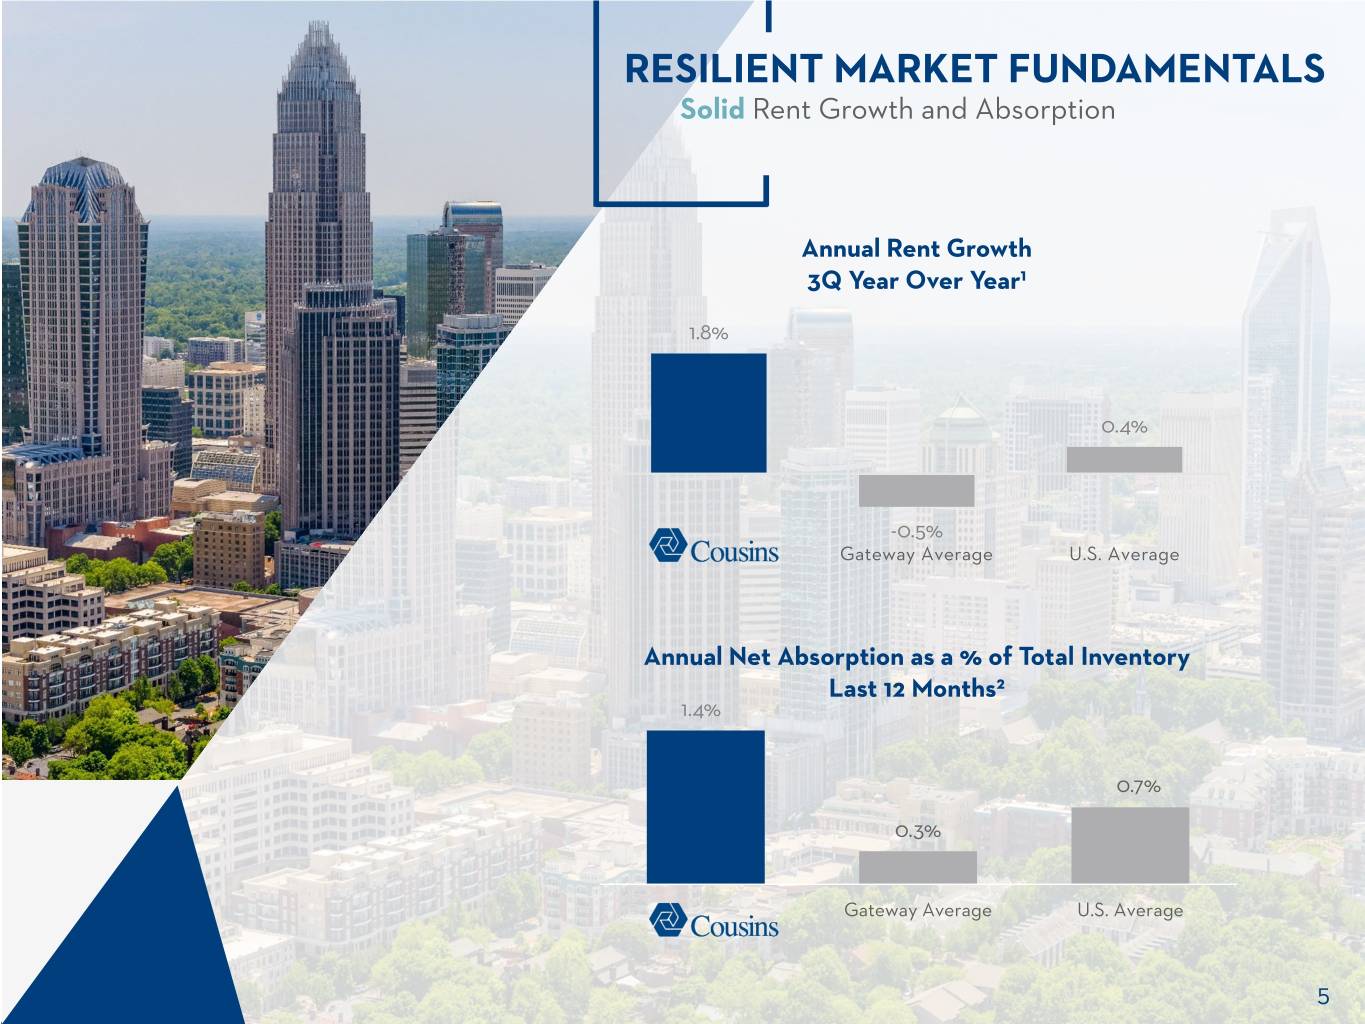
RESILIENT MARKET FUNDAMENTALS Solid Rent Growth and Absorption Annual Rent Growth 3Q Year Over Year1 1.8% 0.4% -0.5% Gateway Average U.S. Average Annual Net Absorption as a % of Total Inventory Last 12 Months2 1.4% 0.7% 0.3% Gateway Average U.S. Average 5
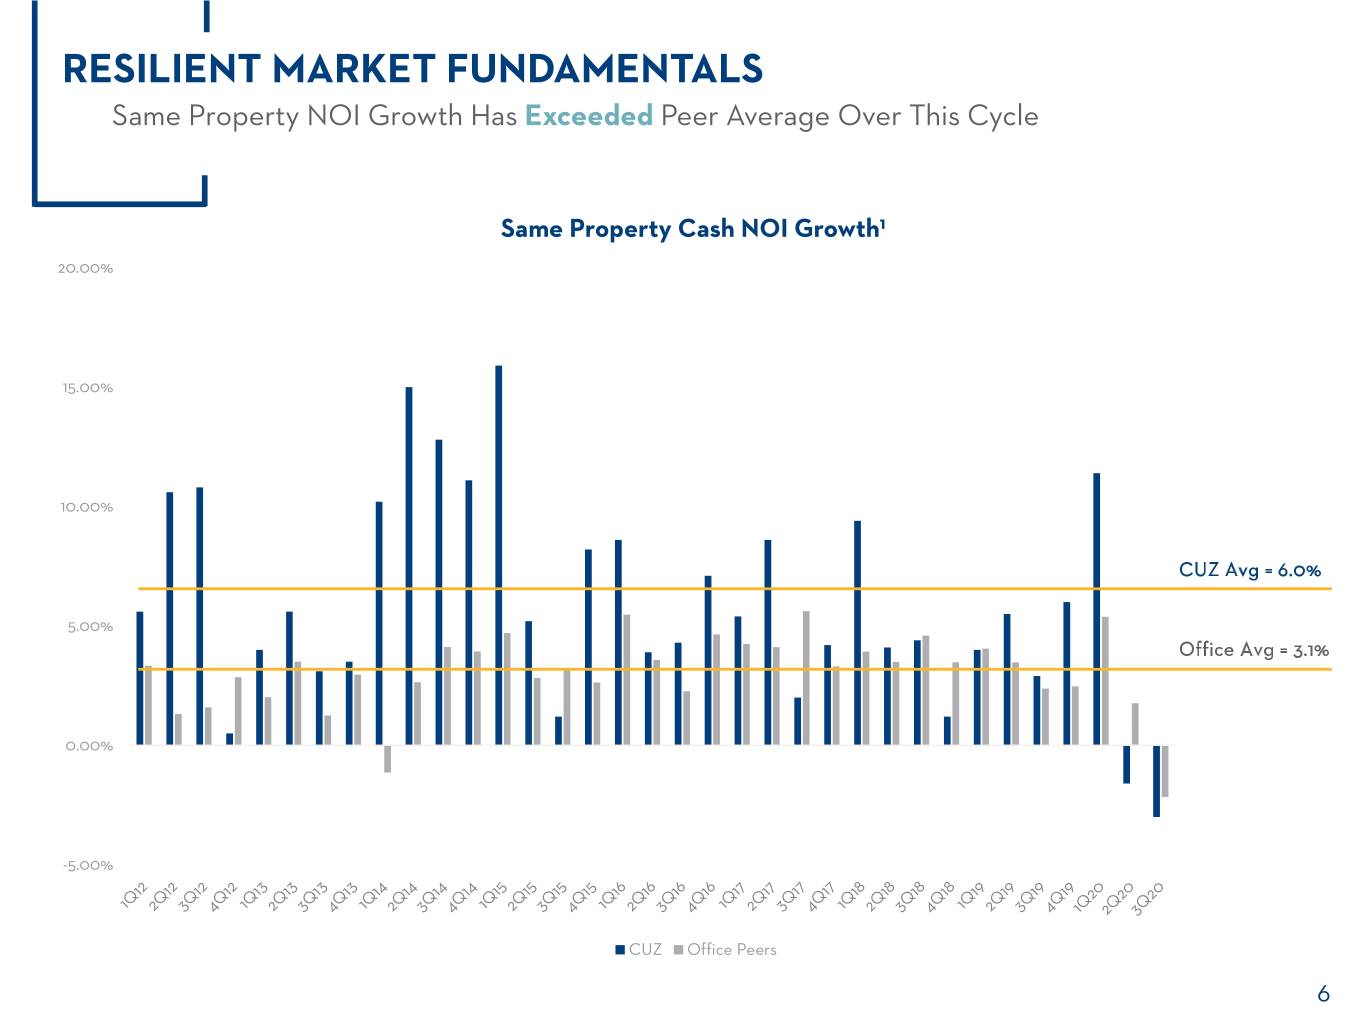
RESILIENT MARKET FUNDAMENTALS Same Property NOI Growth Has Exceeded Peer Average Over This Cycle Same Property Cash NOI Growth1 20.00% 15.00% 10.00% CUZ Avg = 6.0% 5.00% Office Avg = 3.1% 0.00% -5.00% CUZ Office Peers 6
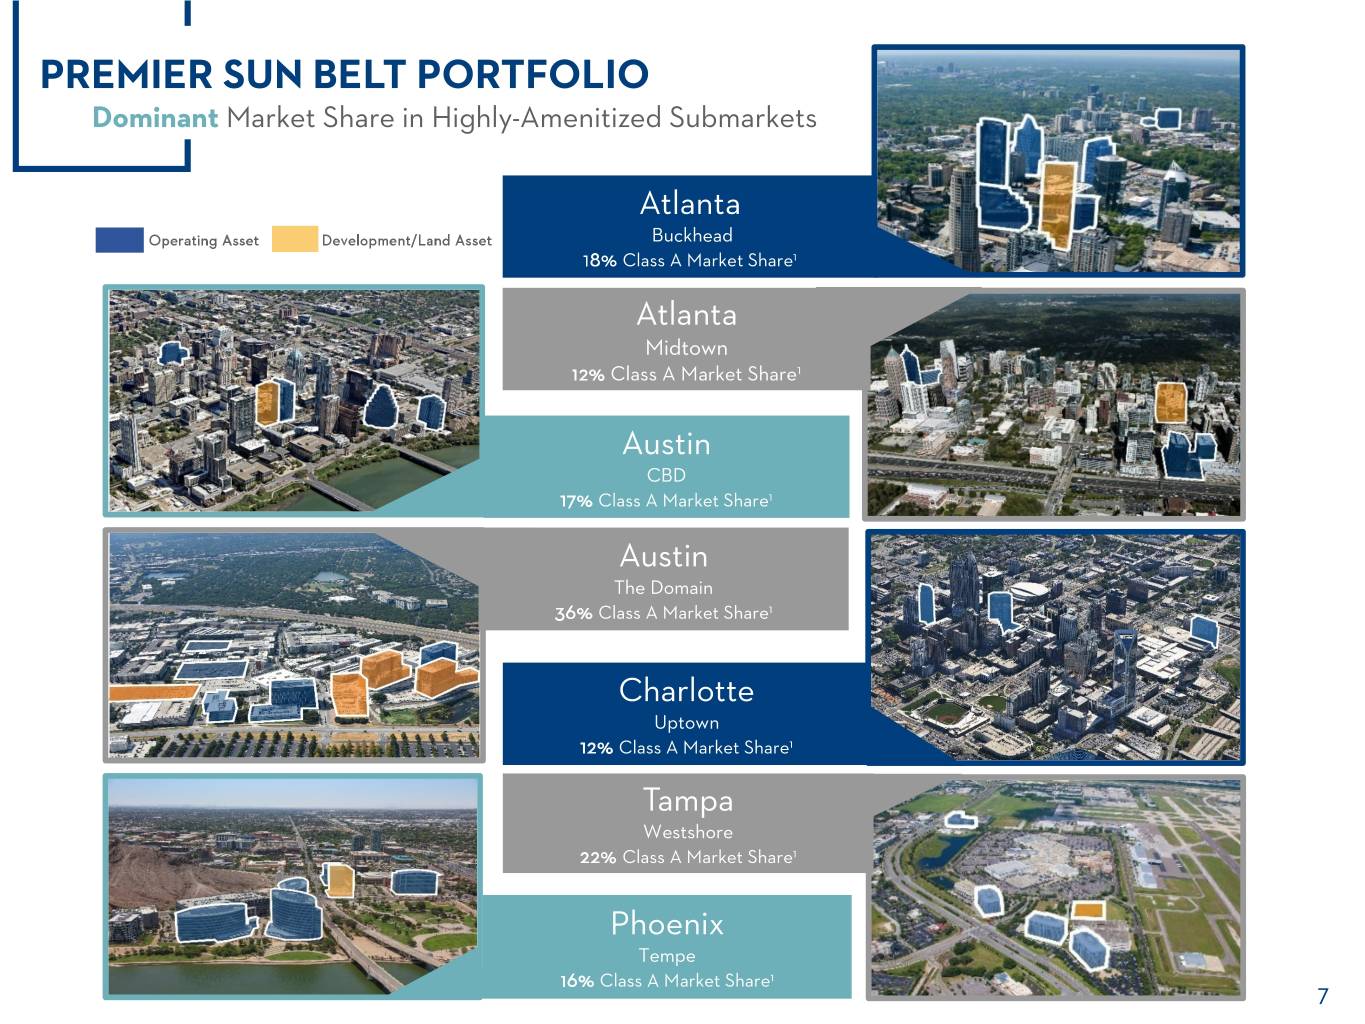
PREMIER SUN BELT PORTFOLIO Dominant Market Share in Highly-Amenitized Submarkets Atlanta Operating Asset Development/Land Asset Buckhead 18% Class A Market Share1 Atlanta Midtown 12% Class A Market Share1 Austin CBD 17% Class A Market Share1 Austin The Domain 36% Class A Market Share1 Charlotte Uptown 12% Class A Market Share1 Tampa Westshore 22% Class A Market Share1 Phoenix Tempe 16% Class A Market Share1 7
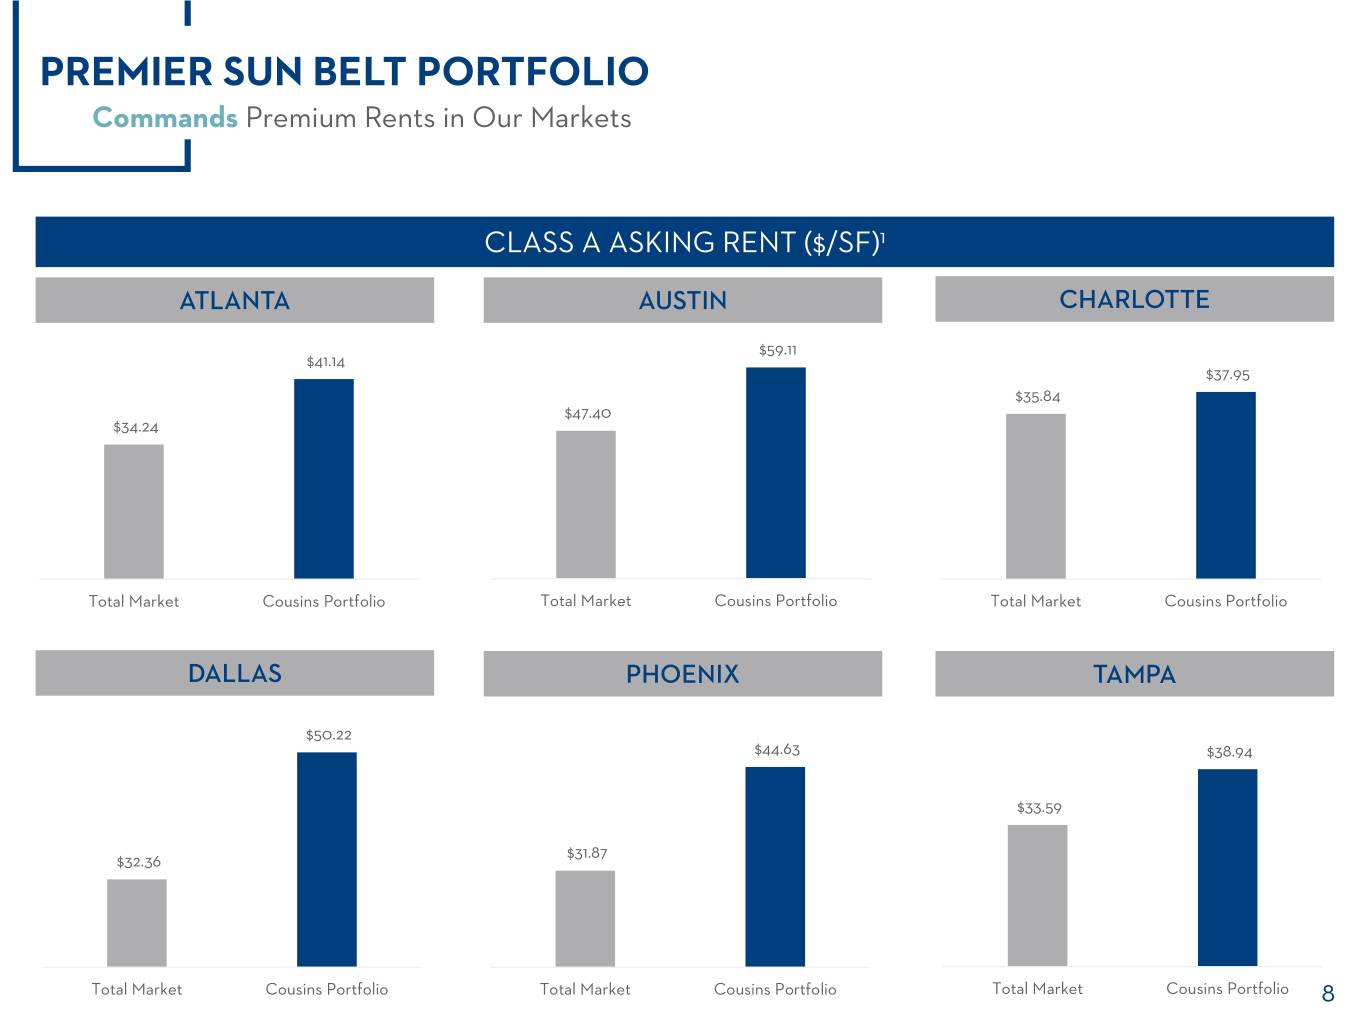
PREMIER SUN BELT PORTFOLIO Commands Premium Rents in Our Markets CLASS A ASKING RENT ($/SF)1 ATLANTA AUSTIN CHARLOTTE $59.11 $41.14 $37.95 $35.84 $47.40 $34.24 Total Market Cousins Portfolio Total Market Cousins Portfolio Total Market Cousins Portfolio DALLAS PHOENIX TAMPA $50.22 $44.63 $38.94 $33.59 $31.87 $32.36 Total Market Cousins Portfolio Total Market Cousins Portfolio Total Market Cousins Portfolio 8
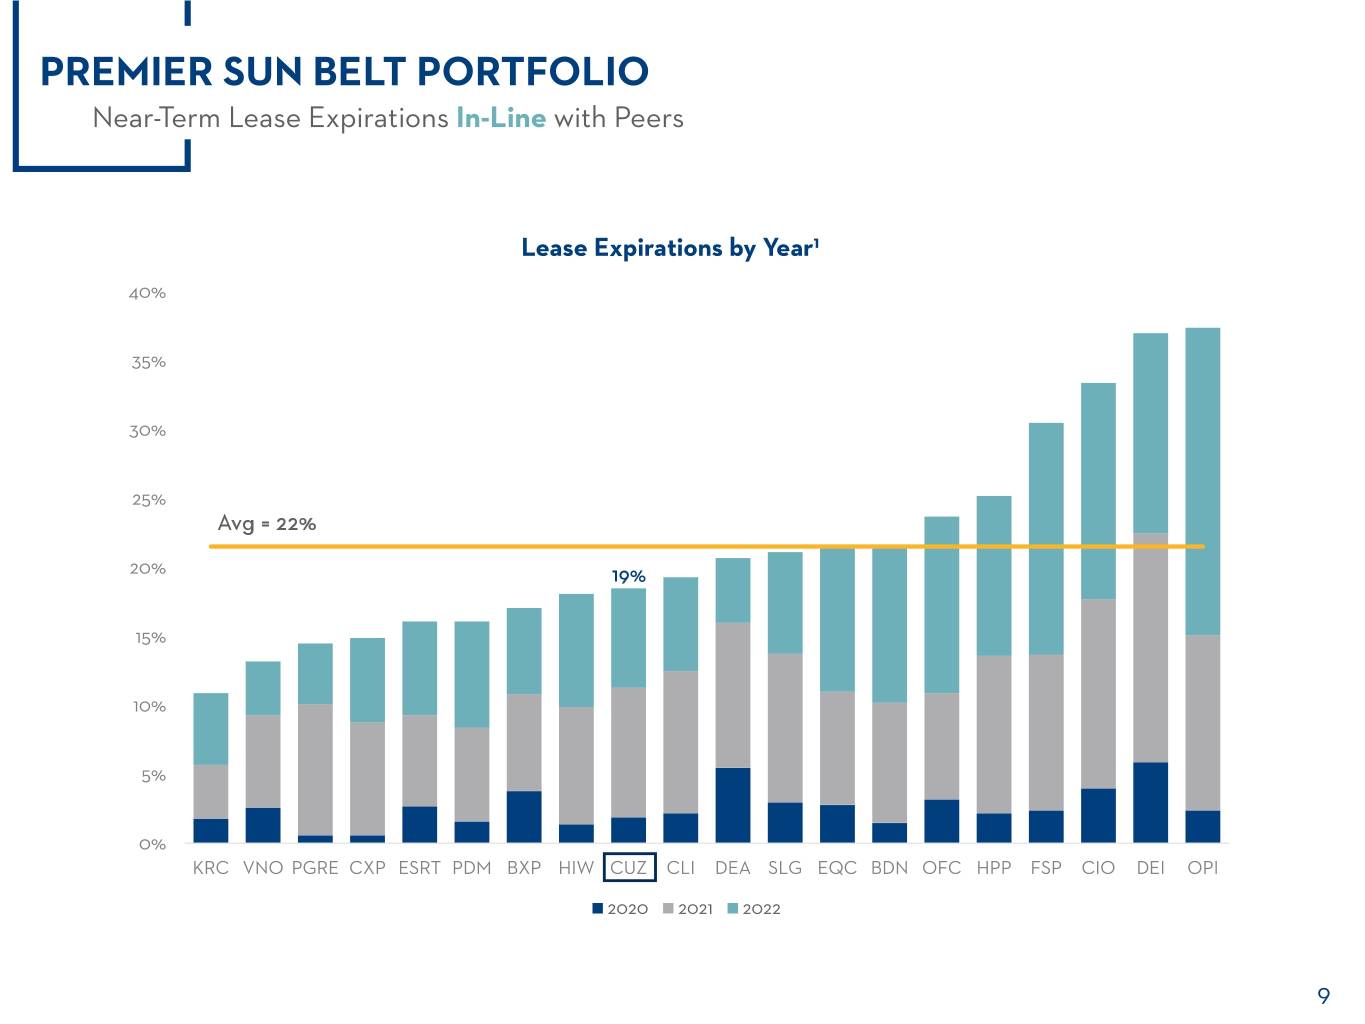
PREMIER SUN BELT PORTFOLIO Near-Term Lease Expirations In-Line with Peers Lease Expirations by Year1 40% 35% 30% 25% Avg = 22% 20% 19% 15% 10% 5% 0% KRC VNO PGRE CXP ESRT PDM BXP HIW CUZ CLI DEA SLG EQC BDN OFC HPP FSP CIO DEI OPI 2020 2021 2022 9
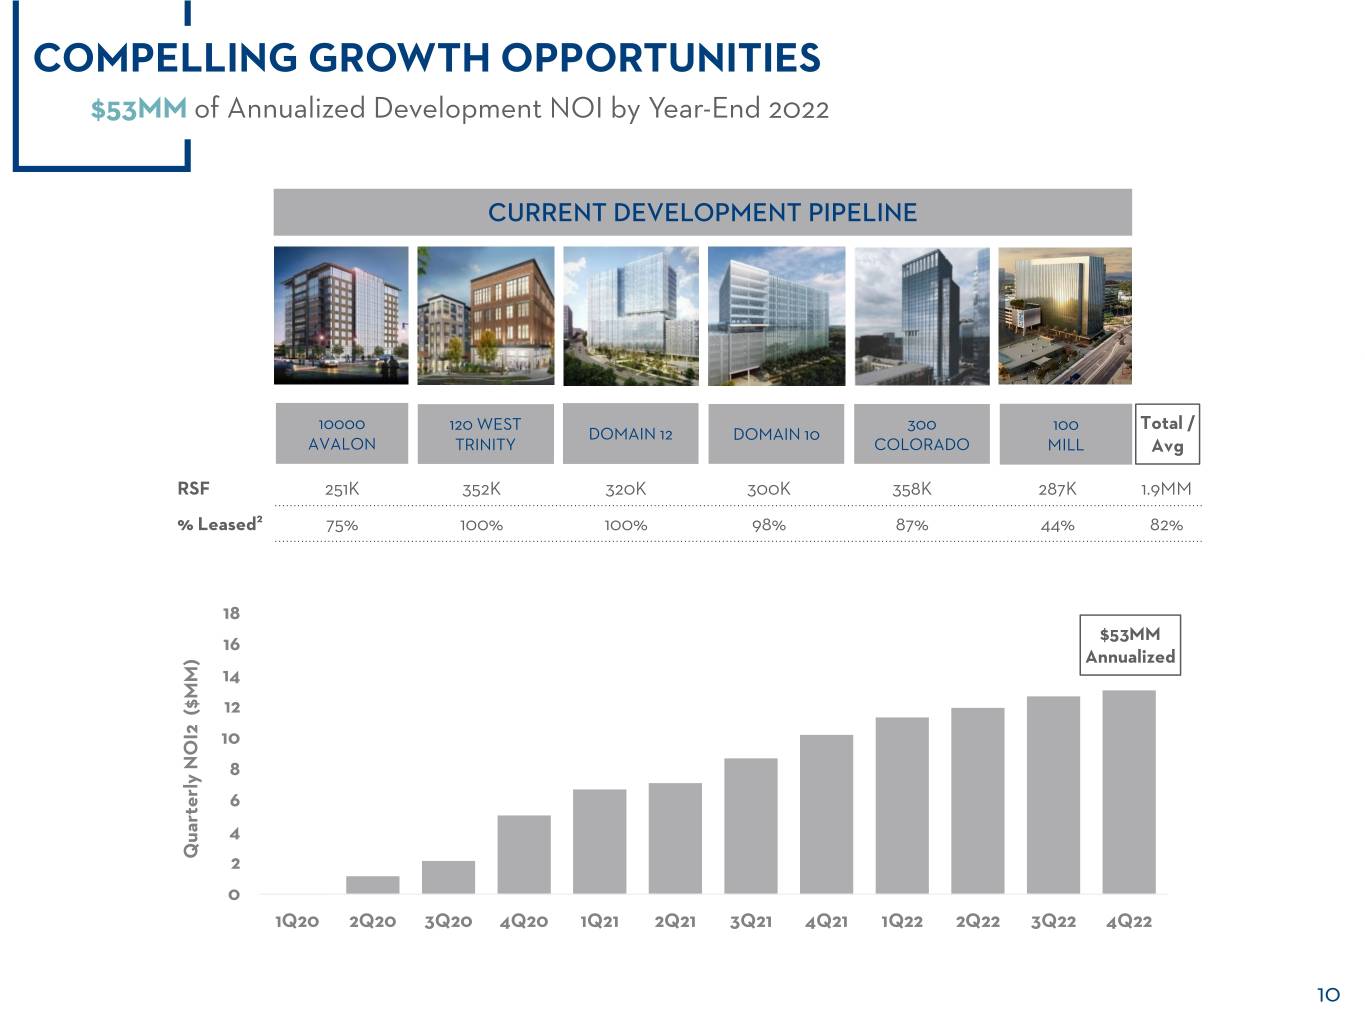
COMPELLING GROWTH OPPORTUNITIES $53MM of Annualized Development NOI by Year-End 2022 CURRENT DEVELOPMENT PIPELINE 10000 120 WEST 300 100 Total / DOMAIN 12 DOMAIN 10 AVALON TRINITY COLORADO MILL Avg RSF 251K 352K 320K 300K 358K 287K 1.9MM % Leased2 75% 100% 100% 98% 87% 44% 82% 18 $53MM 16 Annualized 14 12 10 8 6 4 Quarterly ($MM) NOI2 2 0 1Q20 2Q20 3Q20 4Q20 1Q21 2Q21 3Q21 4Q21 1Q22 2Q22 3Q22 4Q22 10
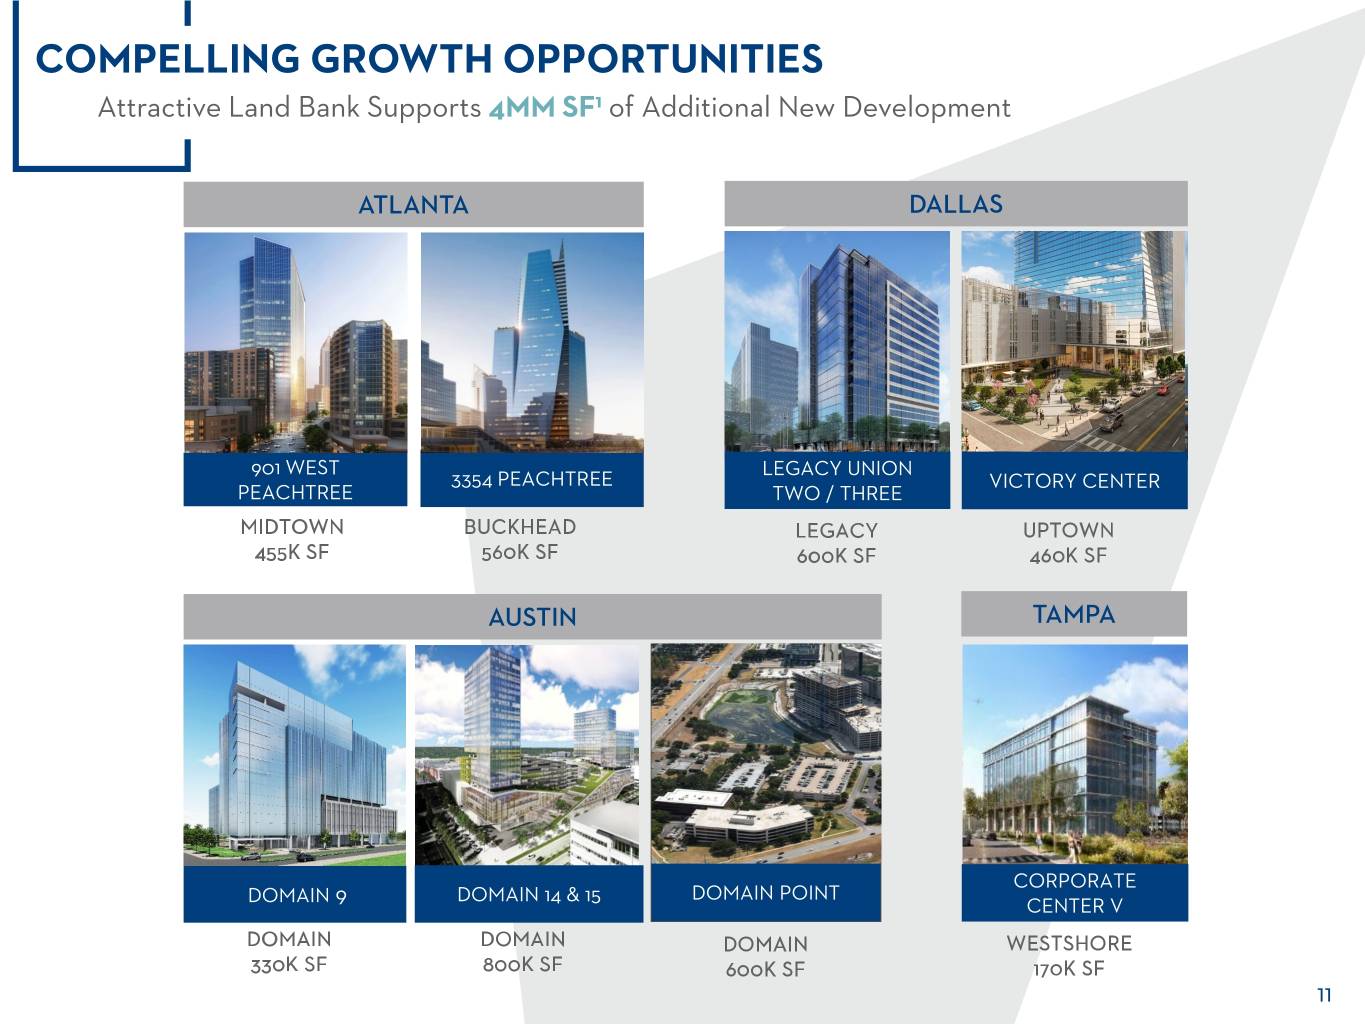
COMPELLING GROWTH OPPORTUNITIES Attractive Land Bank Supports 4MM SF1 of Additional New Development ATLANTA DALLAS 901 WEST LEGACY UNION 3354 PEACHTREE VICTORY CENTER PEACHTREE TWO / THREE MIDTOWN BUCKHEAD LEGACY UPTOWN 455K SF 560K SF 600K SF 460K SF AUSTIN TAMPA CORPORATE DOMAIN DOMAIN 14 & 15 DOMAIN POINT 9 CENTER V DOMAIN DOMAIN DOMAIN WESTSHORE 330K SF 800K SF 600K SF 170K SF 11
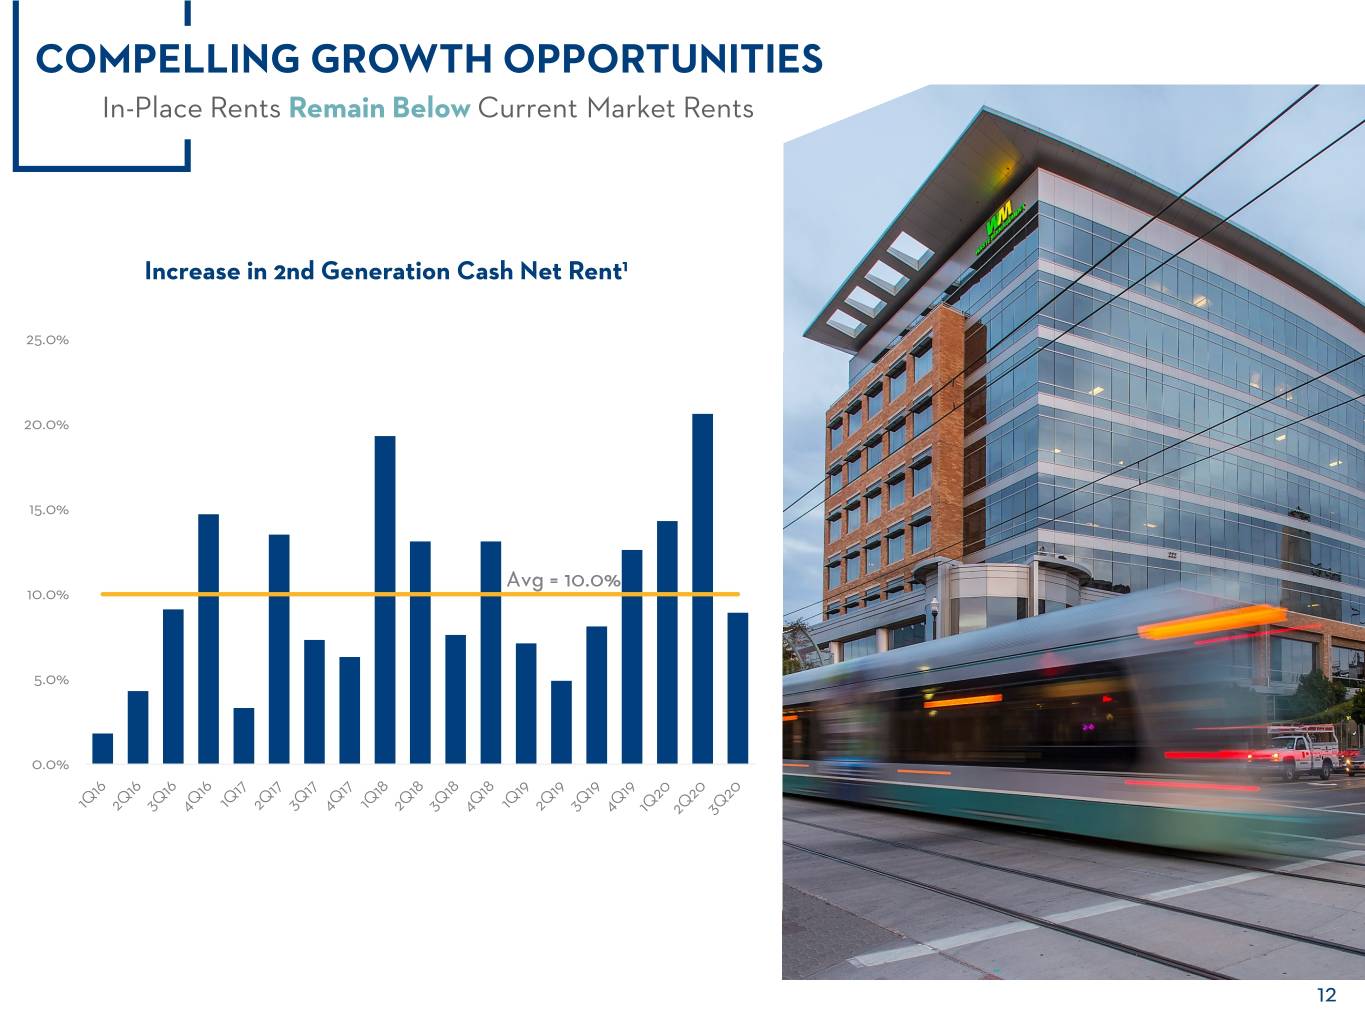
COMPELLING GROWTH OPPORTUNITIES In-Place Rents Remain Below Current Market Rents Increase in 2nd Generation Cash Net Rent1 25.0% 20.0% 15.0% Avg = 10.0% 10.0% 5.0% 0.0% 12
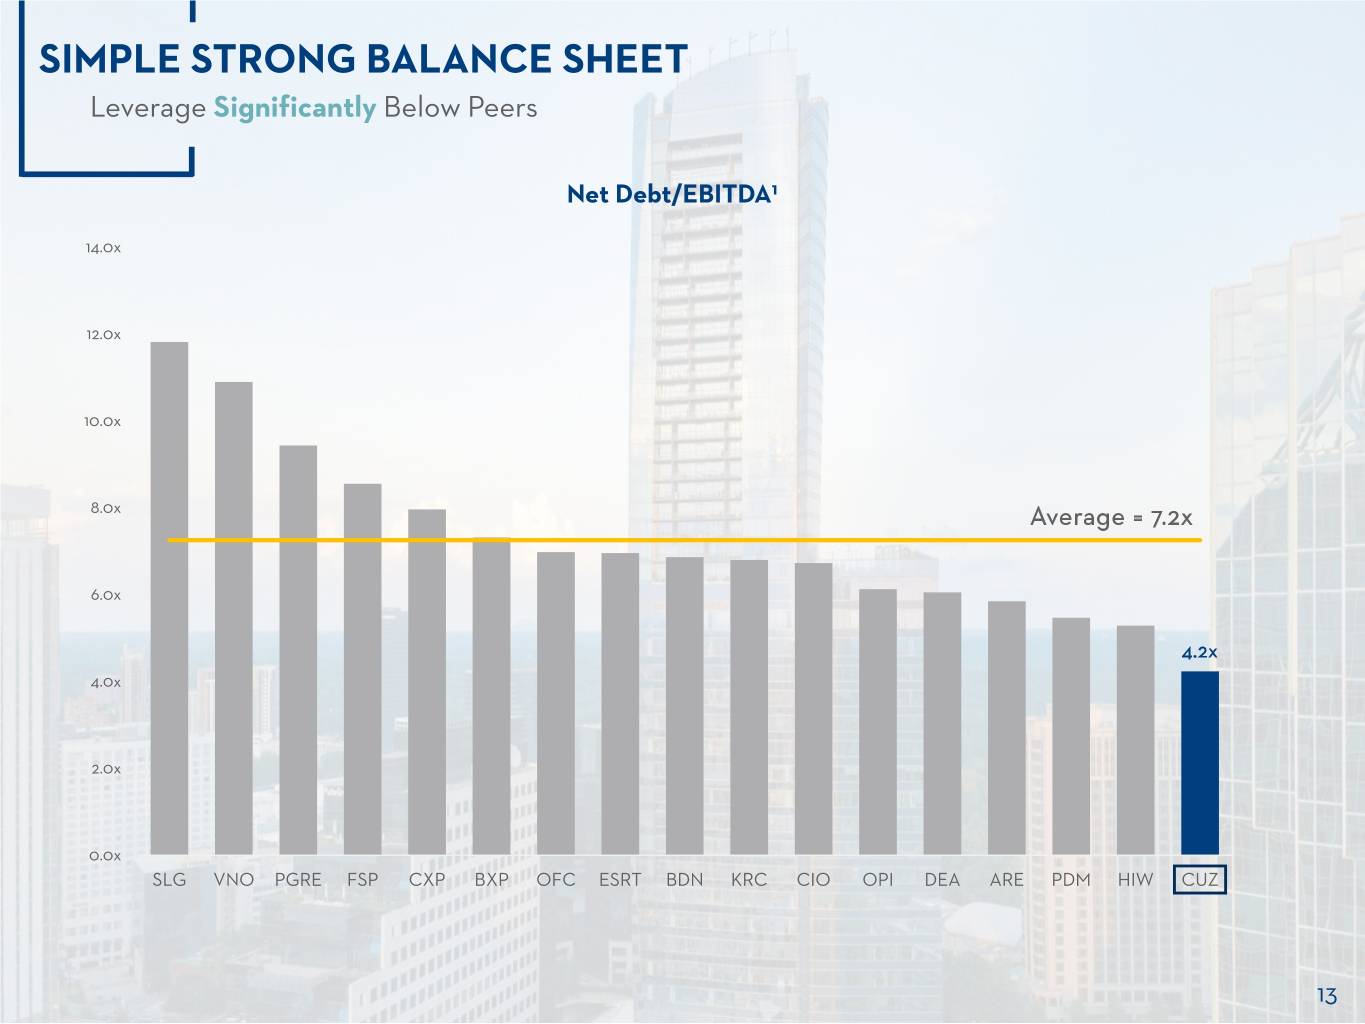
SIMPLE STRONG BALANCE SHEET Leverage Significantly Below Peers Net Debt/EBITDA1 14.0x 12.0x 10.0x 8.0x Average = 7.2x 6.0x 4.2x 4.0x 2.0x 0.0x SLG VNO PGRE FSP CXP BXP OFC ESRT BDN KRC CIO OPI DEA ARE PDM HIW CUZ 13
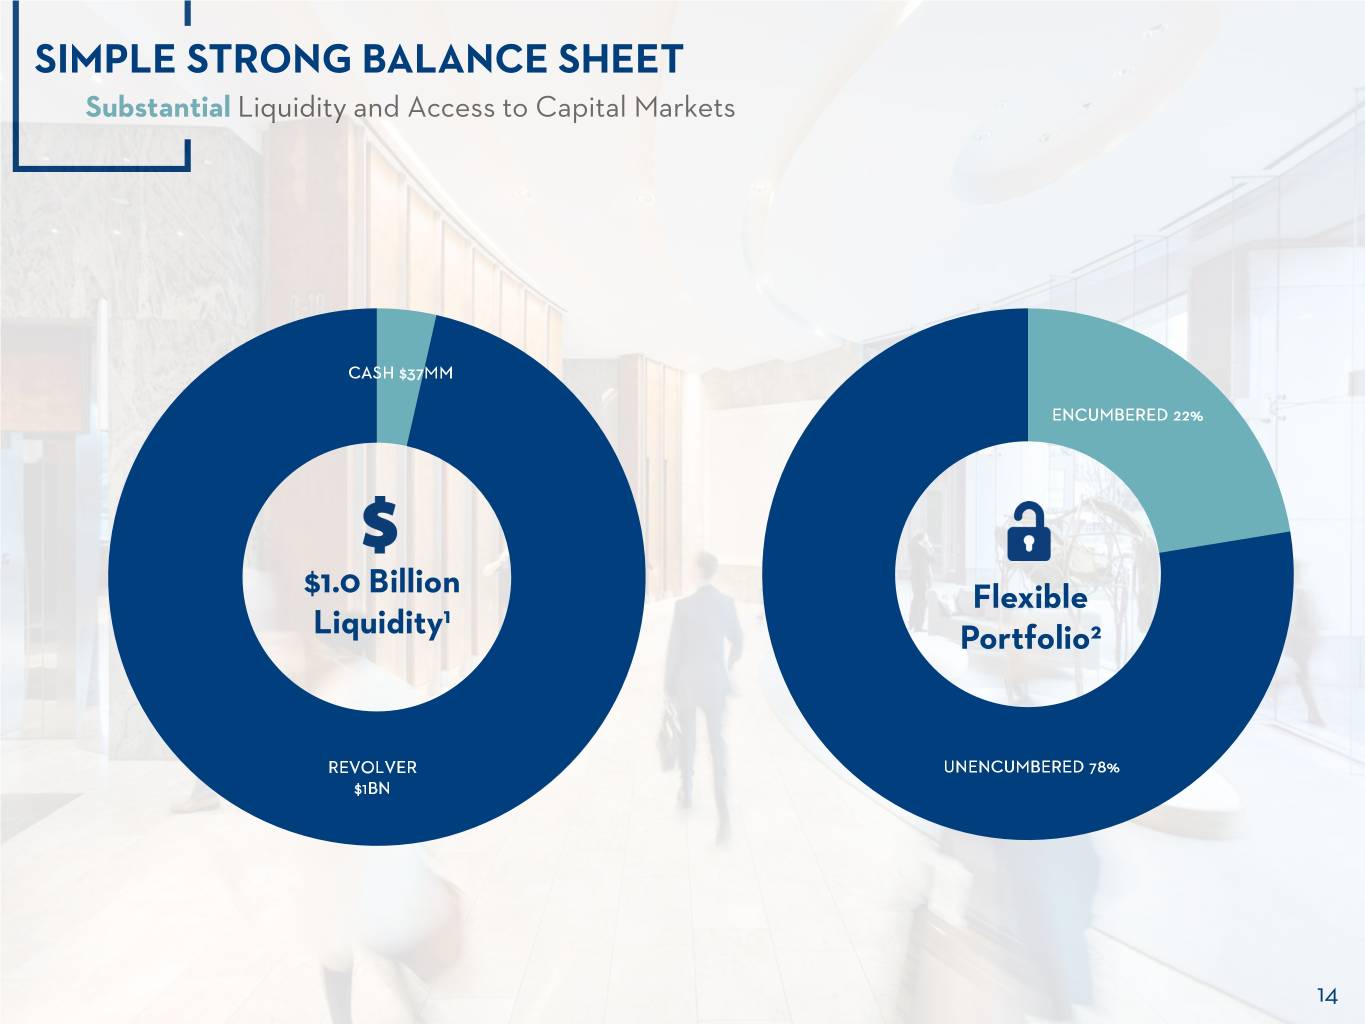
SIMPLE STRONG BALANCE SHEET Substantial Liquidity and Access to Capital Markets CASH $37MM ENCUMBERED 22% $1.0 Billion Flexible 1 Liquidity Portfolio2 REVOLVER UNENCUMBERED 78% $1BN 14

MEET OUR EXECUTIVE TEAM Stable, Experienced Leadership M. Colin Connolly Gregg D. Adzema President and Chief Executive Executive Vice President and Officer Chief Financial Officer Richard Hickson Pamela F. Roper Executive Vice President, Executive Vice President, General Operations Counsel and Corporate Secretary Kennedy Hicks John S. McColl Executive Vice President, Executive Vice President, Investments and Development Managing Director – Atlanta 15

APPENDIX
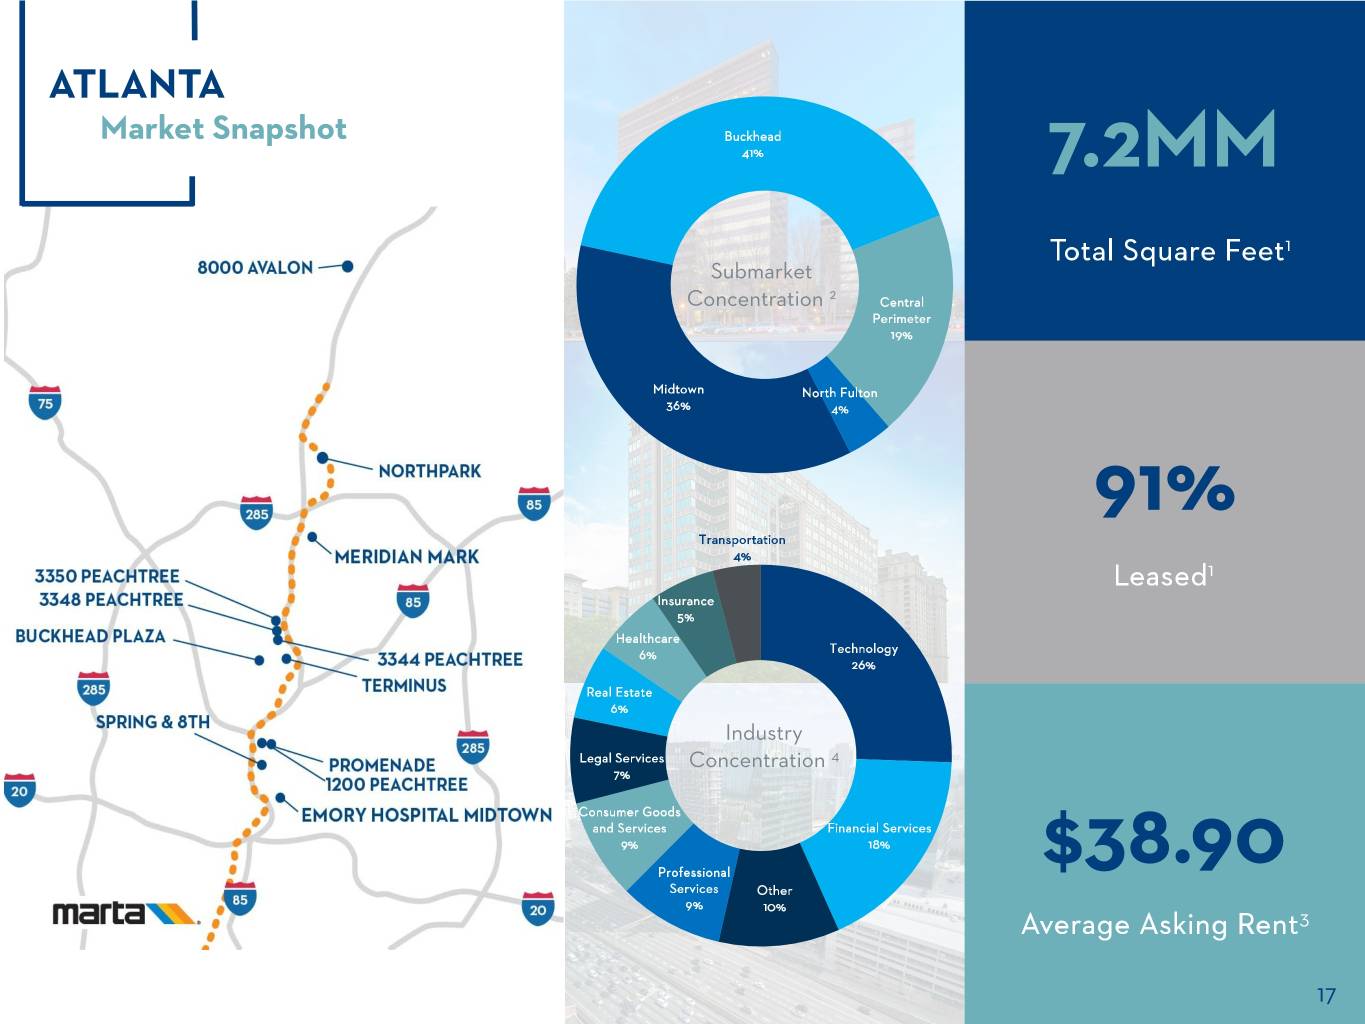
ATLANTA Market Snapshot Buckhead 41% 7.2MM Total Square Feet1 Submarket 2 Concentration Central Perimeter 19% Midtown North Fulton 36% 4% 91% Transportation 4% Leased1 Insurance 5% Healthcare 6% Technology 26% Real Estate 6% Industry Legal Services Concentration 4 7% Consumer Goods and Services Financial Services 9% 18% Professional $38.90 Services Other 9% 10% Average Asking Rent3 17
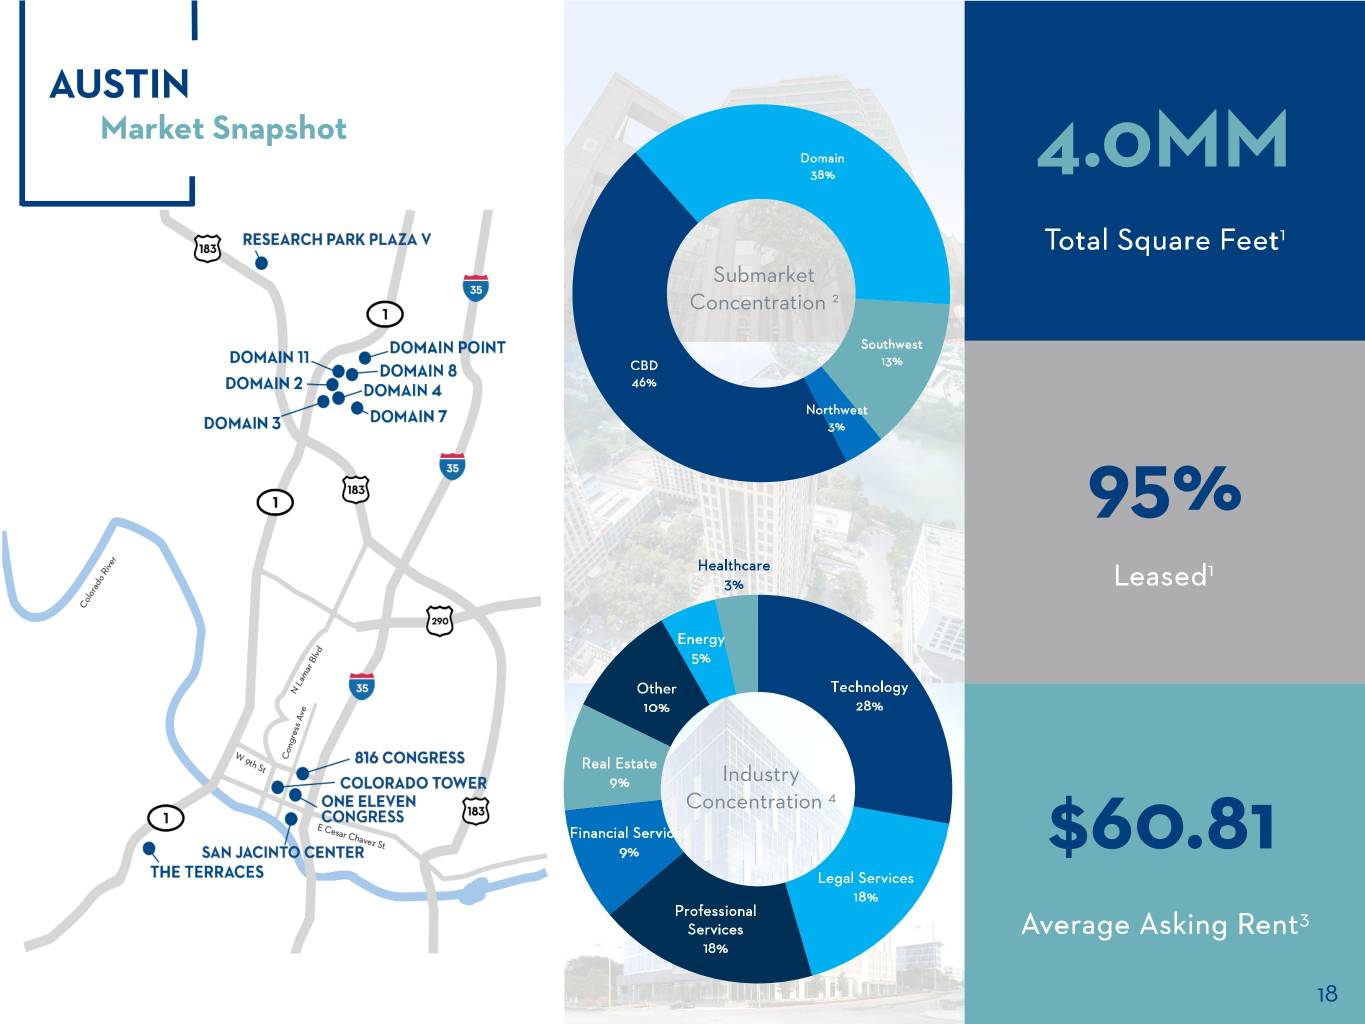
AUSTIN Market Snapshot Domain 38% 4.0MM Total Square Feet1 Submarket Concentration 2 Southwest CBD 13% 46% Northwest 3% 95% Healthcare 1 3% Leased Energy 5% Other Technology 10% 28% Real Estate 9% Industry Concentration 4 Financial Services 9% $60.81 Legal Services 18% Professional 3 Services Average Asking Rent 18% 18
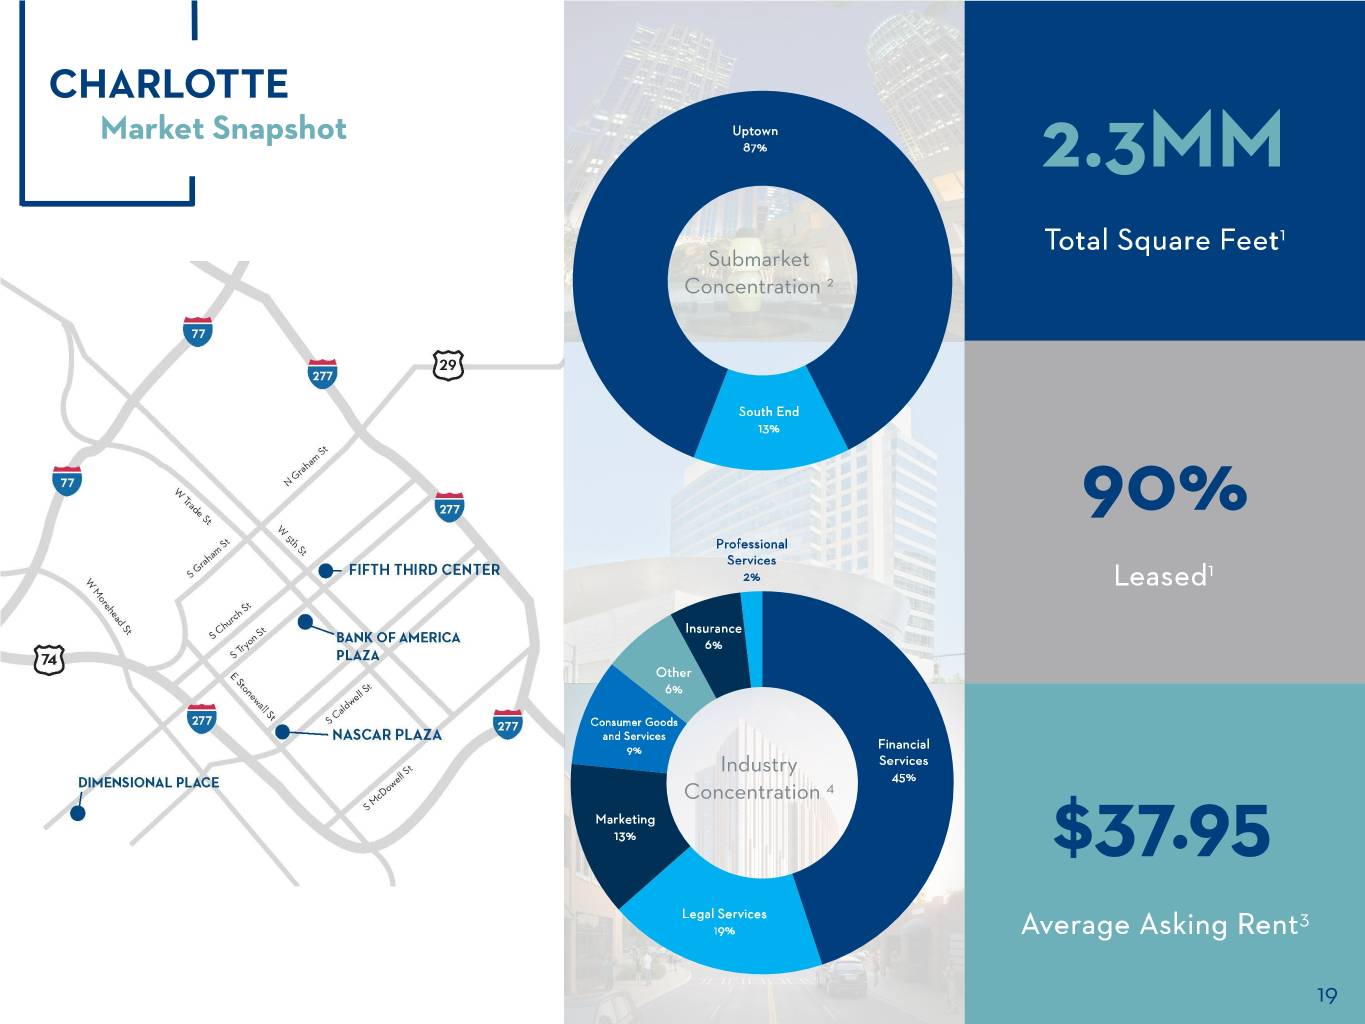
CHARLOTTE Market Snapshot Uptown 87% 2.3MM Total Square Feet1 Submarket Concentration 2 South End 13% 90% Professional Services 2% Leased1 Insurance 6% Other 6% Consumer Goods and Services 9% Financial Industry Services 45% Concentration 4 Marketing 13% $37.95 Legal Services 3 19% Average Asking Rent 19
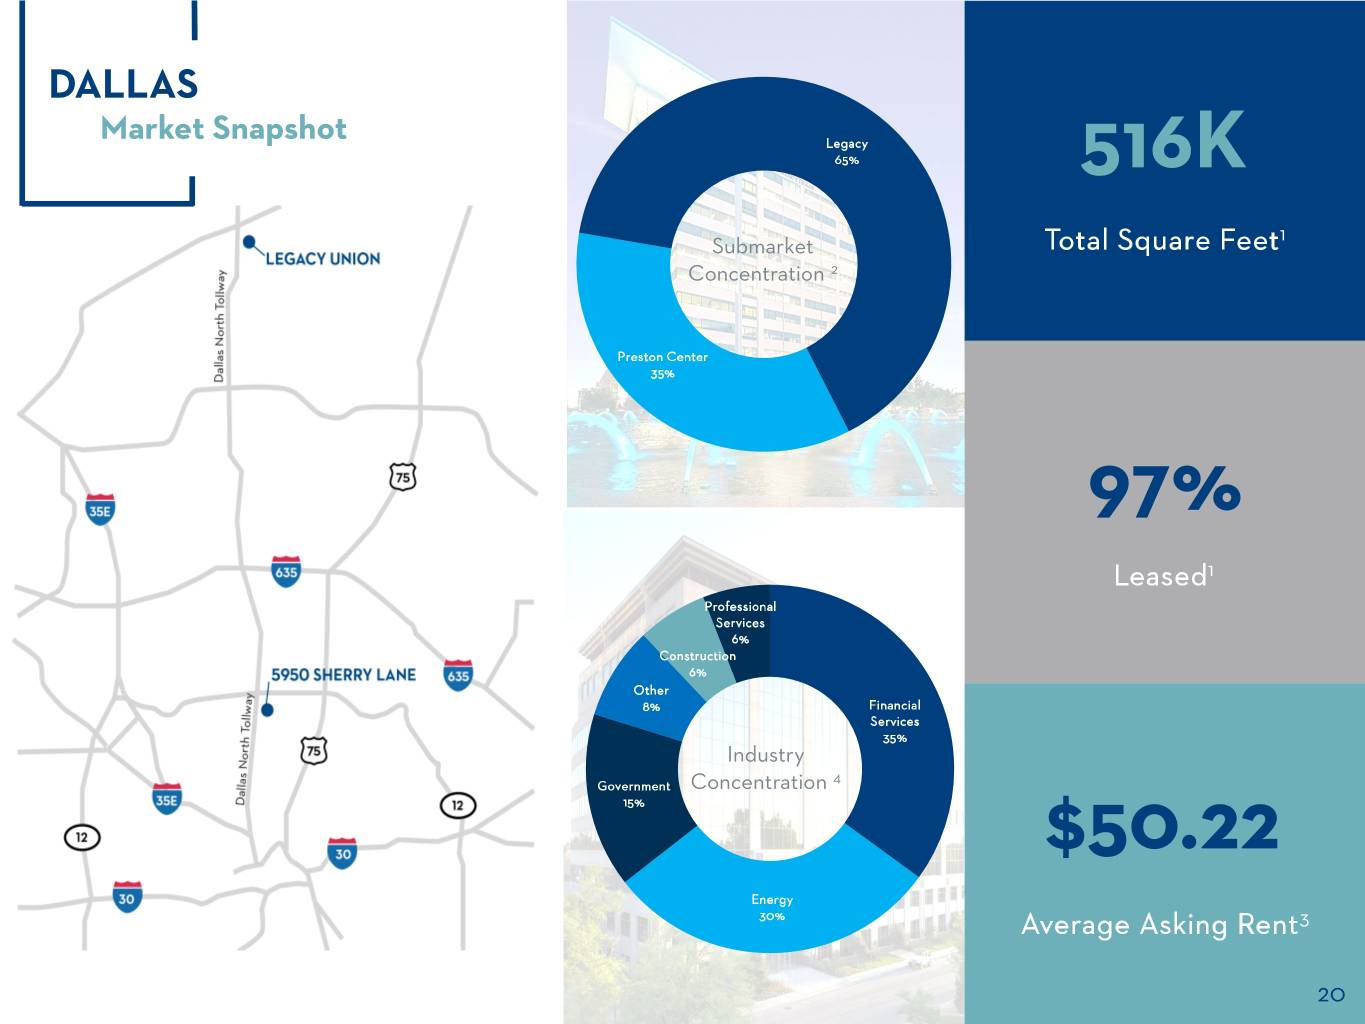
DALLAS Market Snapshot Legacy 65% 516K 1 Submarket Total Square Feet Concentration 2 Preston Center 35% 97% Leased1 Professional Services 6% Construction 6% Other 8% Financial Services 35% Industry 4 Government Concentration 15% $50.22 Energy 30% Average Asking Rent3 20
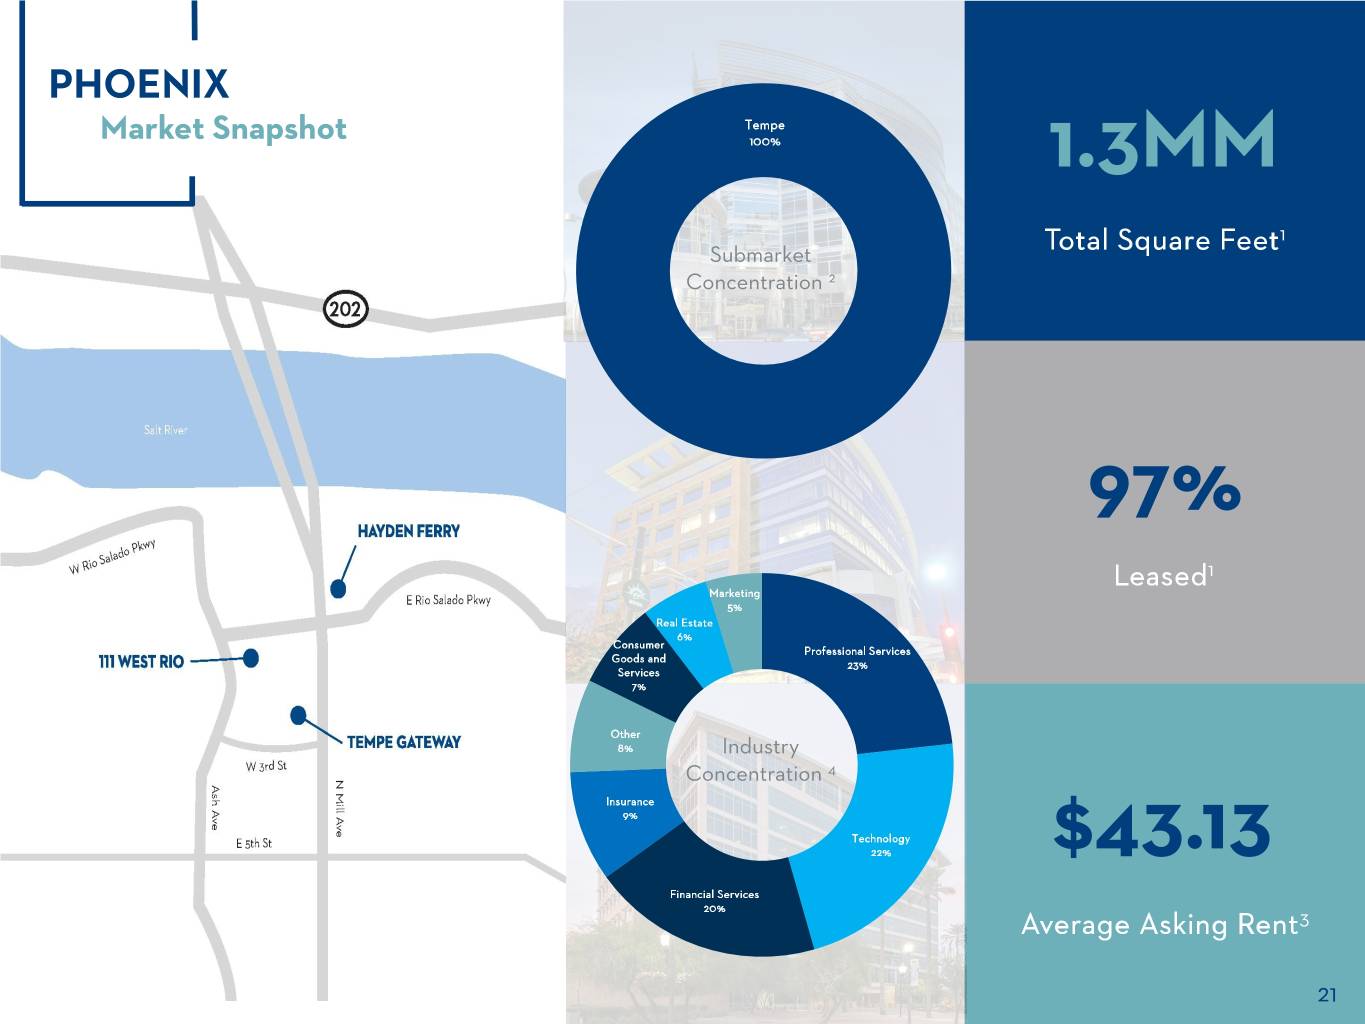
PHOENIX Market Snapshot Tempe 100% 1.3MM 1 Submarket Total Square Feet Concentration 2 97% Leased1 Marketing 5% Real Estate 6% Consumer Professional Services Goods and 23% Services 7% Other 8% Industry Concentration 4 Insurance 9% Technology 22% $43.13 Financial Services 20% Average Asking Rent3 21
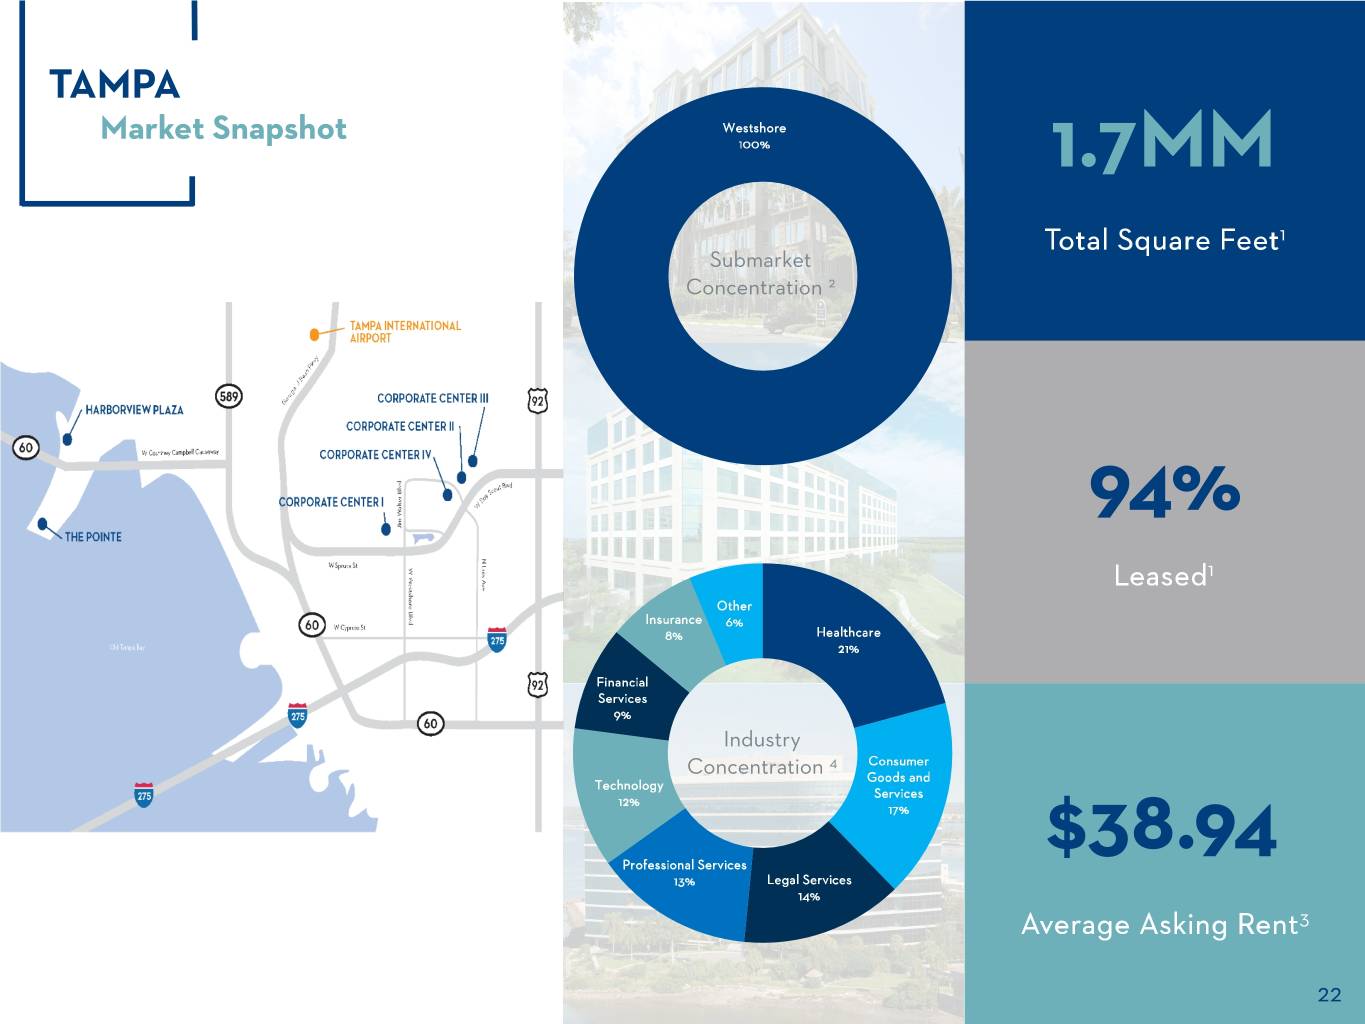
TAMPA Market Snapshot Westshore 100% 1.7MM Total Square Feet1 Submarket Concentration 2 94% Leased1 Other Insurance 6% 8% Healthcare 21% Financial Services 9% Industry 4 Consumer Concentration Goods and Technology Services 12% 17% $38.94 Professional Services 13% Legal Services 14% Average Asking Rent3 22
DEFINITIONS OF NON-GAAP MEASURES “NET OPERATING INCOME” (“NOI”) is used by industry analysts, investors and Company management to measure operating performance of the Company’s properties. Net Operating Income, which is rental property revenues less termination fees and rental property operating expenses, excludes certain components from net income in order to provide results that are more closely related to a property's results of operations. Certain items, such as interest expense, while included in FFO and net income, do not affect the operating performance of a real estate asset and are often incurred at the corporate level as opposed to the property level. As a result, management uses only those income and expense items that are incurred at the property level to evaluate a property's performance. Depreciation and amortization are also excluded from Net Operating Income. For clarity, NOI includes straight-line rents, amortization of lease inducements, amortization of acquired above and below market rents, and non-cash ground lease expense. In this presentation, the Company is presenting incremental NOI associated with its development for future periods. These non-GAAP measures are forward looking and specific only to the development projects outlined in this presentation. The Company has not finalized projections of its NOI for other projects in its portfolio and has not prepared consolidated projections for NOI or net income (the most comparable GAAP measure to NOI) for any period beyond 2020. Therefore, the Company has not presented a reconciliation of this incremental NOI to net income or any other GAAP financial measure. Such information is not available and would require unreasonable effort to produce in the context of this presentation. 22
ENDNOTES Page 1 – Rent Collections Update Page 10 – Compelling Growth Opportunities 1. As reported on October earnings conference call. 1. Represents actual Cousins’ share of NOI through 3Q20 and Cousins’ share of estimated NOI based on executed leases and other currently forecasted leasing for Page 2 – Cousins at a Glance 4Q20 and beyond. See definition of NOI on page 23. 1. As of 30-Sep-2020 filings. 2. Represents office leased percentage as of 30-Sep-2020. 2. As of 30-Sep-2020 filings. Includes only same property leased percentage. 3. Represents office leased percentage as of 30-Sep-2020. Page 11 – Compelling Growth Opportunities 4. Represents Cousins’ pro-rata share of NOI per 30-Sep-2020 filings. 1. Represents estimated developable SF, excluding redevelopment. Page 4– Resilient Market Fundamentals Page 12 – Compelling Growth Opportunities 1. Source: US Census Bureau; AMH Research, John Burns Real Estate Consulting, LLC 1. Increase in second generation net rent on a cash basis per Cousins’ quarterly filings. (Data: YoY Change from July 2018-2019) Pub: Oct-20. (Only includes migration trend changes greater than +33K and less than -33K) Page 13 – Simple Strong Balance Sheet 2. Source: CoStar data as of 30-Sep-2020. 1. Represents total debt, including company’s share of unconsolidated debt, net of 3. Source: KKR. KKR Insights 24-Sep-2020, “The New Normal.” cash divided by quarterly Annualized Adjusted EBITDAre as reported in companies’ most recent quarterly filings as of 30-Sep-2020. Includes members of the SNL US Page 5 – Resilient Market Fundamentals REIT Office Index. Excludes KBRS, CMCT, and DEI who either do not publish a 1. Source: CoStar for year-over-year 4 & 5 star office rent growth data as of 30-Sep- quarterly supplement or report quarterly EBITDA and EQC who has negative net 2020. debt/EBITDA. 2. Source: CoStar for net absorption data (12-months) and total office inventory as of 30-Sep-2020. Page 14 – Simple Strong Balance Sheet 1. Represents Cousins’ cash as of 30-Sep-2020 plus availability under Cousins’ Credit Page 6 – Strong Same Property Growth Facility as of 30-Sep-2020. 1. Peers include the following comparable office REITs: ARE, BXP, BDN, CMCT, CXP, 2. Calculation is based on pro rata share of NOI of Cousins assets for the quarter OFC, DEI, EQC, FSP, HIW, HPP, KRC, CLI, OPI, PGRE, PDM, SLG and VNO. Data ended 30-Sep-2020. collected from each company’s 3Q 2020 supplemental data and each company’s website. Appendix – Market Snapshots 1. Represents portfolio statistics of Company at 100% as reported in Cousins’ 30-Sep- Page 7 – Premier Sun Belt Portfolio 2020 filings. Excludes projects under construction. 1. Source: CoStar. Based on 100% of building square footage as of 30-Sep-2020. 2. Calculation is based on pro rata share of NOI of Cousins assets for the quarter Does not include 100% owner-occupied buildings or development/land assets. ended 30-Sep-2020. 3. Source: CoStar. Represents most recent weighted average gross rental rates of Page 8 – Premier Sun Belt Portfolio Cousins’ properties; where net rents are quoted, operating expenses are added to 1. Source: CoStar. Represents weighted average gross rental rates of 4 & 5 star achieve gross rents. properties as of 30-Sep-2020; where net rents are quoted, operating expenses are 4. Based on 3Q 2020 revenues. Management uses SIC codes when available along with added to achieve gross rents. judgement to determine tenant industry classification. Page 9 - Premier Sun Belt Portfolio 1. Full year lease expirations represent total portfolio percent of rent when available, otherwise percent of square footage as reported in companies’ most recent quarterly filings as of 30-Sep-2020. Includes members of the SNL US REIT Office Index. Excludes KBRS and CMCT who do not publish a quarterly supplement. 23
CAUTIONARY STATEMENT REGARDING FORWARD-LOOKING INFORMATION Certain matters contained in this report are “forward-looking statements” within the meaning of the federal securities laws and are subject to uncertainties and risks, as itemized in Item 1A included in the Annual Report on Form 10-K for the year ended December 31, 2019. These forward-looking statements include information about possible or assumed future results of the business and our financial condition, liquidity, results of operations, plans, and objectives. They also include, among other things, statements regarding subjects that are forward-looking by their nature, such as the following: guidance and underlying assumptions; business and financial strategy; future debt financings; future acquisitions and dispositions of operating assets or joint venture interests; future acquisitions and dispositions of land, including ground leases; future development and redevelopment opportunities, including fee development opportunities; future issuances and repurchases of common stock; future distributions; projected capital expenditures; market and industry trends; entry into new markets; future changes in interest rates; and all statements that address operating performance, events, or developments that we expect or anticipate will occur in the future — including statements relating to creating value for stockholders. Any forward-looking statements are based upon management's beliefs, assumptions, and expectations of our future performance, taking into account information that is currently available. These beliefs, assumptions, and expectations may change as a result of possible events or factors, not all of which are known. If a change occurs, our business, financial condition, liquidity, and results of operations may vary materially from those expressed in forward-looking statements. Actual results may vary from forward-looking statements due to, but not limited to, the following: the availability and terms of capital; the ability to refinance or repay indebtedness as it matures; the failure of purchase, sale, or other contracts to ultimately close; the failure to achieve anticipated benefits from acquisitions, investments, or dispositions; the potential dilutive effect of common stock or operating partnership unit issuances; the availability of buyers and pricing with respect to the disposition of assets; changes in national and local economic conditions, the real estate industry, and the commercial real estate markets in which we operate, particularly in Atlanta, Austin, Charlotte, Phoenix, Tampa, and Dallas where we have high concentrations of our lease revenues, including the impact of high unemployment, volatility in the public equity and debt markets, and international economic and other conditions; the impact of a public health crisis, including the COVID-19 pandemic, and the governmental and third party response to such a crisis, which may affect our key personnel, our major tenants, and the costs of operating our assets; the impact of social distancing, shelter-in-place, border closings, travel restrictions, remote work requirements, and similar governmental and private measures taken to combat the spread of the COVID-19 pandemic on our operations and our tenants; changes to our strategy with regard to land and other non-core holdings that may require impairment losses to be recognized; leasing risks, including the ability to obtain new tenants or renew expiring tenants, the ability to lease newly developed and/or recently acquired space, the failure of a tenant to occupy leased space, and the risk of declining leasing rates; changes in the needs of our tenants brought about by the desire for co-working arrangements, trends toward utilizing less office space per employee, and the effect of telecommuting; any adverse change in the financial condition of one or more of our tenants; volatility in interest rates and insurance rates; competition from other developers or investors; the risks associated with real estate developments (such as zoning approval, receipt of required permits, construction delays, cost overruns, and leasing risk); cyber security breaches; changes in senior management, changes in the Board of Directors, and the loss of key personnel; the potential liability for uninsured losses, condemnation, or environmental issues; the potential liability for a failure to meet regulatory requirements; the financial condition and liquidity of, or disputes with, joint venture partners; any failure to comply with debt covenants under credit agreements; any failure to continue to qualify for taxation as a real estate investment trust and meet regulatory requirements; potential changes to state, local, or federal regulations applicable to our business; material changes in the rates, or the ability to pay, dividends on common shares or other securities; potential changes to the tax laws impacting REITs and real estate in general; potential changes to the tax laws impacting REITs and real estate in general; and those additional risks and factors discussed in reports filed with the Securities and Exchange Commission ("SEC") by the Company. The words “believes,” “expects,” “anticipates,” “estimates,” “plans,” “may,” “intend,” “will,” or similar expressions are intended to identify forward-looking statements. Although we believe that our plans, intentions, and expectations reflected in any forward-looking statements are reasonable, we can give no assurance that such plans, intentions, or expectations will be achieved. We undertake no obligation to publicly update or revise any forward-looking statement, whether as a result of future events, new information, or otherwise, except as required under U.S. federal securities laws. 24

Gregg Adzema Roni Imbeaux cousins.com Executive Vice President and Chief Vice President, Finance and Investor Financial Officer Relations 3344 Peachtree Road NE gadzema@cousins.com rimbeaux@cousins.com Suite 1800 404.407.1116 404.407.1104 Atlanta, GA 30326

