Attached files
| file | filename |
|---|---|
| EX-32.2 - EX-32.2 - American Well Corp | d15152dex322.htm |
| EX-32.1 - EX-32.1 - American Well Corp | d15152dex321.htm |
| EX-31.2 - EX-31.2 - American Well Corp | d15152dex312.htm |
| EX-31.1 - EX-31.1 - American Well Corp | d15152dex311.htm |
Table of Contents
UNITED STATES
SECURITIES AND EXCHANGE COMMISSION
Washington, D.C. 20549
FORM 10-Q
(Mark One)
| ☒ | QUARTERLY REPORT PURSUANT TO SECTION 13 OR 15(d) OF THE SECURITIES EXCHANGE ACT OF 1934 |
For the quarterly period ended September 30, 2020
| ☐ | TRANSITION REPORT PURSUANT TO SECTION 13 OR 15(d) OF THE SECURITIES EXCHANGE ACT OF 1934 |
For the transition period from to
Commission File Number: 001-39515
American Well Corporation
(Exact name of registrant as specified in its charter)
| Delaware | 20-5009396 | |
| (State of incorporation) | (I.R.S. Employer Identification Number) |
75 State Street, 26th Floor
Boston, MA 02109
(Address of registrant’s principal executive offices)
(617) 204-3500
(Registrant’s telephone number, including area code)
Indicate by check mark whether the registrant: (1) has filed all reports required to be filed by Section 13 or 15(d) of the Securities Exchange Act of 1934 during the preceding 12 months (or for such shorter period that the registrant was required to file such reports), and (2) has been subject to such filing requirements for the past 90 days. Yes ☐ No ☒
Indicate by check mark whether the registrant has submitted electronically every Interactive Data File required to be submitted pursuant to Rule 405 of Regulation S-T (§232.405 of this chapter) during the preceding 12 months (or for such shorter period that the registrant was required to submit such files). Yes ☒ No ☐
Indicate by check mark whether the registrant is a large accelerated filer, an accelerated filer, a non-accelerated filer, smaller reporting company, or an emerging growth company. See the definition of “large accelerated filer,” “accelerated filer,” “smaller reporting company,” and “emerging growth company” in Rule 12b-2 of the Exchange Act.
| Large accelerated filer | ☐ | Accelerated filer | ☐ | |||
| Non-accelerated filer | ☒ | Smaller reporting company | ☐ | |||
| Emerging growth company | ☒ | |||||
If an emerging growth company, indicate by check mark if the registrant has elected not to use the extended transition period for complying with any new or revised financial accounting standards provided pursuant to Section 13(a) of the Exchange Act. ☐
Indicate by check mark whether the registrant is a shell company (as defined in Rule 12b-2 of the Exchange Act). Yes ☐ No ☒
Securities registered pursuant to Section 12(b) of the Act:
| Title of each class |
Trading Symbol(s) |
Name of each exchange on which registered | ||
| Class A common stock, par value of $0.01 per share |
AMWL | The New York Stock Exchange |
As of October 30, 2020, the number of shares of the registrant’s Class A common stock outstanding was 199,891,685, the number of shares of the registrant’s Class B common stock outstanding was 29,508,844 and the number of shares of the registrant’s Class C common stock outstanding was 5,555,555.
Table of Contents
QUARTERLY REPORT ON FORM 10-Q
For the period ended September 30, 2020
TABLE OF CONTENTS
| Page |
||||||
| PART I | 3 | |||||
| Item 1. | 3 | |||||
| Condensed Consolidated Balance Sheet as of September 30, 2020 (unaudited) and December 31, 2019 |
3 | |||||
| 4 | ||||||
| 5 | ||||||
| 7 | ||||||
| Notes to the Unaudited Condensed Consolidated Financial Statements |
8 | |||||
| Item 2 | Management’s Discussion and Analysis of Financial Condition and Results of Operations |
23 | ||||
| Item 3. | 36 | |||||
| Item 4. | 36 | |||||
| PART II | 38 | |||||
| Item 1. | 38 | |||||
| Item 1A. | 38 | |||||
| Item 2. | 38 | |||||
| Item 3. | 39 | |||||
| Item 4. | 39 | |||||
| Item 5. | 39 | |||||
| Item 6. | 40 | |||||
Table of Contents
PART I - FINANCIAL INFORMATION
AMERICAN WELL CORPORATION
CONDENSED CONSOLIDATED BALANCE SHEETS
(in thousands, except share and per share amounts)
(unaudited)
| September 30, 2020 |
December 31, 2019 |
|||||||
| Current assets: |
||||||||
| Cash and cash equivalents |
$ | 956,417 | $ | 137,673 | ||||
| Investments |
129,914 | 39,953 | ||||||
| Restricted cash |
300 | — | ||||||
| Accounts receivable ($1,408 and $2,601 from related parties and net of allowances of $1,333 and $686, respectively) |
39,962 | 32,730 | ||||||
| Inventories |
7,775 | 3,104 | ||||||
| Deferred contract acquisition costs |
865 | 1,130 | ||||||
| Prepaid expenses and other current assets |
8,408 | 8,937 | ||||||
|
|
|
|
|
|||||
| Total current assets |
1,143,641 | 223,527 | ||||||
| Restricted cash |
795 | 1,143 | ||||||
| Property and equipment, net |
4,352 | 2,664 | ||||||
| Goodwill |
193,877 | 193,877 | ||||||
| Intangible assets, net |
57,718 | 63,535 | ||||||
| Operating lease right-of-use asset |
8,201 | 11,944 | ||||||
| Deferred contract acquisition costs, net of current portion |
2,627 | 1,639 | ||||||
| Other assets |
1,126 | 1,552 | ||||||
| Investment in minority owned joint venture |
1,690 | — | ||||||
|
|
|
|
|
|||||
| Total assets |
$ | 1,414,027 | $ | 499,881 | ||||
|
|
|
|
|
|||||
| Liabilities, Convertible Preferred Stock and Stockholders’ Equity (Deficit) |
||||||||
| Current liabilities: |
||||||||
| Accounts payable |
$ | 7,670 | $ | 6,504 | ||||
| Accrued expenses and other current liabilities |
38,301 | 27,351 | ||||||
| Operating lease liability, current |
6,321 | 6,232 | ||||||
| Deferred revenue ($6,325 and $12,912 from related parties, respectively) |
54,324 | 66,490 | ||||||
|
|
|
|
|
|||||
| Total current liabilities |
106,616 | 106,577 | ||||||
| Other long-term liabilities |
115 | 309 | ||||||
| Operating lease liability, net of current portion |
3,056 | 7,164 | ||||||
| Deferred revenue, net of current portion ($275 and $1,385 from related parties, respectively) |
7,480 | 10,896 | ||||||
|
|
|
|
|
|||||
| Total liabilities |
117,267 | 124,946 | ||||||
|
|
|
|
|
|||||
| Commitments and contingencies (Note 12) |
||||||||
| Convertible preferred stock, $0.01 par value; no shares authorized, issued or outstanding as of September 30, 2020, and 17,744,445 shares authorized 14,061,508 shares issued and 14,012,935 shares outstanding as of December 31, 2019; aggregate liquidation preference of $0 and $608,449, respectively |
— | 655,799 | ||||||
| Stockholders’ equity (deficit): |
||||||||
| Preferred stock, $0.01 par value; 100,000,000 shares authorized, no shares issued or outstanding as of September 30, 2020, and no shares authorized, issued or outstanding as of December 31, 2019 |
— | — | ||||||
| Common stock, $0.01 par value; 1,000,000,000 Class A shares authorized, 200,131,318 shares issued and 199,647,646 shares outstanding, 100,000,000 Class B shares authorized, 29,950,326 shares issued and 29,032,042 shares outstanding, 200,000,000 Class C shares authorized 5,555,555 issued and outstanding as of September 30, 2020; and 220,000,000 common stock shares authorized, 42,338,679 shares issued and 42,302,845 shares outstanding as of December 31, 2019 |
2,343 | 423 | ||||||
| Treasury stock, 1,401,956 shares and 35,834 shares as of September 30, 2020 and as of December 31, 2019, respectively |
(24,320 | ) | (158 | ) | ||||
| Additional paid-in capital |
1,828,395 | 50,289 | ||||||
| Accumulated other comprehensive income |
50 | 250 | ||||||
| Accumulated deficit |
(532,047 | ) | (357,927 | ) | ||||
|
|
|
|
|
|||||
| Total American Well Corporation stockholders’ equity (deficit) |
1,274,421 | (307,123 | ) | |||||
| Non-controlling interest |
22,339 | 26,259 | ||||||
|
|
|
|
|
|||||
| Total stockholders’ equity (deficit) |
1,296,760 | (280,864 | ) | |||||
|
|
|
|
|
|||||
| Total liabilities, convertible preferred stock and stockholders’ equity (deficit) |
$ | 1,414,027 | $ | 499,881 | ||||
|
|
|
|
|
|||||
The accompanying notes are an integral part of these condensed consolidated financial statements.
3
Table of Contents
AMERICAN WELL CORPORATION
CONDENSED CONSOLIDATED STATEMENTS OF OPERATIONS AND COMPREHENSIVE LOSS
(in thousands, except share and per share amounts)
(unaudited)
| Three Months Ended September 30, | Nine Months Ended September 30, | |||||||||||||||
| 2020 | 2019 | 2020 | 2019 | |||||||||||||
| Revenue |
||||||||||||||||
| ($14,868, $8,253, $44,028 and $24,404 from related parties, respectively) |
$ | 62,551 | $ | 34,744 | $ | 184,833 | $ | 103,825 | ||||||||
| Costs and operating expenses: |
||||||||||||||||
| Costs of revenue, excluding depreciation and amortization of intangible assets |
42,116 | 19,060 | 118,969 | 55,060 | ||||||||||||
| Research and development |
25,275 | 13,602 | 57,848 | 39,169 | ||||||||||||
| Sales and marketing |
13,758 | 11,309 | 39,978 | 33,951 | ||||||||||||
| General and administrative |
43,113 | 14,654 | 138,537 | 40,189 | ||||||||||||
| Depreciation and amortization expense |
2,576 | 1,868 | 7,371 | 5,668 | ||||||||||||
|
|
|
|
|
|
|
|
|
|||||||||
| Total costs and operating expenses |
126,838 | 60,493 | 362,703 | 174,037 | ||||||||||||
|
|
|
|
|
|
|
|
|
|||||||||
| Loss from operations |
(64,287 | ) | (25,749 | ) | (177,870 | ) | (70,212 | ) | ||||||||
| Interest income and other income (expense), net |
255 | 1,286 | 1,410 | 4,547 | ||||||||||||
|
|
|
|
|
|
|
|
|
|||||||||
| Loss before benefit (expense) from income taxes and loss from equity method investment |
(64,032 | ) | (24,463 | ) | (176,460 | ) | (65,665 | ) | ||||||||
| Benefit (expense) from income taxes |
(78 | ) | 392 | (330 | ) | 22 | ||||||||||
| Loss from equity method investment |
(486 | ) | — | (1,250 | ) | — | ||||||||||
|
|
|
|
|
|
|
|
|
|||||||||
| Net loss |
(64,596 | ) | (24,071 | ) | (178,040 | ) | (65,643 | ) | ||||||||
| Net loss attributable to non-controlling interest |
(1,515 | ) | (56 | ) | (3,920 | ) | (884 | ) | ||||||||
|
|
|
|
|
|
|
|
|
|||||||||
| Net loss attributable to American Well Corporation |
$ | (63,081 | ) | $ | (24,015 | ) | $ | (174,120 | ) | $ | (64,759 | ) | ||||
|
|
|
|
|
|
|
|
|
|||||||||
| Net loss per share attributable to common stockholders, basic and diluted |
$ | (0.92 | ) | $ | (0.57 | ) | $ | (3.38 | ) | $ | (1.55 | ) | ||||
| Weighted-average common shares outstanding, basic and diluted |
68,499,106 | 41,933,597 | 51,492,988 | 41,805,929 | ||||||||||||
| Net loss |
$ | (64,596 | ) | $ | (24,071 | ) | $ | (178,040 | ) | $ | (65,643 | ) | ||||
| Other comprehensive loss, net of tax: |
||||||||||||||||
| Unrealized loss on available-for-sale investments |
(135 | ) | (226 | ) | (415 | ) | (938 | ) | ||||||||
| Foreign currency translation |
37 | (59 | ) | 215 | (188 | ) | ||||||||||
|
|
|
|
|
|
|
|
|
|||||||||
| Comprehensive loss |
(64,694 | ) | (24,356 | ) | (178,240 | ) | (66,769 | ) | ||||||||
| Less: Comprehensive loss attributable to non-controlling interest |
(1,515 | ) | (56 | ) | (3,920 | ) | (884 | ) | ||||||||
|
|
|
|
|
|
|
|
|
|||||||||
| Comprehensive loss attributable to American Well Corporation |
$ | (63,179 | ) | $ | (24,300 | ) | $ | (174,320 | ) | $ | (65,885 | ) | ||||
|
|
|
|
|
|
|
|
|
|||||||||
The accompanying notes are an integral part of these condensed consolidated financial statements.
4
Table of Contents
AMERICAN WELL CORPORATION
CONDENSED CONSOLIDATED STATEMENTS OF CONVERTIBLE PREFERRED STOCK AND STOCKHOLDERS’ EQUITY (DEFICIT)
(in thousands, except share amounts)
(unaudited)
| Convertible Preferred Stock |
Common Stock, Class A, Class B and Class C shares |
Treasury Stock |
Additional Paid-In Capital |
Accumulated Other Comprehensive Income (Loss) |
Accumulated Deficit |
American Well Corporation Stockholders’ Equity (Deficit) |
Noncontrolling Interest |
Total Stockholders’ Equity (Deficit) |
||||||||||||||||||||||||||||||||||||
| Shares | Amount | Shares | Amount | |||||||||||||||||||||||||||||||||||||||||
| Balances as of December 31, 2019 |
14,012,935 | $ | 655,799 | 42,302,845 | $ | 423 | $ | (158 | ) | $ | 50,289 | $ | 250 | $ | (357,927 | ) | $ | (307,123 | ) | $ | 26,259 | $ | (280,864 | ) | ||||||||||||||||||||
| Issuance of Series C convertible preferred stock, net of issuance costs of $261 |
170,000 | 12,489 | — | — | — | — | — | — | — | — | — | |||||||||||||||||||||||||||||||||
| Exercise of common stock options |
— | — | 7,392 | — | — | 2 | — | — | 2 | — | 2 | |||||||||||||||||||||||||||||||||
| Vesting of restricted stock units |
— | — | 146,969 | 1 | — | — | — | — | 1 | — | 1 | |||||||||||||||||||||||||||||||||
| Stock-based compensation expense |
— | — | — | — | — | 4,458 | — | — | 4,458 | — | 4,458 | |||||||||||||||||||||||||||||||||
| Retirement of treasury stock |
— | — | — | — | 158 | (158 | ) | — | — | — | — | — | ||||||||||||||||||||||||||||||||
| Currency translation adjustment |
— | — | — | — | — | — | (171 | ) | — | (171 | ) | — | (171 | ) | ||||||||||||||||||||||||||||||
| Unrealized gains on available-for-sale securities, net of tax |
— | — | — | — | — | — | 43 | — | 43 | — | 43 | |||||||||||||||||||||||||||||||||
| Net loss |
— | — | — | — | — | — | — | (24,382 | ) | (24,382 | ) | (843 | ) | (25,225 | ) | |||||||||||||||||||||||||||||
|
|
|
|
|
|
|
|
|
|
|
|
|
|
|
|
|
|
|
|
|
|
|
|||||||||||||||||||||||
| Balances as of March 31, 2020 |
14,182,935 | $ | 668,288 | 42,457,206 | $ | 424 | $ | — | $ | 54,591 | $ | 122 | $ | (382,309 | ) | $ | (327,172 | ) | $ | 25,416 | $ | (301,756 | ) | |||||||||||||||||||||
|
|
|
|
|
|
|
|
|
|
|
|
|
|
|
|
|
|
|
|
|
|
|
|||||||||||||||||||||||
| Issuance of Series C convertible preferred stock, net of issuance costs of $750 |
1,342,750 | 133,525 | — | — | — | — | — | — | — | — | — | |||||||||||||||||||||||||||||||||
| Exercise of common stock options |
— | — | 768,106 | 8 | — | 2,319 | — | — | 2,327 | — | 2,327 | |||||||||||||||||||||||||||||||||
| Vesting of restricted stock units |
— | — | 204,829 | 2 | — | — | — | — | 2 | — | 2 | |||||||||||||||||||||||||||||||||
| Treasury stock |
— | — | (61,600 | ) | — | (163 | ) | — | — | — | (163 | ) | — | (163 | ) | |||||||||||||||||||||||||||||
| Stock-based compensation expense |
— | — | — | — | — | 67,638 | — | — | 67,638 | — | 67,638 | |||||||||||||||||||||||||||||||||
| Currency translation adjustment |
— | — | — | — | — | — | 349 | — | 349 | — | 349 | |||||||||||||||||||||||||||||||||
| Unrealized loss on available-for-sale securities, net of tax |
— | — | — | — | — | — | (323 | ) | — | (323 | ) | — | (323 | ) | ||||||||||||||||||||||||||||||
| Net loss |
— | — | — | — | — | — | — | (86,657 | ) | (86,657 | ) | (1,562 | ) | (88,219 | ) | |||||||||||||||||||||||||||||
|
|
|
|
|
|
|
|
|
|
|
|
|
|
|
|
|
|
|
|
|
|
|
|||||||||||||||||||||||
| Balances as of June 30, 2020 |
15,525,685 | $ | 801,813 | 43,368,541 | $ | 434 | $ | (163 | ) | $ | 124,548 | $ | 148 | $ | (468,966 | ) | $ | (343,999 | ) | $ | 23,854 | $ | (320,145 | ) | ||||||||||||||||||||
|
|
|
|
|
|
|
|
|
|
|
|
|
|
|
|
|
|
|
|
|
|
|
|||||||||||||||||||||||
| Exercise of common stock options |
— | — | 885,253 | 9 | — | 1,877 | — | — | 1,886 | — | 1,886 | |||||||||||||||||||||||||||||||||
| Vesting of restricted stock units |
— | — | 3,458,849 | 34 | — | (34 | ) | — | — | — | — | — | ||||||||||||||||||||||||||||||||
| Class A and Class B shares withheld related to net share settlement of loans |
— | — | (1,340,354 | ) | (13 | ) | (24,157 | ) | 13 | — | — | (24,157 | ) | — | (24,157 | ) | ||||||||||||||||||||||||||||
| Conversion of Series A, Series B, and Series C convertible preferred stock into Class A shares |
(15,525,685 | ) | (801,813 | ) | 136,625,900 | 1,366 | — | 800,447 | — | — | 801,813 | — | 801,813 | |||||||||||||||||||||||||||||||
| Issuance of Class A shares in connection with initial public offering, net of offering costs and underwriting discounts of $53,730 |
— | — | 45,681,499 | 457 | — | 768,080 | — | — | 768,537 | — | 768,537 | |||||||||||||||||||||||||||||||||
| Issuance of Class C shares in connection with Google Private Placement, net of offering costs of $900 |
— | — | 5,555,555 | 56 | — | 99,044 | — | — | 99,100 | — | 99,100 | |||||||||||||||||||||||||||||||||
| Stock-based compensation expense |
— | — | — | — | — | 34,420 | — | — | 34,420 | — | 34,420 | |||||||||||||||||||||||||||||||||
| Currency translation adjustment |
— | — | — | — | — | — | 37 | — | 37 | — | 37 | |||||||||||||||||||||||||||||||||
| Unrealized loss on available-for-sale securities, net of tax |
— | — | — | — | — | — | (135 | ) | — | (135 | ) | — | (135 | ) | ||||||||||||||||||||||||||||||
| Net loss |
— | — | — | — | — | — | — | (63,081 | ) | (63,081 | ) | (1,515 | ) | (64,596 | ) | |||||||||||||||||||||||||||||
|
|
|
|
|
|
|
|
|
|
|
|
|
|
|
|
|
|
|
|
|
|
|
|||||||||||||||||||||||
| Balances as of September 30, 2020 |
— | $ | — | 234,235,243 | $ | 2,343 | $ | (24,320 | ) | $ | 1,828,395 | $ | 50 | $ | (532,047 | ) | $ | 1,274,421 | $ | 22,339 | $ | 1,296,760 | ||||||||||||||||||||||
|
|
|
|
|
|
|
|
|
|
|
|
|
|
|
|
|
|
|
|
|
|
|
|||||||||||||||||||||||
The accompanying notes are an integral part of these condensed consolidated financial statements.
5
Table of Contents
AMERICAN WELL CORPORATION
CONDENSED CONSOLIDATED STATEMENTS OF CONVERTIBLE PREFERRED STOCK AND STOCKHOLDERS’ DEFICIT
(in thousands, except share amounts)
(unaudited)
| Convertible Preferred Stock |
Common Stock | Additional Paid-In Capital |
Accumulated Other Comprehensive Income (Loss) |
American Well Corporation Stockholders’ Deficit |
Total Stockholders’ Deficit |
|||||||||||||||||||||||||||||||||||||||
| Shares | Amount | Shares | Amount | Treasury Stock |
Accumulated Deficit |
Noncontrolling Interest |
||||||||||||||||||||||||||||||||||||||
| Balances as of December 31, 2018 |
12,927,549 | $ | 575,713 | 41,393,622 | $ | 414 | — | $ | 37,127 | $ | 1,351 | $ | (270,737 | ) | $ | (231,845 | ) | $ | 27,435 | $ | (204,410 | ) | ||||||||||||||||||||||
| Exercise of common stock options |
— | — | 443,846 | 4 | — | 357 | — | — | 361 | — | 361 | |||||||||||||||||||||||||||||||||
| Stock-based compensation expense |
— | — | — | — | — | 2,600 | — | — | 2,600 | — | 2,600 | |||||||||||||||||||||||||||||||||
| Currency translation adjustment |
— | — | — | — | — | — | (49 | ) | — | (49 | ) | — | (49 | ) | ||||||||||||||||||||||||||||||
| Unrealized loss on available-for-sale securities, net of tax |
— | — | — | — | — | — | (333 | ) | — | (333 | ) | — | (333 | ) | ||||||||||||||||||||||||||||||
| Net loss |
— | — | — | — | — | — | — | (21,131 | ) | (21,131 | ) | (384 | ) | (21,515 | ) | |||||||||||||||||||||||||||||
|
|
|
|
|
|
|
|
|
|
|
|
|
|
|
|
|
|
|
|
|
|
|
|||||||||||||||||||||||
| Balances as of March 31, 2019 |
12,927,549 | $ | 575,713 | 41,837,468 | $ | 418 | $ | — | $ | 40,084 | $ | 969 | $ | (291,868 | ) | $ | (250,397 | ) | $ | 27,051 | $ | (223,346 | ) | |||||||||||||||||||||
|
|
|
|
|
|
|
|
|
|
|
|
|
|
|
|
|
|
|
|
|
|
|
|||||||||||||||||||||||
| Exercise of common stock options |
— | — | 11,546 | — | — | 18 | — | — | 18 | — | 18 | |||||||||||||||||||||||||||||||||
| Stock-based compensation expense |
— | — | — | — | — | 2,471 | — | — | 2,471 | — | 2,471 | |||||||||||||||||||||||||||||||||
| Currency translation adjustment |
— | — | — | — | — | — | (80 | ) | — | (80 | ) | — | (80 | ) | ||||||||||||||||||||||||||||||
| Unrealized loss on available-for-sale securities, net of tax |
— | — | — | — | — | — | (379 | ) | — | (379 | ) | — | (379 | ) | ||||||||||||||||||||||||||||||
| Net loss |
— | — | — | — | — | — | — | (19,613 | ) | (19,613 | ) | (444 | ) | (20,057 | ) | |||||||||||||||||||||||||||||
|
|
|
|
|
|
|
|
|
|
|
|
|
|
|
|
|
|
|
|
|
|
|
|||||||||||||||||||||||
| Balances as of June 30, 2019 |
12,927,549 | $ | 575,713 | 41,849,014 | $ | 418 | $ | — | $ | 42,573 | $ | 510 | $ | (311,481 | ) | $ | (267,980 | ) | $ | 26,607 | $ | (241,373 | ) | |||||||||||||||||||||
|
|
|
|
|
|
|
|
|
|
|
|
|
|
|
|
|
|
|
|
|
|
|
|||||||||||||||||||||||
| Exercise of common stock options |
— | — | 75,647 | 1 | — | 229 | — | — | 230 | — | 230 | |||||||||||||||||||||||||||||||||
| Vesting of restricted stock units |
— | — | 146,968 | 1 | — | — | — | — | 1 | — | 1 | |||||||||||||||||||||||||||||||||
| Stock-based compensation expense |
— | — | — | — | — | 3,604 | — | — | 3,604 | — | 3,604 | |||||||||||||||||||||||||||||||||
| Treasury Stock |
— | — | (35,834 | ) | — | (158 | ) | — | — | — | (158 | ) | — | (158 | ) | |||||||||||||||||||||||||||||
| Currency translation adjustment |
— | — | — | — | — | — | (59 | ) | — | (59 | ) | — | (59 | ) | ||||||||||||||||||||||||||||||
| Unrealized loss on available-for-sale securities, net of tax |
— | — | — | — | — | — | (226 | ) | — | (226 | ) | — | (226 | ) | ||||||||||||||||||||||||||||||
| Net loss |
— | — | — | — | — | — | — | (24,015 | ) | (24,015 | ) | (56 | ) | (24,071 | ) | |||||||||||||||||||||||||||||
|
|
|
|
|
|
|
|
|
|
|
|
|
|
|
|
|
|
|
|
|
|
|
|||||||||||||||||||||||
| Balances as of September 30, 2019 |
12,927,549 | $ | 575,713 | 42,035,795 | 420 | (158 | ) | $ | 46,406 | $ | 225 | $ | (335,496 | ) | $ | (288,603 | ) | $ | 26,551 | $ | (262,052 | ) | ||||||||||||||||||||||
|
|
|
|
|
|
|
|
|
|
|
|
|
|
|
|
|
|
|
|
|
|
|
|||||||||||||||||||||||
The accompanying notes are an integral part of these condensed consolidated financial statements.
6
Table of Contents
AMERICAN WELL CORPORATION
CONDENSED CONSOLIDATED STATEMENTS OF CASH FLOWS
(in thousands, except share and per share amounts)
(unaudited)
| Nine Months Ended September 30, |
||||||||
| 2020 | 2019 | |||||||
| Net loss |
$ | (178,040 | ) | $ | (65,643 | ) | ||
| Adjustments to reconcile net loss to net cash used in operating activities: |
||||||||
| Depreciation and amortization expense |
7,371 | 5,668 | ||||||
| Provisions for doubtful accounts |
1,236 | 621 | ||||||
| Amortization of deferred contract acquisition costs |
852 | 797 | ||||||
| Amortization of deferred contract fulfillment costs |
510 | 531 | ||||||
| Stock-based compensation expense |
106,516 | 8,675 | ||||||
| Loss on equity method investment |
1,250 | — | ||||||
| Changes in operating assets and liabilities, net of acquisition: |
||||||||
| Accounts receivable |
(8,468 | ) | 11,878 | |||||
| Inventories |
(4,671 | ) | (500 | ) | ||||
| Deferred contract acquisition costs |
(1,575 | ) | (1,115 | ) | ||||
| Prepaid expenses and other current assets |
(1 | ) | (797 | ) | ||||
| Other assets |
426 | (846 | ) | |||||
| Accounts payable |
(135 | ) | 13 | |||||
| Accrued expenses and other current liabilities |
2,353 | 553 | ||||||
| Other long-term liabilities |
(194 | ) | (902 | ) | ||||
| Deferred revenue |
(15,364 | ) | (25,548 | ) | ||||
|
|
|
|
|
|||||
| Net cash used in operating activities |
(87,934 | ) | (66,615 | ) | ||||
|
|
|
|
|
|||||
| Cash flows from investing activities: |
||||||||
| Purchases of property and equipment |
(3,261 | ) | (1,098 | ) | ||||
| Investment in minority owned joint venture |
(2,940 | ) | — | |||||
| Purchases of investments |
(159,608 | ) | (78,946 | ) | ||||
| Proceeds from sales and maturities of investments |
69,132 | 226,509 | ||||||
|
|
|
|
|
|||||
| Net cash (used in) provided by investing activities |
(96,677 | ) | 146,465 | |||||
|
|
|
|
|
|||||
| Cash flows from financing activities: |
||||||||
| Proceeds from issuance of Series C convertible preferred stock, net of issuance costs |
146,014 | — | ||||||
| Proceeds from exercise of common stock options |
4,235 | 610 | ||||||
| Payments for the purchase of treasury stock |
(18,417 | ) | (158 | ) | ||||
| Proceeds from issuance of common stock in initial public offering, net of underwriting costs and commissions |
772,931 | — | ||||||
| Proceeds from issuance of common stock to Google |
100,000 | — | ||||||
| Payment of deferred offering costs |
(1,456 | ) | — | |||||
|
|
|
|
|
|||||
| Net cash provided by financing activities |
1,003,307 | 452 | ||||||
|
|
|
|
|
|||||
| Net increase in cash, cash equivalents, and restricted cash |
818,696 | 80,302 | ||||||
| Cash, cash equivalents, and restricted cash at beginning of period |
138,816 | 54,070 | ||||||
|
|
|
|
|
|||||
| Cash, cash equivalents, and restricted cash at end of period |
$ | 957,512 | $ | 134,372 | ||||
|
|
|
|
|
|||||
| Cash, cash equivalents, and restricted cash at end of period: |
||||||||
| Cash and cash equivalents |
956,417 | 133,277 | ||||||
| Restricted cash |
1,095 | 1,095 | ||||||
|
|
|
|
|
|||||
| Total cash, cash equivalents, and restricted cash at end of period |
$ | 957,512 | $ | 134,372 | ||||
|
|
|
|
|
|||||
| Supplemental disclosure of cash flow information: |
||||||||
| Cash paid for income taxes |
$ | 138 | $ | — | ||||
| Supplemental disclosure of non-cash investing and financing activities: |
||||||||
| Additions to property and equipment included in accrued expenses and accounts payable |
$ | 19 | $ | — | ||||
| Initial public offering and Google common stock offering costs in accrued expenses |
$ | 3,838 | $ | — | ||||
| Treasury stock costs in accrued expenses |
$ | 5,903 | $ | — | ||||
The accompanying notes are an integral part of these condensed consolidated financial statements.
7
Table of Contents
AMERICAN WELL CORPORATION
NOTES TO CONDENSED CONSOLIDATED FINANCIAL STATEMENTS
(in thousands, except share and per share amounts)
(unaudited)
1. Organization and Description of Business
Description of Business
American Well Corporation (the “Company”) was incorporated under the laws of the State of Delaware in June 2006. The Company is headquartered in Boston, Massachusetts. The Company is a leading telehealth company that enables the digital distribution and delivery of care for healthcare’s key stakeholders. The Company’s scalable technology is deployed at the enterprise level of clients, embeds into existing offerings and workflows, spans the continuum of care and enables the delivery of this care across a wide variety of clinical, retail, school and home settings.
The Company is subject to a number of risks similar to other companies of a similar size in the high technology industry, including, but not limited to, uncertainty of progress in developing technologies, new technological innovations, dependence on key personnel, protection of proprietary technology, uncertainty of market acceptance of telehealth and the need for additional financing.
Initial Public Offering
On September 21, 2020, the Company closed on its initial public offering (the “IPO”) in which the Company issued and sold 45,681,499 shares of Class A common stock, including the exercise of an underwriter option to purchase additional shares, at an issuance price of $18.00 per share. The Company received net proceeds of $768,537 after deducting underwriting discounts and commissions of $49,336 as well as other offering costs of $4,394. Upon the closing of the IPO, the Company’s then-outstanding convertible preferred stock converted into an aggregate of 136,625,900 shares of Class A common stock.
Google Private Placement
On August 22, 2020, the Company entered into a strategic partnership and stock purchase agreement with Google LLC, where the Company agreed to issue Google $100,000 of Class C common stock, with the price per share to be equal to the purchase price in the IPO. Concurrently with the IPO, the Company consummated the private placement offering to Google and issued Google 5,555,555 shares of Class C common stock for $99,100 after deducting offering costs of $900.
Stock Split
On August 28, 2020 the Company effected an 8.8-for-1.0 stock split of its issued and outstanding shares of common stock and a proportional adjustment to the existing conversion ratios for each series of the Company’s then outstanding convertible preferred stock (see Note 11). The corresponding number of shares and exercise prices related to stock options and RSUs were also adjusted. The impact of the stock split has been applied retrospectively to all periods presented.
Liquidity and Capital Resources
The accompanying condensed consolidated financial statements have been prepared on the basis of continuity of operations, realization of assets, and the satisfaction of liabilities and commitments in the ordinary course of business. Through September 30, 2020, the Company has primarily funded its operations with proceeds from the initial public offering, the sales of convertible preferred stock and revenue from customers who purchase access to the Company’s telehealth platform. On September 21, 2020 the Company closed on the IPO raising $822,267 in gross proceeds. On September 21, 2020 the Company closed on a private placement with Google raising $100,000 in gross proceeds. Since inception, the Company has incurred recurring losses. As of September 30, 2020, the Company had an accumulated deficit of $532,047. The Company expects to continue to generate operating losses for the foreseeable future.
The Company expects that its cash, cash equivalents and investments will be sufficient to fund its operating expenses and capital expenditure requirements for at least the next twelve months.
8
Table of Contents
2. Summary of Significant Accounting Policies
There have been no material changes to the significant accounting policies described in the Company’s final prospectus, as amended, filed on September 18, 2020 with the SEC pursuant to Rule 424(b) under the Securities Act of 1933 (the “Prospectus”) during the nine months ended September 30, 2020.
Basis of Presentation
The accompanying unaudited condensed consolidated financial statements have been prepared in accordance with generally accepted accounting principles in the United States of America (“GAAP”) and applicable rules and regulations of the Securities and Exchange Commission (the “SEC”) regarding interim financial reporting. In the opinion of the Company’s management, the accompanying unaudited condensed consolidated financial statements contain all adjustments (consisting of normal recurring accruals and adjustments) necessary for the fair statement of the Company’s the financial position, results of operations and cash flows at the dates and for the periods indicated. The interim results for the three and nine months ended September 30, 2020 are not necessarily indicative of results for the full 2020 calendar year or any other future interim periods. The information included in the interim financial statements should be read in conjunction with the annual consolidated financial statements and accompanying notes included in the Prospectus.
The unaudited condensed consolidated financial statements include the accounts of American Well Corporation, its wholly-owned subsidiaries, those of professional corporations, which represent variable interest entities in which American Well has an interest and is the primary beneficiary (“PC”) and National Telehealth Network (“NTN”), an entity in which American Well controls fifty percent or more of the voting shares (see Note 4). Intercompany accounts and transactions have been eliminated in consolidation.
For substantially all of the Company’s subsidiaries the functional currency is the U.S. dollar. Foreign currency denominated monetary assets and liabilities are remeasured into U.S. dollars at current exchange rates and foreign currency denominated nonmonetary assets and liabilities are remeasured into U.S. dollars at historical exchange rates. Gains or losses from foreign currency remeasurement and settlements are included in interest income and other income (expense), net in the condensed consolidated statements of operations and comprehensive loss.
For consolidated entities where American Well owns or is exposed to less than 100% of the economics, the net income (loss) attributable to noncontrolling interests is recorded in the condensed consolidated statements of operations and comprehensive loss equal to the percentage of the economic or ownership interest retained in each entity by the respective non-controlling party. The noncontrolling interests are presented as a separate component of stockholders’ deficit in the condensed consolidated balance sheets.
Use of Estimates
The preparation of condensed consolidated financial statements in conformity with GAAP requires management to make estimates and assumptions that affect the reported amounts of assets and liabilities, the disclosure of contingent assets and liabilities at the date of the condensed consolidated financial statements and the reported amounts of revenue and expenses during the reported periods. Significant estimates and assumptions reflected in these condensed consolidated financial statements include, but are not limited to, revenue recognition, the estimated customer relationship period that is used in the amortization of deferred contract acquisition costs, the valuation of assets and liabilities acquired in business combinations, the useful lives of intangible assets and property and equipment and the valuation of common stock. The Company bases its estimates on historical experience, known trends, and other market-specific or other relevant factors that it believes to be reasonable under the circumstances. On an ongoing basis, management evaluates its estimates, as there are changes in circumstances, facts and experience. Changes in estimates are recorded in the period in which they become known. Actual results may differ from those estimates or assumptions.
Due to the COVID-19 global pandemic, the global economy and financial markets have been disrupted and there is a significant amount of uncertainty about the length and severity of the consequences caused by the pandemic. The Company has considered information available to it as of the date of issuance of these financial statements and has not experienced any significant impact to its estimates and assumptions as a result of the COVID-19 pandemic. On an ongoing basis, the Company will continue to closely monitor the COVID-19 impact on its estimates and assumptions.
Segment Information
The Company’s chief operating decision makers (CODMs), its two Chief Executive Officers, review financial information presented on a consolidated basis for purposes of allocating resources and evaluating financial performance. The Company operates and manages its business as one reportable and operating segment. In addition, substantially all of the Company’s revenue and long-lived assets are attributable to operations in the United States for all periods presented.
9
Table of Contents
Variable Interest Entities
The Company evaluates its ownership, contractual and other interests in entities to determine if it has any variable interest in a variable interest entity (“VIE”). These evaluations are complex and involve judgment. If the Company determines that an entity in which it holds a contractual or ownership interest is a VIE and that the Company is the primary beneficiary, the Company consolidates such entity in its condensed consolidated financial statements. The primary beneficiary of a VIE is the party that meets both of the following criteria: (i) has the power to make decisions that most significantly affect the economic performance of the VIE; and (ii) has the obligation to absorb losses or the right to receive benefits that in either case could potentially be significant to the VIE. Management performs ongoing reassessments of whether changes in the facts and circumstances regarding the Company’s involvement with a VIE will cause the consolidation conclusion to change. Changes in consolidation status are applied prospectively.
The aggregate carrying value of total assets and total liabilities included on the condensed consolidated balance sheets for the PCs after elimination of intercompany transactions were $31,987 and $2,216, respectively, as of September 30, 2020 and $35,714 and $5,777, respectively as of December 31, 2019.
Total revenue included on the condensed consolidated statements of operations and comprehensive loss for the PCs after elimination of intercompany transactions was $18,206 and $3,698 for the three months ended September 30, 2020 and 2019, respectively. Net income included on the condensed consolidated statements of operations and comprehensive loss for the PCs after elimination of intercompany transactions $12,258 and $3,562 for the three months ended September 30, 2020 and 2019, respectively. Total revenue included on the condensed consolidated statements of operations and comprehensive loss for the PCs after elimination of intercompany transactions was $61,596 and $13,905 for the nine months ended September 30, 2020 and 2019, respectively. Net income included on the condensed consolidated statements of operations and comprehensive loss for the PCs after elimination of intercompany transactions was $42,644 and $13,267 for the nine months ended September 30, 2020 and 2019.
Investment in Minority Owned Joint Venture
The Company and Cleveland Clinic partnered to form a joint venture, under the name CCAW, JV LLC, to provide broad access to comprehensive and high acuity care services via telehealth. The Company does not have a controlling financial interest in CCAW, JV LLC, but it does have the ability to exercise significant influence over the operating and financial policies of CCAW, JV LLC. Therefore, the Company accounts for its investment in CCAW, JV LLC using the equity method of accounting. The joint venture is considered a variable interest entity under ASC 810-10, but the Company is not the primary beneficiary as it does not have the power to direct the activities of the joint venture that most significantly impact its performance. The Company’s evaluation of ability to impact performance is based on Cleveland Clinic’s managing directors and Cleveland Clinic’s ability to appoint and remove the chairperson who has the ability to cast the tie breaking vote on the most significant activities.
During the nine months ended September 30, 2020, the Company contributed $2,940 as its initial investment for a 49% interest in CCAW, JV LLC. The agreement also requires aggregate total capital contributions by the Company up to an additional $11,800 in two phases, which is yet to be defined. For the three months and nine months ended September 30, 2020, the Company recognized a loss of $486 and $1,250 as its proportionate share of the joint venture’s results of operations, respectively. Accordingly, the carrying value of the equity method investment as of September 30, 2020 was $1,690.
Concentrations of Credit Risk and Significant Customers
Financial instruments that potentially subject the Company to concentrations of credit risk consist primarily of cash, cash equivalents, investments and accounts receivable. The Company invests its excess cash with large financial institutions that the Company believes are of high credit quality. Cash and cash equivalents are invested in highly rated money market funds. At times the Company’s cash balances with individual banking institutions are in excess of federally insured limits. The Company’s investments are invested in U.S. government agency bonds. The Company has not experienced any losses on its deposits of cash, cash equivalents or investments. The Company does not believe that it is subject to unusual credit risk beyond the normal credit risk associated with commercial banking relationships.
The Company performs ongoing assessments and credit evaluations of its customers to assess the collectability of the accounts based on a number of factors, including past transaction experience, age of the accounts receivable, review of the invoicing terms of the contracts, and recent communication with customers. The Company has not experienced significant credit losses from its accounts receivable. As of September 30, 2020 and December 31, 2019, no customer accounted for 10% or greater of outstanding accounts receivable.
During the three and nine months ended September 30, 2020, sales to one related party customer represented 22% of the Company’s total revenue, for both periods. During the three and nine months ended September 30, 2019, sales to one related party customer represented 23% and 22% of the Company’s total revenue, respectively.
10
Table of Contents
Emerging Growth Company Status
The Company is an emerging growth company, as defined in the Jumpstart Our Business Startups Act of 2012 (the “JOBS Act”). Under the JOBS Act, emerging growth companies can delay adopting new or revised accounting standards issued subsequent to the enactment of the JOBS Act until such time as those standards apply to private companies. The Company has elected to use this extended transition period for complying with certain new or revised accounting standards that have different effective dates for public and private companies until the earlier of the date that it is (i) no longer an emerging growth company or (ii) affirmatively and irrevocably opt out of the extended transition period provided in the JOBS Act. As a result, these financial statements may not be comparable to companies that comply with the new or revised accounting pronouncements as of public company effective dates.
Recently Adopted Accounting Pronouncements
In August 2018, the FASB issued ASU No. 2018-13, Fair Value Measurement (Topic 820): Disclosure Requirements for Fair Value Measurement (‘‘ASU 2018-13’’), which modifies the existing disclosure requirements for fair value measurements in Topic 820. The new disclosure requirements include disclosure related to changes in unrealized gains or losses included in other comprehensive income (loss) for recurring Level 3 fair value measurements held at the end of each reporting period and the explicit requirement to disclose the range and weighted-average of significant unobservable inputs used for Level 3 fair value measurements. The other provisions of ASU 2018-13 include eliminated and modified disclosure requirements. An entity is permitted to early adopt any removed or modified disclosures upon issuance of ASU 2018-13 and delay adoption of the additional disclosures until their effective date. For all entities, this guidance is required to be adopted for annual periods beginning after December 15, 2019, including interim periods within those fiscal years. Early adoption is permitted. The guidance was adopted effective January 1, 2020 and did not have a material impact on the condensed consolidated financial statements and disclosures.
In August 2018, the FASB issued ASU 2018-15, Intangibles-Goodwill and Other-Internal-Use Software (Subtopic 350-40): Customer’s Accounting for Implementation Costs Incurred in a Cloud Computing Arrangement That Is a Service Contract, which aligns the requirements for capitalizing implementation costs incurred in a cloud computing arrangement that is a service contract with the requirements for capitalizing implementation costs incurred to develop or obtain internal-use-software. The standard is effective for fiscal years beginning after December 15, 2019 and interim periods within those fiscal years. Early adoption is permitted. The guidance was adopted effective January 1, 2020 and did not have a material impact on the condensed consolidated financial statements and disclosures.
Recently Issued Accounting Pronouncements
In June 2016, the FASB issued ASU No. 2016-13, Financial Instruments—Credit Losses (Topic 326): Measurement of Credit Losses on Financial Instruments (‘‘ASU 2016-13’’), which requires the measurement and recognition of expected credit losses for financial assets held at amortized cost. ASU 2016-13 replaces the existing incurred loss impairment model with an expected loss model. It also eliminates the concept of other-than-temporary impairment and requires credit losses related to available-for-sale debt securities to be recorded through an allowance for credit losses rather than as a reduction in the amortized cost basis of the securities. These changes may result in earlier recognition of credit losses. In November 2018, the FASB issued ASU No. 2018-19, Codification Improvements to Topic 326, Financial Instruments—Credit Losses, which narrowed the scope and changed the effective date for non-public entities for ASU 2016-13. The FASB subsequently issued supplemental guidance within ASU No. 2019-05, Financial Instruments—Credit Losses (Topic 326): Targeted Transition Relief (‘‘ASU 2019-05’’). ASU 2019-05 provides an option to irrevocably elect the fair value option for certain financial assets previously measured at amortized cost basis. For public entities that are Securities and Exchange Commission filers, excluding entities eligible to be smaller reporting companies, ASU 2016-13 is effective for annual periods beginning after December 15, 2019, including interim periods within those fiscal years. For all other entities, ASU 2016-13 is effective for annual periods beginning after December 15, 2022, including interim periods within those fiscal years. Early adoption is permitted. This standard will be effective for the Company on January 1, 2023. The Company is currently evaluating the impact that the adoption of ASU 2016-13 will have on its condensed consolidated financial statements.
In December 2019, the FASB issued ASU 2019-12, Simplifying the Accounting for Income Taxes (“ASU 2019-12”), which simplifies the accounting for income taxes by removing certain exceptions and clarifying and amending existing guidance. For public entities that are Securities and Exchange Commission filers, excluding entities eligible to be smaller reporting companies, ASU 2019-12 is effective for annual periods beginning after December 15, 2020, including interim periods within those fiscal years. For all other entities, the amendments are effective for fiscal years beginning after December 15, 2021, and interim periods within fiscal years beginning after December 15, 2022. Early adoption of the amendments is permitted. The Company is planning on early adopting this standard on January 1, 2021. The Company is currently evaluating the impact that the adoption of ASU 2019-12 will have on its condensed consolidated financial statements.
11
Table of Contents
3. Revenue
The following table presents the Company’s revenues disaggregated by revenue source:
| Three Months Ended September 30, |
Nine Months Ended September 30, |
|||||||||||||||
| 2020 | 2019 | 2020 | 2019 | |||||||||||||
| Platform subscription |
$ | 25,834 | $ | 21,959 | $ | 72,048 | $ | 60,849 | ||||||||
| Visits |
28,455 | 7,177 | 90,936 | 25,681 | ||||||||||||
| Other |
8,262 | 5,608 | 21,849 | 17,295 | ||||||||||||
|
|
|
|
|
|
|
|
|
|||||||||
| Total Revenue |
$ | 62,551 | $ | 34,744 | $ | 184,833 | $ | 103,825 | ||||||||
|
|
|
|
|
|
|
|
|
|||||||||
Accounts Receivable, Net
Accounts receivable primarily consist of amounts billed currently due from customers. Accounts receivable are presented net of an allowance for doubtful accounts, which is an estimate of amounts that may not be collectible. In determining the amount of the allowance at each reporting date, the Company makes judgments about general economic conditions, historical write-off experience and any specific risks identified in customer collection matters, including the aging of unpaid accounts receivable and changes in customer financial conditions. Account balances are written off after all means of collection are exhausted and the potential for non-recovery is determined to be probable. Adjustments to the allowance for doubtful accounts are recorded as general and administrative expenses in the condensed consolidated statements of operations and comprehensive loss.
Changes in the allowance for doubtful accounts were as follows:
| Nine Months Ended September 30, 2020 |
Year Ended December 31, 2019 |
|||||||
| Allowance for doubtful accounts, beginning of the period |
$ | 686 | $ | 396 | ||||
| Provisions |
1,236 | 717 | ||||||
| Write-offs |
(589 | ) | (427 | ) | ||||
|
|
|
|
|
|||||
| Allowance for doubtful accounts, end of the period |
$ | 1,333 | $ | 686 | ||||
|
|
|
|
|
|||||
The Company has rights to consideration for services completed but not billed at the reporting date. Unbilled receivables are classified as receivables when the Company has the right to invoice the customer. The amount of unbilled accounts receivable was $3,294 and $1,622 as of September 30, 2020 and December 31, 2019, and has been included within accounts receivable on the condensed consolidated balance sheet.
Deferred Revenue
Contract liabilities consist of deferred revenue and include billings in advance of performance under the contract. Such amounts are recognized as revenue over the contractual period. For the three and nine-months ended September 30, 2020, the Company recognized revenue of $43,656 and $61,775, respectively, that was included in the corresponding contract liability balance at the beginning of the periods presented. For the three and nine-months ended September 30, 2019, the Company recognized revenue of $25,229 and $57,128 respectively, that was included in the corresponding contract liability balance at the beginning of the periods presented.
Significant changes in the Company’s deferred revenue balance for the nine months ended September 30, 2020 and the year ended December 31, 2019 were as follows:
| Nine Months Ended September 30, 2020 |
Year Ended December 31, 2019 |
|||||||
| Total deferred revenue, beginning of the period |
$ | 77,386 | $ | 93,299 | ||||
| Additions |
56,825 | 85,167 | ||||||
| Recognized |
(72,407 | ) | (101,080 | ) | ||||
|
|
|
|
|
|||||
| Total deferred revenue, end of the period |
$ | 61,804 | $ | 77,386 | ||||
|
|
|
|
|
|||||
12
Table of Contents
| September 30, 2020 | December 31, 2019 | |||||||
| Current deferred revenue |
54,324 | 66,490 | ||||||
| Non-current deferred revenue |
7,480 | 10,896 | ||||||
|
|
|
|
|
|||||
| Total deferred revenue, end of the period |
$ | 61,804 | $ | 77,386 | ||||
|
|
|
|
|
|||||
Transaction Price Allocated to Remaining Performance Obligations
As of September 30, 2020 and December 31, 2019, the aggregate amount of the transaction price allocated to remaining performance obligations was $170,168 and $162,230, respectively. The substantial majority of the unsatisfied performance obligations will be satisfied over the next three years.
As it pertains to the December 31, 2019 amount, the Company expects to recognize 45% of the transaction price in the year ending December 31, 2020 in its condensed consolidated statement of operations and comprehensive loss with the remainder recognized thereafter. As it pertains to the September 30, 2020 amount, the Company expects to recognize 45% of the transaction price in the 12 month period ended September 30, 2021, in its condensed consolidated statement of operations and comprehensive loss with the remainder recognized thereafter.
4. National Telehealth Network
In 2012, the Company and an affiliate of Anthem, Inc. formed NTN to expand the availability and adoption of telemedicine. The Company did not have a controlling financial interest in NTN, but it had the ability to exercise significance influence over the operating and financial policies of NTN. Therefore, the Company accounted for its investment in NTN using the equity method of accounting through December 31, 2015.
On January 1, 2016, the Company made an additional investment in NTN, which increased its ownership percentage above 50%. The Company also obtained the right to elect the Chairman of NTN, who has the ability to cast the tie-breaking vote in all decisions. Therefore, on January 1, 2016, the Company obtained control over NTN and has the power to direct the activities that most significantly impact NTN’s economic performance. This step-acquisition was accounted for as a business combination and the results of the operations of NTN from January 1, 2016, have been included in the Company’s condensed consolidated financial statements. However, because the Company owns less than 100% of NTN, the Company recognizes net income (loss) attributable to non-controlling interest in the condensed consolidated statements of operations and comprehensive loss equal to the percentage of the ownership interest retained in NTN by the respective non-controlling party.
The proportionate share of the income (loss) attributed to the non-controlling interest amounted to $(1,515) and ($56) for the three months ended September 30, 2020 and 2019, respectively. The proportionate share of the loss attributed to the non-controlling interest amounted to ($3,920) and ($884) for the nine months ended September 30, 2020 and 2019, respectively. The carrying value of the non-controlling interest was $22,339 and $26,259 as of September 30, 2020 and December 31, 2019, respectively.
5. Fair Value Measurements
Certain assets and liabilities of the Company are carried at fair value under GAAP. Fair value is defined as the exchange price that would be received for an asset or paid to transfer a liability (an exit price) in the principal or most advantageous market for the asset or liability in an orderly transaction between market participants on the measurement date. Valuation techniques used to measure fair value must maximize the use of observable inputs and minimize the use of unobservable inputs. Financial assets and liabilities carried at fair value are to be classified and disclosed in one of the following three levels of the fair value hierarchy, of which the first two are considered observable and the last is considered unobservable:
| • | Level 1—Quoted prices in active markets for identical assets or liabilities. |
| • | Level 2—Observable inputs (other than Level 1 quoted prices), such as quoted prices in active markets for similar assets or liabilities, quoted prices in markets that are not active for identical or similar assets or liabilities, or other inputs that are observable or can be corroborated by observable market data. |
| • | Level 3—Unobservable inputs that are supported by little or no market activity and that are significant to determining the fair value of the assets or liabilities, including pricing models, discounted cash flow methodologies and similar techniques. |
13
Table of Contents
The following tables presents the Company’s fair value hierarchy for its assets and liabilities that are measured at fair value on a recurring basis and indicate the level within the fair value hierarchy of the valuation techniques the Company utilized to determine such fair value:
| September 30, 2020 | ||||||||||||||||
| Level 1 | Level 2 | Level 3 | Total | |||||||||||||
| Money market funds |
$ | 52,955 | $ | — | $ | — | $ | 52,955 | ||||||||
| Investments |
— | 129,914 | — | 129,914 | ||||||||||||
|
|
|
|
|
|
|
|
|
|||||||||
| 52,955 | 129,914 | — | $ | 182,869 | ||||||||||||
|
|
|
|
|
|
|
|
|
|||||||||
| December 31, 2019 | ||||||||||||||||
| Level 1 | Level 2 | Level 3 | Total | |||||||||||||
| Money market funds |
$ | 62,113 | $ | — | $ | — | $ | 62,113 | ||||||||
| Investments |
— | 39,953 | — | $ | 39,953 | |||||||||||
|
|
|
|
|
|
|
|
|
|||||||||
| 62,113 | 39,953 | — | 102,066 | |||||||||||||
|
|
|
|
|
|
|
|
|
|||||||||
The Company’s cash equivalents were invested in money market funds and were valued based on Level 1 inputs. The Company’s investments consisted of U.S. government agency bonds and were valued based on Level 2 inputs. In determining the fair value of its U.S. government agency bonds, the Company relied on quoted prices for similar securities in active markets or other inputs that are observable or can be corroborated by observable market data. During the nine months ended September 30, 2020, there were no transfers between fair value measurement levels.
6. Investments
As of September 30, 2020 and December 31, 2019, the fair value of the Company’s investments by type of security was as follows:
| September 30, 2020 | ||||||||||||||||
| Amortized Cost |
Gross Unrealized Gains |
Gross Unrealized Losses |
Fair Value | |||||||||||||
| Assets: |
||||||||||||||||
| U.S government securities |
$ | 129,831 | $ | 83 | $ | — | $ | 129,914 | ||||||||
|
|
|
|
|
|
|
|
|
|||||||||
| 129,831 | 83 | — | 129,914 | |||||||||||||
|
|
|
|
|
|
|
|
|
|||||||||
| December 31, 2019 | ||||||||||||||||
| Amortized Cost |
Gross Unrealized Gains |
Gross Unrealized Losses |
Fair Value | |||||||||||||
| Assets: |
||||||||||||||||
| U.S government securities |
$ | 39,355 | $ | 598 | $ | — | $ | 39,953 | ||||||||
|
|
|
|
|
|
|
|
|
|||||||||
| 39,355 | 598 | — | 39,953 | |||||||||||||
|
|
|
|
|
|
|
|
|
|||||||||
7. Business Combinations
In November 2019, the Company acquired all the issued and outstanding shares of Aligned Telehealth, Inc. (“Aligned”). This acquisition will combine Aligned’s customer base with the Company’s telehealth platform to increase the number of hospitals and health plans utilizing telehealth. The aggregate consideration paid was $82,948, which consists of (i) 456,667 shares of the Company’s Series C convertible preferred stock valued at $34,250; (ii) $48,688 of cash and (iii) contingent consideration of $10. The Company is obligated to pay an earn-out up to $70,000 contingent upon Aligned achieving certain revenue and margin thresholds for the year ending December 31, 2020. The Company estimated the fair value of the contingent consideration as of the acquisition date. The contingent consideration is subject to remeasurement at each reporting date until December 31, 2020, with the remeasurement adjustment reported in the condensed consolidated statements of operations and comprehensive loss.
The acquisition was a stock acquisition for tax purposes and accordingly, the goodwill resulting from this acquisition is not tax deductible. The total acquisition related costs were $1,494 and recognized as general and administrative expense in the condensed
14
Table of Contents
consolidated statements of operations and comprehensive loss during the year ended December 31, 2019. The results of operations of Aligned have been included in the Company’s condensed consolidated statements of operations from the acquisition date. Actual revenue and losses of Aligned since the acquisition date as well as pro forma combined results of operations for the Aligned acquisition have not been presented because the effect of the acquisition was not material to the Company’s condensed consolidated financial results for the periods presented. There was no change in the estimated fair value of the contingent consideration during the three and nine months ended September 30, 2020.
The final allocation of the purchase consideration of $82,948 is as follows:
| Amount | ||||
| Cash |
$ | 2,938 | ||
| Accounts receivable |
3,612 | |||
| Identifiable intangible assets |
14,100 | |||
| Other assets |
179 | |||
|
|
|
|||
| Total assets acquired |
20,829 | |||
| Current liabilities |
(3,102 | ) | ||
| Deferred tax liability |
(1,388 | ) | ||
|
|
|
|||
| Total liabilities assumed |
(4,490 | ) | ||
|
|
|
|||
| Goodwill |
66,609 | |||
|
|
|
|||
| Total purchase consideration |
$ | 82,948 | ||
|
|
|
|||
The following are the identifiable intangible assets acquired and their respective weighted average useful lives, as determined based on final valuations:
| Amount | Weighted Average Life (Years) |
|||||||
| Customer relationships |
$ | 13,800 | 7.0 | |||||
| Trade name |
300 | 7.0 | ||||||
|
|
|
|||||||
| Total |
$ | 14,100 | ||||||
|
|
|
|||||||
Customer-relationship intangible assets were valued using the multi-period, excess-earnings method, a method that values the intangible asset using the present value of the after-tax cash flows attributable to the intangible asset only. Key assumptions used in developing the valuation included the estimated annual net cash flows (including forecasted revenue, gross margin, and expenses) and the discount rate that appropriately reflects the risk inherent in each future cash flow stream, all of which were estimated by management. Goodwill represents the excess of the purchase consideration over the estimated acquisition date fair value of the net tangible and intangible assets acquired and liabilities assumed. Goodwill is primarily attributable to expected post-acquisition cross-selling opportunities from integrating Aligned’s customer relationships with the Company’s telehealth platform.
8. Goodwill and Intangible Assets
Goodwill consisted of the following:
| Nine Months Ended September 30, 2020 |
Year Ended December 31, 2019 |
|||||||
| Beginning Balance as of January 1 |
$ | 193,877 | $ | 127,268 | ||||
| Goodwill acquired (Note 7) |
— | 66,609 | ||||||
|
|
|
|
|
|||||
| Ending Balance |
$ | 193,877 | $ | 193,877 | ||||
|
|
|
|
|
|||||
15
Table of Contents
Identified intangible assets consisted of the following:
| Gross Amount |
Accumulated Amortization |
Carrying Value |
Weighted Average Remaining Life |
|||||||||||||
| December 31, 2019 |
||||||||||||||||
| Customer relationships |
$ | 38,782 | $ | (7,416 | ) | $ | 31,366 | 8.0 | ||||||||
| Contractor relationships |
535 | (165 | ) | 370 | 9.0 | |||||||||||
| Trade name |
300 | (4 | ) | 296 | 6.9 | |||||||||||
| Technology |
37,063 | (5,560 | ) | 31,503 | 8.5 | |||||||||||
|
|
|
|
|
|
|
|||||||||||
| $ | 76,680 | $ | (13,145 | ) | $ | 63,535 | ||||||||||
|
|
|
|
|
|
|
|||||||||||
| Gross Amount |
Accumulated Amortization |
Carrying Value |
Weighted Average Remaining Life |
|||||||||||||
| September 30, 2020 |
||||||||||||||||
| Customer relationships |
$ | 38,782 | $ | (10,390 | ) | $ | 28,392 | 7.3 | ||||||||
| Contractor relationships |
535 | (195 | ) | 340 | 8.3 | |||||||||||
| Trade name |
300 | (38 | ) | 262 | 6.1 | |||||||||||
| Technology |
37,063 | (8,339 | ) | 28,724 | 7.8 | |||||||||||
|
|
|
|
|
|
|
|||||||||||
| $ | 76,680 | $ | (18,962 | ) | $ | 57,718 | ||||||||||
|
|
|
|
|
|
|
|||||||||||
Amortization expense related to intangible assets for the three and nine months ended September 30, 2020 was $1,940 and $5,817, respectively. Amortization expense related to intangible assets for the three and nine months ended September 30, 2019 was $1,435 and $4,305, respectively. Estimated future amortization expense of the identified intangible assets as of September 30, 2020, is as follows:
| 2020 |
$ | 1,938 | ||
| 2021 |
7,755 | |||
| 2022 |
7,755 | |||
| 2023 |
7,755 | |||
| 2024 |
7,755 | |||
| Thereafter |
24,760 |
9. Accrued Expenses and other current liabilities
Accrued expenses and other current liabilities consist of the following:
| September 30, 2020 |
December 31, 2019 |
|||||||
| Employee compensation, benefits, and payroll taxes |
$ | 18,133 | $ | 11,698 | ||||
| Professional services |
3,805 | 3,351 | ||||||
| Provider services |
4,043 | 2,709 | ||||||
| Transaction costs |
2,518 | — | ||||||
| Other |
9,802 | 9,593 | ||||||
|
|
|
|
|
|||||
| Total |
$ | 38,301 | $ | 27,351 | ||||
|
|
|
|
|
|||||
10. Line of Credit
In January 2011, the Company entered into a credit agreement (the “Line of Credit”) with a financial institution that provides for maximum borrowings in one or more advances of an amount up to $5,000. Borrowings under the Line of Credit accrue interest at the London Interbank Offered Rate plus 1.25%. Borrowings are repayable immediately upon demand by the financial institution. In November 2017, the Line of Credit was amended to increase the maximum borrowings to $7,000. As of September 30, 2020 and December 31, 2019, the Company had no outstanding borrowings under the Line of Credit.
16
Table of Contents
During any period that the Line of Credit is in effect, the Company can request the financial institution issue a letter of credit with a maximum maturity not to exceed twelve months. Any letters of credit issued by the financial institution reduce the maximum borrowings available under the Line of Credit. As of September 30, 2020, the maximum borrowing available to the Company is $5,905 based on the outstanding letters of credit of $1,095 that have been issued by the financial institution. As of December 31, 2019, the maximum borrowing available to the Company was $5,857 based on the outstanding letters of credit of $1,143 that have been issued by the financial institution.
11. Stockholders’ Equity
Convertible Preferred Stock
The authorized, issued and outstanding shares, liquidation preference, and carrying value of the Company’s convertible preferred stock as of December 31, 2019 were as follows:
| Shares Authorized |
Shares Issued | Shares Outstanding |
Liquidation Preference |
Carrying Value |
||||||||||||||||
| Series A |
3,200,000 | 3,178,650 | 3,130,077 | 51,741 | 28,889 | |||||||||||||||
| Series B |
833,334 | 787,725 | 787,725 | 37,060 | 23,632 | |||||||||||||||
| Series C |
13,711,111 | 10,095,133 | 10,095,133 | 519,648 | 603,278 | |||||||||||||||
|
|
|
|
|
|
|
|
|
|
|
|||||||||||
| 17,744,445 | 14,061,508 | 14,012,935 | 608,449 | 655,799 | ||||||||||||||||
|
|
|
|
|
|
|
|
|
|
|
|||||||||||
In the year ended December 31, 2019, the Company issued and sold 628,719 shares of Series C preferred stock at a price of $75 per share for gross proceeds of $47,154. The Company incurred $1,318 of issuance costs in connection with the issuance of the Series C preferred stock. Additionally, the Company issued 456,667 shares of Series C preferred stock at a price of $75 per share in connection with the acquisition of Aligned (see Note 7).
In February 2020, the Company issued and sold 170,000 shares of Series C preferred stock at a price of $75 per share for gross proceeds of $12,750. The Company incurred $261 of issuance costs in connection with the issuance of the Series C preferred stock
In May 2020, the Company issued and sold 1,342,750 shares of Series C preferred stock at a price of $100 per share for gross proceeds of $134,275. The Company incurred $750 of issuance costs in connection with the issuance of the Series C preferred stock.
In conjunction with the Company’s IPO in September 2020, all shares of convertible preferred stock then outstanding, totaling 15,525,685 shares (pre-split), were automatically converted into an equivalent number of shares of Class A common stock on an 8.8-to-1.0 basis pursuant to a stock split and their carrying value, totaling $801,813 was reclassified into stockholders’ equity on the condensed consolidated balance sheet.
In connection with the IPO, the Company filed an Amended and Restated Certificate of Incorporation which authorizes the issuance of 100,000,000 shares of undesignated preferred stock, par value of $0.01 per share, with rights and preferences, including voting rights, designated from time to time by the board of directors.
Common Stock
In September 2020, upon completion of the IPO, the Company sold 45,681,499 shares of Class A common stock at an offering price of $18.00 per share, including 4,459,277 shares of Class A common stock pursuant to the exercise in full of the underwriters’ option to purchase additional shares. The Company received net proceeds of $768,537, after deducting underwriting discounts and commissions of $49,336 and offering costs of approximately $4,394. In September 2020, the Company sold 5,555,555 shares of Class C common stock in connection with the stock purchase agreement with Google, LLC for net proceeds of $99,100, after deducting offering costs of $900.
Concurrently with the IPO, the Company used $24,157 of the proceeds from the IPO to repurchase 1,340,354 shares of Class A and Class B common stock from certain executive officers and other employees, to permit such executive officers and other employees to pay taxes owed in connection with the vesting of equity awards, including the repayment of third party loans incurred to finance the payment of such taxes.
In connection with the IPO, the Company filed an Amended and Restated Certificate of Incorporation which authorizes capital stock of 1,000,000,000 shares of Class A common stock, par value $0.01 per share, 100,000,000 shares of Class B common stock, par value $0.01 per share, and 200,000,000 shares of Class C common stock, par value $0.01 per share. Except for the rights noted below, each Class A, Class B and Class C common stock have the same rights, are equal in all respects and are treated by us as one
17
Table of Contents
class of shares. Each share of Class A and Class C common stock is entitled to one vote per share on all matters presented for a vote, except that Class C common stock does not have the right to vote for elections of directors. Subject to certain conditions, Class B common stock is collectively entitled to a number of votes equal to the product of (x) 1.0408163 and (y) the total number of votes that would be cast at such time by the holders of the Class A and Class C common stock and any other preferred stock entitled to vote under the certificate of incorporation at such time (resulting in the Class B common stock collectively holding 51% of the total outstanding voting power), and each share of Class B common stock will be entitled to a number of votes equal to the total number of votes held by all Class B common stock divided by the total number of then outstanding shares of Class B common stock. Shares of Class B and Class C common stock will be converted into shares of Class A common stock on a one-for-one basis upon the occurrence of certain events. Shares of Class B common stock will automatically convert on the first business day (i) after the date on which the outstanding shares of Class B common stock constitutes less than 5% of the aggregate number of shares of common stock then outstanding, (ii) after the date on which neither founder is serving as an executive officer or (iii) following seven years after the date the amended and restate certificate of incorporation becomes effective, provided that, such period may, to the extent permitted by law and applicable stock exchange rules, be extended for three years upon the affirmative vote of the holders of a majority of the voting power of the then-outstanding shares of Class A common stock entitled to vote thereon, voting separately as a class. Shares of Class C common stock will be convertible at the option of the holder upon determination that a Hart-Scott-Rodino Antitrust Improvements Act (“HSR”) filing is not necessary prior to the holder’s conversion of such shares or, if required, upon expiration or termination of the HSR waiting period.
As of September 30, 2020 the par value of the Class A, Class B and Class C shares was $1,997, $290, and $56, respectively.
| Shares Authorized |
Shares Issued | Shares Outstanding | ||||||||||
| Class A |
1,000,000,000 | 200,131,318 | 199,647,646 | |||||||||
| Class B |
100,000,000 | 29,950,326 | 29,032,042 | |||||||||
| Class C |
200,000,000 | 5,555,555 | 5,555,555 | |||||||||
|
|
|
|
|
|
|
|||||||
| 1,300,000,000 | 235,637,199 | 234,235,243 | ||||||||||
|
|
|
|
|
|
|
|||||||
As of September 30, 2020, the Company had reserved 63,226,337 shares of common stock for the exercise of outstanding stock options, the vesting of restricted stock units and the number of shares remaining available for future grant. As of December 31, 2019, the Company had reserved 157,998,948 shares of common stock for the conversion of the outstanding shares of Preferred Stock, the exercise of outstanding stock options, the vesting of restricted stock units and the number of shares remaining available for future grant.
Stock Plans and Stock Options
The Company maintains the 2006 Employee, Director and Consultant Stock Plan as amended and restated (the “2006 Plan”) and 2020 Equity Incentive Plan (the “2020 Plan” together, the “Plans”) under which it has granted incentive stock options, non-qualified stock options, and restricted stock units to employees, officers, and directors of the Company. In connection with the adoption of the 2020 Plan, the then-remaining shares of common stock reserved for grant or issuance under the 2006 Plan became available for issuance under the 2020 Plan, and no further grants will be made under the 2006 Plan. The 2020 Plan is administered by the board of directors with respect to awards to non-employee directors and by the compensation committee, with respect to other participants, are collectively, referred to as the plan administrator. The exercise prices, vesting and other restrictions are determined at the discretion of the plan administrator.
The 2020 Plan became effective on August 17, 2020. A total of 22,083,184 shares of Class A and Class B common stock were initially reserved for issuance pursuant to the 2020 Plan, which number was increased to 31,275,204 shares immediately following the IPO. In addition, the shares reserved for issuance under the 2020 Plan include 3,710,240 shares that were reserved but unissued under the 2006 Plan as of immediately prior to its termination. The number of shares of common stock available for issuance under the 2020 Plan includes an annual increase on the first day of each year beginning in 2021 and ending in and including 2029, equal to the lesser of (A) 5% of the number of outstanding shares of all classes of common stock on the last day of the immediately preceding fiscal year and (B) such smaller amount as determined by the board of directors. The Company had 27,614,753 shares available for grant as of September 30, 2020.
Options issued under the Plans are exercisable for periods not to exceed ten years, and vest and contain such other terms and conditions as specified in the applicable award document. Options to buy common stock are issued under the Plans, with exercise prices equal to the closing price of shares of the Company’s common stock on the New York Stock Exchange on the date of award.
18
Table of Contents
Activity under the Plans is as follows:
| Number of Shares |
Weighted Average Exercise Price |
Weighted Average Remaining Contractual Term (Years) |
Aggregate Intrinsic Value |
|||||||||||||
| Outstanding as of December 31, 2019 |
24,917,003 | $ | 3.90 | 6.9 | $ | 79,798 | ||||||||||
| Granted |
2,637,220 | $ | 7.80 | |||||||||||||
| Forfeited |
(1,697,171 | ) | $ | 4.80 | ||||||||||||
| Expired |
(132,001 | ) | $ | 2.16 | ||||||||||||
| Exercised |
(1,660,751 | ) | $ | 2.59 | ||||||||||||
|
|
|
|
|
|||||||||||||
| Outstanding as of September 30, 2020 |
24,064,300 | $ | 4.35 | 6.4 | $ | 610,782 | ||||||||||
|
|
|
|
|
|
|
|
|
|||||||||
| Vested and expected to vest as of December 31, 2019 |
22,650,355 | $ | 3.73 | 6.7 | $ | 76,321 | ||||||||||
| Vested and expected to vest as of September 30, 2020 |
22,212,804 | $ | 4.09 | 6.2 | $ | 567,533 | ||||||||||
|
|
|
|
|
|
|
|
|
|||||||||
| Options exercisable as of December 31, 2019 |
14,685,654 | $ | 2.83 | 5.5 | $ | 62,869 | ||||||||||
| Options exercisable as of September 30, 2020 |
16,254,829 | $ | 3.43 | 5.3 | $ | 426,049 | ||||||||||
|
|
|
|
|
|
|
|
|
|||||||||
The weighted-average grant date fair value of common stock options granted during the three months ended September 30, 2020 was $5.06. No options were granted in the three months ended September 30, 2019. The weighted-average grant date fair value of common stock options granted during the nine months ended September 30, 2020 and September 30, 2019, was $4.17 and $2.78, respectively. As of September 30, 2020, the unrecognized stock-based compensation expense related to outstanding stock options was $12,688, which is expected to be recognized over a weighted-average period of 2.62 years.
Executive Equity Awards
In the second quarter of 2020, the Company entered into employment agreements with the Company’s two Chief Executive Officers. Each agreement provided for the acceleration of certain stock option vesting schedules and a grant of 2,860,880 restricted stock units, totaling 5,721,760 restricted stock units. The restricted stock unit grants of 2,860,880 units to each CEO, have no future service period in order to vest and therefore the Company recognized $56,971, the full amount of stock-based compensation expense, in the second quarter of 2020. The employment agreements modified the stock options that had been previously issued, 1,764,884 options each, to accelerate the vesting and to eliminate the future service period. The Company recognized an incremental $5,659, in the aggregate, of stock-based compensation expense associated with the modification in the second quarter of 2020.
In addition, each CEO has received, and will receive additional restricted stock units, equaling up to 1.5% of the Company’s fully-diluted outstanding capital stock as a result of the IPO (“IPO RSUs”), 50% of the IPO RSUs (representing 0.75% of the Company’s fully diluted outstanding capital stock immediately prior to the IPO or 3,230,750 shares of Class A common stock) were granted on the closing date of the IPO based on the closing price per share on the IPO closing date, and 50% (representing up to 0.75% of the Company’s fully diluted outstanding capital stock immediately prior to the IPO) will be granted on the 180-day anniversary of the IPO, based on a specific range of the price per share of the Company’s publicly traded common stock prior to March 16, 2021, and will vest over a three-year period, with one-third vesting on the first anniversary of the IPO’s closing date and the remaining vesting in equal quarterly installments thereafter. As the issuance of the second 50% tranche is based upon events that are probable the expense related to both tranches of the IPO RSUs was recognized in the three months ended September 30, 2020.
The grant-date fair value of each of the awards issued on the IPO closing date and to be issued on the 180-day anniversary of the IPO was estimated using a binomial lattice approach. The main inputs to valuing the IPO RSUs include the fair value of Class A common stock ($9.96 post-split), expected volatility (60%) and the expected date of the IPO (September 30, 2020). The Company recognized a total of $23,644 stock-based compensation expense, which included both tranches of the IPO RSU for each CEO, on the date of the IPO as the requisite future service of the awards is not substantive for accounting purposes.
Restricted Stock Units
During the year ended December 31, 2019, the Company granted 2,616,345 restricted stock units which vest over the service period of two to four years. During the nine months ended September 30, 2020, the Company granted 13,039,392 restricted stock units which were either fully vested upon issuance or vest over the service period of three to four years.
Activity for the restricted stock units is as follows:
| Shares | Weighted Average Grant Date Fair Value |
|||||||
| Unvested as of December 31, 2019 |
2,322,408 | $ | 5.79 | |||||
| Granted |
13,039,392 | 13.41 | ||||||
| Vested |
(3,810,645 | ) | 9.50 | |||||
19
Table of Contents
| Shares | Weighted Average Grant Date Fair Value |
|||||||
| Forfeited |
(3,871 | ) | 10.79 | |||||
|
|
|
|
|
|||||
| Unvested as of September 30, 2020 |
11,547,284 | $ | 13.17 | |||||
|
|
|
|
|
|||||
The amount of compensation costs recognized for the three months ended September 30, 2020 and 2019 on the restricted stock units expected to vest was $31,253 and $1,297, respectively. The amount of compensation costs recognized for the nine months ended September 30, 2020 and 2019 on the restricted stock units expected to vest was $91,168 and $1,297, respectively. As of September 30, 2020, the unrecognized stock-based compensation expense related to these restricted awards was $39,449, which is expected to be recognized over a weighted-average period of 3.0 years.
Stock-Based Compensation
The weighted average of assumptions that the Company used to determine the fair value of the common stock options granted to employees and directors were as follows:
| Nine Month Ended September 30, |
||||||||
| 2020 | 2019 | |||||||
| Risk-free interest rate |
1.09 | % | 2.44 | % | ||||
| Expected term (in years) |
6.1 | 6.1 | ||||||
| Expected volatility |
52 | % | 50 | % | ||||
| Expected dividend yield |
0 | % | 0 | % | ||||
Stock-based compensation expense was classified in the condensed consolidated statements of operations and comprehensive loss as follows:
| Three Months Ended September 30, |
Nine Months Ended September 30, |
|||||||||||||||
| 2020 | 2019 | 2020 | 2019 | |||||||||||||
| Cost of revenues |
$ | 309 | $ | 124 | $ | 668 | $ | 360 | ||||||||
| Research and development |
2,083 | 360 | 3,519 | 1,169 | ||||||||||||
| Selling and marketing |
1,138 | 540 | 2,684 | 1,848 | ||||||||||||
| General and administrative |
30,890 | 2,580 | 99,645 | 5,298 | ||||||||||||
|
|
|
|
|
|
|
|
|
|||||||||
| Total |
$ | 34,420 | $ | 3,604 | $ | 106,516 | $ | 8,675 | ||||||||
|
|
|
|
|
|
|
|
|
|||||||||
2020 Employee Stock Purchase Plan
In July and August 2020, the Company’s board of directors adopted, and the Company’s stockholders approved, the 2020 Employee Stock Purchase Plan (“ESPP”). A total of 3,084,218 shares of Class A common stock were reserved for issuance under the ESPP. The ESPP is expected to become effective January 1, 2021. Rights granted under the ESPP will be issued only with respect to shares of Class A common stock. Subject to any limitations contained therein, under the ESPP an employee will be permitted to accrue the right to purchase stock under the ESPP up to $25,000 worth of shares during any calendar year. The purchase price of the shares will not be less than 85% of the fair market value of Class A common stock on the lower of the purchase date, which will be the final trading day of the purchase period, or the enrollment date, which will be the first trading day of the offering period.
12. Commitments and Contingencies
Indemnification
The Company’s arrangements generally include certain provisions for indemnifying customers against third-party claims asserting infringement of certain intellectual property rights in the ordinary course of business. The Company also regularly indemnifies customers against third-party claims that the company’s products or services breach applicable law or regulation or from claims resulting from a breach of the business associate agreement in place with the customer. In addition, the Company indemnifies its officers, directors and certain key employees while they are serving in good faith in their capacities. Through September 30, 2020 and December 31, 2019, there have been no claims under any indemnification provisions.
20
Table of Contents
Litigation
From time to time, and in the ordinary course of business, the Company may be subject to various claims, charges, and litigation. On September 14, 2020, the Company received a letter from Teladoc Health, Inc. alleging that certain of the Company’s cart products and associated peripherals infringe upon their patents. On October 12, 2020, Teladoc Health, Inc filed a claim against the Company related to these allegations. The Company believes that these claims lack merit and intends to defend against them vigorously. As of September 30, 2020 and December 31, 2019, the Company did not have any pending claims, charges or litigation that it expects would have a material adverse effect on its consolidated financial position, results of operations or cash flows.
13. Income Taxes
As a result of the Company’s history of net operating losses (“NOL”), the Company has provided for a full valuation allowance against its deferred tax assets. For the three and nine months ended September 30, 2020, the Company recognized an income tax expense of $78 and $330, respectively, primarily due to the amortization of acquired intangibles and stock compensation deductions. For the three months and nine months ended September 30, 2019, the Company recognized an income tax benefit of $392 and $22, respectively, related to certain United States and foreign income, as well as amortization of tax-deductible goodwill, which partially benefits the realization of its indefinite lived NOL in the United States.
14. Related-Party Transactions
Teva Pharmaceuticals, Industries Ltd
Teva Pharmaceuticals, Industries Ltd (“Teva”) is a related party because a member of the Company’s board of directors is the Executive Vice President and Head of Teva Pharmaceuticals’ North America Commercial. In addition, Teva is a shareholder of the Company. As of September 30, 2020 and December 31, 2019, short-term and long-term deferred revenue from this customer was not material. As of September 30, 2020 and December 31, 2019, there were no amounts due from Teva.
During the three months ended September 30, 2020 and 2019, and the nine months ended September 30, 2020 and 2019, revenues recognized from this customer were not material.
Philips Holding USA, Inc.
Philips Holding USA, Inc. (“Philips”) is a related party because a member of the Company’s board of directors is the Business Leader of Philips Population Health Management. In addition, Philips is a shareholder of the Company. As of September 30, 2020 and December 31, 2019, the Company held short-term and long-term deferred revenue of $1,195 and $2,549, respectively from contracts with this customer. As of September 30, 2020 and December 31, 2019, amounts due from Philips were not material.
During the three months ended September 30, 2020 and 2019, the Company recognized revenue of $418 and $146, respectively from contracts with this customer. During the nine months ended September 30, 2020 and 2019, the Company recognized revenue of $1,126 and $372, respectively from contracts with this customer.
Anthem Inc.
Anthem Inc. (“Anthem”) is a related party because a member of the Company’s board of directors is a Vice President of Anthem. In addition, Anthem is a shareholder of the Company. As of September 30, 2020 and December 31, 2019, the Company held short-term and long-term deferred revenue of $4,671 and $11,561, respectively from contracts with this customer. As of September 30, 2020 and December 31, 2019, amounts due from Anthem were $1,178 and $2,499, respectively.
During the three months ended September 30, 2020 and 2019, the Company recognized revenue of $13,522 and $7,837, respectively from contracts with this customer. During the nine months ended September 30, 2020 and 2019, the Company recognized revenue of $40,677 and $23,120, respectively from contracts with this customer.
Cleveland Clinic
Cleveland Clinic is a related party because a member of the Company’s board of directors is an executive advisor to Cleveland Clinic. As of September 30, 2020 and December 31, 2019, the Company held short-term and long-term deferred revenue of $457 and $180, respectively from contracts with this customer. As of September 30, 2020, amounts due from Cleveland Clinic were $205. As of December 31, 2019, amounts due from Cleveland Clinic were not material.
21
Table of Contents
During the three months ended September 30, 2020 and 2019, the Company recognized revenue of $514 and $262, respectively, from contracts with this customer. During the nine months ended September 30, 2020 and 2019, the Company recognized revenue of $1,004 and $889, respectively, from contracts with this customer.
CCAW, JV LLC
CCAW, JV LLC is a related party because it is a joint venture formed between the Company and Cleveland Clinic for which the Company has a minority owned interest in. During the nine months ended September 30, 2020 the Company made an initial investment in CCAW, JV LLC of $2,940 for its less than 50% interest in the joint venture. During the three and nine months ended September 30, 2020 the Company recognized revenue of $404 and $1,190 from contracts with this customer, respectively. As of September 30, 2020, the Company held short and long term deferred revenue of $277 from contracts with this customer. As of September 30, 2020, amounts due from CCAW, JV LLC were not material.
Loans to Officers
During the year ended December 31, 2019, the Company entered into secured promissory notes with the Company’s Chief Financial Officer in the amount of $1,781. During 2020, the Company entered into additional secured promissory notes with the Chief Financial Officer and other executive officers in the amount of $16,441. These loans were to fund the taxes associated with the restricted stock units and were collateralized by all of the capital stock of the Company that the employee owned or would own in the future and the employees’ personal assets. These loans are recorded within prepaids and other current assets in the Company’s condensed consolidated balance sheet. All outstanding loans with officers were repaid in August 2020 prior to the Company’s IPO.
15. Net Loss per Share
Basic and diluted net loss per share attributable to common stockholders was calculated as follows:
| Three Months Ended September 30, |
Nine Months Ended September 30, |
|||||||||||||||
| 2020 | 2019 | 2020 | 2019 | |||||||||||||
| Numerator: |
||||||||||||||||
| Net loss |
$ | (64,596 | ) | $ | (24,071 | ) | $ | (178,040 | ) | $ | (65,643 | ) | ||||
| Net income (loss) attributable to non-controlling interest |
(1,515 | ) | (56 | ) | (3,920 | ) | (884 | ) | ||||||||
|
|
|
|
|
|
|
|
|
|||||||||
| Net loss attributable to American Well Corporation |
$ | (63,081 | ) | $ | (24,015 | ) | $ | (174,120 | ) | $ | (64,759 | ) | ||||
|
|
|
|
|
|
|
|
|
|||||||||
| Denominator: |
||||||||||||||||
| Weighted-average common shares outstanding—basic and diluted |
68,499,106 | 41,933,597 | 51,492,988 | 41,805,929 | ||||||||||||
|
|
|
|
|
|
|
|
|
|||||||||
| Net loss per share attributable to common stockholders—basic and diluted |
$ | (0.92 | ) | $ | (0.57 | ) | $ | (3.38 | ) | $ | (1.55 | ) | ||||
|
|
|
|
|
|
|
|
|
|||||||||
The Company’s potential dilutive securities, which include stock options, convertible preferred stock and unvested restricted stock units, have been excluded from the computation of diluted net loss per share as the effect would be to reduce the net loss per share. Therefore, the weighted-average number of common shares outstanding used to calculate both basic and diluted net loss per share attributable to common stockholders is the same. The Company excluded the following potential common shares equivalents presented based on amounts outstanding at each period end, from the computation of diluted net loss per share attributable to common stockholders for the periods indicated because including them would have had an anti-dilutive effect:
| Three Months Ended September 30, |
Nine Months Ended September 30, |
|||||||||||||||
| 2020 | 2019 | 2020 | 2019 | |||||||||||||
| Convertible preferred stock (as converted to common stock) |
— | 113,762,320 | — | 113,762,320 | ||||||||||||
| Unvested restricted stock units |
5,455,654 | — | 5,455,654 | — | ||||||||||||
| Options to purchase shares of common stock |
24,064,300 | 23,712,967 | 24,064,300 | 23,712,967 | ||||||||||||
|
|
|
|
|
|
|
|
|
|||||||||
| 29,519,954 | 137,475,287 | 29,519,954 | 137,475,287 | |||||||||||||
|
|
|
|
|
|
|
|
|
|||||||||
22
Table of Contents
Item 2. Management’s Discussion and Analysis of Financial Condition and Results of Operations
Special Note Regarding Forward-Looking Statements
This Quarterly Report on Form 10-Q contains forward-looking statements. All statements contained in this Quarterly Report on Form 10-Q other than statements of historical fact, including statements regarding our future results of operations, including descriptions of our business plan and strategies, are forward-looking statements. These statements often include words such as “anticipate,”
“expect,” “suggests,” “plan,” “believe,” “intend,” “estimates,” “targets,” “projects,” “should,” “could,” “would,” “may,” “will,” “forecast,” or the negative of these terms, and other similar expressions, although not all forward-looking statements contain these words.
The forward-looking statements and projections are subject to and involve risks, uncertainties and assumptions and you should not place undue reliance on these forward-looking statements or projections. Although we believe that these forward-looking statements and projections are based on reasonable assumptions at the time they are made, you should be aware that many factors could affect our actual financial results or results of operations and could cause actual results to differ materially from those expressed in the forward-looking statements and projections.
Important factors that may materially affect such forward-looking statements and projections include the following:
| • | weak growth and increased volatility in the telehealth market; |
| • | our history of losses and the risk we may not achieve profitability; |
| • | inability to adapt to rapid technological changes; |
| • | our limited number of significant clients and the risk that we may lose their business; |
| • | increased competition from existing and potential new participants in the healthcare industry; |
| • | changes in healthcare laws, regulations or trends and our ability to operate in the heavily regulated healthcare industry; |
| • | compliance with regulations concerning personally identifiable information and personal health industry; |
| • | slower than expected growth in patient adoption of telehealth and in platform usage by either clients or patients; |
| • | inability to grow our base of affiliated and non-affiliated providers sufficient to serve patient demand; |
| • | our ability to comply with federal and state privacy regulations and the significant liability that could result from a cybersecurity breach or our failure to comply with such regulations; |
| • | our ability to establish and maintain strategic relationships with third parties; |
| • | the impact of the COVID-19 pandemic on our business or on our ability to forecast our business’s financial outlook; |
| • | the risk that the insurance we maintain may not fully cover all potential exposures; and |
| • | inability to remediate material weaknesses or maintain effective internal control over financial reporting. |
The foregoing list of factors is not exhaustive and does not necessarily include all of the important factors that could cause actual results to differ materially from those expressed in any of our forward-looking statements. The information in this Quarterly Report should be read carefully in conjunction with other uncertainties and potential events described in our final prospectus filed with the SEC pursuant to Rule 424(b) under the Securities Act of 1933, as amended, on September 18, 2020 (the “Prospectus”).
The forward-looking statements included in this Quarterly Report on Form 10-Q are made only as of the date of this Quarterly Report. Except as required by law or regulation, we do not undertake any obligation to update any forward-looking statements to reflect subsequent events or circumstances
23
Table of Contents
Overview
We are a leading telehealth company enabling digital delivery of care for healthcare’s key stakeholders. We empower our clients at the enterprise level with the core technology and services necessary to successfully develop and distribute telehealth programs that meet their strategic, operational, and social objectives under their own brands. The Amwell Platform is a complete digital care delivery solution that equips our health system, health plan and innovator, including government, clients with the tools to enable new models of care for their patients and members. Our scalable technology embeds with our clients’ existing offerings and clinical workflows, spanning the continuum of care and enabling care delivery across a wide variety of clinical, retail, school and home settings. Our client-focused approach drives our success as one of the largest telehealth companies. As of September 30, 2020, we powered the digital care programs of over 55 health plans, which support over 36,000 employers and collectively represent more than 80 million covered lives, as well as over 150 of the nation’s largest health systems, encompassing more than 2,000 hospitals. Since inception, we have powered over 7.0 million telehealth visits for our clients, including more than 4.3 million in the nine months ended September 30, 2020.
Healthcare today faces many challenges. Choice and access can be limited, care delivery is fragmented and inefficient, and costs continue to rise and shift to consumers while health outcomes have not improved. The healthcare industry is evolving to meet these challenges with innovative care models and new regulatory frameworks to promote more effective outcomes. As healthcare’s key stakeholders demand innovative technology solutions that streamline care delivery, lower costs, expand access and improve outcomes, we believe there is significant opportunity for transformation.
We believe Amwell makes this digital care transformation possible for the healthcare ecosystem. The Amwell Platform enables care delivery across the full healthcare continuum – from primary and urgent care in the home to high acuity specialty consults, such as telestroke and telepsychiatry, in the hospital. We support both on-demand and scheduled consultations and offer 40 pre-packaged care modules and programs that power over 100 unique use cases today. Our platform can be fully embedded into our clients’ patient/member portals and provider workflows. Providers can launch telehealth directly from their native EHRs, with seamless integration to their payer eligibility and claims systems. Providers, patients and members can access this care through a full range of Carepoints™, including via mobile, web, phone and our proprietary kiosks and carts that support multi-way video, phone or secure messaging interactions. As of September 30, 2020, over 62,000 of our active providers use the Amwell Platform to serve their patients and members. When needed, we augment and extend our clients’ clinical capabilities with AMG, a nationwide clinical network of over 5,000 multi-disciplinary providers covering 50 states with 24/7/365 coverage.
Amwell exists to empower healthcare’s leading players, who have earned the deep trust of their patients and members over decades, and does not aim to compete with or replace them. We help our clients white-label and embed telehealth within their existing healthcare offerings for their patients and members. Thus we enable our provider customers to offer a seamless experience that blends online convenience when needed with in-person care by known, trusted providers as part of a complete care program that offers patients continuity of care. In this way, providers can use our telehealth platform as an effective augmentation and not a replacement of their traditional care delivery.
Our Business Model
The Amwell Platform is a complete digital care delivery solution that equips our health system, health plan and innovator partners with the tools to enable new models of care for their patients and members. We sell the Amwell Platform on a subscription basis, which with our modular platform architecture allows our clients to introduce innovative telehealth use cases over time, expanding our subscription revenue opportunity. To support the Amwell Platform, we offer professional services on a fee-for-service basis and a range of patient and provider access Carepoints that support hospital and home use cases and access to AMG, our affiliated medical group that provides clinical services on a fee-for-service basis. The combination of the platform, services and Carepoints allows our clients to deploy telehealth solutions across their full enterprise, deepening their relationships with existing and new patients and members through improved care access and coordination, cost, and quality. Our contracts are typically three years in length but may be longer for our largest strategic customer partners.
Total subscription fees received from Health System, Health Plan and Innovator clients were $25.8 million and $22.0 million for the three months ended September 30, 2020 and 2019, respectively and $72.0 million and $60.8 million for the nine months ended September 30, 2020 and 2019, respectively.
Health Systems
For our health system customers, the Amwell Platform’s primary function is to facilitate consultations between patients and providers affiliated with the health system. Our typical contracts with health systems are mainly the platform subscription, but also include services delivered by AMG to complement the health system provider resources, services for technology integration, marketing and Carepoints. Subscription fees are recurring and are determined based on the initial forecasted number of overall consultations throughout the entire health system on the Amwell Platform and net patient revenue of the health system. Subscriptions include a maximum number of consultations that can be delivered on the platform and similar to a cellular phone plan, when consultations exceed the contractual maximum, overages result in higher subscription fees in the following annual period. As the health system expands its use of the Amwell Platform through additional modules, there is a corresponding increase in subscription fees. Examples of modules include:
24
Table of Contents
| • Acute Behavioral Health
• Urgent Care
• Specialty Consult |
• School Health
• Telestroke
• Behavioral Health Therapy |
• Retail Health
• Triage in the ED
• Dialysis |
To supplement a health system’s own network of healthcare providers, health systems often choose to purchase clinical services from AMG to deliver care for certain specialties such as telepsychiatry, behavioral health therapy and general urgent care, or to simply operate as backup providers on nights and weekends. AMG services are provided on a fee-for-service basis.
Health Plans
For our health plan clients, the Amwell Platform functions to provide better access to care, better coordination of care and the ability to direct care referrals to providers owned or affiliated with the respective health plan. All of these functions lower the overall cost of care for health plan clients: improved population access to needed services reduces unneeded ED usage and better coordination of care can improve outcomes and lower the overall cost of care.
Currently, our typical health plan contract includes a recurring subscription fee based on the number of members who have access to our platform plus additional subscription fees associated with the various programs we offer the health plan. Clinical programs offered on the Amwell Platform include:
| • Urgent Care
• Nutrition |
• Sleep Therapy
• Employee
Assistance |
• Women’s Health
• Behavioral
Health | ||
Our health plan clients mainly purchase clinical services for their members through AMG. They may also maintain relationships with other in network provider organizations to deliver care on the Amwell Platform on their behalf. These visit consultations are charged on a fee-for-service basis and range in price based on the type of consultation and the specialty of the provider.
Innovators
Amwell has a number of unique customers that use our platform in various ways to support their products. For example, we support: (i) Philips’ sleep apnea products and programs, (ii) a joint-venture with Cleveland Clinic and Amwell, (iii) Meuhedet’s advanced, hybrid-virtual international health plan, and (iv) more recently, government contracts where we support 911 calls that can be addressed with virtual care.
Our contracts with our innovator customers vary from simple subscription fee-only contracts, where an innovator customer embeds our technology within their product, to broad subscription fee and services contracts that resemble a blend of our health system and health plan profile contracts.
Visits
Amwell’s partner AMG has built a network of over 5,000 providers who are registered and credentialed to deliver care on the Amwell Platform. This clinical network is designed and operated in a way that allows us to meet the aggregate visit demand requirements of our health plan and health system clients, spanning the following specialties:
| • Family Medicine
• Psychiatry
• Gynecology
• Anesthesiology
• Nutritionist
• Sleep Medicine
• Pain Management |
• Internal Medicine
• Psychology
• Pulmonology
• Urology
• Health Coach
• Orthopedic Surgery
• Case Manager |
• Emergency Medicine
• Gastroenterology
• Nephrology
• Pediatrician
• Lactation Consultant
• Social Worker
• Vascular Surgery | ||
AMG earns fee-for-service revenue for each episode of care delivered on the Amwell Platform by its providers with fees varying by physician specialty or clinical program. These clinical fees vary significantly from $59 to more than $800 per consultation or case based on the specialty and may require an additional module subscription, as in the case of telepsychiatry.
Fees received from AMG-related visits were $28.5 million and $7.2 million for the three months ended September 30, 2020 and 2019, respectively and $90.9 million and $25.7 million for the nine months ended September 30, 2020 and 2019, respectively.
25
Table of Contents
Services & Carepoints
We offer a full suite of paid, supporting services to our clients to enable their telehealth offerings, including professional services to facilitate telehealth implementation, workflow design, systems integration and service expansion. To help our clients promote adoption and utilization, we offer patient and provider engagement services through our internal digital engagement agency.
Our customers often deploy telemedicine through a variety of our proprietary Carepoints, which are medical carts and kiosks designed for various clinical and community settings. These Carepoints enable providers to deliver digital care into clinical care locations, such as the ED and clinics, as well as into community settings such as retail stores, community centers, employer sites, skilled nursing facilities and schools. Carepoints consist of hardware integrated into our Platform but can also be deployed independent of our software solution. Our Carepoints are designed by our product development teams and manufactured through partner and contract relationships.
Fees received from the provision of services and Carepoints were $8.3 million and $5.6 million for the three months ended September 30, 2020 and 2019, respectively and $21.8 million and $17.3 million for the nine months ended September 30, 2020 and 2019, respectively.
Key Factors Affecting Our Performance
We believe our future growth, success and performance are dependent on many factors, including those set forth below. While these factors present significant opportunities for us, they also represent the challenges that we must successfully address in order to grow our business and improve our results of operations.
Telehealth Utilization
Telehealth utilization is a key driver of our business. A client’s overall utilization of its telehealth platform provides an important measure of the value they derive. Telehealth utilization drives our business in three important ways. First, to the extent a client succeeds with its telehealth program and sees good usage, they are more likely to renew and potentially expand their contract with us. Second, our health systems agreements typically include a certain number of visits conducted by their own providers annually and provide that as certain volume thresholds are exceeded, its annual license fees will rise to reflect this growing value. Third, to the extent that clients utilize provider services from AMG, Amwell derives revenue from clinical fees. We expect that our future revenues will be driven by the growing adoption of telehealth and our ability to maintain and grow market share within that market.
In the nine months ended September 30, 2019, our clients completed a total of 0.8 million visits on the Amwell Platform, while in the nine months ended September 30, 2020, clients significantly expanded their use of the Amwell Platform with 4.3 million completed visits. During the COVID-19 crisis, utilization of the platform achieved levels not seen before, evident by a larger number of clients’ own providers using the Amwell Platform. AMG providers accounted for 29% of total visits performed during the nine months ended September 30, 2020 versus 66% of total visits performed on the Amwell Platform during the nine months ended September 30, 2019.
In the three months ended September 30, 2019, our clients completed a total of 0.3 million visits on the Amwell Platform, while in the three months ended September 30, 2020, clients significantly expanded their use of the Amwell Platform with 1.4 million completed visits. During the COVID-19 crisis, utilization of the platform achieved levels not seen before, evident by a larger number of clients’ own providers using the Amwell Platform. AMG providers accounted for 27% of total visits performed during the three months ended September 30, 2020 versus 62% of total visits performed on the Amwell Platform during the three months ended September 30, 2019.
COVID-19-related visit growth reflects several factors. Many patients need assessment for respiratory or other COVID-19-like symptoms and have sought to be assessed for possible referral to hospital or testing facilities. In addition, many patients, especially those with health vulnerabilities, have sought to avoid going into brick and mortar facilities – and indeed our health systems’ clients have preferred wherever possible to treat patients remotely at home for non-COVID-19 related ongoing healthcare needs. Finally, we have seen significant expansion of reimbursement for telehealth during the COVID-19 crisis, which has made telehealth more affordable for many people.
26
Table of Contents
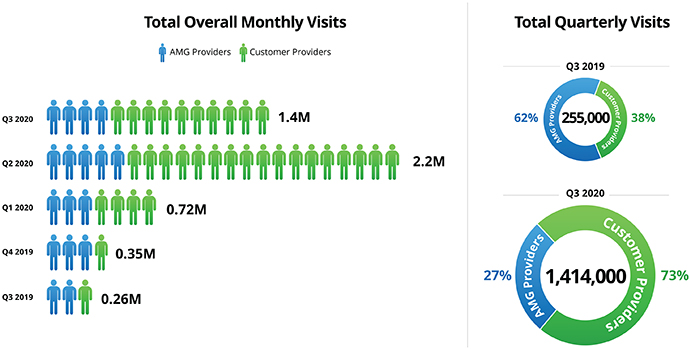
Active Providers
An important indicator of the value of our Amwell Platform to our clients is the number of non-AMG providers that are active on the Amwell Platform. We define “Active Providers” as providers that have delivered a visit on the Amwell Platform at least once in the last 12 months. Active Providers demonstrate the prevalence of telehealth within our clients in both home and hospital environments. We believe Active Providers is a measure of our success in delivering on our mission of enabling access to care. We expect that the number of Active Providers will increase over time as a result of several factors:
| • | the number of modules and use cases deployed within health systems |
| • | the adoption of telehealth by providers across the spectrum of care |
| • | the number of programs offered through health plans |
| • | the continued improvement in the regulatory environment for telehealth, including reimbursement for telehealth services |
| • | the ongoing consumerization of healthcare |
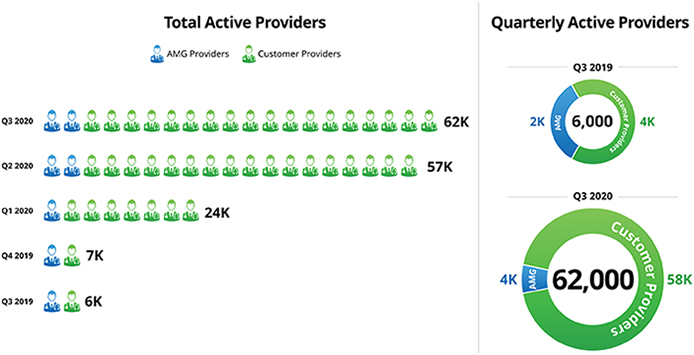
27
Table of Contents
Regulatory Environment
Our operations are subject to comprehensive United States federal, state and local and international regulation in the jurisdictions in which we do business. Our ability to operate profitably will depend in part upon our ability, and that of our affiliated providers, to maintain all necessary licenses and to operate in compliance with applicable laws and rules. The COVID-19 pandemic has resulted in a reduction of regulatory and reimbursement barriers for telehealth, including removing the originating site restrictions for fee for service Medicare; the expansion of Medicare and commercial reimbursement for telehealth and an easing of state licensure policies for providers. However, it is uncertain how long the relaxed policies will remain in effect, and there can be no guarantee that once the COVID-19 pandemic is over that such restrictions will not be reinstated or changed in a way that adversely affects our business.
Business Combinations
In November 2019, we acquired all of the outstanding stock of Aligned Telehealth. This acquisition combines Aligned’s ability to access an affiliated network of psychiatrists and advanced practice psychiatric nurses, with the Company’s health system and health plan client relationships to address the mounting challenges of psychiatric clinician shortages, fragmented care and societal stigmas impeding adequate behavioral health access and treatment. The aggregate consideration for this transaction was $82.9 million, and included $48.7 million paid in cash and $34.3 million in equity comprised of 4,018,669 shares of Series C preferred stock at a price of $8.52 per share. The agreement also included a component of contingent earnout consideration to be earned if certain financial performance is achieved. The total potential contingent earnout consideration is capped at $70.0 million. The acquisition was a stock purchase and the goodwill resulting from this acquisition is not deductible for tax purposes. The results of operations of Aligned have been included within our operations from the date of acquisition.
Seasonality
Visit volumes typically follow the annual flu season, rising during quarter four and quarter one and falling in the summer months. The impact of COVID-19 has caused an increase in the volume of visits in the late spring and summer of 2020, the future impact of COVID-19 on seasonality is unknown as there could be additional surges and demand on telehealth visits. While we sell to and implement our solutions to clients year-round, we experience some seasonality in terms of when we enter into agreements with our clients and when we launch our solutions to members. We typically enter into a higher percentage of agreements with new clients, as well as renewal agreements with existing clients, in the first and fourth quarters. Regardless of when the agreement is entered into, we can typically complete client implementation in an average of approximately three months. Any downturn in sales, however, may negatively affect our revenue in future periods. Accordingly, the effect of downturns in sales and potential changes in our rate of renewals may not be fully reflected in our results of operations until future periods.
Non-GAAP Financial Measures
In addition to our financial results determined in accordance with GAAP, we believe adjusted EBITDA, a non-GAAP measure, is useful in evaluating our operating performance. We use adjusted EBITDA to evaluate our ongoing operations and for internal planning and forecasting purposes. We believe that this non-GAAP financial measure, when taken together with the corresponding GAAP financial measures, provides meaningful supplemental information regarding our performance by excluding certain items that may not be indicative of our business, results of operations or outlook. In particular, we believe that the use of adjusted EBITDA is helpful to our investors as it is a metric used by management in assessing the health of our business and our operating performance. However, non-GAAP financial information is presented for supplemental informational purposes only, has limitations as an analytical tool and should not be considered in isolation or as a substitute for financial information presented in accordance with GAAP. In addition, other companies, including companies in our industry, may calculate similarly-titled non-GAAP measures differently or may use other measures to evaluate their performance, all of which could reduce the usefulness of our non-GAAP financial measure as a tool for comparison. A reconciliation is provided below for our non-GAAP financial measure to the most directly comparable financial measure stated in accordance with GAAP. Investors are encouraged to review the related GAAP financial measure and the reconciliation of this non-GAAP financial measure to their most directly comparable GAAP financial measures, and not to rely on any single financial measure to evaluate our business.
Adjusted EBITDA
Adjusted EBITDA is a key performance measure that our management uses to assess our operating performance. Because adjusted EBITDA facilitates internal comparisons of our historical operating performance on a more consistent basis, we use this measure for business planning purposes and in evaluating acquisition opportunities.
28
Table of Contents
We calculate adjusted EBITDA as net loss adjusted to exclude (i) interest income and other income, net, (ii) tax benefit and expense, (iii) depreciation and amortization, (iv) stock-based compensation expense, (v) initial public offering expenses, (vi) acquisition-related expenses and (vii) other items affecting our results that we do not view as representative of our ongoing operations, including direct and incremental expenses associated with the COVID-19 pandemic. We had no such other items during the three and nine months ended September 30, 2019.
The following table presents a reconciliation of adjusted EBITDA from the most comparable GAAP measure, net loss, for the three and the nine months ended September 30, 2019 and 2020:
| Three months ended September 30, |
Nine months ended September 30, |
|||||||||||||||
| (in thousands) |
2020 | 2019 | 2020 | 2019 | ||||||||||||
| Net loss |
$ | (64,596 | ) | $ | (24,071 | ) | $ | (178,040 | ) | $ | (65,643 | ) | ||||
| Add: |
||||||||||||||||
| Depreciation and amortization |
2,576 | 1,868 | 7,371 | 5,668 | ||||||||||||
| Interest and other income, net |
(255 | ) | (1,286 | ) | (1,410 | ) | (4,547 | ) | ||||||||
| Expense (Benefit) from income taxes |
78 | (392 | ) | 330 | (22 | ) | ||||||||||
| Stock-based compensation |
34,420 | 3,604 | 106,516 | 8,675 | ||||||||||||
| Initial public offering expenses |
1,362 | — | 2,039 | 6 | ||||||||||||
| Acquisition-related expenses |
— | — | (48 | ) | 95 | |||||||||||
| COVID-19-related expenses (1) |
191 | — | 5,933 | — | ||||||||||||
|
|
|
|
|
|
|
|
|
|||||||||
| Adjusted EBITDA |
$ | (26,224 | ) | $ | (20,277 | ) | $ | (57,309 | ) | $ | (55,768 | ) | ||||
|
|
|
|
|
|
|
|
|
|||||||||
| (1) | COVID-19-related expenses include non-recurring provider bonus payments, emergency hosting licensing fees and non-medical provider temporary labor costs related to on-boarding non-AMG providers incurred in response to the initial outbreak of the COVID-19 virus as Amwell attempted to scale quickly to meet unusually high patient and non-AMG provider demand. |
Some of the limitations of adjusted EBITDA include (i) adjusted EBITDA does not properly reflect capital commitments to be paid in the future, and (ii) although depreciation and amortization are non-cash charges, the underlying assets may need to be replaced and adjusted EBITDA does not reflect these capital expenditures. Our IPO and acquisition-related expenses, including legal, accounting and other professional expenses, reflect cash expenditures and we expect such expenditures for acquisitions to recur from time to time. Our adjusted EBITDA may not be comparable to similarly titled measures of other companies because they may not calculate adjusted EBITDA in the same manner as we calculate the measure, limiting its usefulness as a comparative measure. In evaluating adjusted EBITDA, you should be aware that in the future we will incur expenses similar to the adjustments in this presentation. Our presentation of adjusted EBITDA should not be construed as an inference that our future results will be unaffected by these expenses or any unusual or non-recurring items. Adjusted EBITDA should not be considered as an alternative to loss before benefit from income taxes, net loss, earnings per share, or any other performance measures derived in accordance with U.S. GAAP. When evaluating our performance, you should consider adjusted EBITDA alongside other financial performance measures, including our net loss and other GAAP results.
Components of Statement of Operations
Revenue
The Company has demonstrated continued revenue growth as a direct result of the acceptance of telehealth and our penetration of the market. Revenue performance is reflective of the strong foundation that has been built, focused around health plans, health systems, our provider network and a consistently increasing visit base.
We generate revenues from the use of the Amwell Platform in the form of recurring subscription fees for use of our platform, and related services and Carepoint sales. We also generate revenue from the performance of AMG patient visits.
Cost of Revenues, Excluding Amortization of Acquired Intangible Assets
Cost of revenue primarily consists of hosting fees paid to our hosting providers, costs incurred in connection with our professional services, technical and hosting support, and costs for running our affiliated provider network operations team. These costs primarily include employee-related expenses (including salaries, bonuses, benefits, stock-based compensation and travel).
29
Table of Contents
Cost of revenues are primarily driven by the size of our provider network and the hosting and technical support required to service our platform customers. Our business models are designed to be scalable and to leverage fixed costs to generate higher revenues. While we currently expect increased investments to support accelerated growth, we also expect increased efficiencies and economies of scale. Our quarterly cost of revenues as a percentage of revenues is expected to fluctuate from period to period depending on the interplay of these aforementioned factors.
Operating Expenses
Operating expenses consist of research and development, sales and marketing, and general and administrative expenses.
Research and Development Expenses
Research and development expenses include personnel and related expenses for software and hardware engineering, information technology infrastructure, security and compliance and product development (inclusive of stock-based compensation for our research and development employees). Research and development expenses also include the periodic outsourcing of similar functions to third party specialists. Due to the quarantine and isolation strategies employed by governmental authorities, health systems and health plans to deal with the COVID-19 pandemic, a significant portion of healthcare was forced to be delivered virtually. Our health plan and health system customers believe that overall utilization of telemedicine and care delivered virtually will continue to increase during and after the COVID-19 crisis. By partnering with our customers during the crisis, we understand the increased volume and additional types of care they intend to deliver virtually on our platform. We originally expected this increase in volume, evolution and advancement of telemedicine usage to occur over the next few years but we have now adjusted our research and development strategies to match the views of our customer partners, thus accelerating the expansion of our platform volume capacity and the development of additional functionality through new programs and modules. While an increase in the research and development expense is expected in the near-term future periods, the corresponding future revenue growth is expected to result in lower expenses as a percentage of revenue.
Our research and development expenses may also fluctuate as a percentage of our total revenue from period to period due to the seasonality of our total revenue and the timing and extent of our research and development expenses.
Sales and Marketing Expenses
Sales expenses consist primarily of employee-related expenses, including salaries, benefits, commissions, travel and stock-based compensation costs for our employees engaged in sales. We expect our sales expenses to increase as we continue to invest in the expansion of our business. We expect to hire additional sales personnel and related account management and sales support personnel to properly service our growing client base and to identify and capitalize on new strategic market opportunities.
Marketing expenses consist primarily of personnel and related expenses (inclusive of stock-based compensation) for our marketing staff, including costs of communications materials that are produced to generate greater awareness and utilization of our platform among our clients and their users. Marketing costs also include third-party independent research, participation in trade shows, brand messaging, and public relations costs.
Our sales and marketing expenses will fluctuate as a percentage of our total revenue from period to period due to the seasonality of our total revenue and the timing and extent of our advertising and marketing expenses.
General and Administrative Expenses
General and administrative expenses include personnel and related expenses, and professional fees incurred by finance, legal, human resources, information technology, our executives, and executive administration staff. They also include stock-based compensation for employees in these departments and expenses related to auditing, consulting, legal, and corporate insurance.
We expect our general and administrative expenses to increase for the foreseeable future due to costs that we incur as a new public company, as well as other costs associated with continuing to grow our business. However, we expect our general and administrative expenses to decrease as a percentage of our total revenue over the next several years. Our general and administrative expenses may fluctuate as a percentage of our total revenue from period to period due to the seasonality of our total revenue and the timing and extent of our general and administrative expenses.
Depreciation and Amortization Expense
Depreciation and amortization expense includes the amortization of intangible assets and depreciation related to our fixed assets. Amortization of acquired intangible assets consists of the amortization of acquisition related intangible assets, which are customer relationships, contractor relationships, technology and trade names.
30
Table of Contents
Interest Income and Other Income (Expense), Net
The balance of interest income and other income (expense), net, consists predominantly of interest income on our money-market and short-term investments. We did not incur material interest expenses in the period as there were no outstanding debts or notes payables.
Provision for (Benefit from) Income Taxes
The income tax provision and benefit were primarily due to state and foreign income tax expense, and benefit related to release of the valuation allowance as a result of our acquisitions.
Deferred tax assets are reduced by a valuation allowance to the extent management believes it is not more likely than not to be realized. The ultimate realization of deferred tax assets is dependent upon the generation of future taxable income. Management makes estimates and judgments about future taxable income based on assumptions that are consistent with our plans and estimates.
Consolidated Results of Operations
The following table sets forth our summarized condensed consolidated statement of operations data for the three months ended September 30, 2020, and 2019 and the dollar and percentage change between the respective periods:
| Three Months Ended September 30, | Nine Months Ended September 30, | |||||||||||||||||||||||||||||||
| 2020 | 2019 | Variance | % Change | 2020 | 2019 | Variance | % Change | |||||||||||||||||||||||||
| Revenue |
$ | 62,551 | $ | 34,744 | $ | 27,807 | 80 | % | $ | 184,833 | $ | 103,825 | $ | 81,008 | 78 | % | ||||||||||||||||
| Costs and operating expenses: |
||||||||||||||||||||||||||||||||
| Costs of revenue, excluding depreciation and amortization of intangible assets |
42,116 | 19,060 | 23,056 | 121 | % | 118,969 | 55,060 | 63,909 | 116 | % | ||||||||||||||||||||||
| Research and development |
25,275 | 13,602 | 11,673 | 86 | % | 57,848 | 39,169 | 18,679 | 48 | % | ||||||||||||||||||||||
| Sales and marketing |
13,758 | 11,309 | 2,449 | 22 | % | 39,978 | 33,951 | 6,027 | 18 | % | ||||||||||||||||||||||
| General and administrative |
43,113 | 14,654 | 28,459 | 194 | % | 138,537 | 40,189 | 98,348 | 245 | % | ||||||||||||||||||||||
| Depreciation and amortization expense |
2,576 | 1,868 | 708 | 38 | % | 7,371 | 5,668 | 1,703 | 30 | % | ||||||||||||||||||||||
|
|
|
|
|
|
|
|
|
|
|
|
|
|
|
|
|
|||||||||||||||||
| Total costs and operating expenses |
126,838 | 60,493 | 66,345 | 110 | % | 362,703 | 174,037 | 188,666 | 108 | % | ||||||||||||||||||||||
| Loss from operations |
(64,287 | ) | (25,749 | ) | (38,538 | ) | 150 | % | (177,870 | ) | (70,212 | ) | (107,658 | ) | 153 | % | ||||||||||||||||
| Interest income and other income (expense), net |
255 | 1,286 | (1,031 | ) | (80 | )% | 1,410 | 4,547 | (3,137 | ) | (69 | %) | ||||||||||||||||||||
|
|
|
|
|
|
|
|
|
|
|
|
|
|
|
|
|
|||||||||||||||||
| Loss before benefit from income taxes and loss from equity method investment |
(64,032 | ) | (24,463 | ) | (39,569 | ) | 162 | % | (176,460 | ) | (65,665 | ) | (110,795 | ) | 169 | % | ||||||||||||||||
|
|
|
|
|
|
|
|
|
|
|
|
|
|
|
|
|
|||||||||||||||||
| Benefit (expense) from income taxes |
(78 | ) | 392 | (470 | ) | (120 | )% | (330 | ) | 22 | (352 | ) | (1,600 | %) | ||||||||||||||||||
| Loss from equity method investment |
(486 | ) | — | (486 | ) | N/A | (1,250 | ) | — | (1,250 | ) | N/A | ||||||||||||||||||||
|
|
|
|
|
|
|
|
|
|
|
|
|
|
|
|
|
|||||||||||||||||
| Net loss |
$ | (64,596 | ) | $ | (24,071 | ) | (40,525 | ) | 168 | % | $ | (178,040 | ) | $ | (65,643 | ) | (112,397 | ) | 171 | % | ||||||||||||
|
|
|
|
|
|
|
|
|
|
|
|
|
|
|
|
|
|||||||||||||||||
| Net loss attributable to noncontrolling interest |
(1,515 | ) | (56 | ) | (1,459 | ) | 2,605 | % | (3,920 | ) | (884 | ) | (3,036 | ) | 343 | % | ||||||||||||||||
| Net loss attributable to American Well Corporation |
$ | (63,081 | ) | $ | (24,015 | ) | $ | (39,066 | ) | 163 | % | $ | (174,120 | ) | $ | (64,759 | ) | $ | (109,361 | ) | 169 | % | ||||||||||
|
|
|
|
|
|
|
|
|
|
|
|
|
|
|
|
|
|||||||||||||||||
Revenue
Total revenue was $62.6 million for the three months ended September 30, 2020, compared to $34.7 million during the three months ended September 30, 2019, an increase of $27.8 million, or 80%. This increase was substantially driven by an increase in visit revenue volume ($21.3 million increase). Total revenue was $184.8 million for the nine months ended September 30, 2020, compared to $103.8 million during the nine months ended September 30, 2019, an increase of $81.0 million, or 78%. This increase was also substantially driven by an increase in visit revenue volume ($65.3 million increase). Visit revenue has increased due to the impact of the COVID-19 crisis as well as the contribution of the Aligned Acquisition (which closed in the fourth quarter of 2019). Revenue increase was also attributable to new clients using our platform and existing clients adding additional modules to their platform subscriptions, such as our COVID-19 module. We believe that the strength of our technology platform will continue to serve as the foundation for our revenue growth.
Subscription revenue was $25.8 million for the three months ended September 30, 2020, compared to $22.0 million during the three months ended September 30, 2019, an increase of $3.9 million, or 18%. Subscription revenue was $72.0 million for the nine months ended September 30, 2020, compared to $60.8 million during the nine months ended September 30, 2019, an increase of $11.2 million, or 18%. Revenue earned from AMG patient visits increased by $21.3 million, or 296%, from $7.2 million in the three months ended September 30, 2019 to $28.5 million in the three months ended September 30, 2020. Revenue earned from AMG patient visits increased by $65.3 million, or 254%, from $25.7 million in the nine months ended September 30, 2019 to $90.9 million in the nine months ended September 30, 2020. The increases were primarily driven by increased utilization across our health system and health plan clients primarily from the COVID-19 pandemic as well as overall increased acceptance of telemedicine. AMG paid visits constituted 27% of the total visits for the three months ended September 30, 2020, compared to 62% for the three months ended September 30, 2019. AMG paid visits constituted 29% of the total visits for the nine months ended September 30, 2020, compared to 66% for the nine months ended September 30, 2019. Revenue earned from services and Carepoints were $8.3 million for the three months ended September 30, 2020, compared to $5.6 million for the three months ended September 30, 2019, an increase of $2.7 million, or 47%. Revenue earned from services and Carepoints were $21.8 million for the nine months ended September 30, 2020, compared to $17.3 million for the nine months ended September 30, 2019, an increase of $4.6 million, or 26%. The increase in services and Carepoints revenue was largely due to the overall increased volume of Carepoints sales and partially the result of timing with respect to the performance of services and the timing of delivery of Carepoints.
31
Table of Contents
Costs of Revenue, Excluding Amortization of Acquired Intangible Assets
Cost of revenue was $42.1 million for the three months ended September 30, 2020, compared to $19.1 million for the three months ended September 30, 2019, an increase of $23.1 million, or 121%. Cost of revenue was $119.0 million for the nine months ended September 30, 2020, compared to $55.1 million for the nine months ended September 30, 2019, an increase of $63.9 million, or 116%. These increases were primarily due to an increase of $15.4 million and $47.9 million, for the three and nine months ended September 30, 2020, respectively, in provider related costs, with some portion of these provider costs due both to increased visit volumes as well as the Aligned Acquisition. Some portion of these provider costs were above typical levels due to the COVID-19 emergency rapid expansion of active providers. The increase in visit volume also resulted in the need to utilize a significantly higher level of non-clinical contractor resources to properly service visit demand. The Company experienced a $2.1 million and $5.5 million increase, for the three and nine months ended September 30, 2020, respectively, in employee-related expense (primarily in the form of variable compensation and stock compensation expense). Hardware costs increased $2.5 and $5.2 million, for the three and nine months ended September 30, 2020, respectively, related to the increase in sale of devices. There was also an increase of $2.0 million and $3.9 million, for the three and nine months ended September 30, 2020, respectively, in marketing services performed on behave of customers. As a percentage of revenue, cost of revenues has increased as a result of the shift in revenue mix. The impact of COVID-19 has increased our visit revenue, which generates a lower gross margin contribution.
Research and Development Expenses
Research and development expenses were $25.3 million for the three months ended September 30, 2020, compared to $13.6 million for the three months ended September 30, 2019, an increase of $11.7 million, or 86%. Research and development expenses were $57.8 million for the nine months ended September 30, 2020, compared to $39.2 million for the nine months ended September 30, 2019, an increase of $18.7 million, or 48%. These increases were primarily driven by an increase of $4.0 million and $7.4 million, for the three and nine months ended September 30, 2020, respectively, in employee-related costs (inclusive of stock compensation expense). The increase in research and development expense was further driven by a $7.0 million and $8.7 million increase, for the three and nine months ended September 30, 2020, respectively, in consulting services used by the research and development group. In the nine months ended September 30, 2020 there was also an increase in product development costs of $0.9 million and $0.5 million in third party software costs.
Sales and Marketing Expenses
Sales and marketing expenses were $13.8 million for the three months ended September 30, 2020, compared to $11.3 million for the three months ended September 30, 2019, an increase of $2.4 million, or 22%. Sales and marketing expenses were $40.0 million for the nine months ended September 30, 2020, compared to $34.0 million for the nine months ended September 30, 2019, an increase of $6.0 million, or 18%. These increases in sales and marketing primarily consisted of a $3.0 million and $6.8 million increase, for the three and nine months ended September 30, 2020, respectively, in employee-related costs (inclusive of commissions and stock compensation expense). The increase also consisted of an increase in third party software costs of $0.5 million and $1.3 million, for the three and nine months ended September 30, 2020, respectively. The increase for the three months ended September 30, 2020 was offset by reduced travel expenses of $1.4 million and the increase for the nine months ended September 30, 2020 was offset by a decrease in marketing and promotional items of $2.0 million
General and Administrative Expenses
General and administrative expenses were $43.1 million for the three months ended September 30, 2020, compared to $14.7 million for the three months ended September 30, 2019, an increase of $28.5 million, or 194%. General and administrative expenses were $138.5 million for the nine months ended September 30, 2020, compared to $40.2 million for the nine months ended September 30, 2019, an increase of $98.3 million, or 245%. These increases were driven by stock-based compensation expense of $28.3 million and $94.3 million, for the three and nine months ended September 30, 2020, respectively, (predominantly related to restricted stock units granted to the co-CEOs). Additionally, the increases consisted of employee-related costs (excluding compensation and stock compensation expense) of approximately $1.9 million and $6.4 million, for the three and nine months ended September 30, 2020, respectively. Each of these expenses were partially offset by savings in consulting expenses of $1.9 million and $2.2 million respectively (as the Company required less reliance on outside third parties). General and administrative expenses, excluding the increase in stock-based compensation, are expected to continue to increase (in absolute dollars) in future periods as we continue to grow in size and complexity while at the same time recognizing the full year impact of the regulatory and compliance costs associated with being a publicly traded company.
32
Table of Contents
Depreciation and Amortization Expense
Depreciation and amortization expenses were $2.6 million for the three months ended September 30, 2020, compared to $1.9 million for the three months ended September 30, 2019, an increase of $0.7 million, or 38%. Depreciation and amortization expenses were $7.4 million for the nine months ended September 30, 2020, compared to $5.7 million for the nine months ended September 30, 2019, an increase of $1.7 million, or 30%. Depreciation expense increased by $0.2 million and $0.2 million for the three and nine months ended September 30, 2020, respectively. Amortization expense increased by $0.5 million and $1.5 million for the three and nine months ended September 30, 2020, respectively.
Interest Income and Other Income (Expense), net
Interest income and other expenses were $0.3 million for the three months ended September 30, 2020, compared to $1.3 million for the three months ended September 30, 2019, a decrease of $1 million, or 80%. Interest income and other expenses were $1.4 million for the nine months ended September 30, 2020, compared to $4.5 million for the nine months ended September 30, 2019, a decrease of $3.1 million, or 69%. These amounts consist entirely of interest income from our cash equivalents and short-term investments.
Benefit (Expense) from Income Taxes
Income tax expense was $0.1 million for the three months ended September 30, 2020, compared to income tax benefit of $0.4 million for the three months ended September 30, 2019, a decrease of $0.5 million, or 120%. Income tax expense was $0.3 million for the nine months ended September 30, 2020, compared to $0.0 million for the nine months ended September 30, 2019, a decrease of $0.3 million, or 1,600%.
Loss from Equity Method Investment
The Company and Cleveland Clinic partnered to form a joint venture, under the name CCAW, JV LLC, to provide broad access to comprehensive and high acuity care services via telehealth. The Company does not have a controlling financial interest in CCAW, JV LLC, but it does have the ability to exercise significant influence over the operating and financial policies of CCAW, JV LLC. Therefore, the Company accounts for its investments in CCAW, JV LLC using the equity method of accounting. During the three months ended September 30, 2020, the Company recognized a loss of $0.5 million as its proportionate share of the joint venture results of operations. During the nine months ended September 30, 2020, the Company recognized a loss of $1.3 million as its proportionate share of the joint venture results of operations.
Liquidity and Capital Resources
The following table presents a summary of our cash flow activity for the periods set forth below:
| Nine Months Ended September 30, |
||||||||
| 2020 | 2019 | |||||||
| Condensed Consolidated Statements of Cash Flows Data: |
||||||||
| Net cash used in operating activities |
$ | (87,934 | ) | $ | (66,615 | ) | ||
| Net cash provided by investing activities |
(96,677 | ) | 146,465 | |||||
| Net cash provided by financing activities |
1,003,307 | 452 | ||||||
|
|
|
|
|
|||||
| Total |
$ | 818,696 | $ | 80,302 | ||||
Sources of Financing
Our principal sources of liquidity were cash, cash equivalents and short-term investments totaling $177.6 million and $1,086.3 million as of December 31, 2019 and September 30, 2020, respectively, which were held for a variety of growth initiatives and investments as well as working capital purposes. Our cash, cash equivalents and short-term investments are comprised of money market funds and marketable securities including U.S. Treasury bills.
In September 2020, we completed our initial public offering, or IPO, and issued and sold 45,681,499 shares of Class A common stock at an offering price of $18.00 per share, including 4,459,277 shares of Class A common stock pursuant to the exercise in full of the underwriters’ option to purchase additional shares. We received net proceeds of $768.5 million, after deducting underwriting
33
Table of Contents
discounts and commissions of $43.3 million and estimated deferred offering costs of approximately $4.4 million. In conjunction with the IPO we closed on the Google LLC private placement and issued 5,555,555 shares of Class C common stock for proceeds of $99.1 million, net of offering costs of $0.9 million.
Prior to our IPO, the Company funded its operations primarily through private placements of its convertible preferred stock as well as through revenues generated through customer contracts.
As shown in the accompanying condensed consolidated financial statements, the Company incurred a loss from operations of $177.9 million and a net loss of $178.0 million for the nine months ended September 30, 2020 and had an accumulated deficit of $532.0 million as of September 30, 2020.
The Company has no debt as of September 30, 2020 or December 31, 2019 and expects to generate operating losses in future years.
We believe that our existing cash and cash equivalents will be sufficient to meet our working capital and capital expenditure needs for at least the next 12 months from the issuance date of the financial statements. Our future capital requirements will depend on many factors including our growth rate, contract renewal activity, number of consultations on our platform, the timing and extent of spending to support product development efforts, our expansion of sales and marketing activities, the introduction of new and enhanced services offerings, and the continuing market acceptance of telehealth services. We may in the future enter into arrangements to acquire or invest in complementary businesses, services and technologies and intellectual property rights. We may be required to seek additional equity or debt financing. In the event that additional financing is required from outside sources, we may not be able to raise it on terms acceptable to us or at all. If we are unable to raise additional capital when desired, our business, financial condition and results of operations would be adversely affected.
Indebtedness & Lines of Credit
In January 2011, the Company entered into a credit agreement (the “Line of Credit”) with a financial institution that provides for maximum borrowings in one or more advances of an amount up to $5.0 million. Borrowings under the Line of Credit accrue interest at the London Interbank Offered Rate plus 1.25%. Borrowings are repayable immediately upon demand by the financial institution. In November 2017, the Line of Credit was amended to increase the maximum borrowings to $7.0 million. As of September 30, 2020 and December 31, 2019, the Company had no outstanding borrowings under the Line of Credit.
During any period that the Line of Credit is in effect, the Company can request the financial institution issue a letter of credit with a maximum maturity not to exceed twelve months. Any letters of credit issued by the financial instrument reduce the maximum borrowings available under the Line of Credit. As of September 30, 2020 and December 31, 2019, the maximum borrowing available to the Company is $5.9 million based on the outstanding letters of credit of $1.1 million that have been issued by the financial institution.
Nine months ended September 30, 2020, vs. nine months ended September 30, 2019
Cash Used in Operating Activities
For the nine months ended September 30, 2020, cash used in operating activities was $87.9 million. The primary driver of this use of cash was our net loss of $178.0 million. The net loss for the year was reflective of the expenses incurred with our response to COVID-19 and our continued investments made back into the Company’s infrastructure, partially offset by the revenue growth discussed above. The net loss was partially offset by non-cash expenses of $117.7 million (primarily stock-based compensation of $106.5 million and depreciation and amortization of $7.4 million).
For the nine months ended September 30, 2019, cash used in operating activities was $66.6 million. The primary driver of this use of cash was our net loss of $65.6 million. The cash used for operating activities was primarily driven by investment in corporate infrastructure as the Company integrated the Avizia acquisition and prepared for public company requirements. The net loss was partially offset by non-cash charges totaling $16.3 million (primarily comprised of stock-based compensation of $8.7 million and depreciation and amortization expense of $5.7 million.)
Cash Provided by Investing Activities
Cash used in investing activities was $96.7 million for the nine months ended September 30, 2020. Cash provided by investing activities consisted of $69.1 million in proceeds from the maturities of investments, offset by $159.6 million in purchases of investments. Further, cash used in investing activities included a $2.9 million investment in the CCAW, JV LLC joint venture with Cleveland Clinic and $3.3 million in the purchases of property and equipment.
34
Table of Contents
Cash provided by investing activities was $146.5 million for the nine months ended September 30, 2019. Cash provided by investing activities consisted of $226.5 million in proceeds from the maturities of investments, which were partially offset by the purchase of $78.9 million in investments. Further, the Company used $1.1 million for purchases of property and equipment.
Cash Provided by Financing Activities
Cash provided by financing activities for the nine months ended September 30, 2020, was $1,005.1 million. Cash provided by financing activities consisted of $146.0 million of cash proceeds from our issuance of Series C Convertible Preferred Stock, net of issuance costs, $772.9 million of cash proceeds from our IPO, net of underwriting commissions and $100 million cash proceeds from the issuance of Class C common stock to Google, LLC in a private placement offering. These proceeds were offset by cash payments for the purchase of treasury stock of $18.4 million.
Cash provided by financing activities for the nine months ended September 30, 2019, was $0.5 million. Cash provided by financing activities consisted of proceeds received from the exercise of options of common stock.
Off-Balance Sheet Arrangements
During the periods presented, we did not have, nor do we currently have, any relationships with unconsolidated entities or financial partnerships, such as entities often referred to as structured finance or special purpose entities, which would have been established for the purpose of facilitating off-balance sheet arrangements or other contractually narrow or limited purposes. We are therefore not exposed to the financing, liquidity, market or credit risk that could arise if we had engaged in those types of relationships.
Contractual Obligations and Commitments
As of September 30, 2020, there have been no material changes from the contractual obligations and commitments previously disclosed in our Prospectus.
Critical Accounting Policies and Estimates
Our condensed consolidated financial statements and the related notes thereto are prepared in accordance with GAAP. The preparation of condensed consolidated financial statements in conformity with GAAP requires management to make estimates and assumptions that affect the amounts reported in the condensed consolidated financial statements and accompanying notes. The Company bases its estimates on historical experience, current business factors, and various other assumptions that the Company believes are necessary to consider to form a basis for making judgments about the carrying values of assets and liabilities, the recorded amounts of revenue and expenses, and the disclosure of contingent assets and liabilities. The Company is subject to uncertainties such as the impact of future events, economic and political factors, and changes in the Company’s business environment; therefore, actual results could differ from these estimates. Accordingly, the accounting estimates used in the preparation of the Company’s condensed consolidated financial statements will change as new events occur, as more experience is acquired, as additional information is obtained, and as the Company’s operating environment evolves.
Our significant accounting policies are discussed in Note 2, Summary of Significant Accounting Policies, to our condensed consolidated financial statements in our Prospectus and Note 2, Summary of Significant Accounting Policies to our condensed consolidated financial statements in Part I, Item 1 of this Quarterly Report on Form 10-Q. There have been no significant changes to these policies during the three months ended September 30, 2020.
Recently Issued Accounting Pronouncements Adopted
For more information on recently issued accounting pronouncements, see Note 2 to our condensed consolidated financial statements covered under Part I, Item 1 of this Quarterly Report on Form 10-Q.
New Accounting Pronouncements Not Yet Adopted
For more information on new accounting pronouncements not yet adopted, see Note 2 to our condensed consolidated financial statements covered under Part I, Item 1 in this Quarterly Report on Form 10-Q.
Emerging Growth Company Status
We are an emerging growth company, as defined in the Jumpstart Our Business Startups Act of 2012 (the “JOBS Act”). Under the JOBS Act, emerging growth companies can delay adopting new or revised accounting standards issued subsequent to the enactment of the JOBS Act until such time as those standards apply to private companies. We have elected to use this extended
35
Table of Contents
transition period for complying with new or revised accounting standards that have different effective dates for public and private companies until the earlier of the date that it is (i) no longer an emerging growth company or (ii) affirmatively and irrevocably opt out of the extended transition period provided in the JOBS Act. As a result, our financial statements may not be comparable to companies that comply with the new or revised accounting pronouncements as of public company effective dates.
Item 3. Qualitative and Quantitative Disclosure about Market Risk
Interest Rate Risk
We had cash and cash equivalents totaling $956.4 million, and $137.7 million as of September 30, 2020 and December 31, 2019, respectively. The Company also held investments totaling $129.9 million and $40.0 million as of September 30, 2020, and December 31, 2019, respectively. These amounts were primarily invested in money markets and U.S. Treasury bills. The cash and cash equivalents are held for a variety of growth and investments as well as working capital purposes. Our investments are made for capital preservation purposes. We do not enter into investments for trading or speculative purposes. All our investments are denominated in U.S. dollars.
We do not believe that an increase or decrease of 100 basis points in interest rates would have a material effect on our business, financial condition or results of operations. However, our cash equivalents are subject to market risk due to changes in interest rates. Fixed rate securities may have their market value adversely affected due to a rise in interest rates. Due in part to these factors, our future investment income may fall short of expectation due to changes in interest rates or we may suffer losses in principal if we are forced to sell securities that decline in market value due to changes in interest rates.
Fluctuations in the value of our money market funds caused by a change in interest rates (gains or losses on the carrying value) are recorded in other income and are realized only if we sell the underlying securities.
Foreign Currency Exchange Risk
To date, a substantial majority of our revenue from customer arrangements has been denominated in U.S. dollars. We have limited operations outside the United States. As of September 30, 2020 and December 31, 2019, we had one foreign subsidiary. The functional currency of our foreign subsidiary is the U.S. dollar. The Company also has a branch with a functional currency of the New Israeli Shekel, however activity in the New Israeli Shekel is not considered significant. Accordingly, we believe we do not have a material exposure to foreign currency risk. We may choose to focus on international expansion, which may increase our exposure to foreign currency exchange risk in the future.
Inflation Risk
We do not believe that inflation had a material effect on our business, financial condition or results of operations in the last two years. If our costs were to become subject to significant inflationary pressures, we may not be able to fully offset such higher costs through price increases. Our inability or failure to do so could harm our business, financial condition or results of operations.
Item 4. Controls and Procedures
Evaluation of Disclosure Controls and Procedures
Our management, with the participation of our principal executive officers and principal financial officer, has evaluated the effectiveness of our disclosure controls and procedures (as defined in Rules 13a-15(e) and 15d-15(e) under the Securities Exchange Act of 1934, as amended, or the Exchange Act), as of the end of the period covered by this Quarterly Report on Form 10-Q. Based on such evaluation, our principal executive officers and principal financial officer have concluded that, as of such date, our disclosure controls and procedures were not effective at a reasonable assurance level as of September 30, 2020 due to material weaknesses in internal control over financial reporting, as described below:
The management of the company is responsible for establishing and maintaining adequate internal control over financial reporting as defined in Rules 13a-15(f) and 15d-15(f) under the Exchange Act. As of December 31, 2019, we identified material weaknesses in our internal control over financial reporting. The material weaknesses we identified were as follows:
| • | We did not maintain an effective control environment as we did not maintain a sufficient complement of accounting and financial reporting resources commensurate with our financial reporting requirements. This material weakness contributed to the following material weaknesses: |
| • | We did not have sufficient resources to appropriately record revenue transactions, nor did we did have controls in place to validate that the terms of the revenue transactions were appropriately entered into the revenue sub-ledger based on the terms of the arrangement with the customer. |
36
Table of Contents
| • | We did not design or maintain the appropriate controls to review the work of the third party used to assist management in the accounting for taxes, including both income taxes and non-income based taxes. |
| • | We did not design or maintain effective controls over the period end financial reporting process and preparation of financial statements. Specifically, we did not design and implement a sufficient level of formal accounting policies and procedures that define how transactions across the business cycles should be initiated, recorded, processed and reported and appropriately authorized and approved. |
These control deficiencies did not result in errors that were material to our annual financial statements. However, these control deficiencies could result in a misstatement in our accounts or disclosures that would result in a material misstatement to the annual financial statements that would not be prevented or detected. Accordingly, we determined that these control deficiencies constitute material weaknesses.
We are in the process of implementing measures designed to improve our internal control over financial reporting and remediate the control deficiencies that led to the material weaknesses. As of September 30, 2020, we have completed the following remedial actions:
| • | hired additional full-time accounting resources with appropriate levels of accounting knowledge and experience, including but not limited to a Chief Financial Officer in the second half of 2018, a Vice President of Accounting, Vice President of FP&A and Director of Revenue in the first half of 2019; |
| • | reallocated responsibilities across the accounting organization to ensure that the appropriate level of knowledge and experience is applied based on risk and complexity of transactions and tasks under review; |
| • | migrated to a new accounting enterprise resource planning (“ERP”) system that better meets the needs of our business; |
| • | implemented controls to provide for a robust review of the accounting for taxes including the work prepared by the third party as well as identification of changes to tax regulation to ensure all tax regulation changes that impact the Company are being evaluated timely and properly. |
We have made significant progress towards remediating the material weaknesses by hiring qualified professionals for critical roles within our accounting department and migrating to a new ERP system, and we continue enhancing and implementing new processes and controls to strengthen our internal control over financial reporting. We believe we are taking the steps necessary to remediate these material weaknesses and will continue to review, revise, and improve the effectiveness of our internal controls as appropriate. Although we have made significant enhancements to our control procedures, these material weaknesses will not be considered remediated until our controls are operational for a sufficient period of time, tested and management concludes that these controls are operating effectively.
Changes in Internal Control over Financial Reporting
During the third quarter, we have designed and implemented controls related to the accounting for taxes, including both income and non-income based taxes, that have materially affected, or are reasonably likely to materially affect, our internal control over financial reporting. Other than these changes, there have been no other changes in our internal control over financial reporting identified in management’s evaluation pursuant to Rules 13a-15(d) or 15d-15(d) of the Exchange Act during the period covered by this Quarterly Report on Form 10-Q that materially affected, or are reasonably likely to materially affect, our internal control over financial reporting.
Limitations on Effectiveness of Controls and Procedures
Our management, including our principal executive officers and principal financial officer, do not expect that our disclosure controls and procedures or our internal control over financial reporting will prevent all errors and all fraud. A control system, no matter how well designed and operated, can provide only reasonable, not absolute, assurance that the objectives of the control system are met. Further, the design of a control system must reflect the fact that there are resource constraints, and the benefits of controls must be considered relative to their costs. Because of the inherent limitations in all control systems, no evaluation of controls can provide absolute assurance that all control issues and instances of fraud, if any, have been detected. These inherent limitations include the realities that judgments in decision-making can be faulty, and that breakdowns can occur because of a simple error or mistake. Additionally, controls can be circumvented by the individual acts of some persons, by collusion of two or more people or by
37
Table of Contents
management override of the controls. The design of any system of controls is also based in part upon certain assumptions about the likelihood of future events, and there can be no assurance that any design will succeed in achieving its stated goals under all potential future conditions; over time, controls may become inadequate because of changes in conditions, or the degree of compliance with policies or procedures may deteriorate. Due to inherent limitations in a cost-effective control system, misstatements due to error or fraud may occur and not be detected.
From time to time, we may become involved in legal proceedings arising in the ordinary course of our business. We are not presently a party to any legal proceedings that, in the opinion of our management, would individually or taken together have a material adverse effect on our business, financial condition, results of operations or cash flows. Regardless of outcome, litigation can have an adverse impact on us due to defense and settlement costs, diversion of management resources, negative publicity, reputational harm and other factors.
On September 14, 2020, we received a letter from Teladoc Health, Inc. alleging that certain of our cart products and associated peripherals infringe upon their patents. On October 12, 2020, Teladoc Health, Inc filed a claim against the Company related to these allegations. While we can provide no guarantees about the outcome of any potential dispute, we believe that these claims lack merit and we intend to defend against them vigorously. Moreover, even if we were found to infringe upon any valid claim of these patents, our revenues from the Carepoints products approximated 5% of our revenues in 2019. See “Risk Factors—Third parties may challenge the validity of our patents and trademarks, or oppose our patent and trademark applications. We may not be able to obtain and enforce additional patents to protect our proprietary rights from use by potential competitors. Companies with other patents could require us to stop using or pay to use required technology” and “Risk Factors—We could incur substantial costs as a result of any claim of infringement of another party’s intellectual property rights” in our Prospectus.
There have been no material changes to the risk factors previously disclosed in our Prospectus. For a discussion of potential risks and uncertainties related to our Company see the information in our Prospectus in the section entitled “Risk Factors.”
In addition to the other information set forth in this Quarterly Report on Form 10-Q, you should carefully consider the factors discussed in the “Special Note Regarding Forward-Looking Statements” section in Part I, Item 2, of this Quarterly Report on Form 10-Q.
ITEM 2. Unregistered Sales of Equity Securities and Use of Proceeds
Unregistered Sale of Equity Securities
On September 21, 2020 we granted restricted stock units for an aggregate of 3,230,750 shares of Class A common stock under our 2020 Equity Incentive Plan
None of the foregoing transactions involved any underwriters, underwriting discounts or commissions, or any public offering. We believe the offers, sales, and issuances of the above securities were exempt from registration under the Securities Act (or Regulation D or Regulation S promulgated thereunder) by virtue of Section 4(a)(2) of the Securities Act because the issuance of securities to the recipients did not involve a public offering, or in reliance on Rule 701 because the transactions were pursuant to compensatory benefit plans or contracts relating to compensation as provided under such rule. The recipients of the securities in each of these transactions represented their intentions to acquire the securities for investment only and not with a view to or for sale in connection with any distribution thereof, and appropriate legends were placed upon the stock certificates issued in these transactions. All recipients had adequate access, through their relationships with us, to information about us. The sales of these securities were made without any general solicitation or advertising.
Use of Proceeds
On September 21, 2020, we closed our initial public offering, or IPO, in which we sold 45,681,499 shares of our Class A common stock at an offering price of $18.00 per share, including 4,459,277 shares of Class A common stock pursuant to the exercise in full of the underwriters’ option to purchase additional shares. We received net proceeds of $768.5 million, after deducting underwriting discounts and commissions of $49.3 million and estimated deferred offering costs of $4.4 million. All of the shares of common stock issued and sold in our IPO were registered under the Securities Act of 1933, as amended pursuant to a registration statement on Form S-1 (File No. 333-248309), which was declared effective by the SEC on September 16, 2020. The representatives of the underwriters of our IPO were Morgan Stanley & Co. LLC, Goldman Sachs & Co. LLC, Piper Sandler & Co, UBS Securities LLC, Credit Suisse Securities (USA) LLC, Cowen and Company, LLC, and Berenberg Capital Markets LLC.
38
Table of Contents
Concurrent with the IPO we closed on the Google LLC private placement and issued 5,555,555 shares of Class C common stock for proceeds of $99.1 million, net of offering costs of $0.9 million. No offering costs were paid directly or indirectly to any of our directors or officers (or their associates) or persons owning 10% or more of any class of our equity securities or to any other affiliates. As of September 30, 2020, approximately $1.5 million of expenses incurred in connection with our IPO had been paid. There has been no material change in the planned use of proceeds from our IPO from those disclosed in the Prospectus. In September 2020, the Company repurchased 1,340,354 shares of Class A and Class B common stock from certain executive officers and other employees, to permit such executive officers and other employees to pay taxes owed in connection with the vesting of equity awards, including the repayment of third party loans incurred to finance the payment of such taxes.
Issuer Purchases of Equity Securities
The following table provides information about the Company’s purchases of its common stock for each month during this quarterly period covered by this report:
| Period |
(a) Total number of shares (or units) purchased |
(b) Average price paid per share (or unit) |
(c) Total number of shares (or units) purchased as part of publicly announced plans or programs |
(d) Maximum number (or approximate dollar value) of shares (or units) that may yet be purchased under the plans or programs |
||||||||||||
| July 1 to July 31 |
— | — | — | — | ||||||||||||
| August 1 to August 31 |
— | — | — | |||||||||||||
| September 1 to September 30 |
1,340,354 | * | $ | 18.00 | — | — | ||||||||||
| Total |
1,340,354 | * | $ | 18.00 | — | — | ||||||||||
| * | Represents shares repurchased from certain officers using a portion of the net proceeds from the IPO, approximately $24.2 million, as discussed in Use of Proceeds. |
Item 3. Defaults Upon Senior Securities
Not applicable.
Item 4. Mine Safety Disclosures
Not applicable.
Not applicable.
39
Table of Contents
The documents listed below are incorporated by reference or are filed with this Quarterly Report on Form 10-Q, in each case as indicated therein (numbered in accordance with Item 601 of Regulation S-K).
40
Table of Contents
SIGNATURES
Pursuant to the requirements of the Securities Exchange Act of 1934, the registrant has duly caused this report to be signed on its behalf by the undersigned, thereunto duly authorized.
| AMERICAN WELL CORPORATION | ||||||||
| Date: | November 13, 2020 |
By: |
/s/ Ido Schoenberg, MD | |||||
| Co-Chief Executive Officer | ||||||||
| (Principal Executive Officer) | ||||||||
| Date: | November 13, 2020 |
By: |
/s/ Roy Schoenberg, MD, MPH | |||||
| Co-Chief Executive Officer | ||||||||
| (Principal Executive Officer) | ||||||||
| Date: | November 13, 2020 |
By: |
/s/ Keith Anderson | |||||
| Chief Financial Officer | ||||||||
| (Principal Financial Officer) | ||||||||
| Date: | November 13, 2020 |
By: |
/s/ Paul McNeice | |||||
| Vice President of Accounting | ||||||||
| (Principal Accounting Officer) | ||||||||
41