Attached files
| file | filename |
|---|---|
| EX-99.1 - EX-99.1 - Thryv Holdings, Inc. | q32020earningsreleasef.htm |
| 8-K - 8-K - Thryv Holdings, Inc. | thryv-earningsrelease8.htm |

Investor Supplement Third Quarter 2020
Safe Harbor This Presentation may include certain forward-looking statements, including, without limitation, statements concerning the conditions of our industry and our operations, performance, and financial condition, including, in particular, statements relating to our business, growth strategies, product development efforts, and future expenses. Forward-looking statements can be identified by words such as ‘‘anticipates,’’ ‘‘intends,’’ ‘‘plans,’’ ‘‘seeks,’’ ‘‘believes,’’ ‘‘estimates,’’ ‘‘expects,’’ and similar references to future periods, or by the inclusion of forecasts or projections. Forward-looking statements are based on our current expectations and assumptions regarding our business, the economy, and other future conditions. Because forward- looking statements relate to the future, by their nature, they are subject to inherent uncertainties and risks (some of which are beyond our control) and changes in circumstances or other assumptions that may cause actual results or performance to be materially different from those expressed or implied by these forward-looking statements. As a result, our actual results may differ materially from those contemplated by the forward-looking statements. Except as required by law, we are under no obligation to, and expressly disclaim any obligation to, update or alter any forward-looking statements whether as a result of any such changes, new information, subsequent events or otherwise. Market data and industry information used throughout this Presentation are based on management’s knowledge of the industry and the good faith estimates of management. We also relied, to the extent available, upon management’s review of independent industry surveys and publications and other publicly available information prepared by a number of third party sources. All of the market data and industry information used in this Presentation involves a number of assumptions and limitations, and you are cautioned not to give undue weight to such estimates. Although we believe that these sources are reliable, we cannot guarantee the accuracy or completeness of this information, and we have not independently verified this information. While we believe the estimated market position, market opportunity and market size information included in this presentation are generally reliable, such information, which is derived in part from management’s estimates and beliefs, is inherently uncertain and imprecise. Projections, assumptions and estimates of our future performance and the future performance of the industry in which we operate are necessarily subject to a high degree of uncertainty and risk due to a variety of factors. These factors could cause results to differ materially from those expressed in our estimates and beliefs and in the estimates prepared by independent parties. You should not construe the contents of this Presentation as legal, tax, accounting or investment advice or a recommendation to take (or refrain from taking) any particular action. You should consult your own counsel and tax and financial advisors as to legal and related matters concerning the matters described herein. In addition to financial measures prepared in accordance with U.S. generally accepted accounting principles (“GAAP”), this press release and the accompanying tables contain, and the conference call will contain, non-GAAP financial measures. We present non-GAAP measures including: adjusted EBITDA, adjusted EBITDA margin, and Free Cash Flow. The non-GAAP financial information is presented for supplemental informational purposes only and is not intended to be considered in isolation or as a substitute for, or superior to, financial information prepared and presented in accordance with GAAP. Please refer to the supplemental information presented in the tables for reconciliations of the non-GAAP financial measures used in this press release to the most comparable GAAP financial measures. We believe that these non-GAAP financial measures provide useful information about our financial performance, enhance the overall understanding of our past performance and future prospects and allow for greater transparency with respect to important metrics used by our management for financial and operational decision-making. We believe that these measures provide an additional tool for investors to use in comparing our core financial performance over multiple periods with other companies in our industry. However, it is important to note that the particular items we exclude from, or include in, our non-GAAP financial measures may differ from the items excluded from, or included in, similar non-GAAP financial measures used by other companies in the same industry. Financial results are presented herein were prepared in accordance with ASC 606 “Revenue Recognition” and ASC 842 “Leases” 2
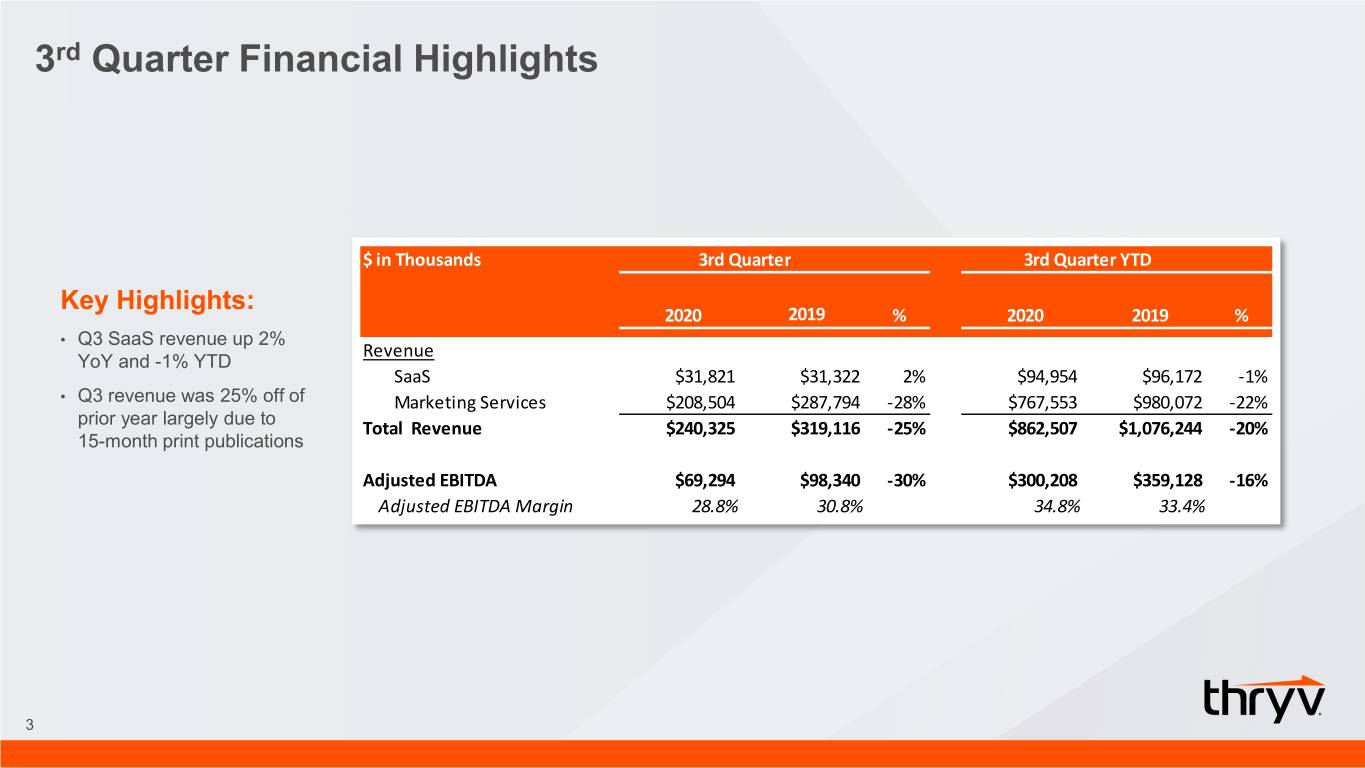
3rd Quarter Financial Highlights $ in Thousands 3rd Quarter 3rd Quarter YTD Key Highlights: 2020 2019 % 2020 2019 % • Q3 SaaS revenue up 2% Revenue YoY and -1% YTD SaaS $31,821 $31,322 2% $94,954 $96,172 -1% • Q3 revenue was 25% off of Marketing Services $208,504 $287,794 -28% $767,553 $980,072 -22% prior year largely due to Total Revenue $240,325 $319,116 -25% $862,507 $1,076,244 -20% 15-month print publications Adjusted EBITDA $69,294 $98,340 -30% $300,208 $359,128 -16% Adjusted EBITDA Margin 28.8% 30.8% 34.8% 33.4% 3
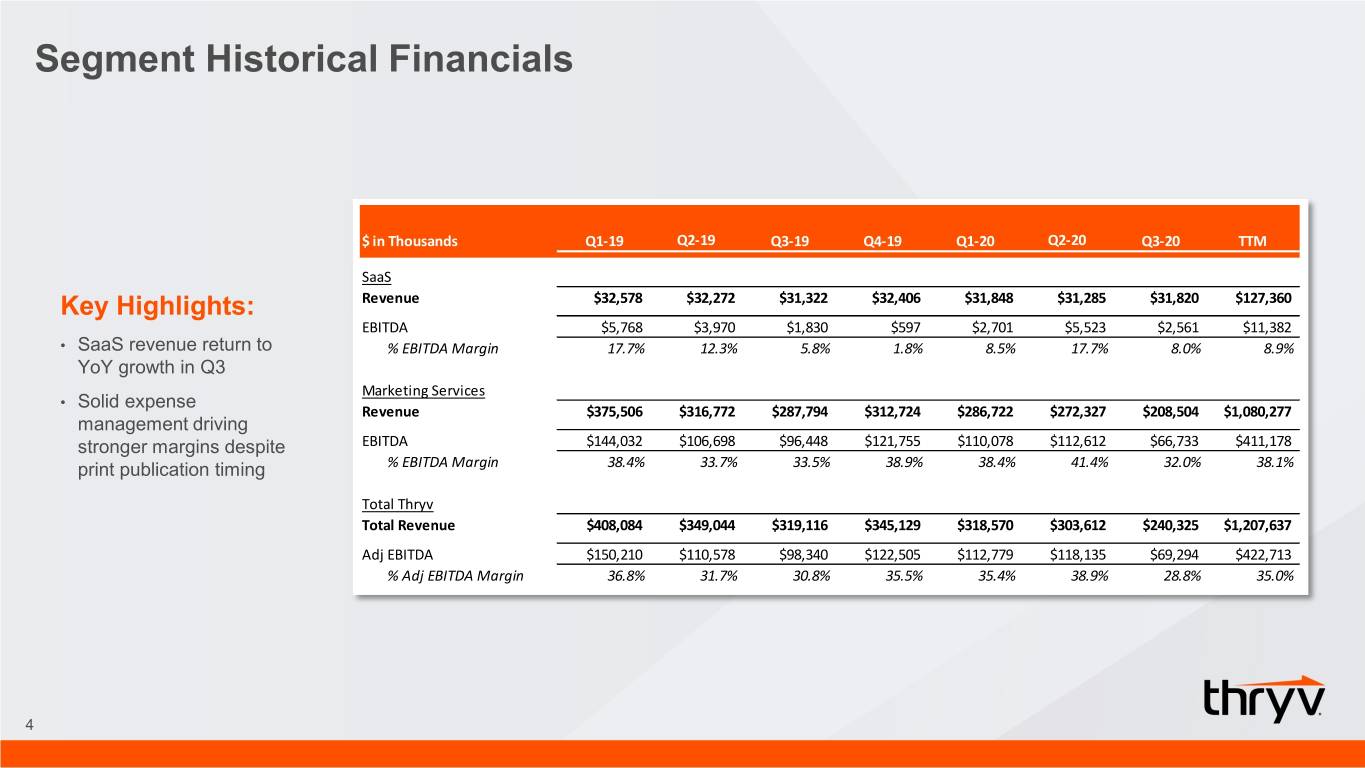
Segment Historical Financials $ in Thousands Q1-19 Q2-19 Q3-19 Q4-19 Q1-20 Q2-20 Q3-20 TTM SaaS Key Highlights: Revenue $32,578 $32,272 $31,322 $32,406 $31,848 $31,285 $31,820 $127,360 EBITDA $5,768 $3,970 $1,830 $597 $2,701 $5,523 $2,561 $11,382 • SaaS revenue return to % EBITDA Margin 17.7% 12.3% 5.8% 1.8% 8.5% 17.7% 8.0% 8.9% YoY growth in Q3 Marketing Services • Solid expense Revenue $375,506 $316,772 $287,794 $312,724 $286,722 $272,327 $208,504 $1,080,277 management driving stronger margins despite EBITDA $144,032 $106,698 $96,448 $121,755 $110,078 $112,612 $66,733 $411,178 print publication timing % EBITDA Margin 38.4% 33.7% 33.5% 38.9% 38.4% 41.4% 32.0% 38.1% Total Thryv Total Revenue $408,084 $349,044 $319,116 $345,129 $318,570 $303,612 $240,325 $1,207,637 Adj EBITDA $150,210 $110,578 $98,340 $122,505 $112,779 $118,135 $69,294 $422,713 % Adj EBITDA Margin 36.8% 31.7% 30.8% 35.5% 35.4% 38.9% 28.8% 35.0% 4
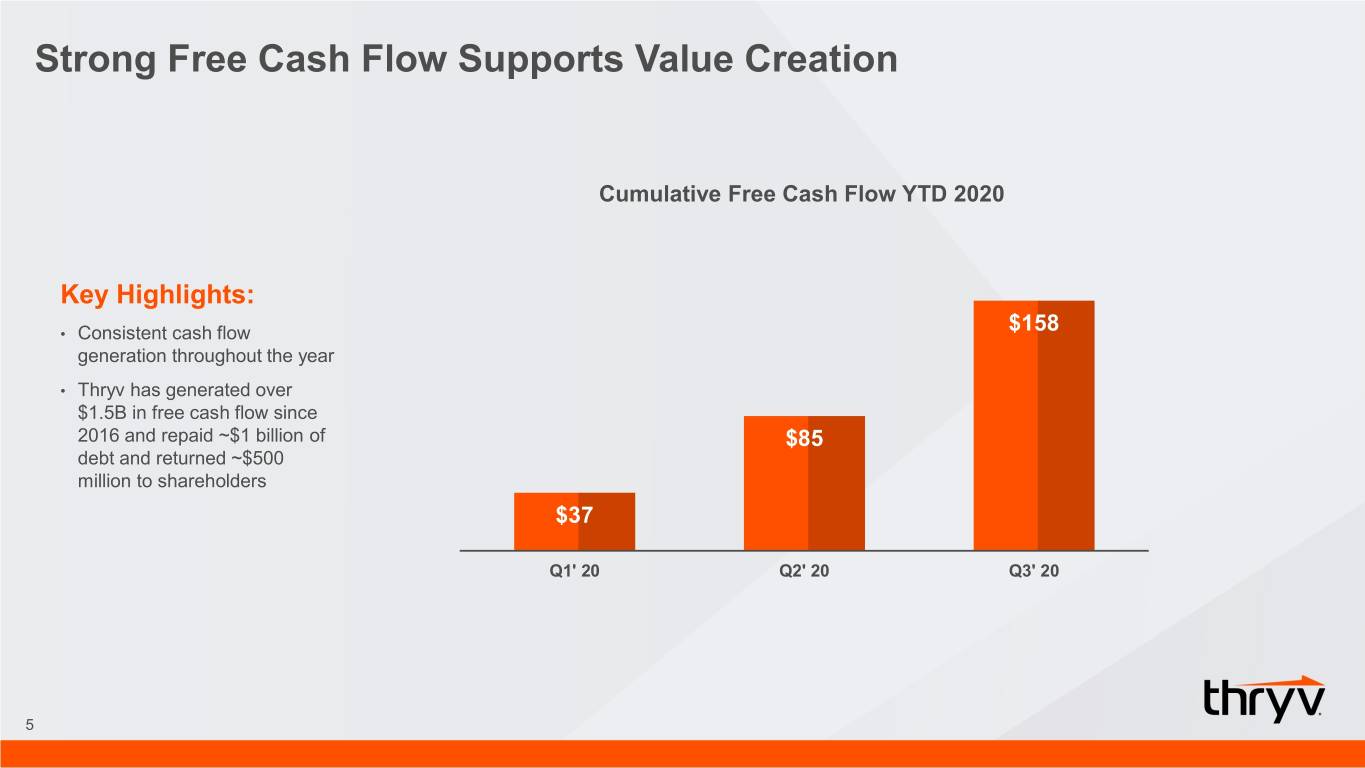
Strong Free Cash Flow Supports Value Creation Cumulative Free Cash Flow YTD 2020 Key Highlights: • Consistent cash flow $158 generation throughout the year • Thryv has generated over $1.5B in free cash flow since 2016 and repaid ~$1 billion of $85 debt and returned ~$500 million to shareholders $37 Q1' 20 Q2' 20 Q3' 20 5
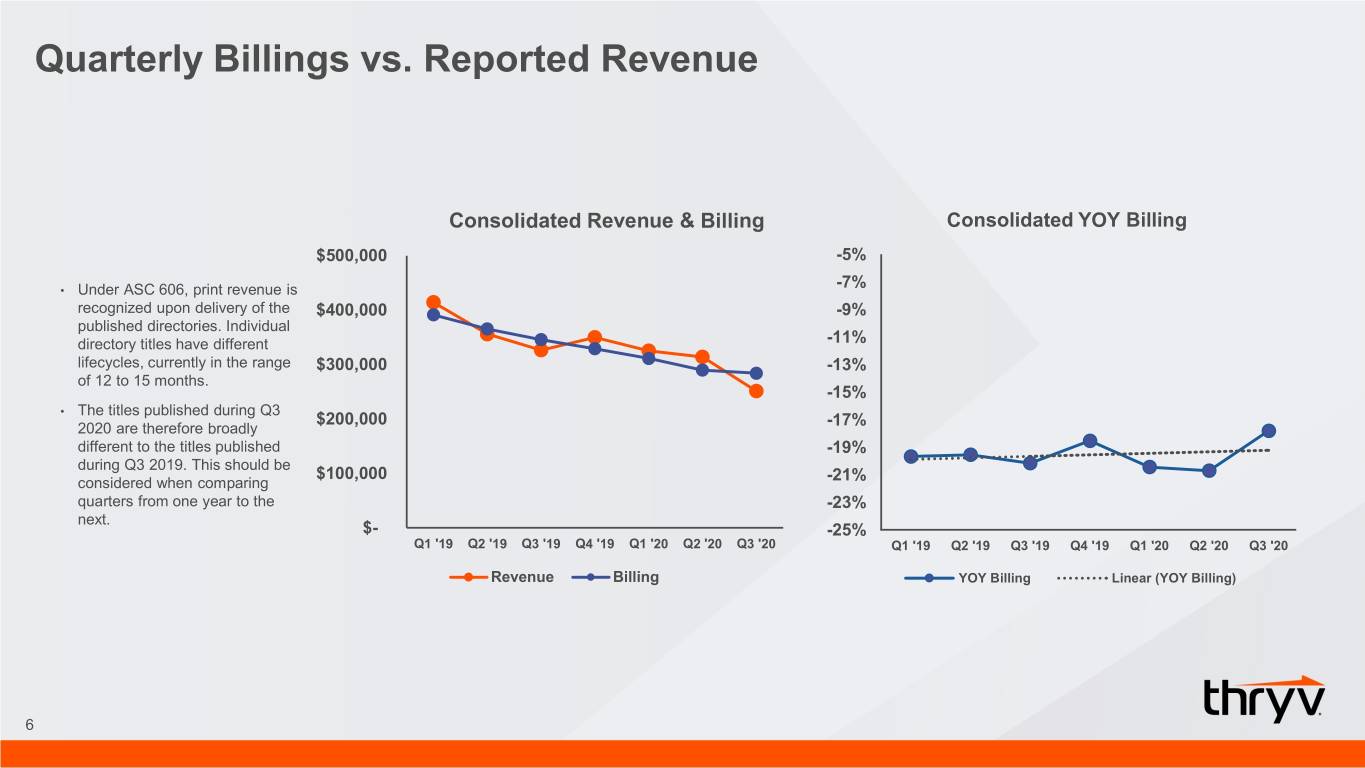
Quarterly Billings vs. Reported Revenue Consolidated Revenue & Billing Consolidated YOY Billing $500,000 -5% • Under ASC 606, print revenue is -7% recognized upon delivery of the $400,000 -9% published directories. Individual directory titles have different -11% lifecycles, currently in the range $300,000 -13% of 12 to 15 months. -15% • The titles published during Q3 2020 are therefore broadly $200,000 -17% different to the titles published -19% during Q3 2019. This should be $100,000 considered when comparing -21% quarters from one year to the -23% next. $- -25% Q1 '19 Q2 '19 Q3 '19 Q4 '19 Q1 '20 Q2 '20 Q3 '20 Q1 '19 Q2 '19 Q3 '19 Q4 '19 Q1 '20 Q2 '20 Q3 '20 Revenue Billing YOY Billing Linear (YOY Billing) 6

A low friction offering specially designed for service based Small Businesses. 7
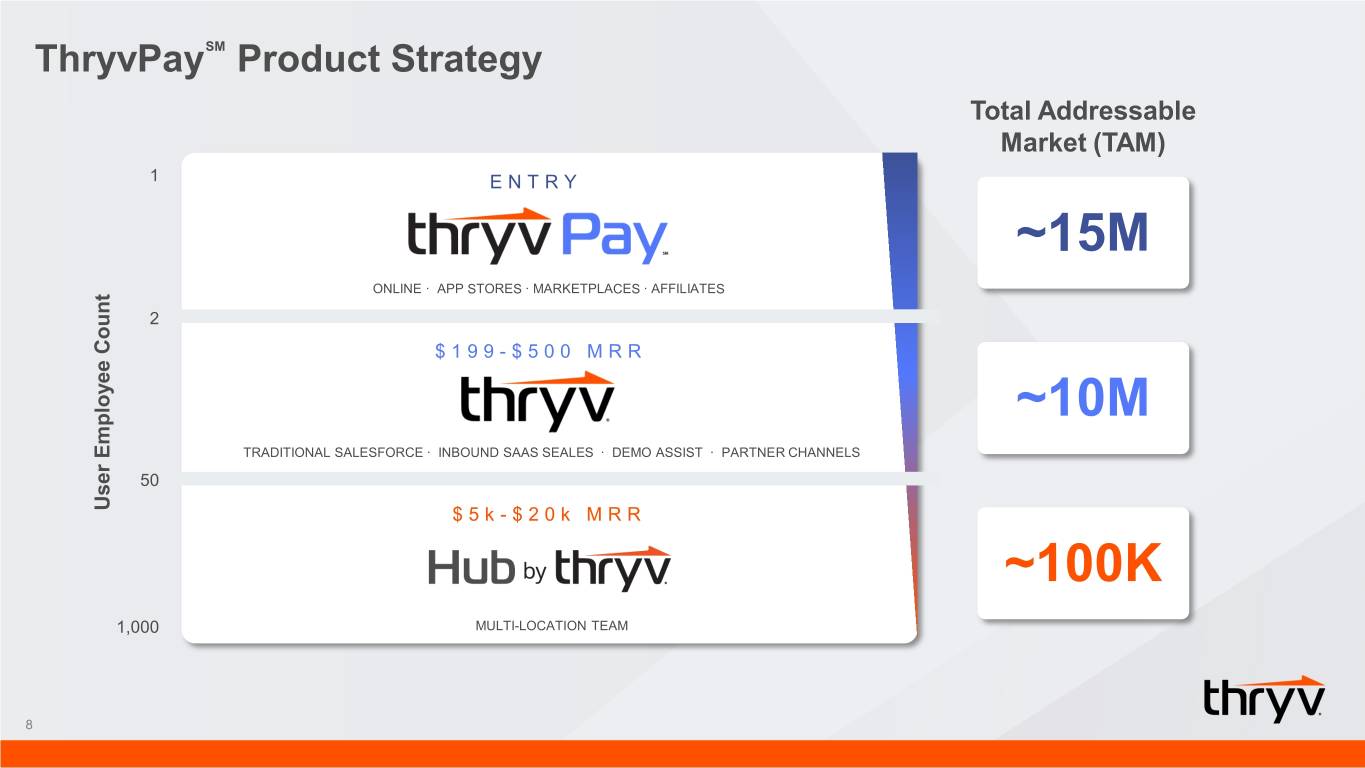
ThryvPay SM Product Strategy Total Addressable Market (TAM) 1 ENTRY ~15M ONLINE ∙ APP STORES ∙ MARKETPLACES ∙ AFFILIATES 2 $199- $500 MRR ~10M TRADITIONAL SALESFORCE ∙ INBOUND SAAS SEALES ∙ DEMO ASSIST ∙ PARTNER CHANNELS 50 User Employee Count User Employee $5k- $20k MRR ~100K 1,000 MULTI-LOCATION TEAM 8

SaaS Revenue (excluding sales allowance) # Clients (k) 34.0 33.4 33.1 32.9 32.8 32.5 33.3 31.1 32.0 32.4 54.8 28.3 52.6 54.4 52.2 49.5 47.7 47.4 45.4 43.9 75% 44.5 44.1 67% 67% 49% 25% 9% -6% -13% -11% -17% -15% Q1'18 Q2'18 Q3'18 Q4'18 Q1'19 Q2'19 Q3'19 Q4'19 Q1'20 Q2'20 Q3'20 Q1'18 Q2'18 Q3'18 Q4'18 Q1'19 Q2'19 Q3'19 Q4'19 Q1'20 Q2'20 Q3'20 YOY ARPU Churn $260 4.3% $240 4.2% $236 $232 3.9% $225 3.4% 3.4% 3.4% $215 3.0% 2.6% 2.6% 2.7% $204 $202 $205 2.5% $197 $201 Q1'18 Q2'18 Q3'18 Q4'18 Q1'19 Q2'19 Q3'19 Q4'19 Q1'20 Q2'20 Q3'20 Q1'18 Q2'18 Q3'18 Q4'18 Q1'19 Q2'19 Q3'19 Q4'19 Q1'20 Q2'20 Q3'20 9
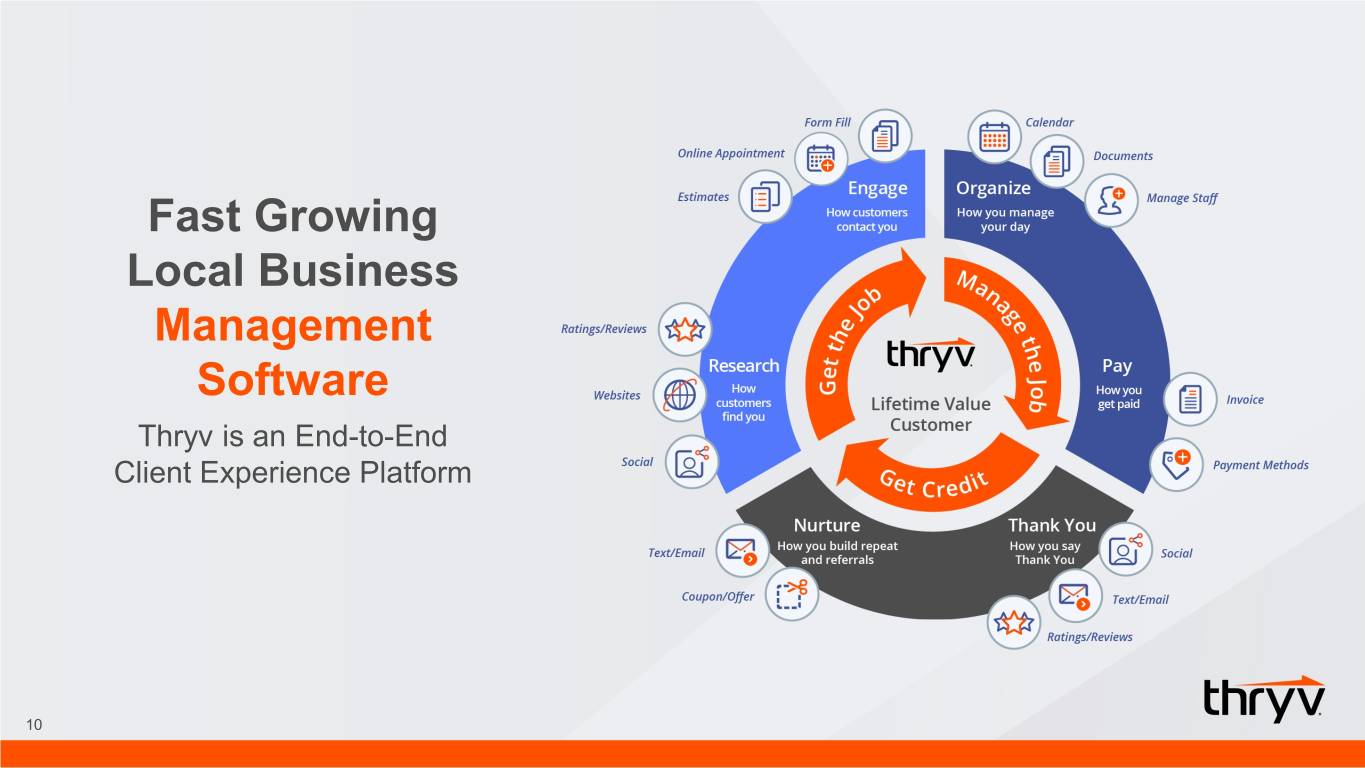
Fast Growing Local Business Management Software Thryv is an End-to-End Client Experience Platform 10
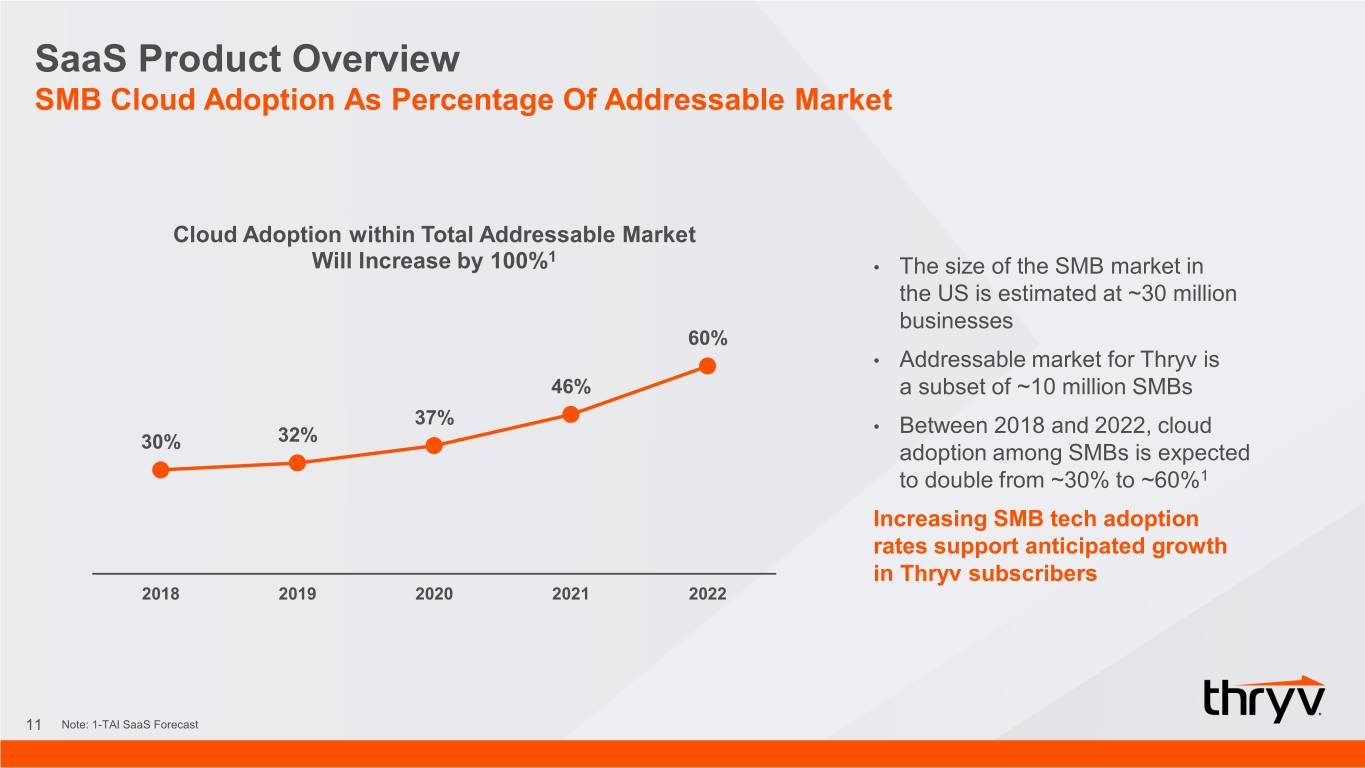
SaaS Product Overview SMB Cloud Adoption As Percentage Of Addressable Market Cloud Adoption within Total Addressable Market 1 Will Increase by 100% • The size of the SMB market in the US is estimated at ~30 million businesses 60% • Addressable market for Thryv is 46% a subset of ~10 million SMBs 37% 32% • Between 2018 and 2022, cloud 30% adoption among SMBs is expected to double from ~30% to ~60%1 Increasing SMB tech adoption rates support anticipated growth in Thryv subscribers 2018 2019 2020 2021 2022 11 Note: 1-TAI SaaS Forecast
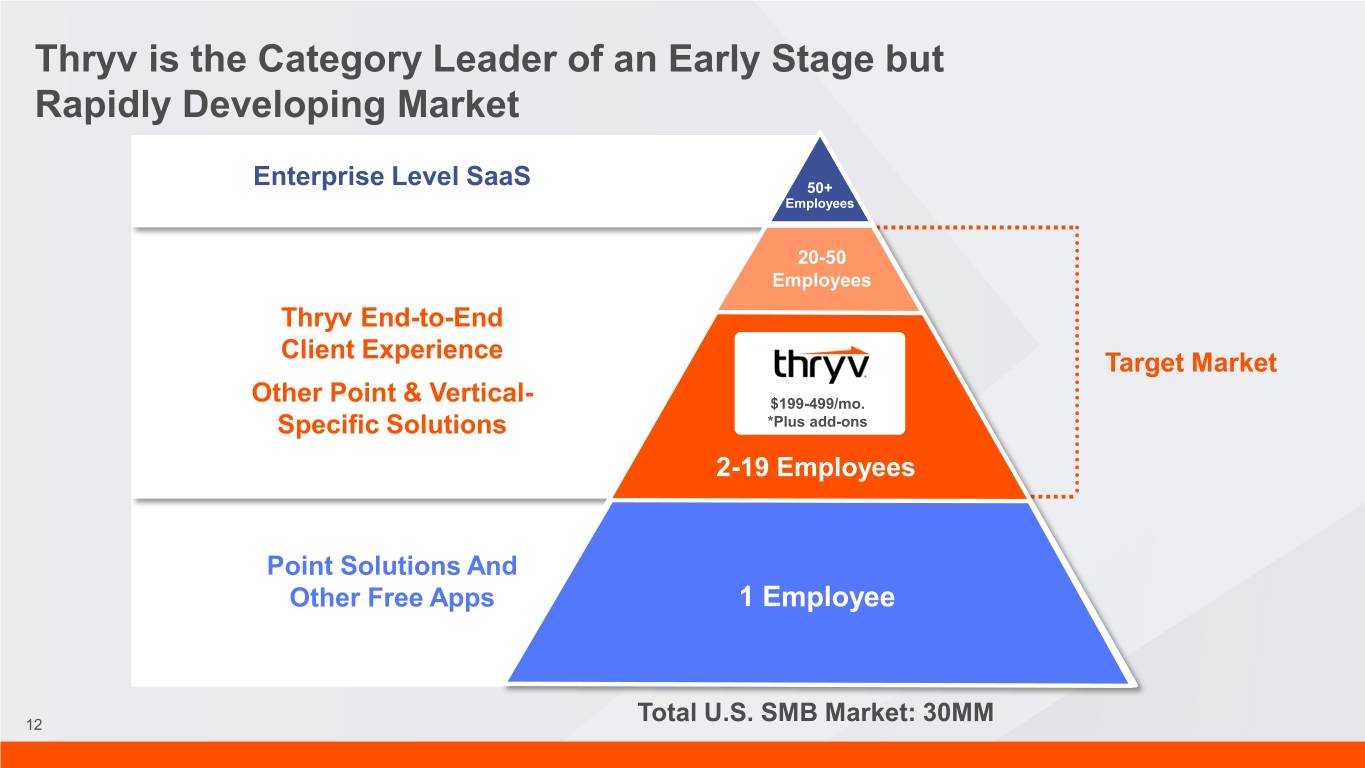
Thryv is the Category Leader of an Early Stage but Rapidly Developing Market Enterprise Level SaaS 50+ Employees 20-50 Employees Thryv End-to-End Client Experience Target Market Other Point & Vertical- $199-499/mo. Specific Solutions *Plus add-ons 2-19 Employees Point Solutions And Other Free Apps 1 Employee 12 Total U.S. SMB Market: 30MM

Q&A 13
Appendix 14
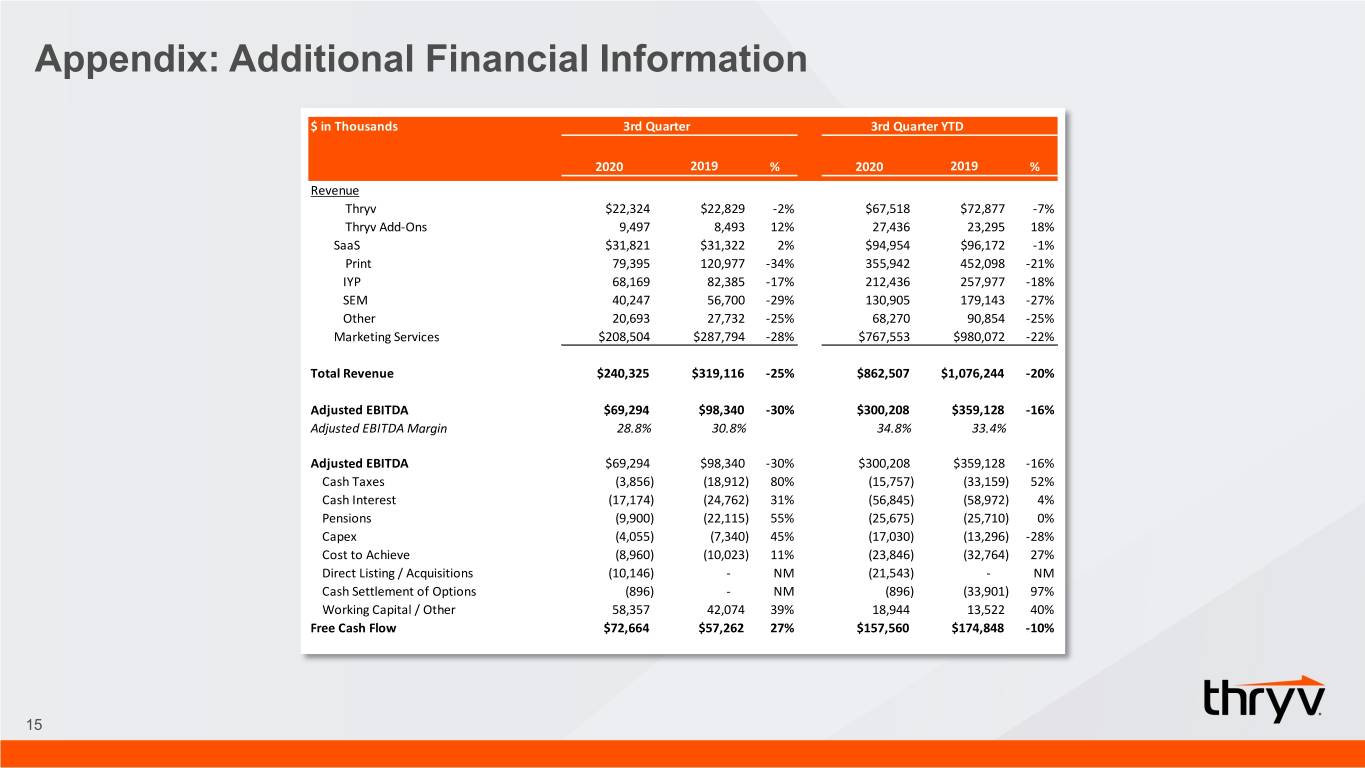
Appendix: Additional Financial Information $ in Thousands 3rd Quarter 3rd Quarter YTD 2020 2019 % 2020 2019 % Revenue Thryv $22,324 $22,829 -2% $67,518 $72,877 -7% Thryv Add-Ons 9,497 8,493 12% 27,436 23,295 18% SaaS $31,821 $31,322 2% $94,954 $96,172 -1% Print 79,395 120,977 -34% 355,942 452,098 -21% IYP 68,169 82,385 -17% 212,436 257,977 -18% SEM 40,247 56,700 -29% 130,905 179,143 -27% Other 20,693 27,732 -25% 68,270 90,854 -25% Marketing Services $208,504 $287,794 -28% $767,553 $980,072 -22% Total Revenue $240,325 $319,116 -25% $862,507 $1,076,244 -20% Adjusted EBITDA $69,294 $98,340 -30% $300,208 $359,128 -16% Adjusted EBITDA Margin 28.8% 30.8% 34.8% 33.4% Adjusted EBITDA $69,294 $98,340 -30% $300,208 $359,128 -16% Cash Taxes (3,856) (18,912) 80% (15,757) (33,159) 52% Cash Interest (17,174) (24,762) 31% (56,845) (58,972) 4% Pensions (9,900) (22,115) 55% (25,675) (25,710) 0% Capex (4,055) (7,340) 45% (17,030) (13,296) -28% Cost to Achieve (8,960) (10,023) 11% (23,846) (32,764) 27% Direct Listing / Acquisitions (10,146) - NM (21,543) - NM Cash Settlement of Options (896) - NM (896) (33,901) 97% Working Capital / Other 58,357 42,074 39% 18,944 13,522 40% Free Cash Flow $72,664 $57,262 27% $157,560 $174,848 -10% 15
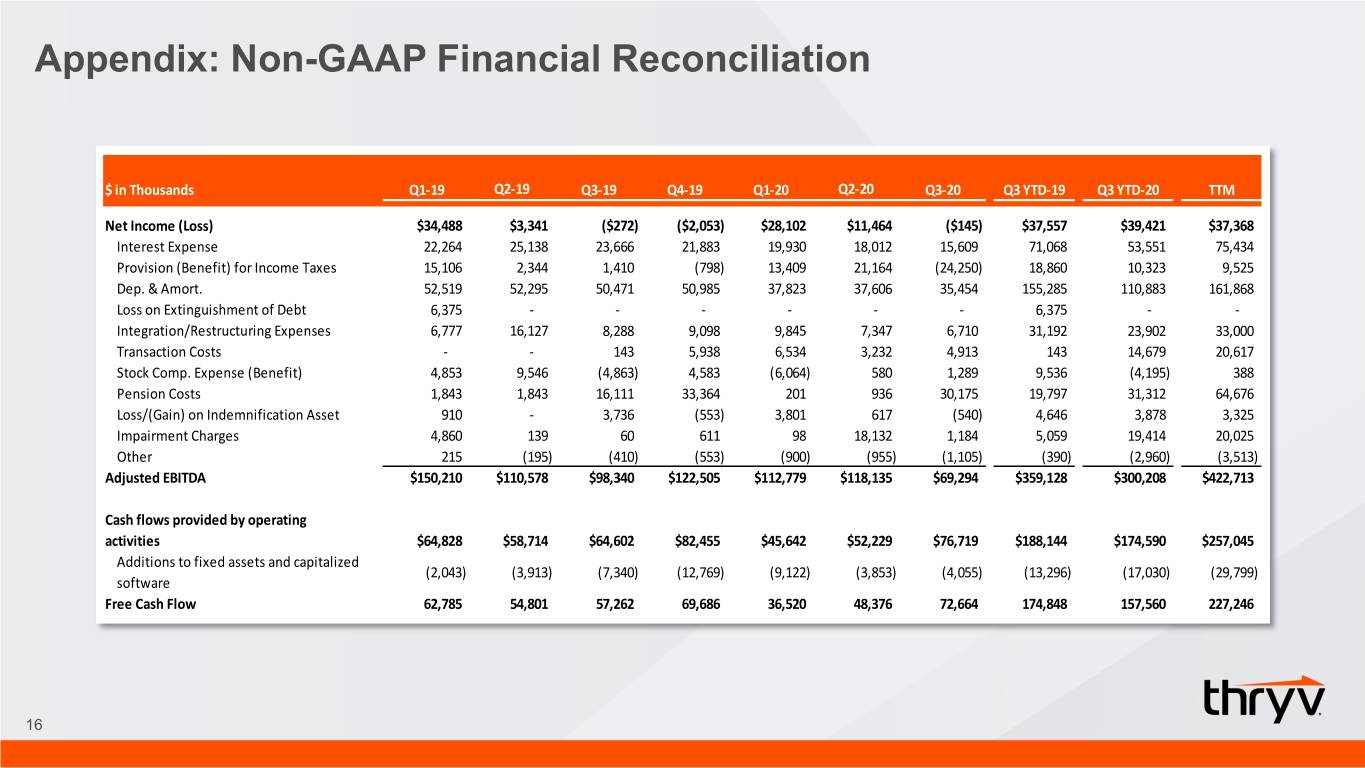
Appendix: Non-GAAP Financial Reconciliation $ in Thousands Q1-19 Q2-19 Q3-19 Q4-19 Q1-20 Q2-20 Q3-20 Q3 YTD-19 Q3 YTD-20 TTM Net Income (Loss) $34,488 $3,341 ($272) ($2,053) $28,102 $11,464 ($145) $37,557 $39,421 $37,368 Interest Expense 22,264 25,138 23,666 21,883 19,930 18,012 15,609 71,068 53,551 75,434 Provision (Benefit) for Income Taxes 15,106 2,344 1,410 (798) 13,409 21,164 (24,250) 18,860 10,323 9,525 Dep. & Amort. 52,519 52,295 50,471 50,985 37,823 37,606 35,454 155,285 110,883 161,868 Loss on Extinguishment of Debt 6,375 - - - - - - 6,375 - - Integration/Restructuring Expenses 6,777 16,127 8,288 9,098 9,845 7,347 6,710 31,192 23,902 33,000 Transaction Costs - - 143 5,938 6,534 3,232 4,913 143 14,679 20,617 Stock Comp. Expense (Benefit) 4,853 9,546 (4,863) 4,583 (6,064) 580 1,289 9,536 (4,195) 388 Pension Costs 1,843 1,843 16,111 33,364 201 936 30,175 19,797 31,312 64,676 Loss/(Gain) on Indemnification Asset 910 - 3,736 (553) 3,801 617 (540) 4,646 3,878 3,325 Impairment Charges 4,860 139 60 611 98 18,132 1,184 5,059 19,414 20,025 Other 215 (195) (410) (553) (900) (955) (1,105) (390) (2,960) (3,513) Adjusted EBITDA $150,210 $110,578 $98,340 $122,505 $112,779 $118,135 $69,294 $359,128 $300,208 $422,713 Cash flows provided by operating activities $64,828 $58,714 $64,602 $82,455 $45,642 $52,229 $76,719 $188,144 $174,590 $257,045 Additions to fixed assets and capitalized (2,043) (3,913) (7,340) (12,769) (9,122) (3,853) (4,055) (13,296) (17,030) (29,799) software Free Cash Flow 62,785 54,801 57,262 69,686 36,520 48,376 72,664 174,848 157,560 227,246 16
