Attached files
| file | filename |
|---|---|
| 8-K - MR. COOPER GROUP INC. 8-K - Mr. Cooper Group Inc. | a52325710.htm |
Exhibit 99.1
November 12, 2020 Investor Update

IMPORTANT INFORMATION This presentation contains summarized information concerning Mr. Cooper Group
Inc. (“Mr. Cooper” or the “Company”) and the Company’s business, operations, financial performance and trends. No representation is made that the information in this presentation is complete. For additional financial, statistical and business
related information, as well as information regarding business and segment trends, see the Company’s most recent Annual Report on Form 10-K (“Form 10-K”) and Quarterly Reports on Form 10-Q filed with the U.S. Securities and Exchange
Commission (the “SEC”), as well other reports filed with the SEC from time to time. Such reports are or will be available in the Investors section of the Company’s website (www.mrcoopergroup.com) and the SEC’s website (www.sec.gov).Forward
Looking Statements. This presentation contains forward-looking statements within the meaning of the Private Securities Litigation Reform Act of 1995, including statements regarding refinancing opportunities, portfolio growth and a rebound in
servicing margins. All statements other than statements of historical or current fact included in this presentation that address activities, events, conditions or developments that we expect, believe or anticipate will or may occur in the
future are forward-looking statements. Forward-looking statements give our current expectations and projections relating to our financial condition, results of operations, plans, objectives, future performance and business and these
statements are not guarantees of future performance. Forward-looking statements may include the words “anticipate,” “estimate,” “expect,” “project,” “intend,” “plan,” “believe,” “strategy,” “future,” “opportunity,” “may,” “should,” “will,”
“would,” “will be,” “will continue,” “will likely result,” and similar expressions. Such forward-looking statements involve risks and uncertainties that may cause actual events, results or performance to differ materially from those indicated
by such statements, including the severity and duration of the COVID-19 pandemic; the pandemic’s impact on the U.S. and the global economies; federal, state, and local government responses to the pandemic; borrower forbearance rates and
availability of financing. Certain of these risks are identified and discussed in documents Mr. Cooper has filed or will file from time to time with the SEC. These risk factors will be important to consider in determining future results and
should be reviewed in their entirety. These forward-looking statements are expressed in good faith, and Mr. Cooper believes there is a reasonable basis for them. However, the events, results or trends identified in these forward-looking
statements may not occur or be achieved. Forward-looking statements speak only as of the date they are made, and Mr. Cooper is not under any obligation, and expressly disclaims any obligation, to update, alter or otherwise revise any
forward-looking statement, except as required by law. Readers should carefully review the statements set forth in the reports that Mr. Cooper has filed or will file from time to time with the SEC.Non-GAAP Measures. This presentation contains
certain references to non-GAAP measures. Please refer to the Appendix for more information on non-GAAP measures.
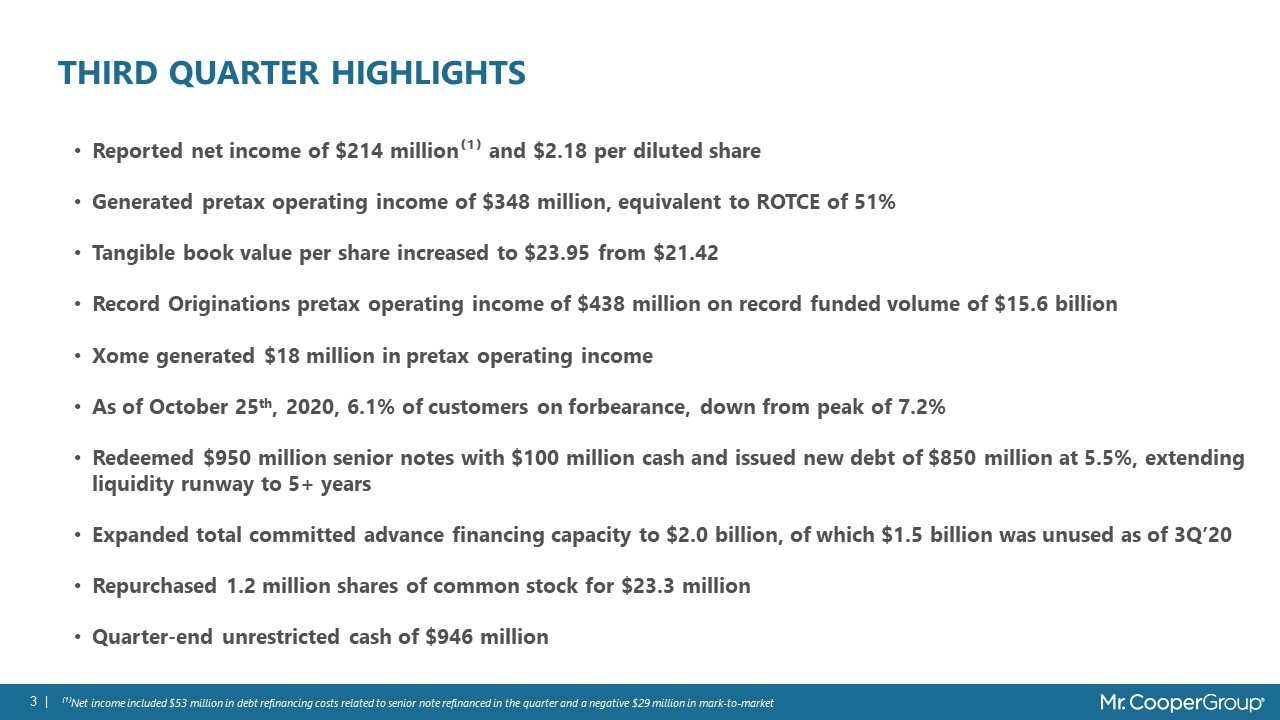
Third quarter highlights Reported net income of $214 million⁽¹⁾ and $2.18 per diluted shareGenerated
pretax operating income of $348 million, equivalent to ROTCE of 51%Tangible book value per share increased to $23.95 from $21.42Record Originations pretax operating income of $438 million on record funded volume of $15.6 billionXome generated
$18 million in pretax operating incomeAs of October 25th, 2020, 6.1% of customers on forbearance, down from peak of 7.2%Redeemed $950 million senior notes with $100 million cash and issued new debt of $850 million at 5.5%, extending liquidity
runway to 5+ yearsExpanded total committed advance financing capacity to $2.0 billion, of which $1.5 billion was unused as of 3Q’20Repurchased 1.2 million shares of common stock for $23.3 millionQuarter-end unrestricted cash of $946
million ⁽¹⁾Net income included $53 million in debt refinancing costs related to senior note refinanced in the quarter and a negative $29 million in mark-to-market

CULTURAL TRANSFORMATION Certified Great Place To Work® for the 2nd year in a row, in both the U.S. and
IndiaSurvey participation rate of 88%, and 87% of team members described Mr. Cooper as a great place to workReceived the 2020 MBA Diversity and Inclusion Residential Leadership AwardAdded 1,120 new employees USA INDIA

OUTCOMES Lower Unit Costs Faster Cycle Times Improved Customer Engagement Improved Team
Member Experience DIGITAL TRANSFORMATION Back Office ToolsDrive greater fulfillment efficiency BEST-FIT BENEFITS ENGINEProvides best refi options for customers from 1000s of product and pricing permutations AUTONOMOUS VIRTUAL
ASSISTANTSFaster Originations fulfillment through machine connectivity with vendor feeds ONE-CLICK DISCLOSURES MGMTProvides best-in-class customer experience FLASHAutomated identification of micro-tasks to drive lower Originations costs,
faster cycle times SMART PRICINGCorrespondent pricing engine maximizes margins using proprietary customer/product elasticity estimates ICENext-generation optical scanning speeds portfolio onboarding and claims resolution Sales DeskDrives
higher lead-lock conversions by providing Home Advisor agents with multiple customer options iAssist Proprietary servicing platform provides superior experience for customer service reps Middle Office Tools Equip agents to handle customer
needs Payments, Escrow, Loan Mods, Forbearance Home Intelligence® MortgageTune-Up Loan Tracker Front-End Tools Engage/educate customers with best-in-class digital tools
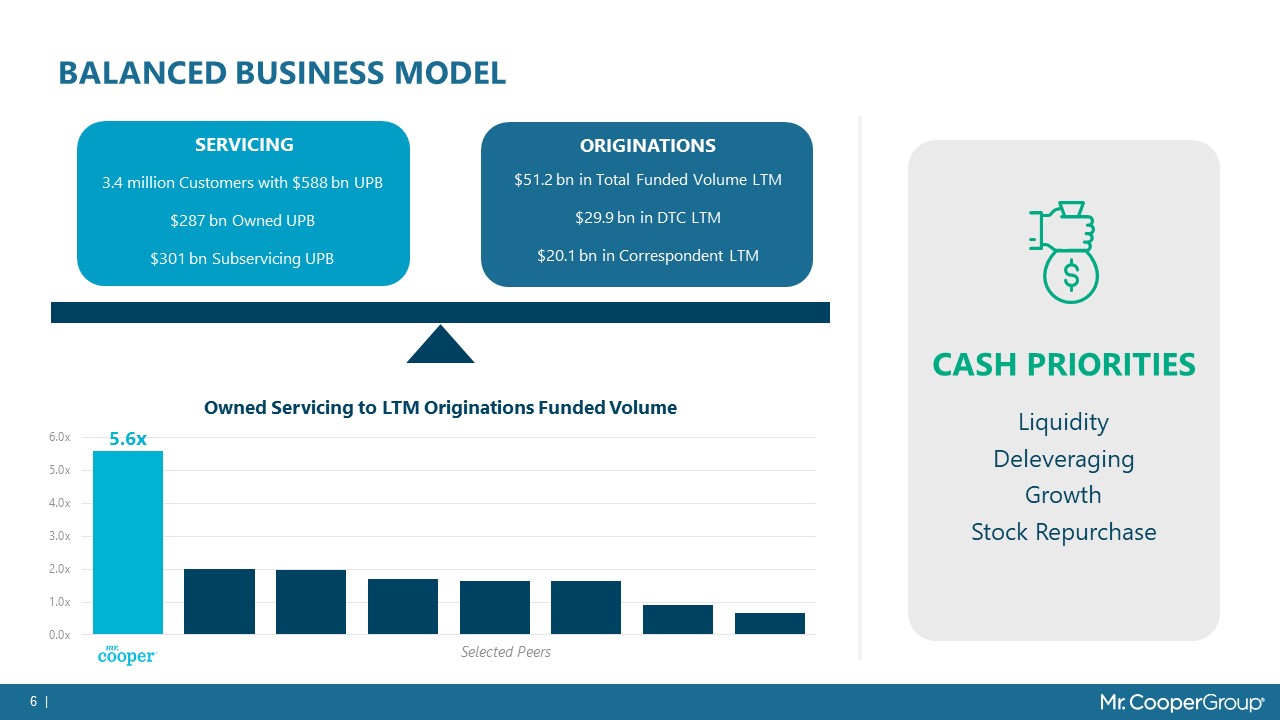
BALANCED BUSINESs MODEL CASH PRIORITIESLiquidityDeleveragingGrowthStock
Repurchase SERVICING ORIGINATIONS 3.4 million Customers with $588 bn UPB$287 bn Owned UPB$301 bn Subservicing UPB $51.2 bn in Total Funded Volume LTM$29.9 bn in DTC LTM$20.1 bn in Correspondent LTM Owned Servicing to LTM
Originations Funded Volume

SUMMARY 3Q’20 FINANCIAL RESULTS ⁽³⁾ Assumes GAAP tax-rate of 24.2% and does not give credit to cash
flow benefits of the DTA⁽⁴⁾ Per share data calculated based on net income (loss) attributable to common shareholders ⁽¹⁾ Please see appendix for reconciliations of non-GAAP items⁽²⁾ Other mark-to-market does not include fair value
amortization. Fair value amortization represents the additional amortization required under the fair value amortization method over the cost amortization method Excluding reversal of charges in 2Q, operating earnings grew 10% sequentiallyDTA
declined by $47 million in 3Q’20, bringing DTA to 62% of TBV from 71% in the prior quarterShare count increased to 95.0 million, net of 1.2 million buyback, due to stock price impact on equity incentives. 3Q pro forma share count sensitivity
to higher average share price:Adjustments includes $1 million in severance in ServicingOther notable items include $46 million investor settlement recoveries in Servicing Avg stock
price $25 $30 $35 $40 Sharecount 96.0 96.3 96.5 96.7

Mortgage Rate Customers in Thousands Eligible Portfolio % +50 bps 645.1 38% +25
bps 729.7 43% Current rate 819.7 48% -25 bps 910.3 53% -50 bps 995.3 58% MSR value stable at 100 bps Note: Rate/term refinance opportunity for eligible customers based on minimum savings of $200/month, equivalent to approximately
a 2-year payback. 30-year fixed mortgage rate-23 bps q/q 5-year swap rate +2 bps q/q Rate/term Refinance Opportunity At current rates, we expect the refinance opportunity to extend well into 2021 The Company reported a negative
mark-to-market of $29 mm largely driven by a decline in interest rates, offset by a $46 million preliminary estimate of revenues for loans exiting forbearanceAs of September 30, 2020 a 25-bp downward shock to rates would result in a $106
million mark-to-market charge
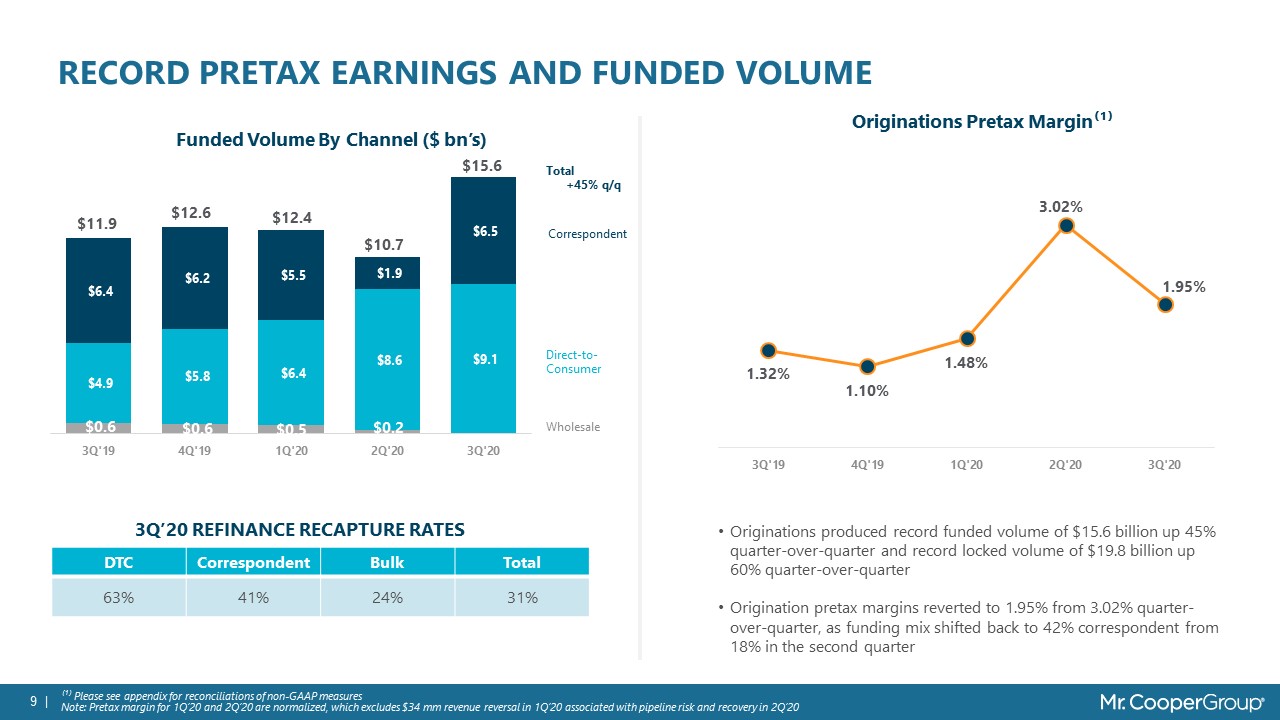
Record pretax earnings and funded volume ⁽¹⁾ Please see appendix for reconciliations of non-GAAP
measuresNote: Pretax margin for 1Q’20 and 2Q’20 are normalized, which excludes $34 mm revenue reversal in 1Q’20 associated with pipeline risk and recovery in 2Q’20 3Q’20 Refinance Recapture Rates Correspondent Direct-to-Consumer
Wholesale Originations Pretax Margin⁽¹⁾ DTC Correspondent Bulk Total 63% 41% 24% 31% Funded Volume By Channel ($ bn’s) Originations produced record funded volume of $15.6 billion up 45% quarter-over-quarter and record locked
volume of $19.8 billion up 60% quarter-over-quarterOrigination pretax margins reverted to 1.95% from 3.02% quarter-over-quarter, as funding mix shifted back to 42% correspondent from 18% in the second quarter Total +45% q/q

Total CPR GNMA PLS GSE Reverse Subservicing Portfolio Composition SERVICING PORTFOLIO
Stable Portfolio Walk ($ bn’s) The portfolio was stable in 3Q’20 as CPR spiked to 30%We expect single-digit portfolio growth in 4Q’20 on new subservicing relationship and further ramp in correspondent volumes
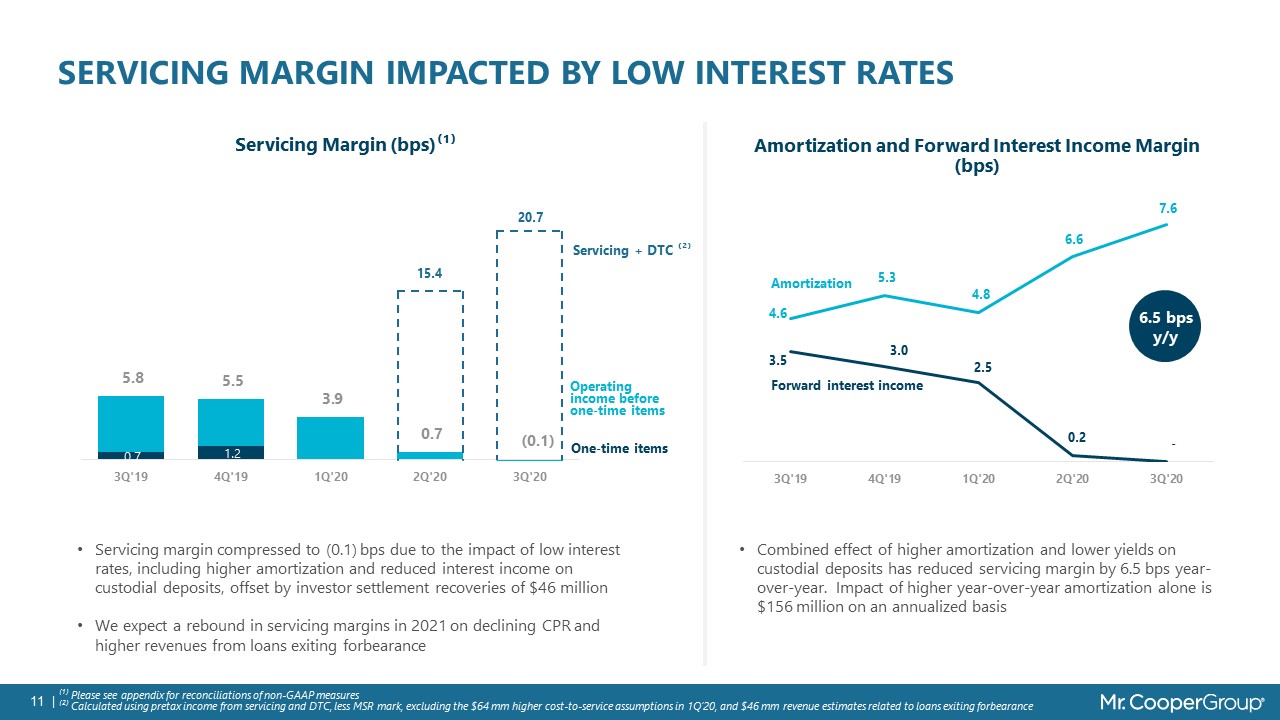
SERVICING MARGIN IMPACTED BY low interest rates ⁽¹⁾ Please see appendix for reconciliations of
non-GAAP measures⁽²⁾ Calculated using pretax income from servicing and DTC, less MSR mark, excluding the $64 mm higher cost-to-service assumptions in 1Q’20, and $46 mm revenue estimates related to loans exiting forbearance Operating income
before one-time items Servicing Margin (bps)⁽¹⁾ One-time items Amortization and Forward Interest Income Margin (bps) Amortization Forward interest income 6.5 bpsy/y Servicing + DTC ⁽²⁾ Servicing margin compressed to (0.1) bps due to
the impact of low interest rates, including higher amortization and reduced interest income on custodial deposits, offset by investor settlement recoveries of $46 millionWe expect a rebound in servicing margins in 2021 on declining CPR and
higher revenues from loans exiting forbearance Combined effect of higher amortization and lower yields on custodial deposits has reduced servicing margin by 6.5 bps year-over-year. Impact of higher year-over-year amortization alone is $156
million on an annualized basis

INNOVATIVE FORBEARANCE SOLUTIONS Easy Extend Option if availableSituation-Based Approach to selecting
post-forbearance solutionsChat with An Agent KEEPING CUSTOMERS IN THE KNOW OPTION SELECTION SIMPLIFIED Quick status and countdown–specific to customer's forbearance planPayment terms reminder, credit impact, fees impactContextual
education 78% of customers digitally engaged61% digital uptake for entry and 43% forbearance exitAs of October 25th , 2020, 6.1% of customers on forbearance, down from peak of 7.2%17% of customers on forbearance are current

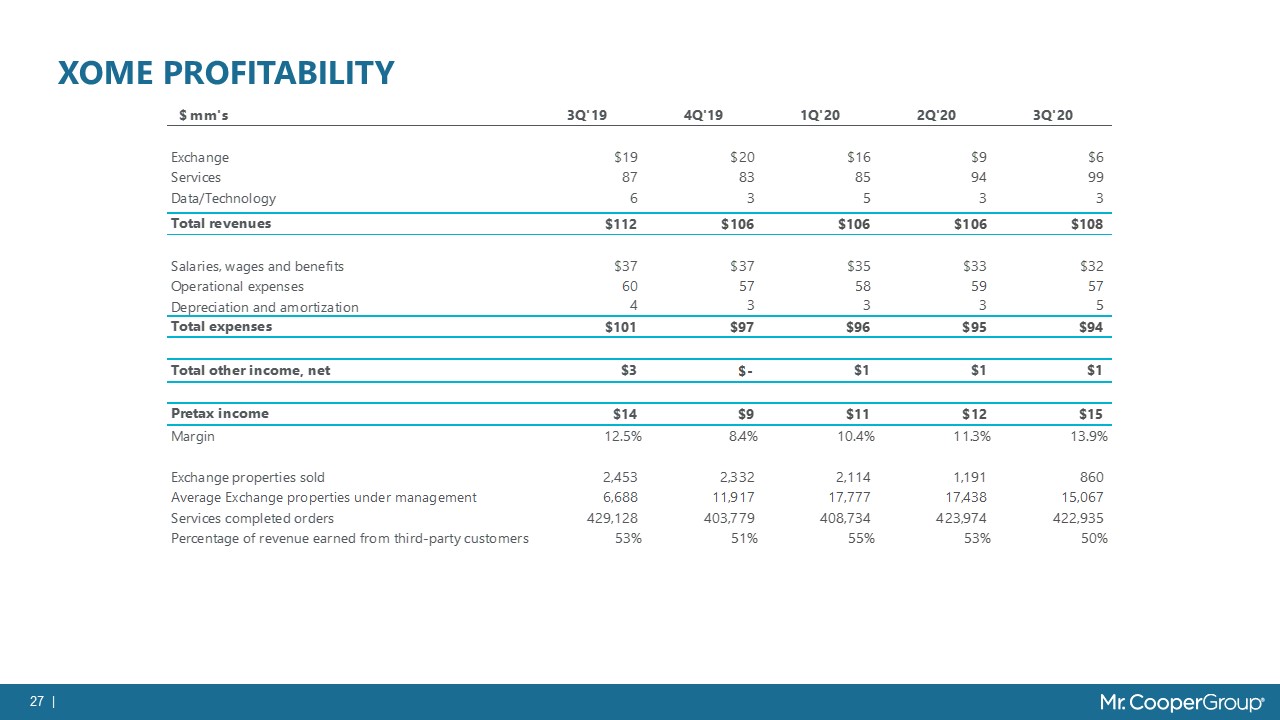
XOME Continues to benefit from strong title results ⁽¹⁾ Please see appendix for reconciliations of
non-GAAP measures Operating Profitability ($ mm’s)⁽¹⁾ Services Completed Orders Xome benefitted from strong results in title, reflecting high refinance-related orders, and a one-time $2 million settlement with an insurance
carrier Third-party revenue percentage decreased from 53% to 50% quarter-over-quarter
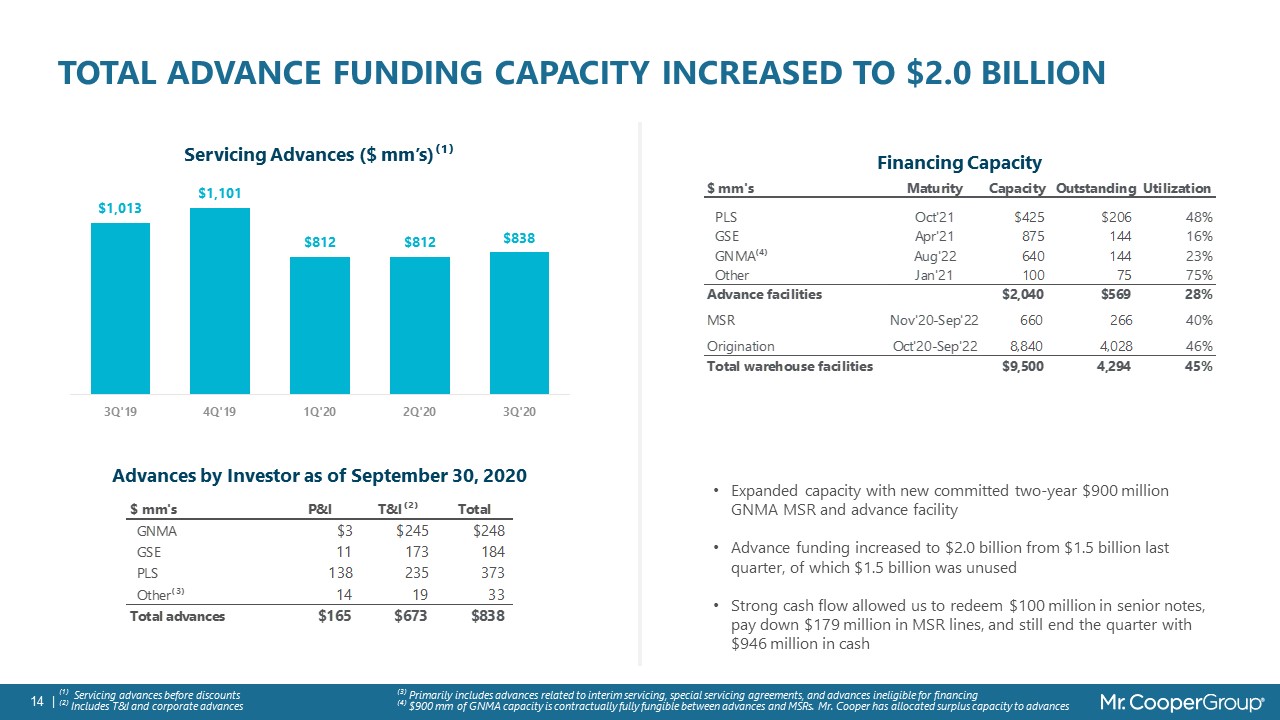
Total Advance Funding Capacity increased to $2.0 billion ⁽¹⁾ Servicing advances before discounts⁽²⁾
Includes T&I and corporate advances Advances by Investor as of September 30, 2020 Financing Capacity Expanded capacity with new committed two-year $900 million GNMA MSR and advance facilityAdvance funding increased to $2.0 billion from
$1.5 billion last quarter, of which $1.5 billion was unusedStrong cash flow allowed us to redeem $100 million in senior notes, pay down $179 million in MSR lines, and still end the quarter with $946 million in cash ⁽³⁾ Primarily includes
advances related to interim servicing, special servicing agreements, and advances ineligible for financing⁽⁴⁾ $900 mm of GNMA capacity is contractually fully fungible between advances and MSRs. Mr. Cooper has allocated surplus capacity to
advances

Steady Progress in Deleveraging Tangible Net Worth/Assets 15%+ Target Debt/Tangible Net
Worth⁽¹⁾ Loans subject to repurchase from GNMA increased from $1.2 bn to $5.4 bn in the quarter primarily due to forbearance plans, resulting in a -2.5% impact to the capital ratioStock repurchase impacted the capital ratio by -0.1% On the
basis of the debt:tangible net worth ratio, the Company is almost back to where it operated prior to the WMIH merger WMIH merger ⁽¹⁾ Debt includes unsecured senior note principal, MSR line draws, and operating lease liabilities
12.6% Incremental loans subject to repurchase from GNMA

Appendix

SEGMENT OPERATING INCOME AND NON-GAAP RECONCILIATION ⁽¹⁾ Amount represents the additional amortization
required under the fair value amortization method over the cost amortization method

TANGIBLE BOOK VALUE (TBV) And TNW/ASSETS RECONCILIATION ⁽¹⁾ Tangible assets excludes goodwill and
intangible assets ⁽²⁾ Based on TBV divided by Tangible assets

ROTCE RECONCILIATION ⁽¹⁾Assumes GAAP tax-rate of 24.2% and does not give credit to cash flow benefits
of the DTA ROTCE is a non-GAAP financial measure that is computed by dividing annualized earnings by average tangible common equity. Tangible common equity equals total stockholders’ equity less goodwill and intangible assets. The
methodology of determining tangible common equity may differ among companies. Management believes that ROTCE is a useful financial measure because it measures the performance of a business consistently and enables investors and others to
assess the Company’s use of equity. We are unable to provide a reconciliation of the forward-looking non-GAAP financial measure to its most directly comparable GAAP financial measure because we are unable to provide, without unreasonable
effort, a meaningful or accurate calculation or estimate of amounts that would be necessary for the reconciliation due to the complexity and inherent difficulty in forecasting and quantifying future amounts or when they may occur. Such
unavailable information could be significant to future results.

SERVICING NON-GAAP RECONCILIATION

SERVICING PROFITABILITY
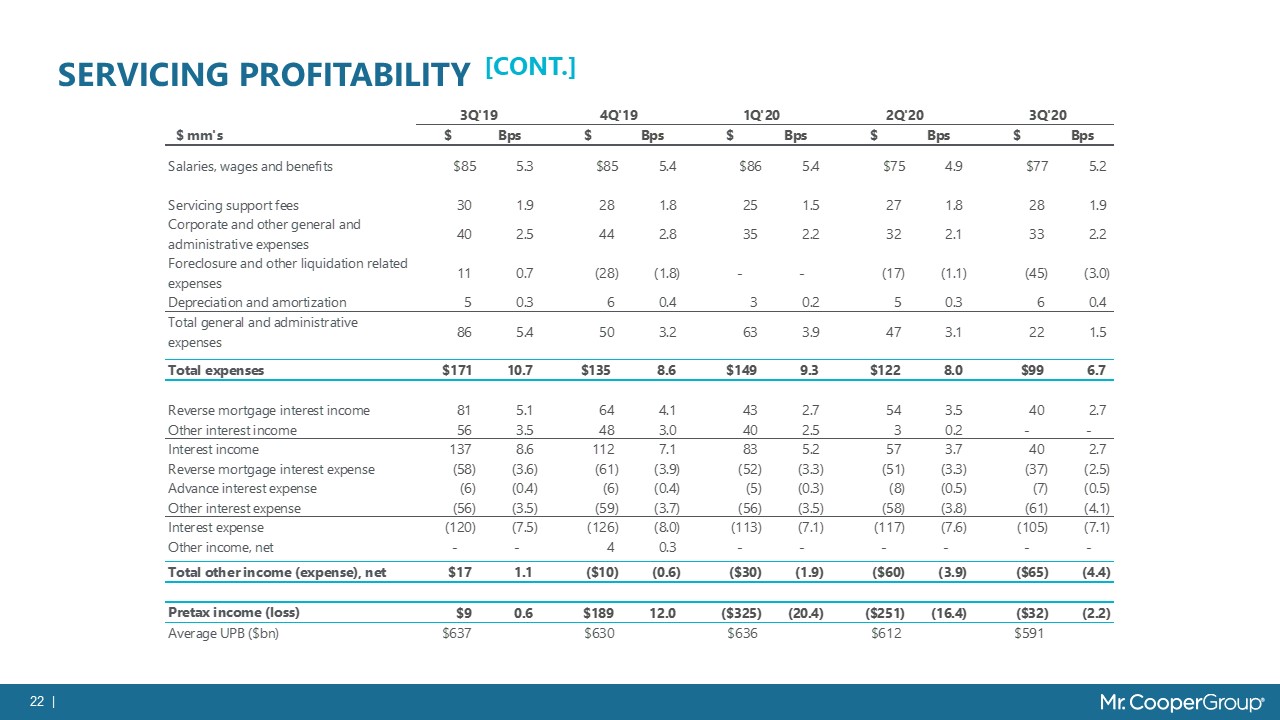
SERVICING PROFITABILITY [cont.]
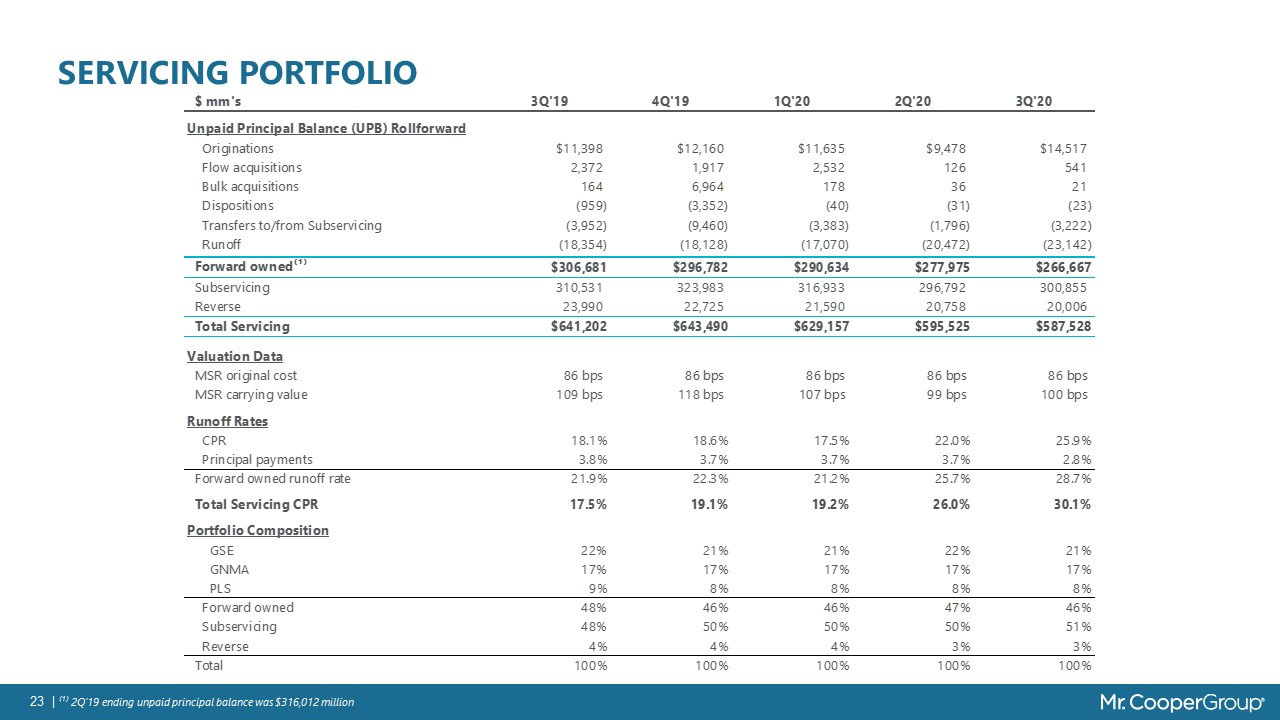
SERVICING PORTFOLIO ⁽¹⁾ 2Q’19 ending unpaid principal balance was $316,012 million

ORIGINATIONS PROFITABILITY ⁽¹⁾ Calculated on pull through adjusted lock volume as revenue is
recognized at the time of loan lock
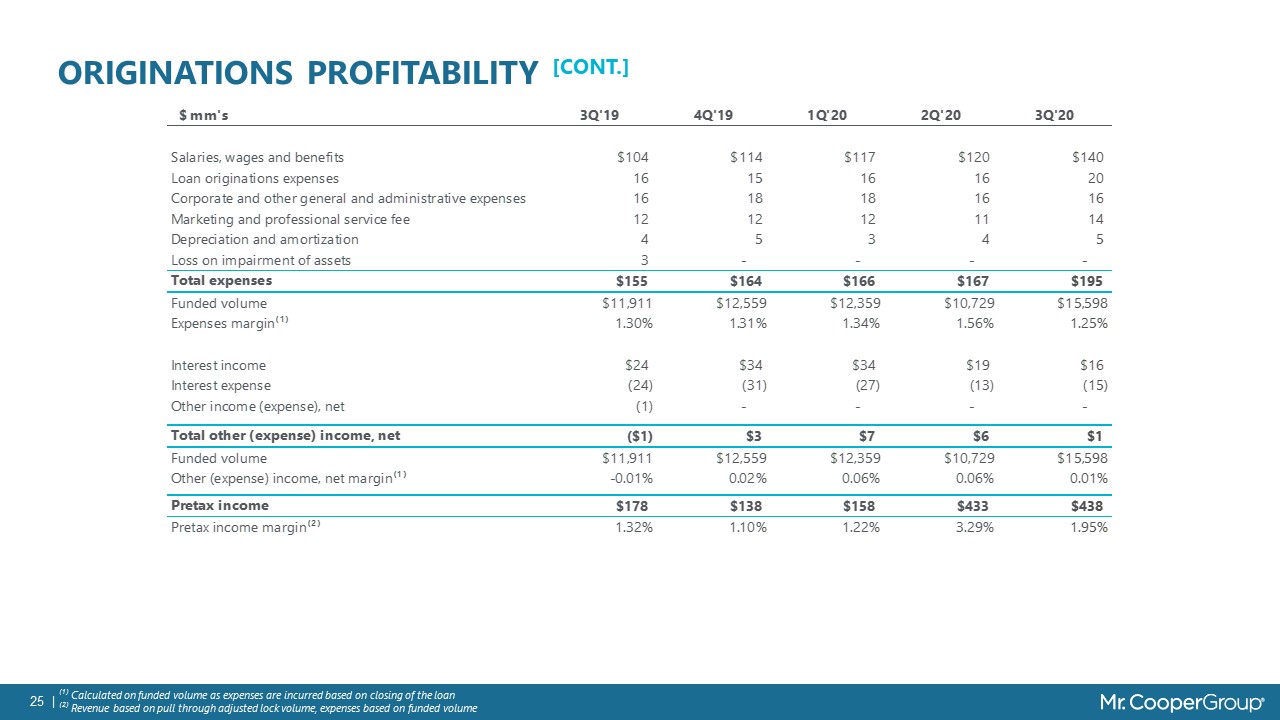
ORIGINATIONS PROFITABILITY [cont.] ⁽¹⁾ Calculated on funded volume as expenses are incurred based on
closing of the loan⁽²⁾ Revenue based on pull through adjusted lock volume, expenses based on funded volume

XOME NON-GAAP RECONCILIATION
XOME PROFITABILITY
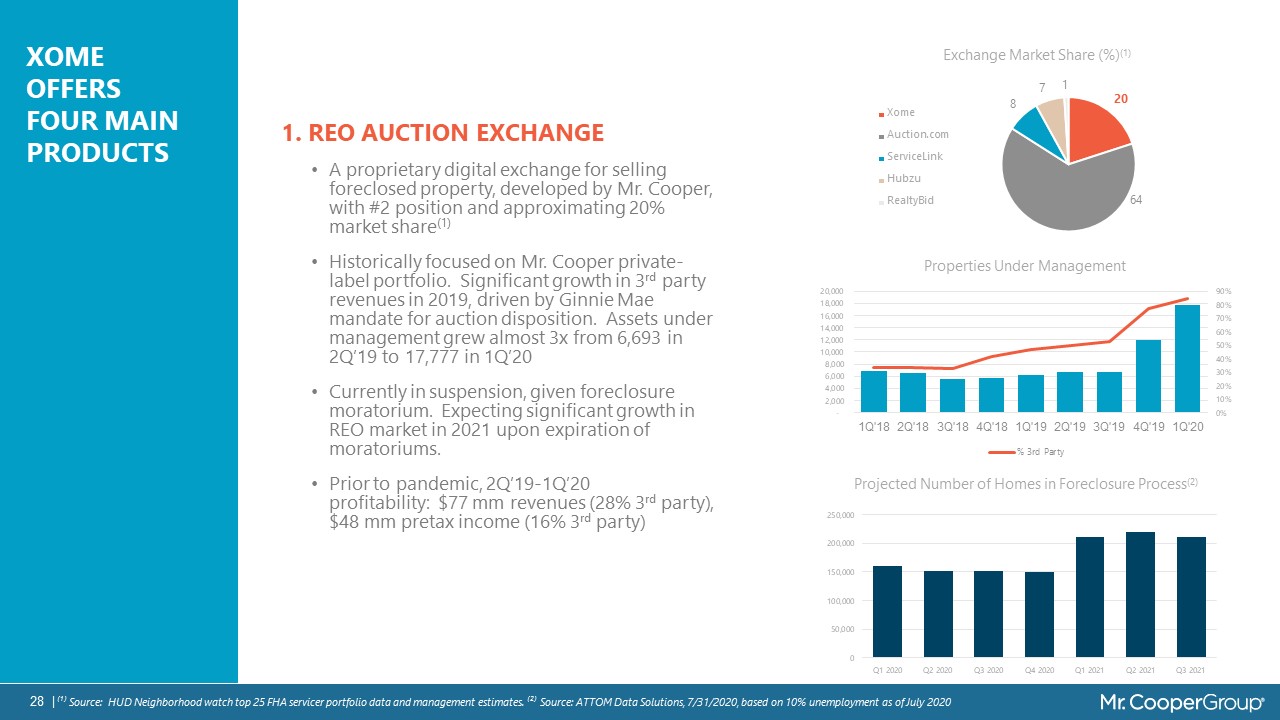
28 | ⁽¹⁾ Source: HUD Neighborhood watch top 25 FHA servicer portfolio data and management
estimates. ⁽²⁾ Source: ATTOM Data Solutions, 7/31/2020, based on 10% unemployment as of July 2020 XOME OFFERS FOUR MAIN PRODUCTS 1. REO AUCTION EXCHANGE A proprietary digital exchange for selling foreclosed property, developed by Mr.
Cooper, with #2 position and approximating 20% market share(1)Historically focused on Mr. Cooper private-label portfolio. Significant growth in 3rd party revenues in 2019, driven by Ginnie Mae mandate for auction disposition. Assets under
management grew almost 3x from 6,693 in 2Q’19 to 17,777 in 1Q’20Currently in suspension, given foreclosure moratorium. Expecting significant growth in REO market in 2021 upon expiration of moratoriums.Prior to pandemic, 2Q’19-1Q’20
profitability: $77 mm revenues (28% 3rd party), $48 mm pretax income (16% 3rd party) Projected Number of Homes in Foreclosure Process(2)

29 | ⁽¹⁾ Xome owns a 49% stake in X1 Analytics XOME PRODUCTS (CONT.) 2. TITLE 365 Leading
national tech-enabled platform with an estimated 8% market share among agentsOffers an extensive product suite including origination, home equity, and default with centralized title production, with 699,399 closed orders YTD 2020 Title
insurance workflow enhanced via X1 Analytics proprietary automated title data and decision engine(1)Title 365’s mobile signing service connects 5,000 qualified notaries with a nationwide network of lenders, title companies and settlement
service providers2020 profitability estimates: $200-215 mm revenues (54% 3rd party), $60-65 mm pretax income (56% 3rd party) 4. VALUATIONS Provides origination and default valuation servicesWallet share expansion focus for Title and REO
exchange Service business which inspects and maintains delinquent and foreclosed properties through a nationwide network of over 1k independent contractors (one of the largest in the industry)3rd party customer acquisition and retention
primarily for REO exchange 3. FIELD SERVICES

ADJUSTED EBITDA ⁽¹⁾ Adjusted EBITDA calculated consistent with the definition in the corporate
indentures for senior unsecured notes maturing in 2026, 2027, and 2028. 3Q’20 includes $1 million in severance charges in Servicing and $53 million loss on redemption of unsecured senior notes

3Q’20 SOURCES AND USES CASH FLOW ⁽¹⁾ Based on marginal tax rate of 3.2%, net of federal benefit.
Actual tax payments/refunds included in total working capital changes.⁽²⁾ Includes mortgage loans originated, sold or repurchased, net gains on mortgage loans held for sale excluding capitalized servicing rights, reverse mortgage interests,
interest income on reverse mortgage loans, and HECM and participating interest activities, repayment of nonrecourse debt – legacy assets, and changes in warehouse facilities, advance facilities, advances and other receivables, other assets,
payables and other liabilities, taxes, and other activities⁽³⁾ Required investment to sustain the net MSR is based on sum of ($212) mm forward MSR amortization, $96 mm excess spread accretion, and ($25) mm fair value amortization