Attached files
| file | filename |
|---|---|
| 8-K - 8-K - Lemonade, Inc. | lmda-20201110.htm |

Shareholder Letter Q3 2020

2

Dear Shareholders, The third quarter saw continued good news for Lemonade. Despite concern that the pandemic might disrupt migratory patterns, and with them our seasonably strongest quarter, Q3 saw stronger growth than we originally anticipated and sustained improvements across our unit economics. In force premium doubled year-on-year, while gross profit increased 83%, adjusted gross profit grew 138%, and net loss - per dollar of gross earned premium - halved. Changes in GAAP Revenue Q3 2020 was the first quarter since our change to proportional reinsurance, and so GAAP revenue deserves special attention. While our July 1, 2020 reinsurance contracts deliver a significant improvement in the fundamentals of our business, they also result in a significant change in GAAP revenue, as GAAP excludes all ceded premiums (and proportional reinsurance is fundamentally about ceding premium). This led to a spike in GAAP gross margin and a dip in GAAP revenue on July 1 - even though no corresponding change in the scope or profitability of our business took place at midnight on June 30. As the following chart indicates, GAAP metrics change considerably depending on the structure of reinsurance, while our non-GAAP KPIs do not. 3

CAT The third quarter saw many regions of the US hit by natural catastrophes at an unprecedented level. Wildfire season started early, and the Q3 fires alone made this year California’s most-destructive fire season ever. Meanwhile, by the end of Q3, the National Hurricane Center had literally used up all the letters of the alphabet in naming storms and had to start over, this time with the Greek alphabet. That has only happened once before, and never so early in the season. The confluence of these major ‘CAT’ events hitting the most populous states - and home to a majority of Lemonade’s customers - offers a solid case study of Lemonade’s command of underwriting. All told, our gross loss ratio improved from the 78% we reported in Q3 2019, to 72% in Q3 this year. From all of the events of the quarter, CAT losses accounted for only 6% of that 72%. To put that into perspective, the industry is forecasting approximately $10 billion in homeowners CAT losses this quarter, and if our underwriting was average, based on our market share, we 4
could have expected losses of $17 million or more. Our actual losses were roughly 75% lower than our pro rata share. Our loss ratio this quarter is testament to our cautious approach to underwriting in wildfire zones and in hurricane prone parts of the country. As Warren Buffet said, “It’s only when the tide goes out that you learn who has been swimming naked.” Well, when tail risks materialize - as they did in Q3 - it becomes clear who has been financing their growth by loading up on risky policies, and who has grown responsibly. Indeed, we have historically declined considerably more homeowners business than we have written. As a result, even in a quarter with industry losses of epic proportions, the Lemonade loss ratio is in great shape. Lifetime Value: Graduation & Dollar Retention Beyond our published KPIs, we saw continued improvement in other important facets of our business. Even as our total book of business doubled year on year, the IFP generated by Lemonade renters ‘graduating’ to become Lemonade homeowners, grew by over 300% in Q3 2020 as compared to Q3 2019. This trend suggests that a central plank in our strategy is playing out: acquiring renters at a time and a cost that incumbents struggle to, then delighting them so that as their insurance needs grow - they grow with us. Indeed, as of Q3, 12% of our condo customers are graduates. On average, the premium per customer for graduates sextupled to almost $900 upon graduation. Another way to look at it is to say that we acquired the initial premium of about $150 at a profitable Customer Acquisition Cost (CAC), and acquired the incremental $750 at a CAC of zero. 5

Beyond graduation, the steady gains we’ve seen in lifetime value were further boosted by the cross-sells enabled by our launch of pet health insurance. Pet Launching early in Q3, our pet health insurance got off to a strong start. We’ve seen compelling cross-sell dynamics, where incremental pet premiums come without corresponding incremental spend. The effect is significant: the median premiums for customers who added a pet policy jumped by almost 4X. This has boosted our dollar retention, while further improving our Lifetime Value (LTV) to CAC ratio. As LTV/CAC increases, so does our readiness to spend more on customer acquisition, confident that these investments will yield outsized returns in the years to come. In addition to increasing LTV of existing customers, pet health insurance also introduced an additional onramp to the Lemonade experience. Indeed, about 40% of our policies were sold to new customers, and about 5% of them have already added a renters or homeowners policy to their new pet policy. In fact, sales of pet policies to newcomers delivered about 9X more IFP than we generated from renters insurance in the three months following its launch four years ago, and at a rate of marketing efficiency that took our renters product three years to achieve. We anticipate pet accounting for roughly 5% of our book of business by year-end 2020, just six months after launch. 6

Our experience with pet boosts our conviction in the long-term strategy outlined in our S-1: “Lemonade's cocktail of delightful experience, aligned values, and great prices enjoys broad appeal, while over-indexing on younger and first time buyers of insurance. As these customers progress through predictable lifecycle events, their insurance needs normally grow to encompass more and higher-value products: renters regularly acquire more property and frequently upgrade to successively larger homes; home buying often coincides with a growing household and a corresponding need for life or pet insurance, and so forth. These progressions can trigger orders-of-magnitude jumps in insurance premiums.” 7

Q3 2020 KPIs and Non-GAAP Financial Measures In Force Premium (IFP) IFP, defined as the aggregate annualized premium for customers as of the period end date, increased by 99% to $188.9 million as compared to the third quarter of 2019, primarily due to a 67% increase in the number of customers, as well as a 19% increase in premium per customer. Customers Total customer count increased by 67% to 941,313 as compared to the third quarter of 2019. Premium per Customer Premium per customer, defined as in force premium divided by number of customers, was $201 at the end of the third quarter, up 19% from the third quarter of 2019, primarily due to a continued shift of product mix toward higher value homeowner policies, the introduction - with Pet insurance - of multiple policies per customer, as well as growth in the overall average policy value. Gross Earned Premium Third quarter gross earned premium of $42.9 million increased $21.9 million or 104% as compared to the third quarter of 2019, primarily due to the increase of in force premium earned during the quarter. 8

Revenue Third quarter total revenue was $17.8 million. Note that our ‘proportional reinsurance’ agreements went into effect at the beginning of the quarter, increasing the proportion of premium that is ceded. This meaningfully improves the capital efficiency of our business, but can make year-on-year or quarter-on-quarter comparisons of revenue misleading. Gross Profit Third quarter gross profit of $7.3 million increased $3.3 million or 83% as compared to the third quarter of 2019, primarily due to the increase in gross earned premium and a lower net loss ratio relative to Q3 2019, partially offset by the lower effective interest rate impact on investment income. Adjusted Gross Profit Third quarter adjusted gross profit of $9.3 million increased $5.4 million or 138% as compared to the third quarter of 2019, primarily due to the increase in gross earned premium, and a lower net loss ratio relative to Q3 2019. Adjusted Gross Profit is a non-GAAP metric. Reconciliations of GAAP to non-GAAP financial measures, as well as definitions for the non-GAAP financial measures included in this letter and the reasons for their use, are presented at the end of this letter. Operating Expense Total operating expense, excluding net loss and loss adjustment expense, in Q3 increased 11% to $41.6 million as compared to the $37.4 million in the 9

third quarter of 2019, driven primarily by increases in other insurance expense, technology development, and general and administrative expense due to personnel and customer growth, and greater public company expenses, partially offset by lower sales and marketing expense. Net Loss Net loss of $30.9 million ($0.57 per share) for the third quarter improved as compared to net loss of $31.1 million ($2.78 per share) in the third quarter of 2019, as the reduction in revenue driven by our reinsurance structure transition was offset by operating expense efficiencies. Adjusted EBITDA Adjusted EBITDA loss of $27.6 million improved by $2.8 million or 9% as compared to the third quarter of 2019, primarily due to operating expense efficiencies. Adjusted EBITDA is a non-GAAP metric. Reconciliations of GAAP to non-GAAP financial measures, as well as definitions for the non-GAAP financial measures included in this letter and the reasons for their use, are presented at the end of this letter. Cash The Company’s cash, cash equivalents, and investments totaled $597.4 million at September 30, 2020 as compared to $330.9 million as of December 31, 2019, primarily reflecting the net proceeds from the initial public offering of $335.0 million, partially offset by $71.0 million of cash used in operations. As of September 30, 2020, approximately $107.6 million in cash, cash equivalents, and investments, was held in accounts owned by our US and 10

Dutch insurance company subsidiaries, and our Dutch insurance holding company, which are restricted by statute as to the amount of dividends they may pay without the prior approval of their respective regulatory authorities. Approximately $86.2 million of this balance is reserve capital held in support of insurance operations. Key Operating and Financial Metrics Q4 2020 Guidance & Notables Life Insurance Sometimes launching a product is the best market research Life insurance is outside of the bounds of 'Property & Casualty’ insurance, yet we plan to breach this categorical boundary and test a life insurance product sometime in the next 90 days. Being customer centric means prioritizing product launches based on customer needs, rather than regulatory 11

frameworks. To this end, we have established the Lemonade Life Insurance Agency, and expect to bring the Lemonade experience to the term life market soon. Teams we respect at other tech-enabled insurance companies have at times struggled to make the economics of digital acquisition work with term life policies, and we offer no assurances that we will fare any better. We are placing a bet on term life, then, not because we have high conviction it will be a winner, but because its expected value is high: the ante is modest, the odds are fair, and the prize is big. ● The ante is modest because we will not be underwriting term life policies ourselves, and we will be leveraging the technologies, customers, and brand we’ve already paid for. ● The odds are fair because the same ‘me to we’ lifecycle events that trigger a graduation from renting to homeownership are often triggers for buying one's first life insurance policy too. The average age for buying a first home is about 33 in the US, which is also about the average age that college grads have their first child, and is also about the average age of Lemonade’s customers. ● The prize is big because the global term life insurance market stands at about $800 billion this year, and is expected to grow more than 10% CAGR to over $2 trillion by the end of the decade (see "Term Life Insurance Global Market Opportunities and Strategies to 2030"). As we wrote in our Founders’ Letter: “We prefer to make decisions under conditions of uncertainty, and to abandon bad bets as soon as the data reveal them to be so. That translates 12

into greater volatility, but also to better aggregate returns. It’s a trade we are comfortable making.” Our foray into term life insurance is a good case in point. Hey France, nous y voilà! We plan to launch Lemonade in France in Q4. Our French offering has been crafted specifically for the French customer, but will also embody what’s loved by Lemonade customers elsewhere: a simple and delightful experience powered by artificial intelligence, instant claims, and the ability to support local and global charities through the company’s annual Giveback. Additionally, and similar to the German and Dutch products, the French product will have the added benefit of being based on the company’s Policy 2.0, a new kind of insurance policy made for the 21st century. Policy 2.0 is a brief, easy to understand, and transparent insurance document designed for ordinary people (and not lawyers) - a consumer-friendly departure from the dense and dated policies that dominate the market. While we are steadily enlarging our European footprint, it should be noted that our investments are lopsided in the direction of the US by design, and will remain that way for the next while. We expect our European business to continue to grow, but so long as the marginal dollar spent in the US delivers outsized returns relative to the EU, we will allocate our capital accordingly. We’ll revisit this calculus periodically, and anticipate it may shift in years to come when our product offering and market share in the US mature. 13

Guidance for Fourth Quarter 2020 We expect: ● In force premium at December 31 of $200 - $205 million ● Gross earned premium of $46 - $48 million ● Revenue of $18 - $19 million ● Adjusted EBITDA loss of ($34) - ($32) million ● Stock-based compensation expense of approximately $3 million ● Capital expenditures of approximately $1 million Guidance for Full Year 2020 We expect: ● In force premium at December 31 of $200 - $205 million ● Gross earned premium of $154 - $157 million ● Revenue of $91 - $93 million ● Adjusted EBITDA loss of ($103) - ($100) million ● Stock-based compensation expense of approximately $11 million ● Capital expenditures of approximately $4 million 14

A full reconciliation of Adjusted EBITDA guidance to net loss on a forward-looking basis cannot be provided without unreasonable efforts, as we are unable to provide reconciling information with respect to income tax expense, depreciation and amortization, interest income, net investment income, and other transactions that we consider to be unique in nature, all of which are adjustments to Adjusted EBITDA. We have provided a reconciliation of GAAP to non-GAAP financial measures for the third quarter in the reconciliation tables at the end of this letter. Non-GAAP financial measures and key operating metrics The non-GAAP financial measures used in this letter to shareholders are Adjusted Gross Profit, Ratio of Adjusted Gross Profit to Gross Earned Premium, and Adjusted EBITDA. We define Adjusted EBITDA as net loss excluding interest expense, income tax expense, depreciation, amortization, stock-based compensation, net investment income, and other transactions that we consider to be unique in nature. We exclude these items from Adjusted EBITDA because we do not consider them to be directly attributable to our underlying operating performance. We use Adjusted EBITDA as an internal performance measure in the management of our operations because we believe it gives our management and other customers of our financial information useful insight into our results of operations and our underlying business performance. Adjusted EBITDA should not be viewed as a substitute for net loss calculated in accordance with GAAP, and other companies may define adjusted EBITDA differently. We define Adjusted Gross Profit as gross profit excluding net investment income, plus fixed costs and overhead associated with our underwriting operations including employee-related costs and professional fees and other, and depreciation and amortization allocated to cost of revenue. After these adjustments, the resulting calculation is inclusive of only those variable costs of revenue incurred on the successful acquisition of business and without the 15

volatility of investment income. We use Adjusted Gross Profit as a key measure of our progress towards profitability and to consistently evaluate the variable contribution to our business from underwriting operations from period to period. We define Ratio of Adjusted Gross Profit to Gross Earned Premium as the ratio of adjusted gross profit to gross earned premium. The Ratio of Adjusted Gross Profit to Gross Earned Premium measures the relationship between the underlying business volume and gross economic benefit generated by our underwriting operations, on the one hand, and our underlying profitability trends, on the other. We rely on this measure, which supplements our gross profit ratio as calculated in accordance with GAAP, because it provides management with insight into our underlying profitability trends over time. The non-GAAP financial measures used in this letter to shareholders have not been calculated in accordance with GAAP and should be considered in addition to results prepared in accordance with GAAP and should not be considered as a substitute for, or superior to, GAAP results. In addition, Adjusted Gross Profit and Adjusted EBITDA should not be construed as indicators of our operating performance, liquidity or cash flows generated by operating, investing and financing activities, as there may be significant factors or trends that they fail to address. We caution investors that non-GAAP financial information, by its nature, departs from traditional accounting conventions. Therefore, its use can make it difficult to compare our current results with our results from other reporting periods and with the results of other companies. Our management uses these non-GAAP financial measures, in conjunction with GAAP financial measures, as an integral part of managing our business and to, among other things: (i) monitor and evaluate the performance of our business operations and financial performance; (ii) facilitate internal comparisons of the historical operating performance of our business operations; (iii) facilitate external comparisons of the results of our overall 16

business to the historical operating performance of other companies that may have different capital structures and debt levels; (iv) review and assess the operating performance of our management team; (v) analyze and evaluate financial and strategic planning decisions regarding future operating investments; and (vi) plan for and prepare future annual operating budgets and determine appropriate levels of operating investments. Investors are encouraged to review the reconciliation of these non-GAAP financial measures to their most directly comparable GAAP financial measures as provided in the tables accompanying this letter to shareholders. This letter to shareholders also includes key performance indicators, including customers, in force premium, premium per customer, gross earned premium, gross loss ratio and net loss ratio. We define customers as the number of current policyholders underwritten by us or placed by us with third-party insurance partners (who pay us recurring commissions) as of the period end date. A customer that has more than one policy counts as a single customer for the purposes of this metric. We view customers as an important metric to assess our financial performance because customer growth drives our revenue, expands brand awareness, deepens our market penetration, creates additional upsell and cross-sell opportunities and generates additional data to continue to improve the functioning of our platform. We define in force premium ("IFP") as the aggregate annualized premium for Customers as of the period end date. At each period end date, we calculate IFP as the sum of: (i) In force written premium — the annualized premium of in force policies underwritten by us; and (ii) In force placed premium — the annualized premium of in force policies placed with third party insurance companies for which we earn a recurring commission payment. In force placed premium currently reflects less than 1% of IFP. The annualized value of premiums is a legal and contractual determination made by assessing the 17

contractual terms with our customers. The annualized value of contracts is not determined by reference to historical revenues, deferred revenues or any other GAAP financial measure over any period. IFP is not a forecast of future revenues nor is it a reliable indicator of revenue expected to be earned in any given period. We believe that our calculation of IFP is useful to analysts and investors because it captures the impact of growth in Customers and Premium per Customer at the end of each reported period, without adjusting for known or projected policy updates, cancellations, rescissions and non-renewals. We use IFP because we believe it gives our management useful insight into the total reach of our platform by showing all in force policies underwritten and placed by us. Other companies, including companies in our industry, may calculate IFP differently or not at all, which reduces the usefulness of IFP as a tool for comparison. We define Premium per Customer ("PPC") as the average annualized premium customers pay for products underwritten by us or placed by us with third-party insurance partners. We calculate PPC by dividing IFP by Customers. We view PPC as an important metric to assess our financial performance because PPC reflects the average amount of money our customers spend on our products, which helps drive strategic initiatives. Gross earned premium is the earned portion of our gross written premium. We use this operating metric as we believe it gives our management and other users of our financial information useful insight into the gross economic benefit generated by our business operations and allows us to evaluate our underwriting performance without regard to changes in our underlying reinsurance structure. Unlike net earned premium, gross earned premium excludes the impact of premiums ceded to reinsurers, and therefore should not be used as a substitute for net earned premium, total revenue, or any other measure presented in accordance with GAAP. 18

We define gross loss ratio, expressed as a percentage, as the ratio of losses and loss adjustment expense to gross earned premium. We define net loss ratio, expressed as a percentage, as the ratio of losses and loss adjustment expense, less amounts ceded to reinsurers, to net earned premium. Links The information contained on, or that can be accessed through, hyperlinks included herein is deemed not to be incorporated in or part of this shareholder letter. Earnings teleconference information The Company will discuss its third quarter financial results during a teleconference on November 11, 2020, at 8:00 AM ET. The conference call can be accessed in the U.S. at (866) 270-1533 or outside the U.S. at (412) 317-0797 with the conference ID: 1014 9249. A live audio webcast of the call will also be available simultaneously at https://investor.lemonade.com Following completion of the call, a recorded replay of the webcast will be available on the investor relations section of Lemonade’s website. Additional investor information can be accessed at https://investor.lemonade.com About Lemonade Lemonade, Inc. (NYSE: LMND) offers renters, homeowners, and pet health insurance in the United States, and contents and liability insurance in 19

Germany and the Netherlands, through its full-stack insurance carriers. Powered by artificial intelligence and behavioral economics, Lemonade set out to replace brokers and bureaucracy with bots and machine learning, aiming for zero paperwork and instant everything. A Certified B-Corp, Lemonade gives unused premiums to nonprofits selected by its community, during its annual Giveback. Lemonade is currently available for most of the United States, Germany and the Netherlands, and continues to expand globally. For more information, please visit www.lemonade.com, and follow Lemonade on Twitter or Instagram. Media inquiries: press@lemonade.com Investor contact: ir@lemonade.com Safe harbor provision This letter to shareholders contains forward-looking statements within the meaning of the Private Securities Litigation Reform Act of 1995. All statements contained in this letter to shareholders that do not relate to matters of historical fact should be considered forward-looking statements, including statements regarding our anticipated financial performance, including our financial outlook for the fourth quarter of 2020 and the full year 2020, our industry, business strategy, plans, goals and expectations concerning our market position, future operations and other financial and operating information. These statements are neither promises nor guarantees, but involve known and unknown risks, uncertainties and other important factors that may cause our actual results, performance or achievements to be materially different from any future results, performance or achievements expressed or implied by the forward-looking statements, including, but not limited to, the following: our history of losses and the fact that we may not achieve or maintain profitability in the future; our ability to 20

retain and expand our customer base; the fact that the “Lemonade” brand may not become as widely known as incumbents’ brands or the brand may become tarnished; the denial of claims or our failure to accurately and timely pay claims; our ability to attain greater value from each user; the novelty of our business model and its unpredictable efficacy and susceptibility to unintended consequences; the possibility that we could be forced to modify or eliminate our Giveback, which could undermine our business model; the results of examinations by our primary state insurance regulator that could result in adverse examinations findings and necessitate remedial actions or give rise to regulatory orders requiring remedial, injunctive, or other corrective action; our limited operating history; our ability to manage our growth effectively; the impact of intense competition in the segments of the insurance industry in which we operate on our ability to attain or increase profitability; the unavailability of reinsurance at current levels and prices, which could limit our ability to write new business; our ability to renew reinsurance contracts on comparable duration and terms to those currently in effect; our exposure to counterparty risks as a result of reinsurance; the loss of personal customer information, damage to our reputation and brand, or harm to our business and operating results as a result of security incidents or real or perceived errors, failures or bugs in our systems, website or app; our actual or perceived failure to protect customer information and other data, respect customers’ privacy, or comply with data privacy and security laws and regulations; our ability to comply with extensive insurance industry regulations and the need to incur additional costs or devote additional resources to comply with changes to existing regulations; our exposure to additional regulatory requirements specific to other vertical markets that we enter or have entered, including auto, pet and life insurance, and the need to devote additional resources to comply with these regulations; and our inability to predict the lasting impacts of COVID-19 to our business in particular, and the global economy generally. These and other important factors are discussed under the caption “Risk Factors” in our Form 10-Q for the three months ended June 30, 2020 and our other filings with the SEC 21

could cause actual results to differ materially from those indicated by the forward-looking statements made in this shareholder letter. Any such forward-looking statements represent management’s beliefs as of the date of this press release. While we may elect to update such forward-looking statements at some point in the future, we disclaim any obligation to do so, even if subsequent events cause our views to change. 22
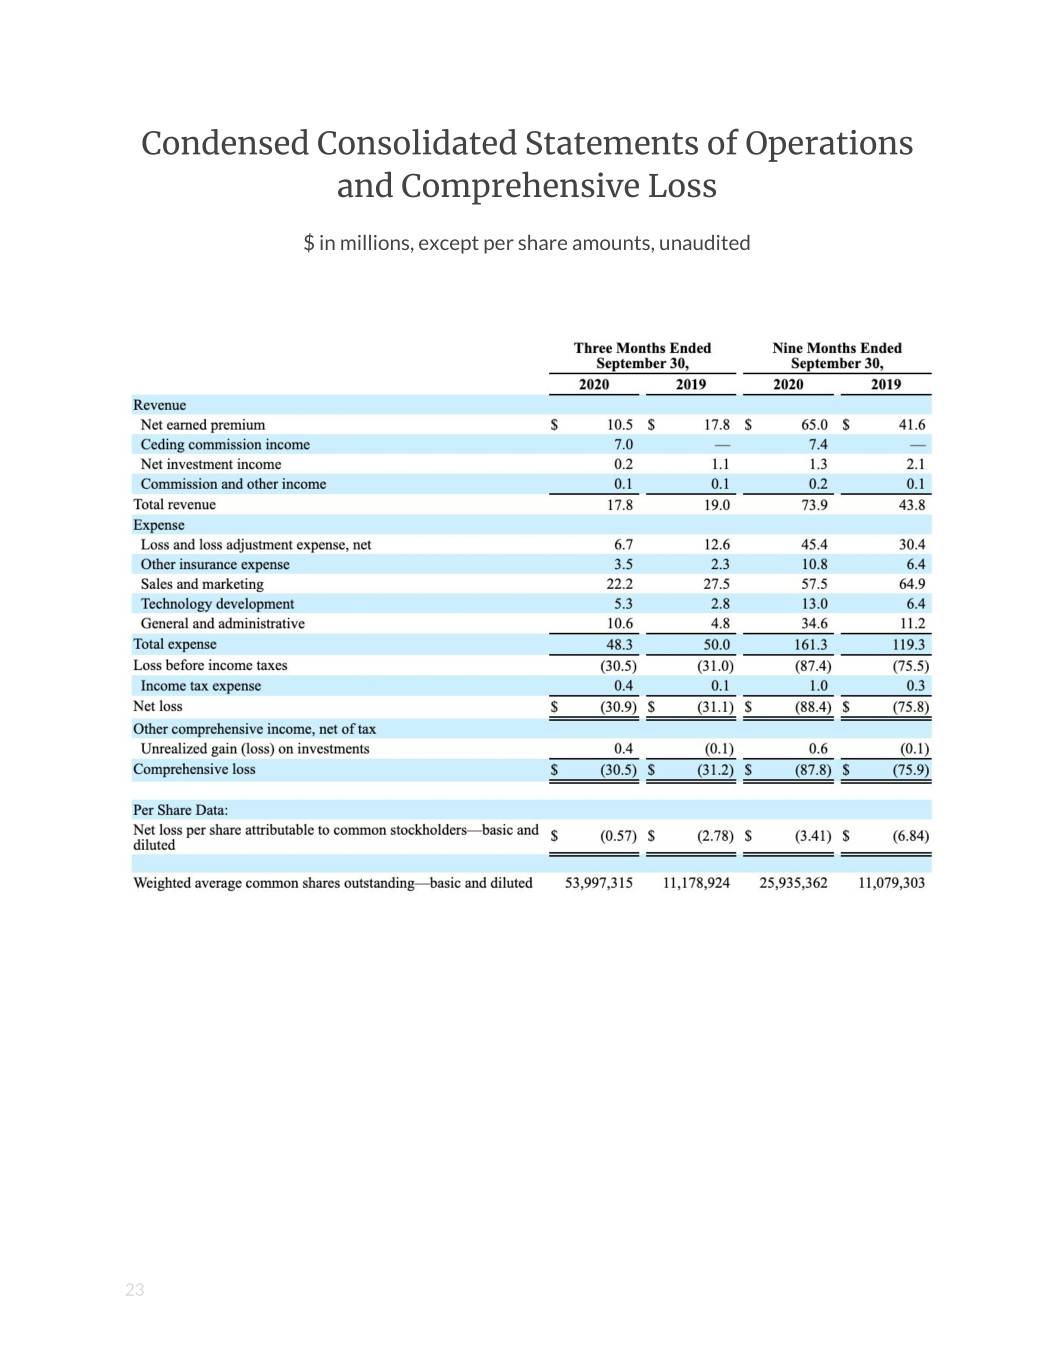
Condensed Consolidated Statements of Operations and Comprehensive Loss $ in millions, except per share amounts, unaudited 23

Condensed Consolidated Balance Sheets $ in millions, except per share amounts 24

Condensed Consolidated Statements of Cash Flows $ in millions, unaudited 25

Reconciliation of Non-GAAP Financial Measures to GAAP $ in millions, except for per share information, unaudited Adjusted Gross Profit and Adjusted Gross Profit Margin The following table provides a reconciliation of total revenue to adjusted gross profit and the related adjusted gross profit margin for the periods presented: 26

Ratio of Adjusted Gross Profit to Gross Earned Premium The following table sets forth our calculation of the Ratio of Adjusted Gross Profit to Gross Earned Premium for the periods presented: Adjusted EBITDA The following table provides a reconciliation of adjusted EBITDA to net loss for the periods presented: 27
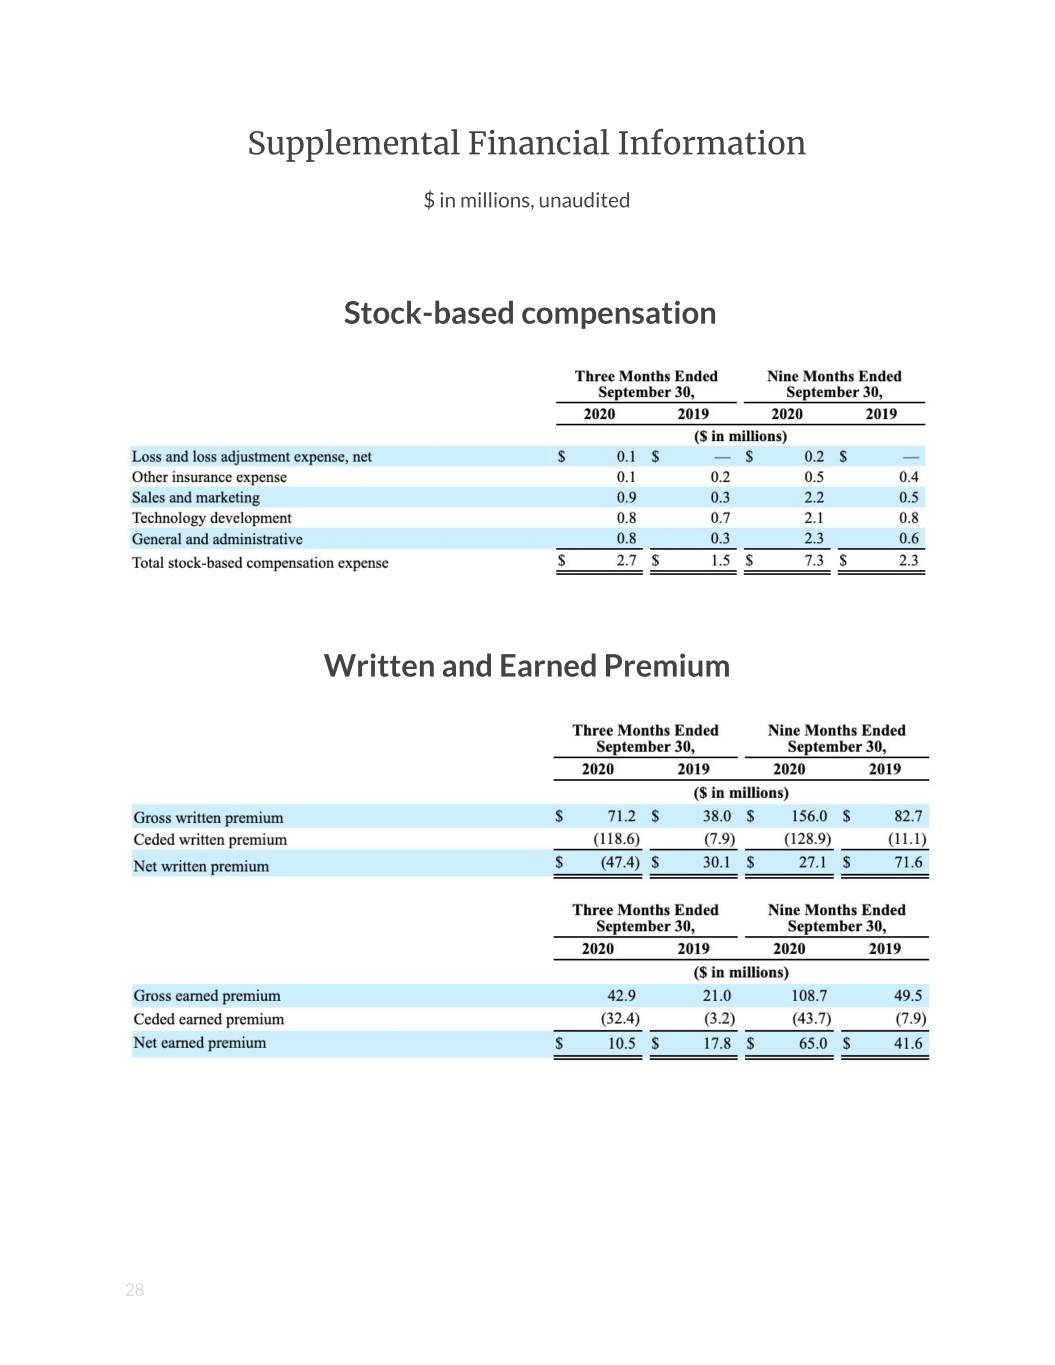
Supplemental Financial Information $ in millions, unaudited Stock-based compensation Written and Earned Premium 28

Historical Operating Metrics 29

Appendix to the Q3 2020 Shareholder Letter

Premium Per Customers * = In Force Premium (in ‘000s) Customer ($s in m) 941 $201 $188.9 $169 $138 562 $94.9 257 $35.6 Q3 18 Q3 19 Q3 20 Q3 18 Q3 19 Q3 20 Q3 18 Q3 19 Q3 20 YoY growth 118% 67% 22% 19% 167% 99% Appendix p.2
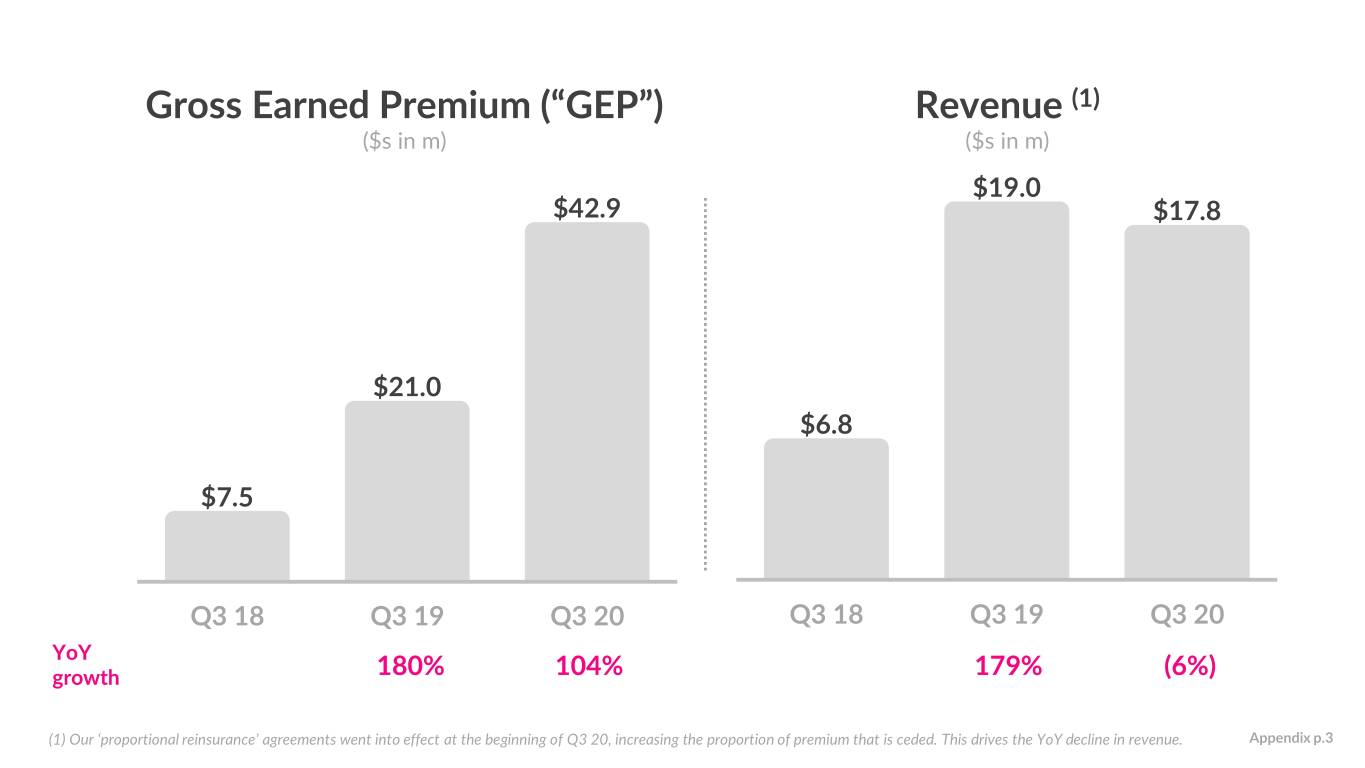
Gross Earned Premium (“GEP”) Revenue (1) ($s in m) ($s in m) $19.0 $42.9 $17.8 $21.0 $6.8 $7.5 Q3 18 Q3 19 Q3 20 Q3 18 Q3 19 Q3 20 YoY growth 180% 104% 179% (6%) (1) Our ‘proportional reinsurance’ agreements went into effect at the beginning of Q3 20, increasing the proportion of premium that is ceded. This drives the YoY decline in revenue. Appendix p.3

Loss Ratio (2) 87% Gross Loss Ratio (3) Net Loss Ratio (3) 82% 78% 73% 72% 72% 75% 74% 70% 72% 71% 69% 67% 65% Q1 19 Q2 19 Q3 19 Q4 19 Q1 20 Q2 20 Q3 20 (2) Q3 20 relationship between loss ratios is a result of our transition to quota share reinsurance – over the next several quarters, we expect net and gross loss ratios to converge. (3) We define gross loss ratio, expressed as a percentage, as the ratio of losses and loss adjustment expense to gross earned premium, and net loss ratio, expressed as a percentage, as the ratio of losses and loss adjustment expense, less amounts ceded to reinsurers, to net earned premium. Appendix p.4
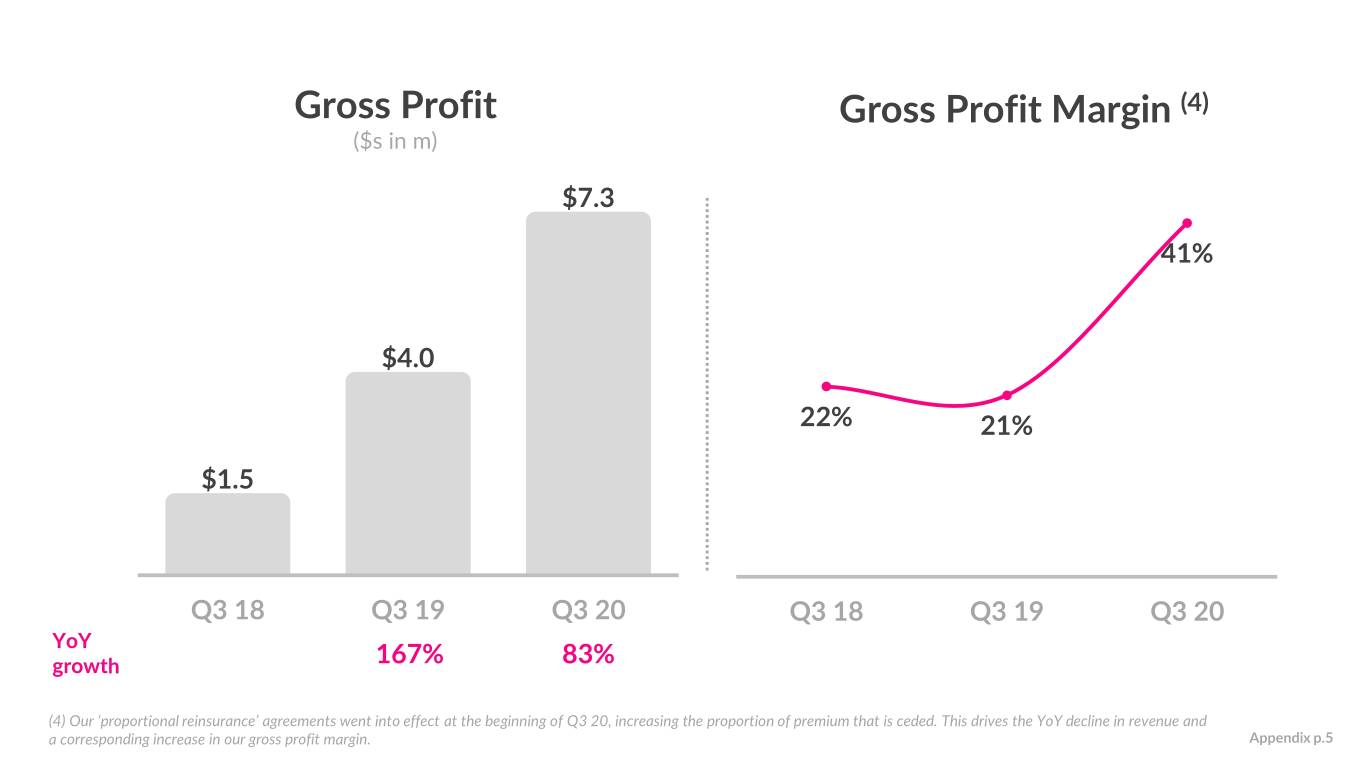
Gross Profit Gross Profit Margin (4) ($s in m) $7.3 41% $4.0 22% 21% $1.5 Q3 18 Q3 19 Q3 20 Q3 18 Q3 19 Q3 20 YoY growth 167% 83% (4) Our ‘proportional reinsurance’ agreements went into effect at the beginning of Q3 20, increasing the proportion of premium that is ceded. This drives the YoY decline in revenue and a corresponding increase in our gross profit margin. Appendix p.5

Adj. Gross Profit (5) Ratio of Adj. Gross Profit to GEP ($s in m) $9.3 21% 22% 19% $3.9 $1.6 Q3 18 Q3 19 Q3 20 Q3 18 Q3 19 Q3 20 YoY growth 144% 138% (5) This is a non-GAAP metric. For a description of these metrics and a reconciliation to the most directly comparable GAAP measure, please see "Reconciliation of Non-GAAP Financial Measures to GAAP" and "Non-GAAP financial measures and key operating metrics". Specifically for Q3 18, the most comparable GAAP metric of Gross Profit was $1.5m; adjustments to Adj. Gross Profit are net investment income of ($0.5m), employee-related expense of $0.4m, professional fees and other expense of $0.2m. Appendix p.6

Operating Expense (6) ($s in m) Other insurance expense ($10.4) ($27.5) ($22.2) Sales and marketing ($14.8) Technology development General and administrative ($37.4) ($41.6) Q3 18 Q3 19 Q3 20 As % of GEP (197%) (178%) (97%) (6) Represents total expense less loss and loss adjustment expense, net. Appendix p.7
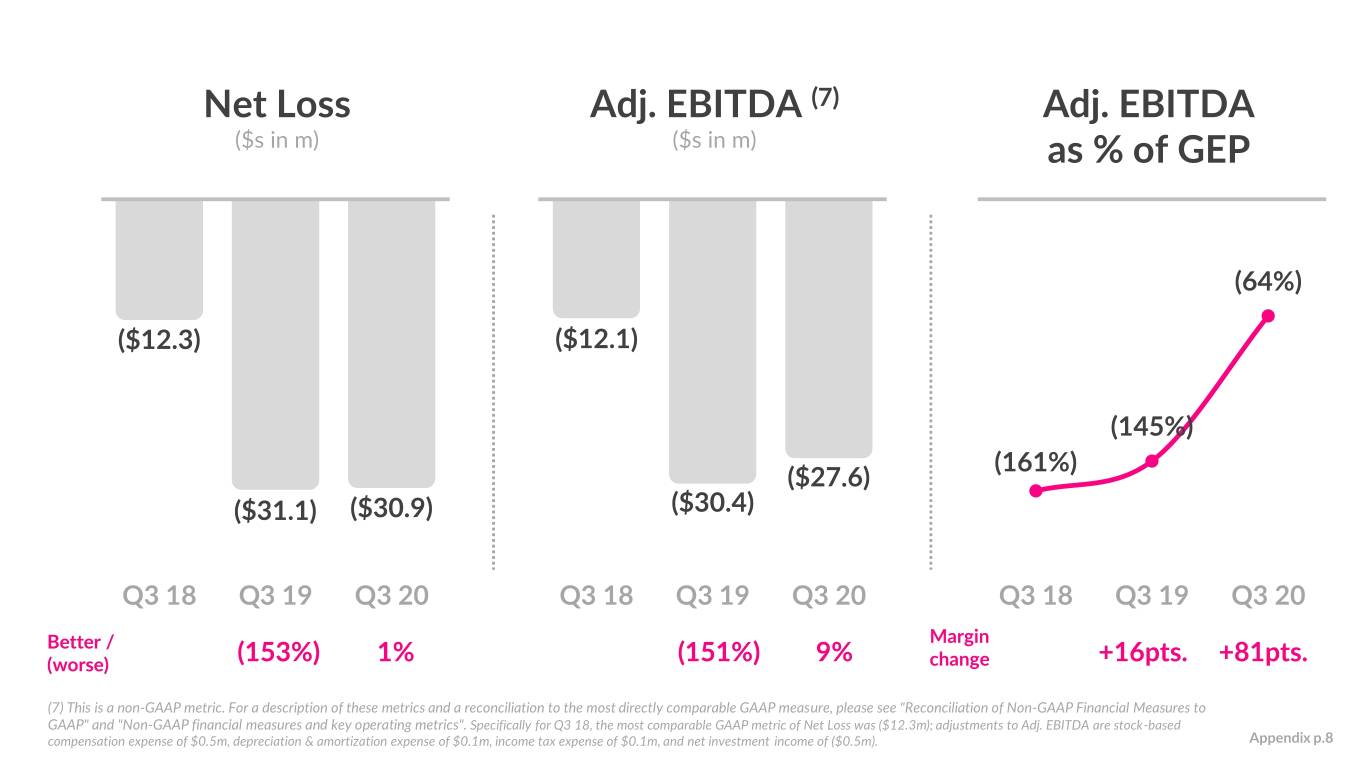
Net Loss Adj. EBITDA (7) Adj. EBITDA ($s in m) ($s in m) as % of GEP (64%) ($12.3) ($12.1) (145%) (161%) ($27.6) ($31.1) ($30.9) ($30.4) Q3 18 Q3 19 Q3 20 Q3 18 Q3 19 Q3 20 Q3 18 Q3 19 Q3 20 Better / Margin (worse) (153%) 1% (151%) 9% change +16pts. +81pts. (7) This is a non-GAAP metric. For a description of these metrics and a reconciliation to the most directly comparable GAAP measure, please see "Reconciliation of Non-GAAP Financial Measures to GAAP" and "Non-GAAP financial measures and key operating metrics". Specifically for Q3 18, the most comparable GAAP metric of Net Loss was ($12.3m); adjustments to Adj. EBITDA are stock-based compensation expense of $0.5m, depreciation & amortization expense of $0.1m, income tax expense of $0.1m, and net investment income of ($0.5m). Appendix p.8

Guidance ($s in m) Q4 2020 Full Year 2020 Low High Low High In Force Premium (as of end of period) $200 $205 $200 $205 Gross Earned Premium $46 $48 $154 $157 Revenue $18 $19 $91 $93 Adj. EBITDA (8) ($34) ($32) ($103) ($100) (8) Adj. EBITDA is a non-GAAP metric. A full reconciliation of Adj. EBITDA guidance to net loss on a forward-looking basis cannot be provided without unreasonable efforts, as we are unable to provide reconciling information with respect to income tax expense, depreciation and amortization, interest income, net investment income, and other transactions that we consider to be unique in nature, all of which are adjustments to Adj. EBITDA. We estimate that stock-based compensation for the fourth quarter and full year 2020 is approximately $3m and $11m, respectively. Appendix p.9
