Attached files
| file | filename |
|---|---|
| EX-99.1 - EX-99.1 - Harmony Biosciences Holdings, Inc. | d947261dex991.htm |
| 8-K - 8-K - Harmony Biosciences Holdings, Inc. | d947261d8k.htm |

Harmony Biosciences Q3 2020 Financial and Business Update November 12, 2020 Exhibit 99.2

Legal Disclaimer This presentation includes forward‐looking statements within the meaning of the Private Securities Reform Act of 1995. All statements other than statements of historical facts contained in these materials or elsewhere, including statements regarding Harmony Biosciences Holdings, Inc.’s (the “Company”) future financial position, business strategy and plans and objectives of management for future operations, should be considered forward-looking statements. Forward-looking statements use words like “believes,” “plans,” “expects,” “intends,” “will,” “would,” “anticipates,” “estimates,” and similar words or expressions in discussions of the Company’s future operations, financial performance or the Company’s strategies. These statements are based on current expectations or objectives that are inherently uncertain, especially in light of the Company’s limited operating history. These and other important factors discussed under the caption “Risk Factors” in the Company’s Quarter Report on Form 10-Q filed with the U.S. Securities and Exchange Commission (the “SEC”) on November 12, 2020 and its other filings with the SEC could cause actual results to differ materially and adversely from those indicated by the forward-looking statements made in this presentation. While the Company may elect to update such forward-looking statements at some point in the future, it disclaims any obligation to do so, even if subsequent events cause its views to change. This presentation includes information related to market opportunity as well as cost and other estimates obtained from internal analyses and external sources. The internal analyses are based upon management’s understanding of market and industry conditions and have not been verified by independent sources. Similarly, the externally sourced information has been obtained from sources the Company believes to be reliable, but the accuracy and completeness of such information cannot be assured. Neither the company, nor any of its respective officers, directors, managers, employees, agents, or representatives, (i) make any representations or warranties, express or implied, with respect to any of the information contained herein, including the accuracy or completeness of this presentation or any other written or oral information made available to any interested party or its advisor (and any liability therefore is expressly disclaimed), (ii) have any liability from the use of the information, including with respect to any forward-looking statements, or (iii) undertake to update any of the information contained herein or provide additional information as a result of new information or future events or developments.
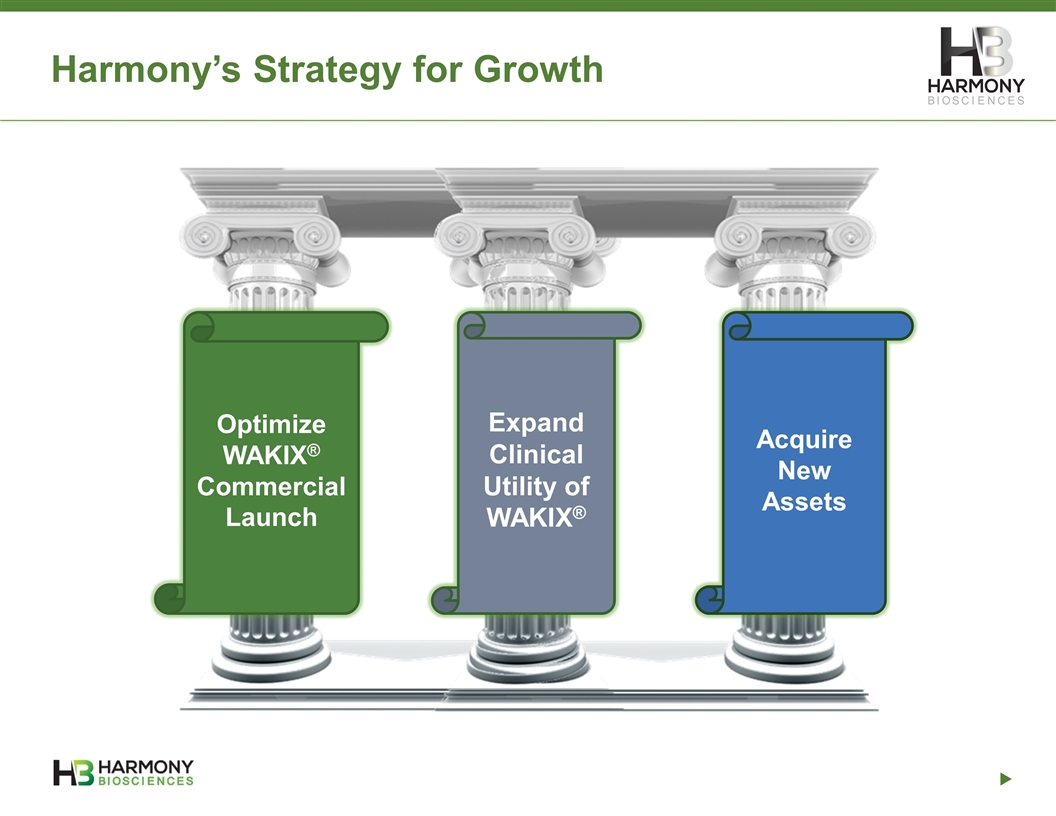
Harmony’s Strategy for Growth Optimize WAKIX® Commercial Launch Expand Clinical Utility of WAKIX® Acquire New Assets
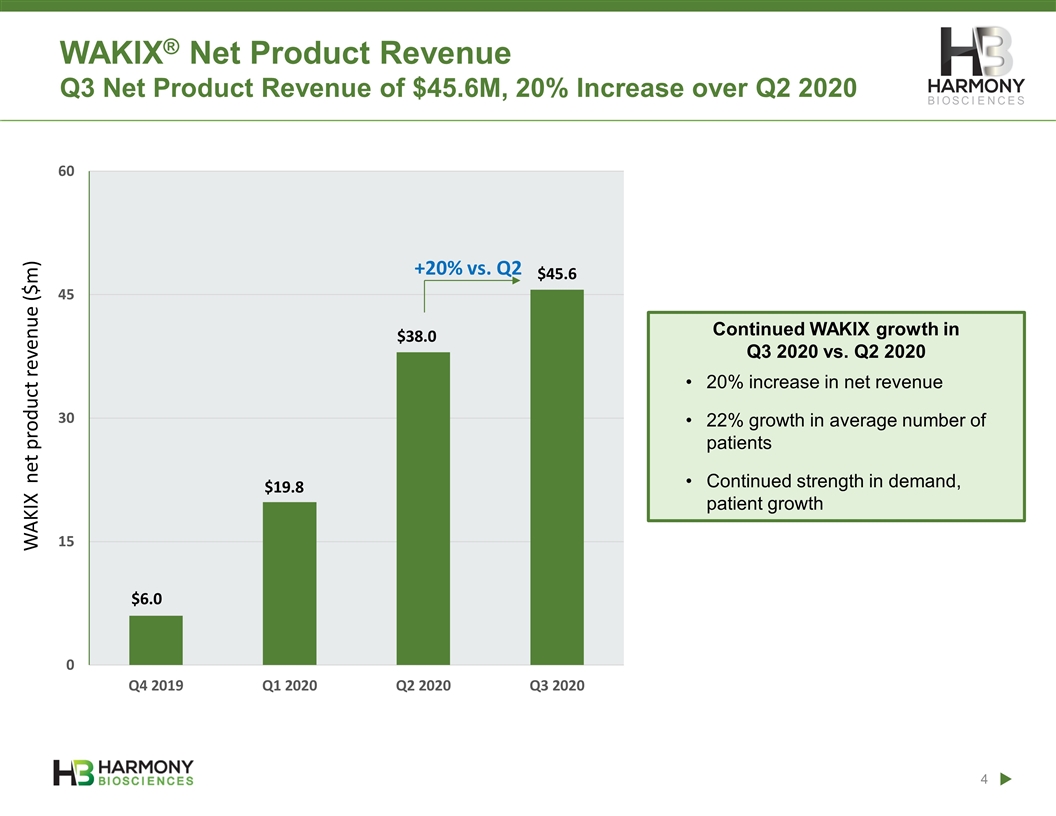
WAKIX net product revenue ($m) WAKIX® Net Product Revenue Q3 Net Product Revenue of $45.6M, 20% Increase over Q2 2020 Continued WAKIX growth in Q3 2020 vs. Q2 2020 20% increase in net revenue 22% growth in average number of patients Continued strength in demand, patient growth
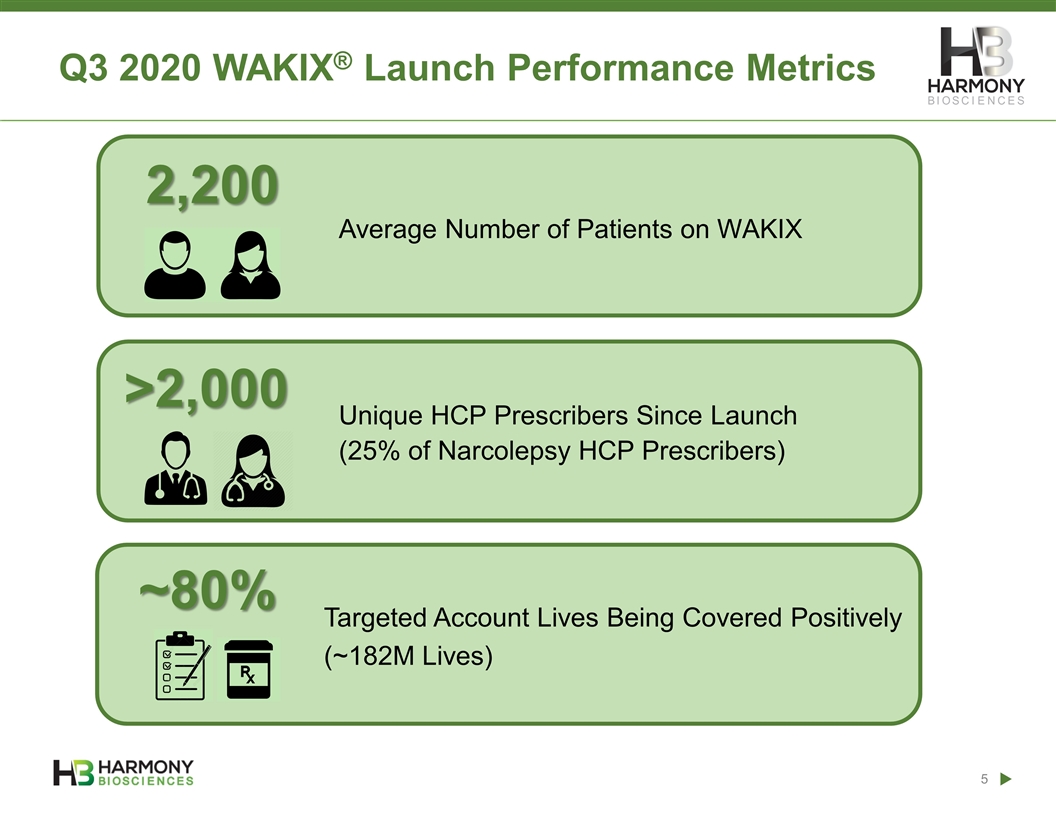
Q3 2020 WAKIX® Launch Performance Metrics Average Number of Patients on WAKIX 2,200 ~80% >2,000 Unique HCP Prescribers Since Launch (25% of Narcolepsy HCP Prescribers) Targeted Account Lives Being Covered Positively (~182M Lives)
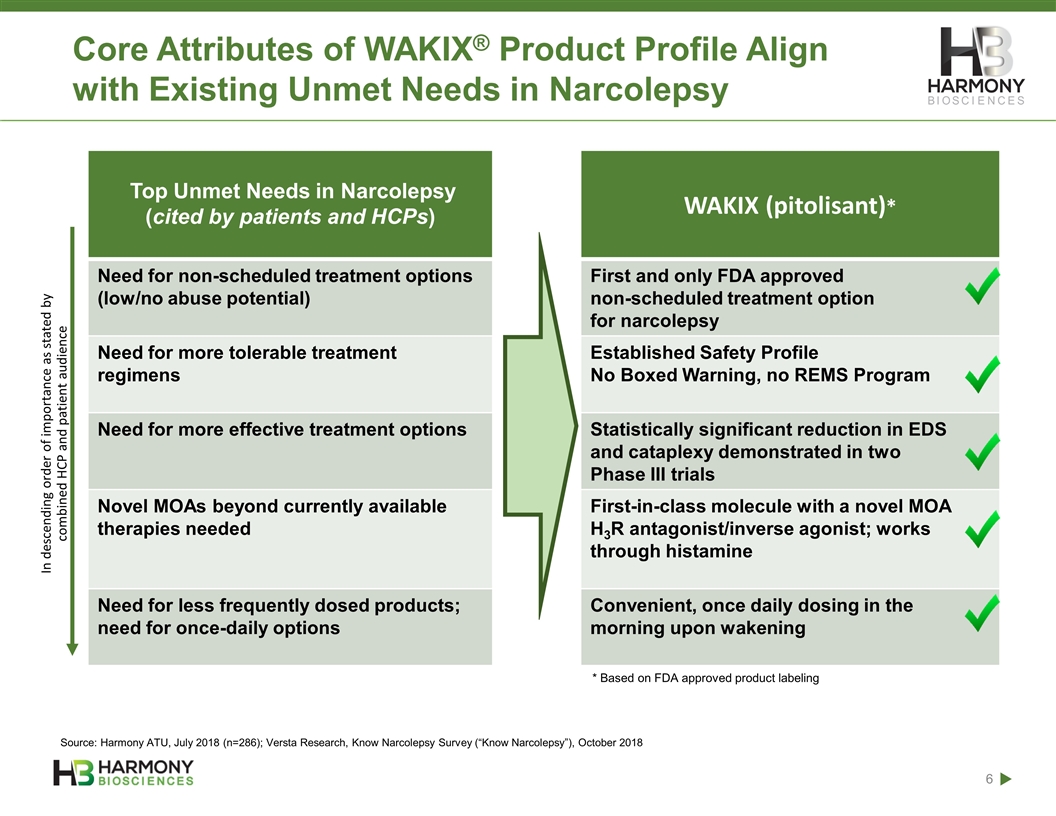
Core Attributes of WAKIX® Product Profile Align with Existing Unmet Needs in Narcolepsy Top Unmet Needs in Narcolepsy (cited by patients and HCPs) WAKIX (pitolisant)* Need for non-scheduled treatment options (low/no abuse potential) First and only FDA approved non-scheduled treatment option for narcolepsy Need for more tolerable treatment regimens Established Safety Profile No Boxed Warning, no REMS Program Need for more effective treatment options Statistically significant reduction in EDS and cataplexy demonstrated in two Phase III trials Novel MOAs beyond currently available therapies needed First-in-class molecule with a novel MOA H3R antagonist/inverse agonist; works through histamine Need for less frequently dosed products; need for once-daily options Convenient, once daily dosing in the morning upon wakening In descending order of importance as stated by combined HCP and patient audience * Based on FDA approved product labeling Source: Harmony ATU, July 2018 (n=286); Versta Research, Know Narcolepsy Survey (“Know Narcolepsy”), October 2018
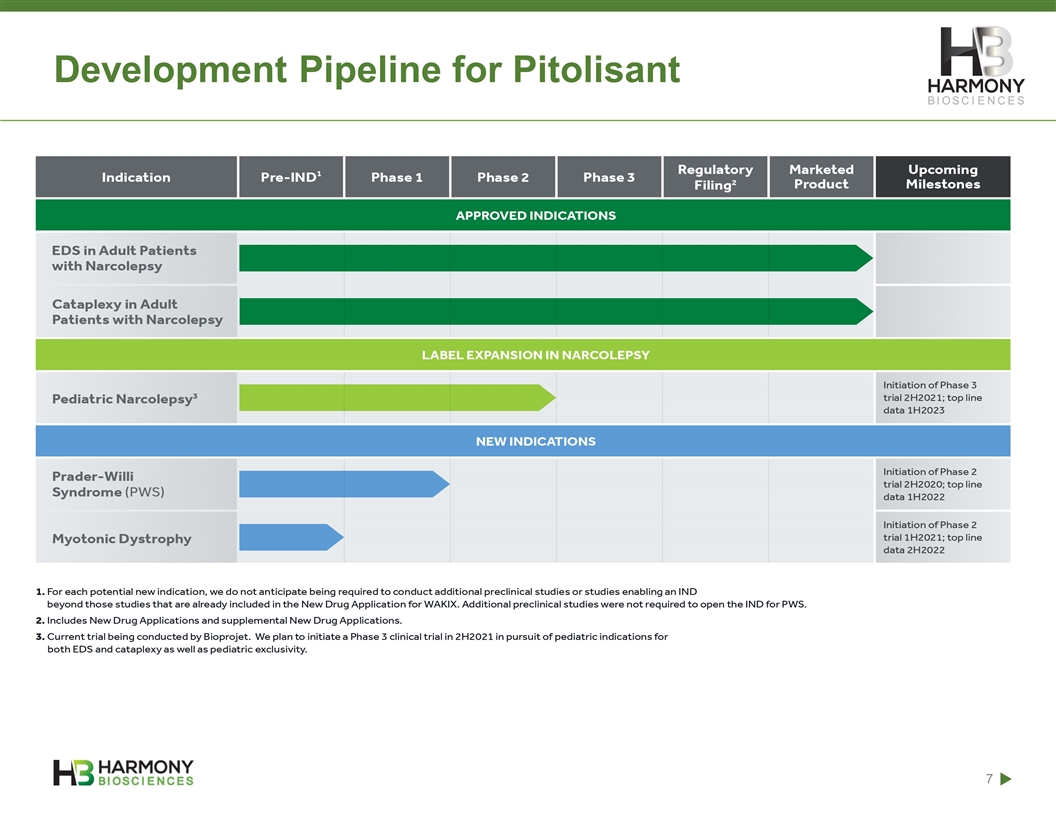
Development Pipeline for Pitolisant
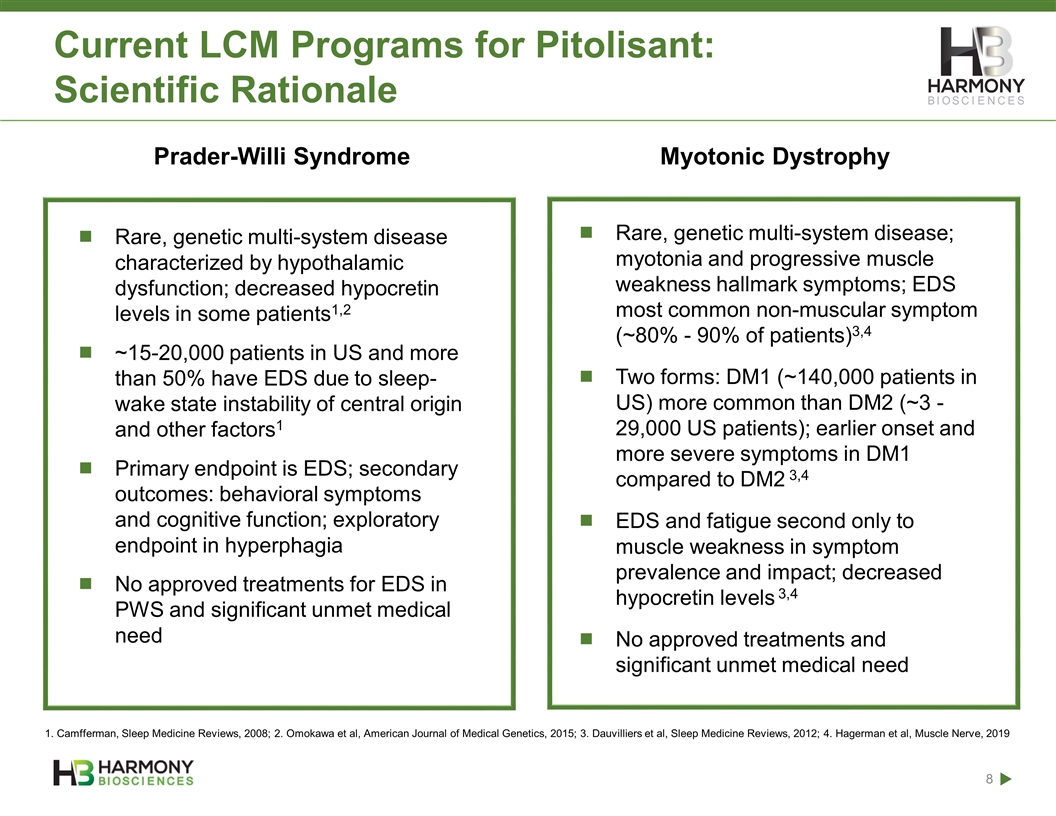
Current LCM Programs for Pitolisant: Scientific Rationale Prader-Willi Syndrome Myotonic Dystrophy Rare, genetic multi-system disease characterized by hypothalamic dysfunction; decreased hypocretin levels in some patients1,2 ~15-20,000 patients in US and more than 50% have EDS due to sleep-wake state instability of central origin and other factors1 Primary endpoint is EDS; secondary outcomes: behavioral symptoms and cognitive function; exploratory endpoint in hyperphagia No approved treatments for EDS in PWS and significant unmet medical need Rare, genetic multi-system disease; myotonia and progressive muscle weakness hallmark symptoms; EDS most common non-muscular symptom (~80% - 90% of patients)3,4 Two forms: DM1 (~140,000 patients in US) more common than DM2 (~3 - 29,000 US patients); earlier onset and more severe symptoms in DM1 compared to DM2 3,4 EDS and fatigue second only to muscle weakness in symptom prevalence and impact; decreased hypocretin levels 3,4 No approved treatments and significant unmet medical need 1. Camfferman, Sleep Medicine Reviews, 2008; 2. Omokawa et al, American Journal of Medical Genetics, 2015; 3. Dauvilliers et al, Sleep Medicine Reviews, 2012; 4. Hagerman et al, Muscle Nerve, 2019
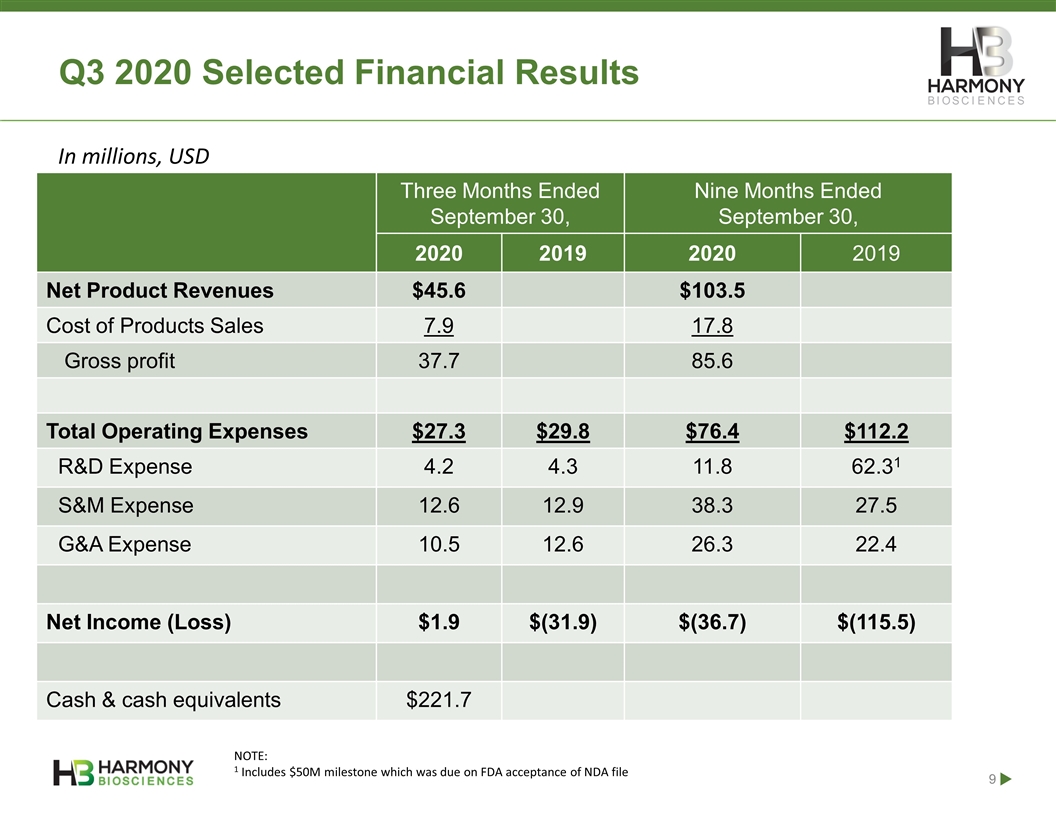
Q3 2020 Selected Financial Results Three Months Ended September 30, Nine Months Ended September 30, 2020 2019 2020 2019 Net Product Revenues $45.6 $103.5 Cost of Products Sales 7.9 17.8 Gross profit 37.7 85.6 Total Operating Expenses $27.3 $29.8 $76.4 $112.2 R&D Expense 4.2 4.3 11.8 62.31 S&M Expense 12.6 12.9 38.3 27.5 G&A Expense 10.5 12.6 26.3 22.4 Net Income (Loss) $1.9 $(31.9) $(36.7) $(115.5) Cash & cash equivalents $221.7 NOTE: 1 Includes $50M milestone which was due on FDA acceptance of NDA file In millions, USD

Thank You November 12, 2020
