Attached files
| file | filename |
|---|---|
| EX-99.1 - EX-99.1 - CMC Materials, Inc. | ccmp-20201111xex991.htm |
| 8-K - 8-K - CMC Materials, Inc. | ccmp-20201111.htm |

Fourth quarter of fiscal 2020 earnings call NOVEMBER 12, 2020 © Copyright 2020 CMC Materials, Inc.

Safe harbor statement The information contained in and discussed during this presentation may include “forward-looking statements” within the meaning of federal securities regulations. These forward-looking statements involve a number of risks, uncertainties, and other factors, including those described in CMC Materials’ filings with the Securities and Exchange Commission (SEC), that could cause actual results to differ materially from those described by these forward-looking statements. CMC Materials assumes no obligation to update this forward-looking information. © Copyright 2020 CMC Materials, Inc. 2

Fourth quarter highlights Revenue of $274M, down 2% versus prior year Net Income of $36.9M compared to a loss in the due to COVID-19 prior year • Stronger demand in CMP Slurries and • Prior year loss was due to the impairment Electronic Chemicals charge the company took for its strategic • Higher revenue in Wood Treatment and QED decision to exit the Wood Treatment business • Lower revenue in Pipeline Performance Products due to impact of COVID-19 Adjusted EBITDA1 of $84M, down 2% year over • Lower revenue in CMP Pads year • Adjusted EBITDA Margin of 30.6% Revenue was flat sequentially • Higher revenue in CMP Slurries and Electronic Diluted EPS of $1.25; Adjusted diluted EPS1 of Chemicals $1.96, 16% higher than in the prior year • Lower revenue in Pipeline Performance and CMP Pads Data reflects rounded values 1 Refer to the Company’s fourth quarter fiscal year 2020 press release for information about these non-GAAP financial measures and reconciliations of these non-GAAP measures to their most comparable GAAP measure. © Copyright 2020 CMC Materials, Inc. 3

Full year highlights Record revenue of $1,116M, up 8% versus prior Record reported Net Income of $142.8M, up year from $39.2M last year • Driven primarily by the KMG acquisition Record adjusted EBITDA1 of $358M, up 7% year Revenue was up 2% compared to pro forma over year and up 4% compared to last year’s revenue last year1 adjusted pro forma EBITDA1 • Stronger demand for CMP Slurries and higher • Adjusted EBITDA Margin1 of 32.1% revenue in Wood Treatment • Lower revenue in Pipeline Performance Record diluted EPS of $4.83, up from $1.35 in Products due to challenging industry conditions the prior year. Record adjusted diluted EPS1 of because of COVID-19 $7.47, 11% higher than adjusted diluted EPS1 in • Lower revenue in CMP Pads the prior year and 11% higher than adjusted pro forma diluted EPS1 in the prior year. Data reflects rounded values 1 Refer to the Company’s fourth quarter fiscal year 2020 press release for information about these non-GAAP financial measures and reconciliations of these non-GAAP measures to their most comparable GAAP measure. © Copyright 2020 CMC Materials, Inc. 4

Fourth quarter financial details Reported Adjusted results1 2020 Q4 2019 Q4 2020 Q4 2019 Q4 Comments on adjusted results Higher revenue in CMP Slurries, Electronic Revenue $274.2M $278.6M $274.2M $278.6M q Chemicals and Wood Treatment offset by lower revenue in Pipeline Performance and CMP Pads Gross margin 42.7 % 40.6 % 44.0 % 44.2 % tu (+) Lower selling, general and administrative Net income (loss) $36.9M ($20.2M) $58.0M $49.9M p expenses (+) Lower interest expense Diluted EPS $1.25 ($0.70) $1.96 $1.69 p (+) Lower tax expense EBITDA $78.2M $9.3M $84.0M $85.3M q (-) Lower revenue EBITDA margin 28.5 % 3.4 % 30.6 % 30.6 % tu Data reflects rounded values 1 Refer to the Company’s fourth quarter fiscal year 2020 press release for information about these non-GAAP financial measures and reconciliations of these non-GAAP measures to their most comparable GAAP measure. © Copyright 2020 CMC Materials, Inc. 5

Fourth quarter segment and business revenue • CMP Slurries revenue benefited from $ millions 2020 Q4 2019 Q4 stabilized demand in memory Total revenue $ 274 $ 279 q • CMP Pads revenue was negatively impacted by timing of orders Electronic Materials $ 223 $ 217 p • Electronic Chemicals revenue was driven by CMP Slurries $ 121 $ 115 p strength in advanced logic applications CMP Pads $ 20 $ 23 q • Performance Materials revenue declined due to lower demand for DRAs as a result of Electronic Chemicals $ 82 $ 80 p the impact of COVID-19, partially offset by Performance Materials $ 51 $ 61 q higher revenue in Wood Treatment and QED Data reflects rounded values © Copyright 2020 CMC Materials, Inc. 6

Fourth quarter segment revenue and EBITDA 2020 Q4 2019 Q4 Electronic Materials revenue $223M $217M Adjusted EBITDA1 $71M $74M Adjusted EBITDA Margin2 32 % 34 % Performance Materials revenue $51M $61M Adjusted EBITDA1 $22M $28M Adjusted EBITDA Margin2 44 % 46 % Year over year comparisons impacted by updated methodology for assigning corporate allocations as more of the corporate costs moved directly into the segments in fiscal 2020 to better reflect the true costs within the businesses. Data reflects rounded values 1 Adjusted EBITDA for the Electronic Materials and Performance Materials segments is presented in conformity with Accounting Standards Codification Topic 280, Segment Reporting. This measure is reported to the chief operating decision maker for purposes of making decisions about allocating resources to the segments and assessing their performance. For these reasons, this measure is excluded from the definition of non-GAAP financial measures under the SEC’s Regulation G and Item 10(e) of Regulation S-K. 2 Refer to the Company’s fourth quarter fiscal year 2020 press release for information about these non-GAAP financial measures and reconciliations of these non- GAAP measures to their most comparable GAAP measure. © Copyright 2020 CMC Materials, Inc. 7

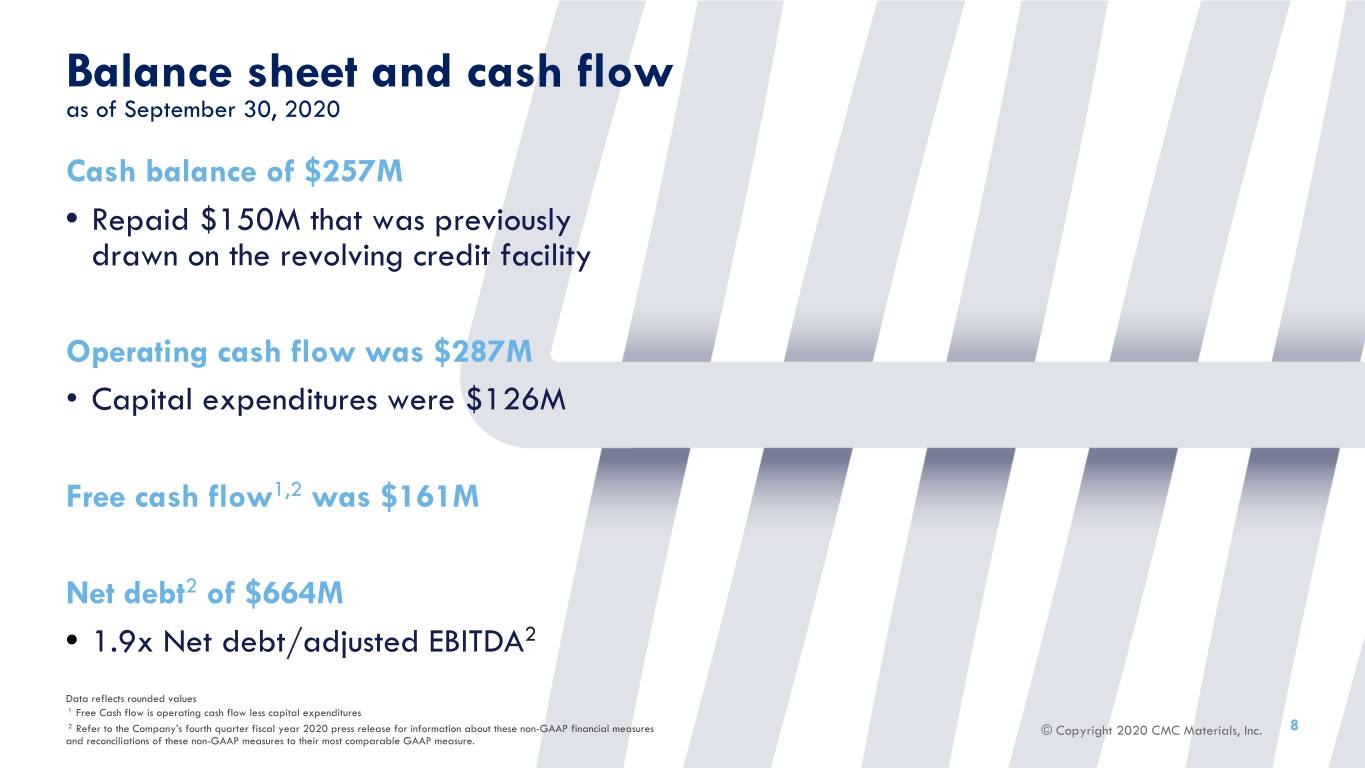
Balance sheet and cash flow as of September 30, 2020 Cash balance of $257M • Repaid $150M that was previously drawn on the revolving credit facility Operating cash flow was $287M • Capital expenditures were $126M Free cash flow1,2 was $161M Net debt2 of $664M • 1.9x Net debt/adjusted EBITDA2 Data reflects rounded values 1 Free Cash flow is operating cash flow less capital expenditures 2 Refer to the Company’s fourth quarter fiscal year 2020 press release for information about these non-GAAP financial measures ©© Copyright Copyright 2020 2020 CMC CMC Materials, Materials, Inc. Inc. 8 and reconciliations of these non-GAAP measures to their most comparable GAAP measure.

Current financial guidance FY2021 Q1 FY2021 Approximately flat to Segment Electronic Materials revenue up low single digits1 Performance Materials revenue Approximately flat1 Approximately flat to Total company Revenue up low single digits1 Adjusted EBITDA2 $358M-$385M Depreciation and amortization3 $50M-$55M Interest expense $9M-$10M $38M-$40M Tax rate4 20%-23% Capital spending $80M-$100M Data reflects rounded values 1 Based on sequential changes compared to fourth quarter fiscal year 2020. 2 Refer to the Company’s fourth quarter fiscal year 2020 press release for information about these non-GAAP financial measures and reconciliations of these non-GAAP measures to their most comparable GAAP measure. 3 Excludes approximately $85 million in amortization of intangibles related to acquisitions. 4 Excludes tax impact from acquisition-related expenses. © Copyright 2020 CMC Materials, Inc. 9

Appendix © Copyright 2020 CMC Materials, Inc.

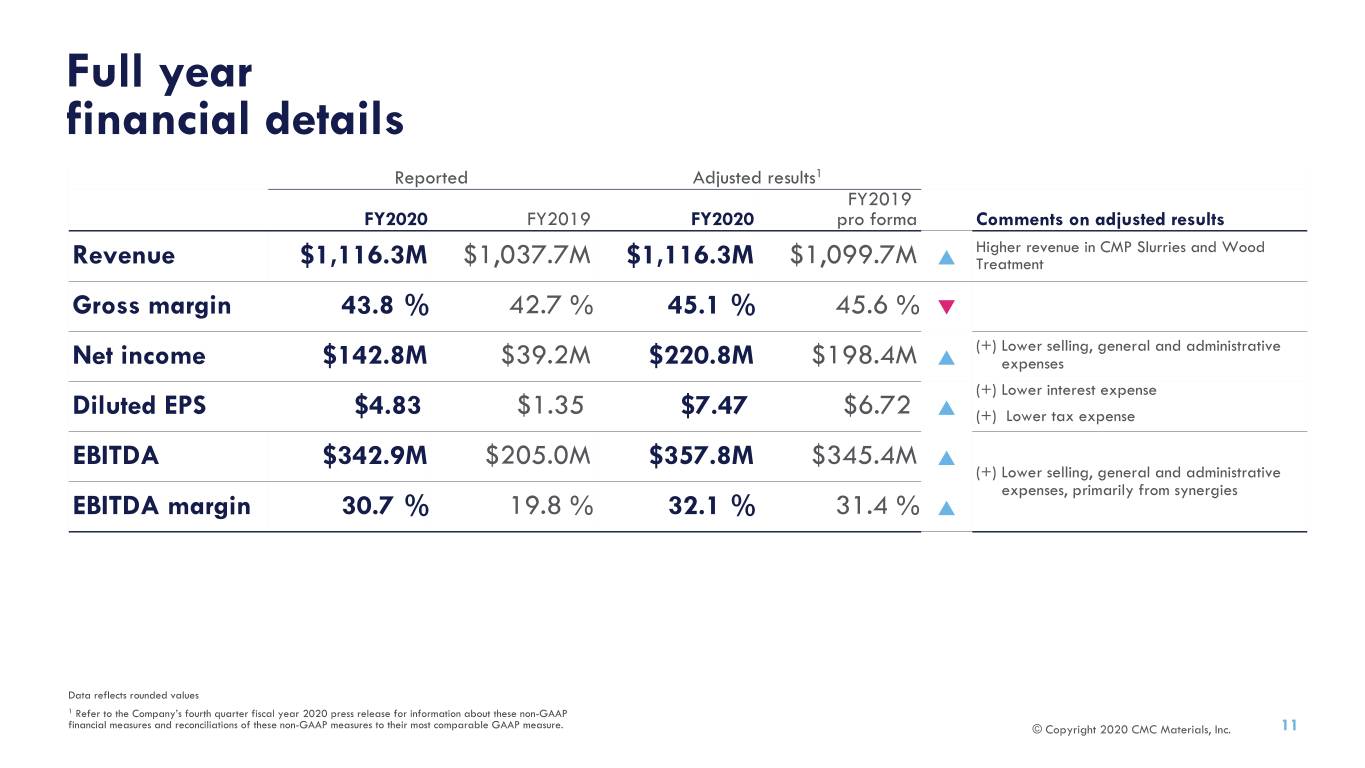
Full year financial details Reported Adjusted results1 FY2019 FY2020 FY2019 FY2020 pro forma Comments on adjusted results Higher revenue in CMP Slurries and Wood Revenue $1,116.3M $1,037.7M $1,116.3M $1,099.7M p Treatment Gross margin 43.8 % 42.7 % 45.1 % 45.6 % q (+) Lower selling, general and administrative Net income $142.8M $39.2M $220.8M $198.4M p expenses (+) Lower interest expense Diluted EPS $4.83 $1.35 $7.47 $6.72 p (+) Lower tax expense EBITDA $342.9M $205.0M $357.8M $345.4M p (+) Lower selling, general and administrative expenses, primarily from synergies EBITDA margin 30.7 % 19.8 % 32.1 % 31.4 % p Data reflects rounded values 1 Refer to the Company’s fourth quarter fiscal year 2020 press release for information about these non-GAAP financial measures and reconciliations of these non-GAAP measures to their most comparable GAAP measure. © Copyright 2020 CMC Materials, Inc. 11

Full year segment and business revenue • CMP Slurries revenue benefited from strong demand in foundry Reported Reported vs. pro forma1 and advanced logic and stabilized FY2019 demand in memory $ millions FY2020 FY2019 FY2020 pro forma • CMP Pads revenue was negatively Total revenue $1,116 $1,038 p $1,116 $1,100 p impacted by industry softness Electronic Materials $883 $833 p $883 $873 p • Electronic Chemicals revenue was CMP Slurries $481 $460 p $481 $460 p driven by demand from advanced customers and node transitions CMP Pads $86 $95 q $86 $95 q • Performance Materials revenue Electronic Chemicals $316 $278 p $316 $319 q was negatively impacted by Performance Materials $233 $205 p $233 $227 p reduced demand for Pipeline Performance Products due to softer industry conditions Data reflects rounded values 1 Pro forma data represents calculations as if KMG results were included in total company results for the full year of fiscal 2019, with certain adjustments. Refer to the Company’s fourth quarter fiscal year 2020 press release for adjusted pro forma © Copyright 2020 CMC Materials, Inc. 12 information.

Reconciliation of selected GAAP financial data to adjusted financial data - quarter Three months ended September 30, (in thousands, except percentage and per share data) 2020 2019 Reported gross profit $117,063 $113,110 Reported gross margin 42.7 % 40.6 % Adjustments(1) 3,699 10,071 Adjusted gross profit 120,762 $123,181 Adjusted gross margin 44.0 % 44.2 % Operating expenses 70,995 $130,733 Adjustments(1) (23,508) (82,572) Adjusted operating expenses 47,487 $48,161 Net income (loss) 36,855 (20,243) Adjustments(1) 21,124 70,169 Adjusted net income 57,979 $49,926 Reported diluted earnings (loss) per share 1.25 ($0.70) Adjustments(1) 0.71 2.39 1Primarily reflects the elimination of the impact of acquisition and integration related costs, Adjusted diluted earnings per share 1.96 $1.69 acquisition-related amortization expenses, the effect of the enactment of the Tax Cuts and Jobs Act in December 2017 in the United States (“tax act”) and the newly issued final regulations related to the tax act, the effect of certain costs related to a warehouse fire at KMG-Bernuth in Tuscaloosa, EBITDA 78,179 $9,335 Alabama, net of insurance recovery, costs related to the Pandemic net of grants received, and restructuring and impairment charges related to the company’s wood treatment business. Refer to Adjustments(1) 5,816 75,958 the Company’s fourth quarter fiscal year 2020 press release for information about these non-GAAP financial measures and reconciliations of these non-GAAP measures to their most comparable GAAP measure. Adjusted EBITDA 83,995 $85,293 © Copyright 2020 CMC Materials, Inc. 13

Reconciliation of selected GAAP financial data to adjusted financial data - twelve months Twelve months ended September 30, (in thousands, except percentage and per share data) 2020 2019 Reported gross profit $488,601 $442,653 Reported gross margin 43.8 % 42.7 % Adjustments(1) 14,920 38,482 Adjusted gross profit $503,521 481,135 Adjusted gross margin 45.1 % 46.4 % Operating expenses $271,696 332,157 Adjustments(1) (85,507) (149,824) Adjusted operating expenses $186,189 182,333 Net income $142,828 39,215 Adjustments(1) 78,018 156,469 Adjusted net income $220,846 195,684 Reported diluted earnings per share $4.83 1.35 (1) Adjustments 2.64 5.38 1Primarily reflects the elimination of the impact of acquisition and integration related costs, acquisition-related amortization expenses, the effect of the enactment of the Tax Cuts and Jobs Act Adjusted diluted earnings per share $7.47 6.73 in December 2017 in the United States (“tax act”) and the newly issued final regulations related to the tax act, the effect of certain costs related to a warehouse fire at KMG-Bernuth in Tuscaloosa, Alabama, net of insurance recovery, costs related to the Pandemic net of grants received, and EBITDA $342,924 205,033 restructuring and impairment charges related to the company’s wood treatment business. Refer to the Company’s fourth quarter fiscal year 2020 press release for information about these non-GAAP Adjustments(1) 14,877 128,385 financial measures and reconciliations of these non-GAAP measures to their most comparable GAAP measure. Adjusted EBITDA $357,801 333,418 © Copyright 2020 CMC Materials, Inc. 14

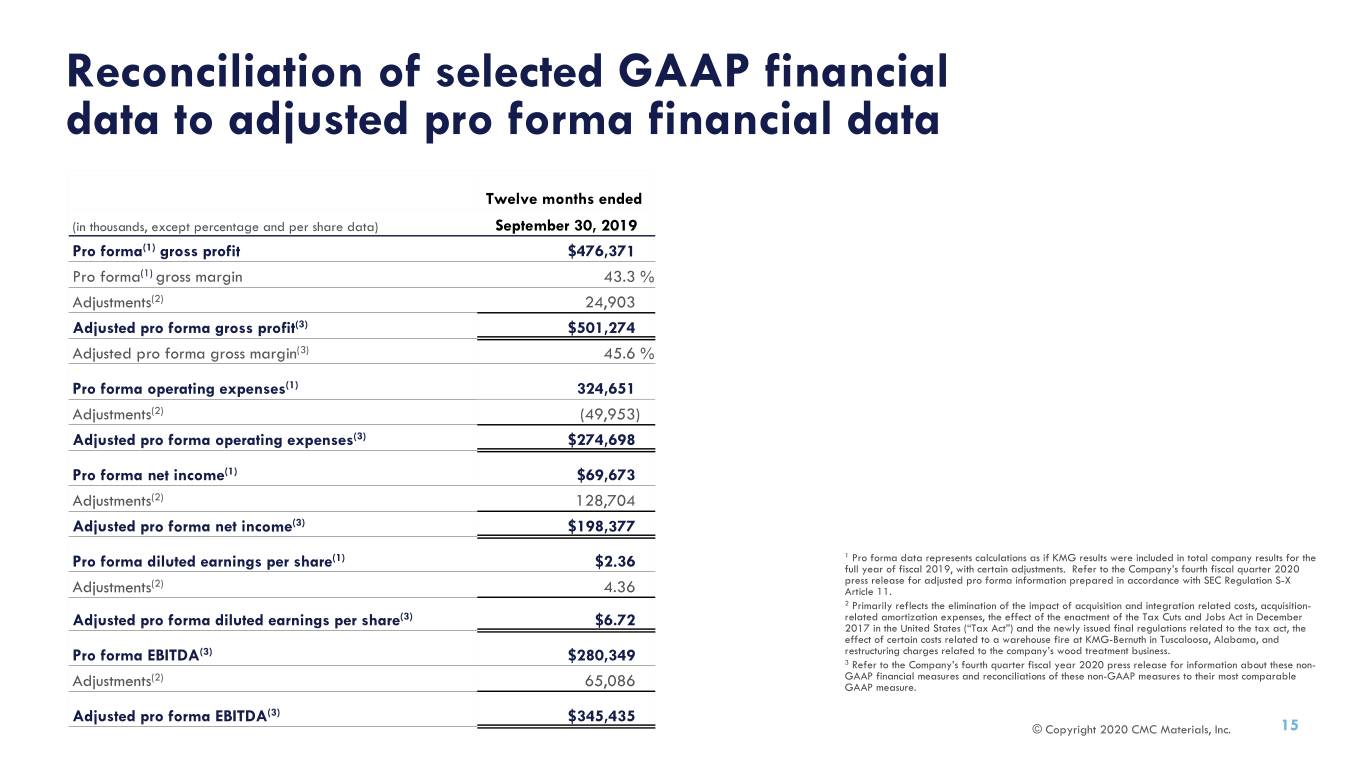
Reconciliation of selected GAAP financial data to adjusted pro forma financial data Twelve months ended (in thousands, except percentage and per share data) September 30, 2019 Pro forma(1) gross profit $476,371 Pro forma(1) gross margin 43.3 % Adjustments(2) 24,903 Adjusted pro forma gross profit(3) $501,274 Adjusted pro forma gross margin(3) 45.6 % Pro forma operating expenses(1) 324,651 Adjustments(2) (49,953) Adjusted pro forma operating expenses(3) $274,698 Pro forma net income(1) $69,673 Adjustments(2) 128,704 Adjusted pro forma net income(3) $198,377 (1) 1 Pro forma data represents calculations as if KMG results were included in total company results for the Pro forma diluted earnings per share $2.36 full year of fiscal 2019, with certain adjustments. Refer to the Company’s fourth fiscal quarter 2020 (2) press release for adjusted pro forma information prepared in accordance with SEC Regulation S-X Adjustments 4.36 Article 11. 2 Primarily reflects the elimination of the impact of acquisition and integration related costs, acquisition- (3) related amortization expenses, the effect of the enactment of the Tax Cuts and Jobs Act in December Adjusted pro forma diluted earnings per share $6.72 2017 in the United States (“Tax Act”) and the newly issued final regulations related to the tax act, the effect of certain costs related to a warehouse fire at KMG-Bernuth in Tuscaloosa, Alabama, and Pro forma EBITDA(3) $280,349 restructuring charges related to the company’s wood treatment business. 3 Refer to the Company’s fourth quarter fiscal year 2020 press release for information about these non- (2) GAAP financial measures and reconciliations of these non-GAAP measures to their most comparable Adjustments 65,086 GAAP measure. Adjusted pro forma EBITDA(3) $345,435 © Copyright 2020 CMC Materials, Inc. 15

Reconciliation of Cash Flow from Operations to Free Cash Flow and GAAP Debt to Net Debt Twelve months ended September 30, (in thousands) 2020 2019 Net cash provided by operating activities $287,284 $174,981 Less: Capital expenditures (125,839) (55,972) Free cash flow 161,445 119,009 Net cash used in investing activities (124,252) (1,232,976) Net cash (used in) provided by financing activities (97,656) 894,432 September 30, (in thousands) 2020 2019 Total short-term and long-term debt $921,414 $941,776 Less: Cash and cash equivalents 257,354 188,495 Total net debt $664,060 753,281 © Copyright 2020 CMC Materials, Inc. 16

Reconciliation of Fiscal Year 2021 Adjusted EBITDA Guidance Fiscal Year 2021 Fiscal Year 2021 (in thousands) Low High Net income $142,000 $163,000 Interest expense, net(1) 39,000 39,000 Provision for income taxes(1) 40,000 46,000 Depreciation(1) 52,500 52,500 Amortization(1) 85,000 85,000 Adjusted EBITDA Guidance - Consolidated 358,500 385,500 Above is a reconciliation of our indicated full year net income to our adjusted EBITDA. The amounts above may not reflect certain future charges costs and/or gains that are inherently difficult to predict and estimate due to their unknown timing, effect and/or significance, including impairment charges associated with the anticipated closure of our wood treatment business. 1 Amounts represent the mid-point of the current financial guidance provided on slide 8 of this presentation. © Copyright 2020 CMC Materials, Inc. 17

Thank you for your interest in CMC Materials For additional information, please contact: investors@cmcmaterials.com 630.499.2600 © Copyright 2020 CMC Materials, Inc.
