Attached files
| file | filename |
|---|---|
| 8-K - 8-K - BAR HARBOR BANKSHARES | bhb-20201110x8k.htm |
Exhibit 99.1
| Third Quarter 2020 Earnings Presentation November 10, 2020 |

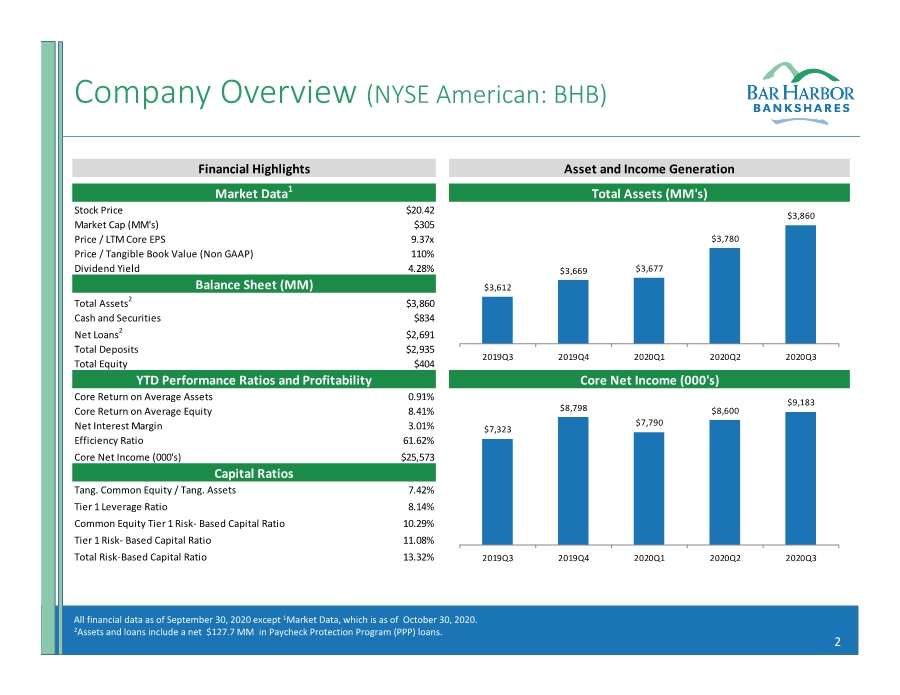
| 2 Company Overview (NYSE American: BHB) All financial data as of September 30, 2020 except 1Market Data, which is as of October 30, 2020. 2Assets and loans include a net $127.7 MM in Paycheck Protection Program (PPP) loans. Stock Price $20.42 Market Cap (MM's) $305 Price / LTM Core EPS 9.37x Price / Tangible Book Value (Non GAAP) 110% Dividend Yield 4.28% Total Assets2 $3,860 Cash and Securities $834 Net Loans2 $2,691 Total Deposits $2,935 Total Equity $404 Core Return on Average Assets 0.91% Core Return on Average Equity 8.41% Net Interest Margin 3.01% Efficiency Ratio 61.62% Core Net Income (000's) $25,573 7.42% Tier 1 Leverage Ratio 8.14% Common Equity Tier 1 Risk‐ Based Capital Ratio 10.29% Tier 1 Risk‐ Based Capital Ratio 11.08% Total Risk‐Based Capital Ratio 13.32% Tang. Common Equity / Tang. Assets Capital Ratios Financial Highlights Asset and Income Generation Total Assets (MM's) Core Net Income (000's) Market Data1 Balance Sheet (MM) YTD Performance Ratios and Profitability $3,860 $3,780 $3,677 $3,669 $3,612 2020Q3 2020Q2 2020Q1 2019Q4 2019Q3 $9,183 $8,600 $7,790 $8,798 $7,323 2020Q3 2020Q2 2020Q1 2019Q4 2019Q3 |
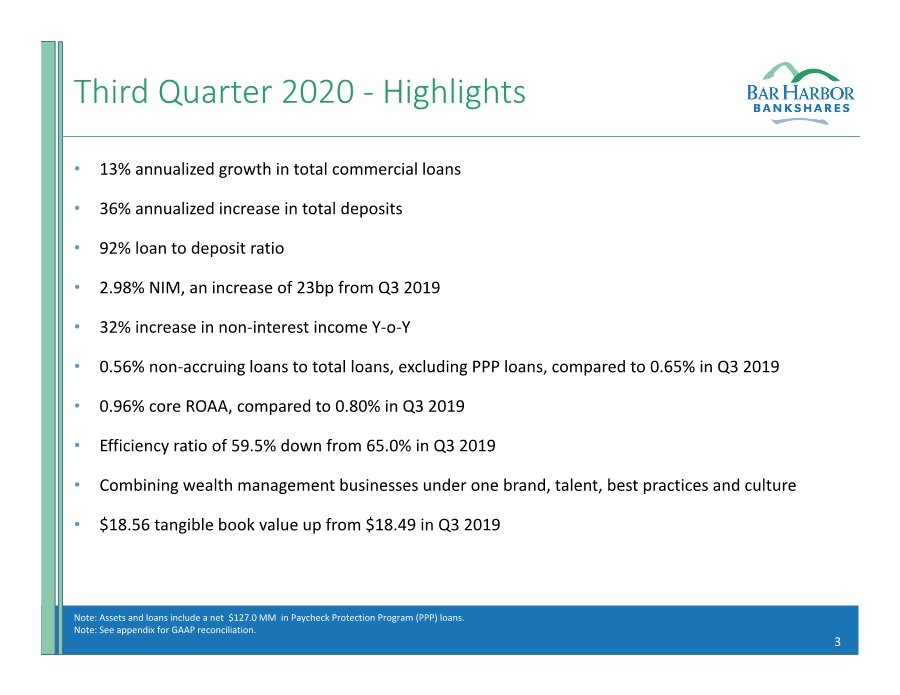
| 3 Third Quarter 2020 ‐ Highlights • 13% annualized growth in total commercial loans • 36% annualized increase in total deposits • 92% loan to deposit ratio • 2.98% NIM, an increase of 23bp from Q3 2019 • 32% increase in non‐interest income Y‐o‐Y • 0.56% non‐accruing loans to total loans, excluding PPP loans, compared to 0.65% in Q3 2019 • 0.96% core ROAA, compared to 0.80% in Q3 2019 • Efficiency ratio of 59.5% down from 65.0% in Q3 2019 • Combining wealth management businesses under one brand, talent, best practices and culture • $18.56 tangible book value up from $18.49 in Q3 2019 Note: Assets and loans include a net $127.0 MM in Paycheck Protection Program (PPP) loans. Note: See appendix for GAAP reconciliation. |
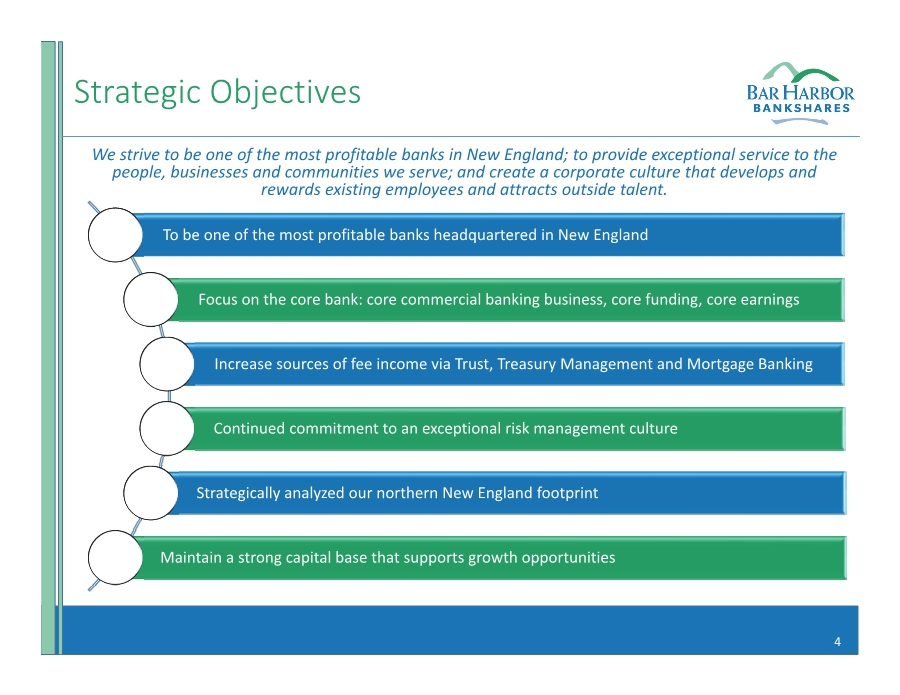
| 4 Strategic Objectives To be one of the most profitable banks headquartered in New England Focus on the core bank: core commercial banking business, core funding, core earnings Increase sources of fee income via Trust, Treasury Management and Mortgage Banking Continued commitment to an exceptional risk management culture Strategically analyzed our northern New England footprint Maintain a strong capital base that supports growth opportunities We strive to be one of the most profitable banks in New England; to provide exceptional service to the people, businesses and communities we serve; and create a corporate culture that develops and rewards existing employees and attracts outside talent. |
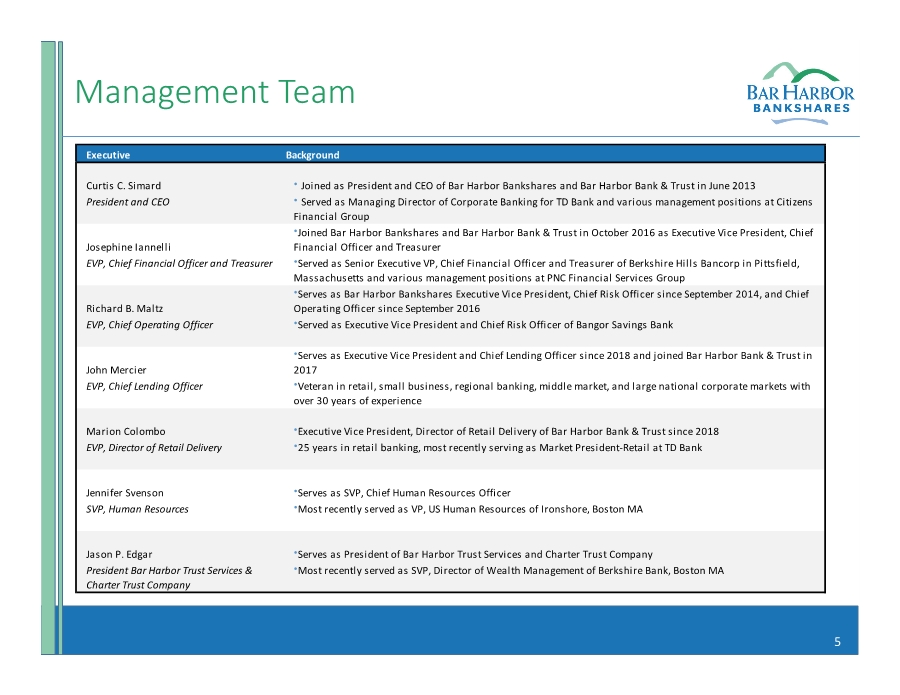
| 5 Management Team Executive Background Curtis C. Simard • Joined as President and CEO of Bar Harbor Bankshares and Bar Harbor Bank & Trust in June 2013 President and CEO • Served as Managing Director of Corporate Banking for TD Bank and various management positions at Citizens Financial Group Josephine Iannelli •Joined Bar Harbor Bankshares and Bar Harbor Bank & Trust in October 2016 as Executive Vice President, Chief Financial Officer and Treasurer EVP, Chief Financial Officer and Treasurer •Served as Senior Executive VP, Chief Financial Officer and Treasurer of Berkshire Hills Bancorp in Pittsfield, Massachusetts and various management positions at PNC Financial Services Group Richard B. Maltz •Serves as Bar Harbor Bankshares Executive Vice President, Chief Risk Officer since September 2014, and Chief Operating Officer since September 2016 EVP, Chief Operating Officer •Served as Executive Vice President and Chief Risk Officer of Bangor Savings Bank John Mercier •Serves as Executive Vice President and Chief Lending Officer since 2018 and joined Bar Harbor Bank & Trust in 2017 EVP, Chief Lending Officer •Veteran in retail, small business, regional banking, middle market, and large national corporate markets with over 30 years of experience Marion Colombo •Executive Vice President, Director of Retail Delivery of Bar Harbor Bank & Trust since 2018 EVP, Director of Retail Delivery •25 years in retail banking, most recently serving as Market President‐Retail at TD Bank Jennifer Svenson •Serves as SVP, Chief Human Resources Officer SVP, Human Resources •Most recently served as VP, US Human Resources of Ironshore, Boston MA Jason P. Edgar •Serves as President of Bar Harbor Trust Services and Charter Trust Company President Bar Harbor Trust Services & Charter Trust Company •Most recently served as SVP, Director of Wealth Management of Berkshire Bank, Boston MA |
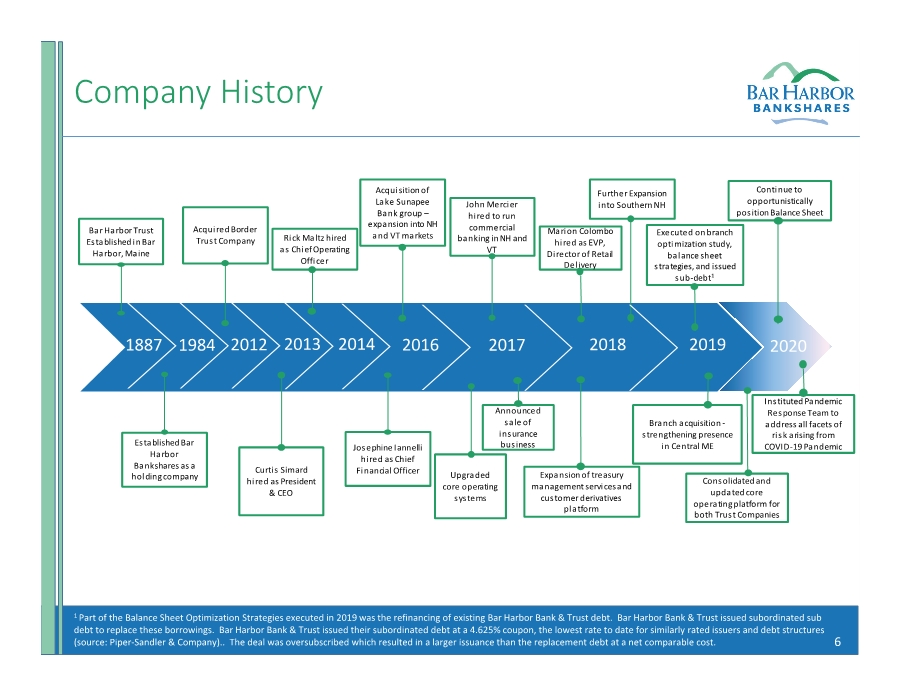
| 6 Company History 1 Part of the Balance Sheet Optimization Strategies executed in 2019 was the refinancing of existing Bar Harbor Bank & Trust debt. Bar Harbor Bank & Trust issued subordinated sub debt to replace these borrowings. Bar Harbor Bank & Trust issued their subordinated debt at a 4.625% coupon, the lowest rate to date for similarly rated issuers and debt structures (source: Piper‐Sandler & Company).. The deal was oversubscribed which resulted in a larger issuance than the replacement debt at a net comparable cost. Bar Harbor Trust Established in Bar Harbor, Maine 1887 1984 Established Bar Harbor Bankshares as a holding company 2012 Acquired Border Trust Company 2013 Curti s Simard hired as President & CEO 2014 Rick Maltz hired as Chi ef Operating Officer 2016 Josephine Iannelli hired as Chief Financial Officer Acquisition of Lake Sunapee Bank group – expansion into NH and VT markets John Mercier hired to run commercial banking in NH and VT Announced sale of insurance business 2017 Expansion of treasury management services and customer derivatives platform Upgraded core operating systems Marion Colombo hired as EVP, Director of Retail Delivery Branch acquisition ‐ strengthening presence in Central ME 2020 2018 Further Expansion into Southern NH 2019 Executedon branch optimization study, balance sheet strategies, and issued sub‐debt1 Consolidated and updatedcore operating platform for both Trust Companies Conti nue to opportunistically position Balance Sheet Ins tituted Pandemic Response Team to address all facets of risk arising from COVID‐19 Pandemic |
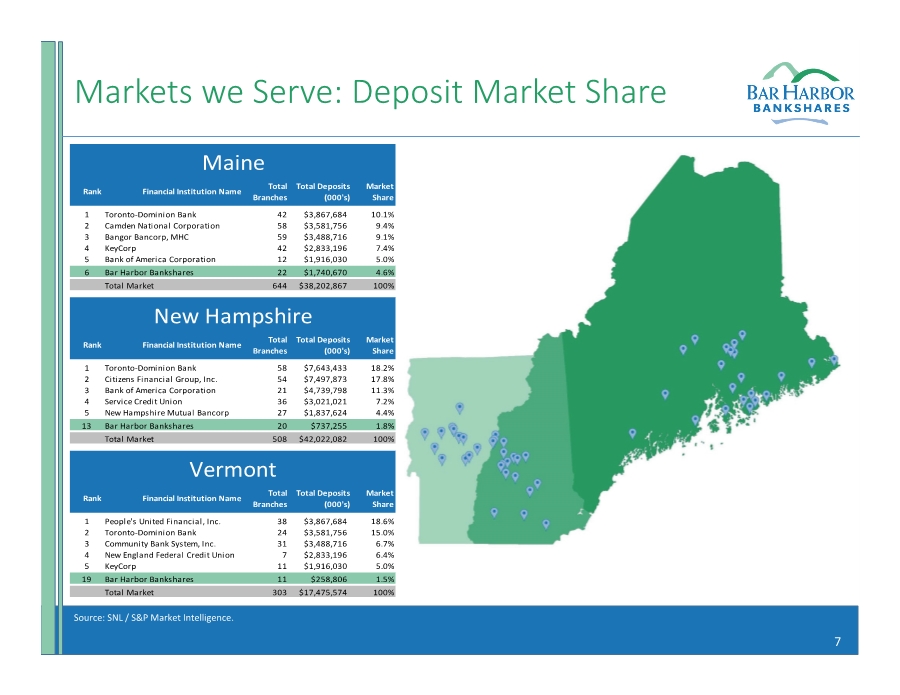
| 7 Markets we Serve: Deposit Market Share Source: SNL / S&P Market Intelligence. Rank Financial Institution Name Total Branches Total Deposits (000's) Market Share 1 Toronto‐Dominion Bank 42 $3,867,684 10.1% 2Camden National Corporation 58 $3,581,756 9.4% 3Bangor Bancorp, MHC 59 $3,488,716 9.1% 4 KeyCorp 42 $2,833,196 7.4% 5Bank of America Corporation 12 $1,916,030 5.0% 6Bar Harbor Bankshares 22 $1,740,670 4.6% Total Market 644 $38,202,867 100% Rank Financial Institution Name Total Branches Total Deposits (000's) Market Share 1 Toronto‐Dominion Bank 58 $7,643,433 18.2% 2 Citizens Financial Group, Inc. 54 $7,497,873 17.8% 3Bank of America Corporation 21 $4,739,798 11.3% 4Service Credit Union 36 $3,021,021 7.2% 5New Hampshire Mutual Bancorp 27 $1,837,624 4.4% 13 Bar Harbor Bankshares 20 $737,255 1.8% Total Market 508 $42,022,082 100% Rank Financial Institution Name Total Branches Total Deposits (000's) Market Share 1 People's United Financial, Inc. 38 $3,867,684 18.6% 2 Toronto‐Dominion Bank 24 $3,581,756 15.0% 3 Community Bank System, Inc. 31 $3,488,716 6.7% 4New England Federal Credit Union 7 $2,833,196 6.4% 5 KeyCorp 11 $1,916,030 5.0% 19 Bar Harbor Bankshares 11 $258,806 1.5% Total Market 303 $17,475,574 100% Vermont New Hampshire Maine |
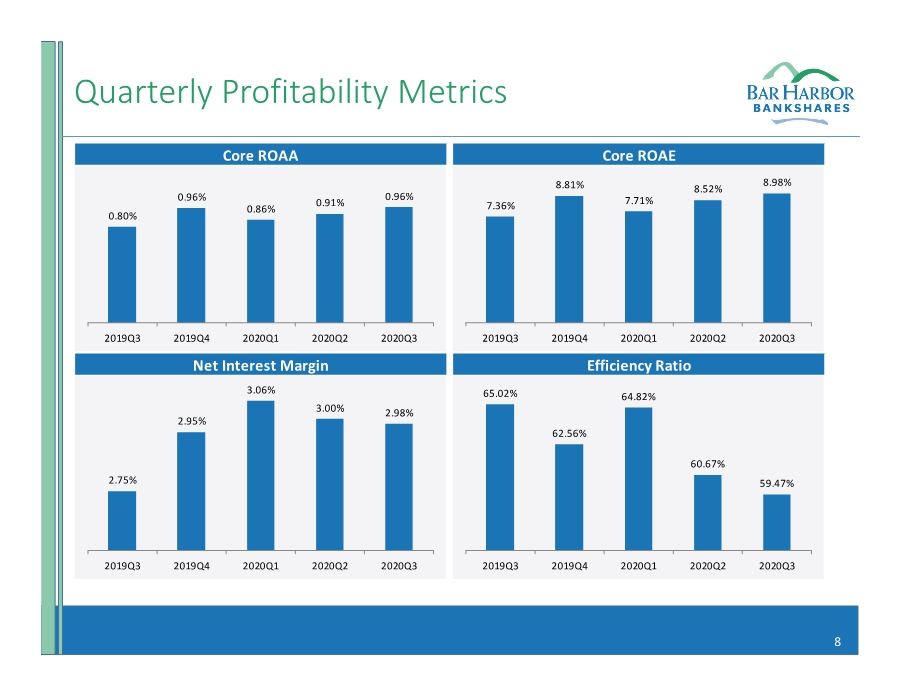
| 8 Quarterly Profitability Metrics Core ROAA Net Interest Margin Core ROAE Efficiency Ratio 0.96% 0.91% 0.86% 0.96% 0.80% 2020Q3 2020Q2 2020Q1 2019Q4 2019Q3 2.98% 3.00% 3.06% 2.95% 2.75% 2020Q3 2020Q2 2020Q1 2019Q4 2019Q3 8.98% 8.52% 7.71% 8.81% 7.36% 2020Q3 2020Q2 2020Q1 2019Q4 2019Q3 59.47% 60.67% 64.82% 62.56% 65.02% 2020Q3 2020Q2 2020Q1 2019Q4 2019Q3 |
| 9 Strengthening of the Balance Sheet Liquidity Interest Rate Risk (IRR) Positioning & Management Capital • Increased balance sheet liquidity reflecting significant wholesale borrowing capacity (FHLB and Brokered CD Market) as well as restructured investment portfolio • Continue to maintain and test external lines of credit with FHLB, Federal Reserve Bank, and other correspondent banks • Well capitalized, reflecting the refinancing and upsizing of subordinated debt in Q4 2019 • Judicious capital and balance sheet management as evidenced by the strategic shift in residential mortgage lending • Consistent and strong earnings as well as conservative interest rate risk exposures • Interest rate risk metrics are largely neutral to expected near‐term exposures • Active liability expense management (deposit betas) relative to market benchmarks |
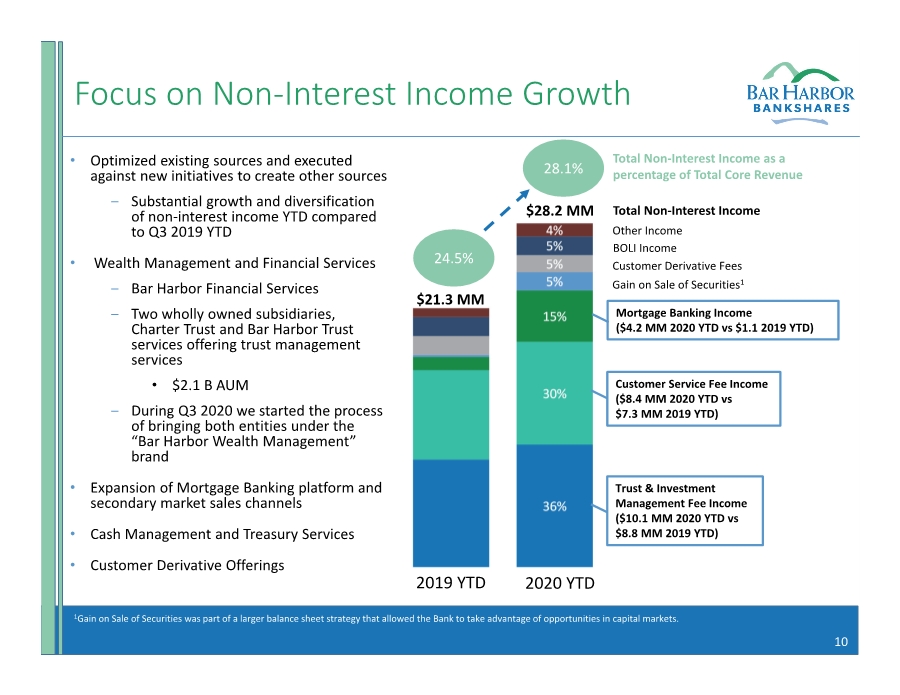
| 10 Focus on Non‐Interest Income Growth • Optimized existing sources and executed against new initiatives to create other sources ‒ Substantial growth and diversification of non‐interest income YTD compared to Q3 2019 YTD • Wealth Management and Financial Services ‒ Bar Harbor Financial Services ‒ Two wholly owned subsidiaries, Charter Trust and Bar Harbor Trust services offering trust management services • $2.1 B AUM ‒ During Q3 2020 we started the process of bringing both entities under the “Bar Harbor Wealth Management” brand • Expansion of Mortgage Banking platform and secondary market sales channels • Cash Management and Treasury Services • Customer Derivative Offerings 1Gain on Sale of Securities was part of a larger balance sheet strategy that allowed the Bank to take advantage of opportunities in capital markets. 24.5% $21.3 MM 28.1% $28.2 MM Total Non‐Interest Income as a percentage of Total Core Revenue 2019 YTD 2020 YTD Total Non‐Interest Income Other Income BOLI Income Customer Derivative Fees Gain on Sale of Securities1 Mortgage Banking Income ($4.2 MM 2020 YTD vs $1.1 2019 YTD) Customer Service Fee Income ($8.4 MM 2020 YTD vs $7.3 MM 2019 YTD) Trust & Investment Management Fee Income ($10.1 MM 2020 YTD vs $8.8 MM 2019 YTD) |
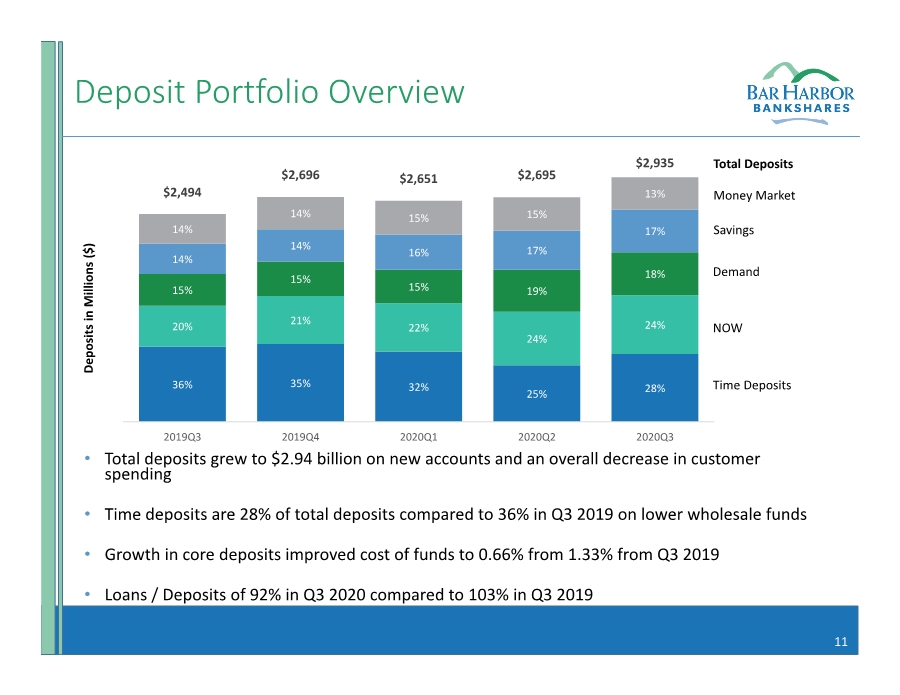
| 11 Deposit Portfolio Overview • Total deposits grew to $2.94 billion on new accounts and an overall decrease in customer spending • Time deposits are 28% of total deposits compared to 36% in Q3 2019 on lower wholesale funds • Growth in core deposits improved cost of funds to 0.66% from 1.33% from Q3 2019 • Loans / Deposits of 92% in Q3 2020 compared to 103% in Q3 2019 28% 25% 32% 35% 36% 24% 24% 22% 21% 20% 18% 19% 15% 15% 15% 17% 17% 16% 14% 14% 13% 15% 15% 14% 14% $2,494 $2,696 $2,651 $2,695 $2,935 0.0 500.0 1,000.0 1,500.0 2,000.0 2,500.0 3,000.0 0.0 500.0 1,000.0 1,500.0 2,000.0 2,500.0 3,000.0 2020Q3 2020Q2 2020Q1 2019Q4 2019Q3 Deposits in Millions ($) Total Deposits Money Market Savings Demand NOW Time Deposits |
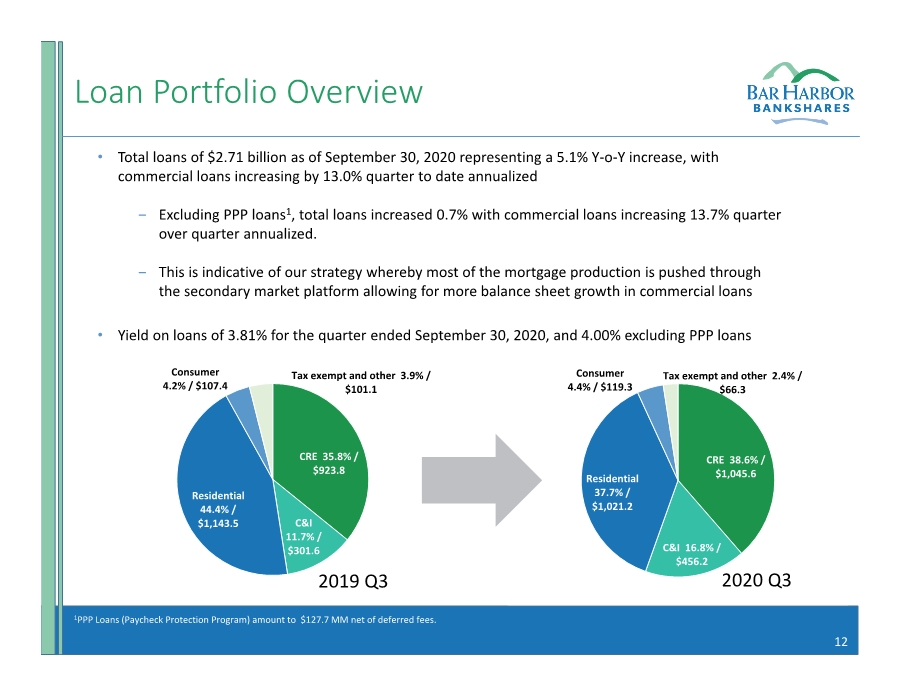
| 12 Loan Portfolio Overview • Total loans of $2.71 billion as of September 30, 2020 representing a 5.1% Y‐o‐Y increase, with commercial loans increasing by 13.0% quarter to date annualized ‒ Excluding PPP loans1, total loans increased 0.7% with commercial loans increasing 13.7% quarter over quarter annualized. ‒ This is indicative of our strategy whereby most of the mortgage production is pushed through the secondary market platform allowing for more balance sheet growth in commercial loans • Yield on loans of 3.81% for the quarter ended September 30, 2020, and 4.00% excluding PPP loans CRE 35.8% / $923.8 C&I 11.7% / $301.6 Residential 44.4% / $1,143.5 Consumer 4.2% / $107.4 Tax exempt and other 3.9% / $101.1 CRE 38.6% / $1,045.6 C&I 16.8% / $456.2 Residential 37.7% / $1,021.2 Consumer 4.4% / $119.3 Tax exempt and other 2.4% / $66.3 2020 Q3 2019 Q3 1PPP Loans (Paycheck Protection Program) amount to $127.7 MM net of deferred fees. |
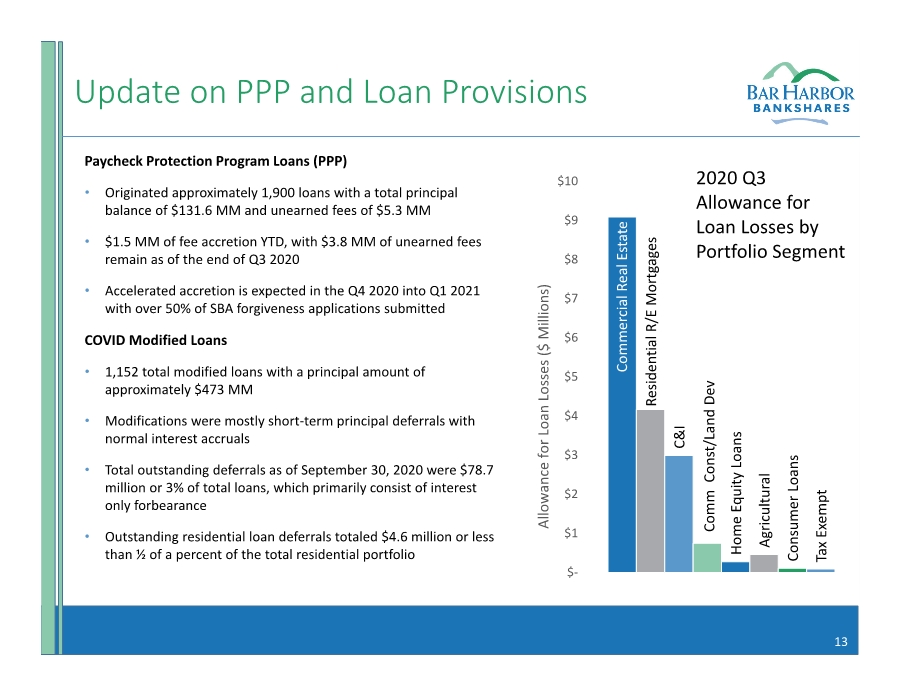
| 13 Update on PPP and Loan Provisions Paycheck Protection Program Loans (PPP) • Originated approximately 1,900 loans with a total principal balance of $131.6 MM and unearned fees of $5.3 MM • $1.5 MM of fee accretion YTD, with $3.8 MM of unearned fees remain as of the end of Q3 2020 • Accelerated accretion is expected in the Q4 2020 into Q1 2021 with over 50% of SBA forgiveness applications submitted COVID Modified Loans • 1,152 total modified loans with a principal amount of approximately $473 MM • Modifications were mostly short‐term principal deferrals with normal interest accruals • Total outstanding deferrals as of September 30, 2020 were $78.7 million or 3% of total loans, which primarily consist of interest only forbearance • Outstanding residential loan deferrals totaled $4.6 million or less than ½ of a percent of the total residential portfolio Commercial Real Estate Residential R/E Mortgages C&I Comm Const/Land Dev Home Equity Loans Agricultural Consumer Loans Tax Exempt $‐ $1 $2 $3 $4 $5 $6 $7 $8 $9 $10 Allowance for Loan Losses ($ Millions) 2020 Q3 Allowance for Loan Losses by Portfolio Segment |
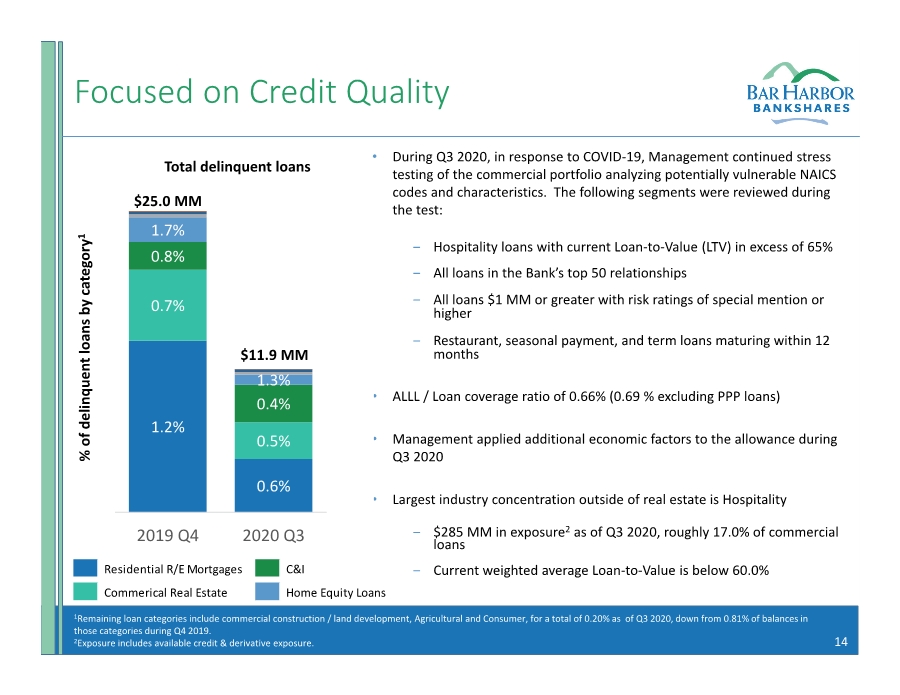
| 14 Focused on Credit Quality 1Remaining loan categories include commercial construction / land development, Agricultural and Consumer, for a total of 0.20% as of Q3 2020, down from 0.81% of balances in those categories during Q4 2019. 2Exposure includes available credit & derivative exposure. • During Q3 2020, in response to COVID‐19, Management continued stress testing of the commercial portfolio analyzing potentially vulnerable NAICS codes and characteristics. The following segments were reviewed during the test: ‒ Hospitality loans with current Loan‐to‐Value (LTV) in excess of 65% ‒ All loans in the Bank’s top 50 relationships ‒ All loans $1 MM or greater with risk ratings of special mention or higher ‒ Restaurant, seasonal payment, and term loans maturing within 12 months • ALLL / Loan coverage ratio of 0.66% (0.69 % excluding PPP loans) • Management applied additional economic factors to the allowance during Q3 2020 • Largest industry concentration outside of real estate is Hospitality ‒ $285 MM in exposure2 as of Q3 2020, roughly 17.0% of commercial loans ‒ Current weighted average Loan‐to‐Value is below 60.0% 0.6% 1.2% 0.5% 0.7% 0.4% 0.8% 1.3% 1.7% 0.0 5,000.0 10,000.0 15,000.0 20,000.0 25,000.0 2020 Q3 2019 Q4 Residential R/E Mortgages C&I Commerical Real Estate Home Equity Loans % of delinquent loans by category 1 Total delinquent loans $25.0 MM $11.9 MM |
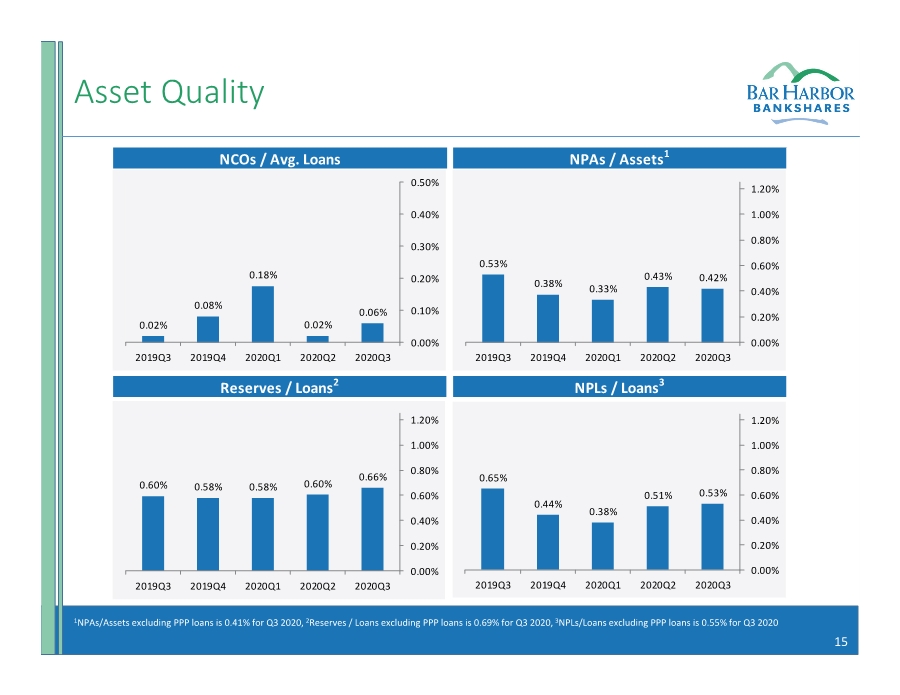
| 15 Asset Quality 1NPAs/Assets excluding PPP loans is 0.41% for Q3 2020, 2Reserves / Loans excluding PPP loans is 0.69% for Q3 2020, 3NPLs/Loans excluding PPP loans is 0.55% for Q3 2020 NCOs / Avg. Loans NPAs / Assets1 Reserves / Loans2 NPLs / Loans3 0.06% 0.02% 0.18% 0.08% 0.02% 0.00% 0.10% 0.20% 0.30% 0.40% 0.50% 2020Q3 2020Q2 2020Q1 2019Q4 2019Q3 0.42% 0.43% 0.33% 0.38% 0.53% 0.00% 0.20% 0.40% 0.60% 0.80% 1.00% 1.20% 2020Q3 2020Q2 2020Q1 2019Q4 2019Q3 0.66% 0.60% 0.58% 0.58% 0.60% 0.00% 0.20% 0.40% 0.60% 0.80% 1.00% 1.20% 2020Q3 2020Q2 2020Q1 2019Q4 2019Q3 0.53% 0.51% 0.38% 0.44% 0.65% 0.00% 0.20% 0.40% 0.60% 0.80% 1.00% 1.20% 2020Q3 2020Q2 2020Q1 2019Q4 2019Q3 |
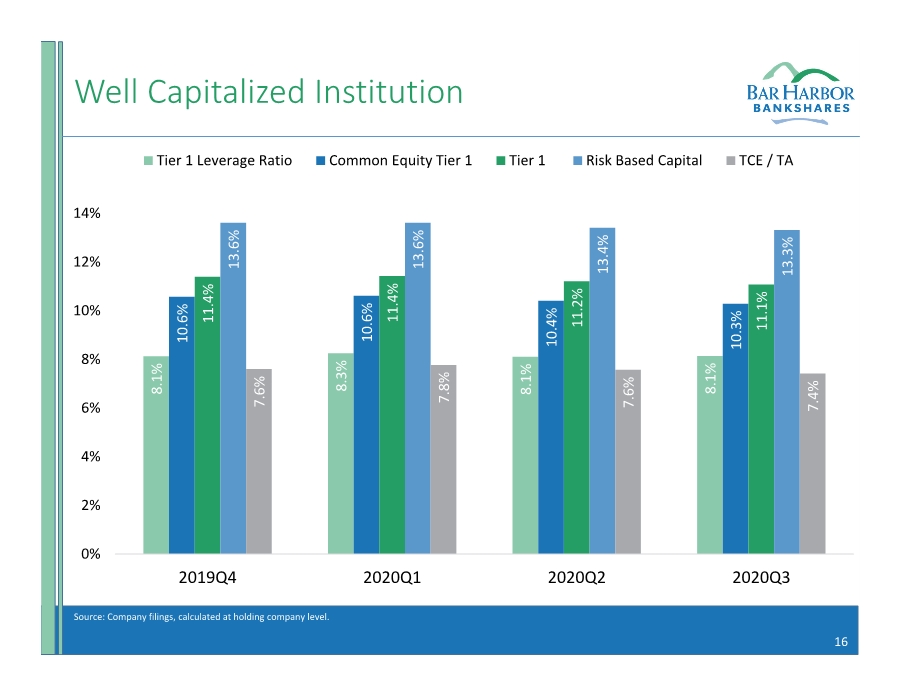
| 16 Well Capitalized Institution Source: Company filings, calculated at holding company level. 8.1% 8.3% 8.1% 8.1% 10.6% 10.6% 10.4% 10.3% 11.4% 11.4% 11.2% 11.1% 13.6% 13.6% 13.4% 13.3% 7.6% 7.8% 7.6% 7.4% 0% 2% 4% 6% 8% 10% 12% 14% 2019Q4 2020Q1 2020Q2 2020Q3 Tier 1 Leverage Ratio Common Equity Tier 1 Tier 1 Risk Based Capital TCE / TA |
| 17 Investment Considerations • Focused on building franchise value • Deep and talented management team • Team, platform and strategy in place to generate efficient growth • Profitable and efficient business model • Clear vision to grow core loan/deposit business • Development and expansion of non‐interest income revenue • Proven ability to grow organically and via acquisitions • Disciplined credit quality and a conservative risk management culture • Consistent dividend payments to shareholders with an attractive yield |
| 18 Legal Disclaimer Forward Looking Statements This presentation contains “forward‐looking statements” within the meaning of the Private Securities Litigation Reform Act of 1995. Forward‐looking statements can be identified by words such as “believes,” “anticipates,” “expects,” “intends,” “targeted,” “continue,” “remain,” “will,” “should,” “may,” “plans,” “estimates,” and similar references to future periods; however, such words are not the exclusive means of identifying such statements. Examples of forward‐looking statements include, but are not limited to: (i) projections of revenues, expenses, income or loss, earnings or loss per share, and other financial items; (ii) statements of plans, objectives, and expectations of the Company or its management or Board of Directors; (iii) statements of future economic performance; and (iv) statements of assumptions underlying such statements. Forward‐looking statements are based on the Company’s current expectations and assumptions regarding its business, the economy, and other future conditions. Because forward‐looking statements relate to the future, they are subject to inherent uncertainties, risks, and changes in circumstances that are difficult to predict. The Company’s actual results may differ materially from those contemplated by the forward‐looking statements, which are neither statements of historical fact nor guarantees or assurances of future performance. For more information about factors, such as the ongoing COVID ‐19 pandemic and the governmental and other responses thereto, that could cause actual results to differ from those discussed in the forward‐looking statements please refer to the information disclosed under “Forward‐Looking Statements”, “Risk Factors” and “Management’s Discussion and Analysis of Financial Condition and Results of Operations” and elsewhere in the Company’s public filings with the Securities and Exchange Commission, including the Company’s Annual Report on Form 10‐K and Quarterly Reports on Form 10‐Q. Any forward‐looking statement made by the Company in this presentation speaks only as of the date on which it is made. Factors or events that could cause the Company’s actual results to differ may emerge from time to time, and it is not possible for the Company to predict all of them. The Company undertakes no obligation to publicly update any forward‐looking statement, whether as a result of new information, future developments, or otherwise, except as may be required by law. Non‐GAAP Financial Measures This presentation contains both financial measures based on accounting principles generally accepted in the United States (“GAAP”) and non‐GAAP based financial measures, which are used where management believes them to be helpful in understanding the Company’s results of operations or financial position. Reconciliations of these non‐GAAP financial measures, to the most comparable GAAP measures are included in this presentation under “Non‐GAAP to GAAP Reconciliations” and in the Company’s earnings release available in the Investor Relations portion of the Company’s website at www.barharbor.bank. These disclosures should not be viewed as a substitute for operating results determined in accordance with GAAP, nor are they necessarily comparable to non‐GAAP performance measures that may be presented by other companies. |
| Appendix |

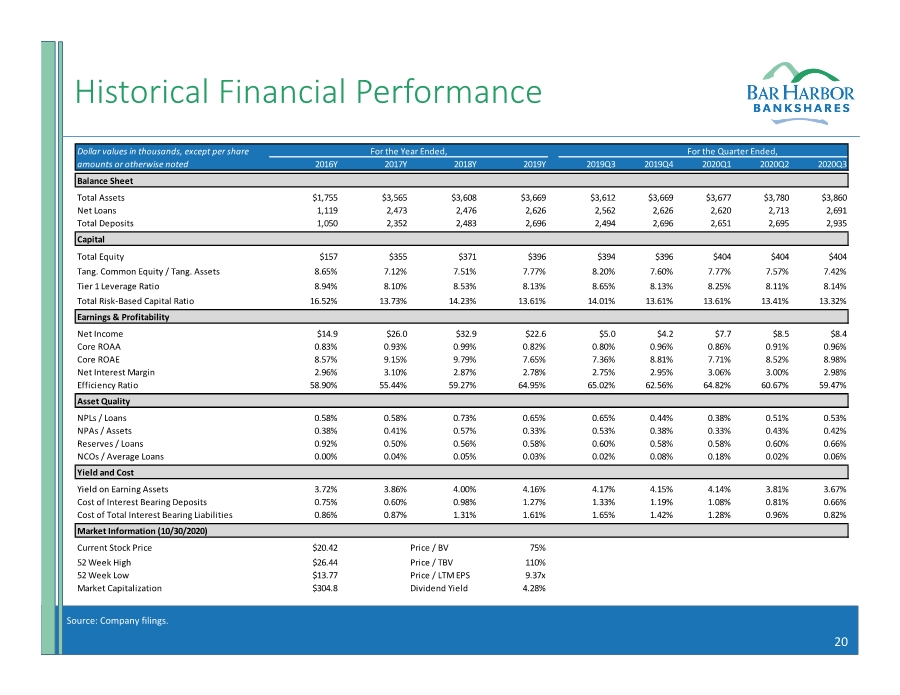
| 20 Historical Financial Performance Source: Company filings. 2016Y 2017Y 2018Y 2019Y 2019Q3 2019Q4 2020Q1 2020Q2 2020Q3 Total Assets $1,755 $3,565 $3,608 $3,669 $3,612 $3,669 $3,677 $3,780 $3,860 Net Loans 1,119 2,473 2,476 2,626 2,562 2,626 2,620 2,713 2,691 Total Deposits 1,050 2,352 2,483 2,696 2,494 2,696 2,651 2,695 2,935 Total Equity $157 $355 $371 $396 $394 $396 $404 $404 $404 Tang. Common Equity / Tang. Assets 8.65% 7.12% 7.51% 7.77% 8.20% 7.60% 7.77% 7.57% 7.42% Tier 1 Leverage Ratio 8.94% 8.10% 8.53% 8.13% 8.65% 8.13% 8.25% 8.11% 8.14% Total Risk‐Based Capital Ratio 16.52% 13.73% 14.23% 13.61% 14.01% 13.61% 13.61% 13.41% 13.32% Net Income $14.9 $26.0 $32.9 $22.6 $5.0 $4.2 $7.7 $8.5 $8.4 Core ROAA 0.83% 0.93% 0.99% 0.82% 0.80% 0.96% 0.86% 0.91% 0.96% Core ROAE 8.57% 9.15% 9.79% 7.65% 7.36% 8.81% 7.71% 8.52% 8.98% Net Interest Margin 2.96% 3.10% 2.87% 2.78% 2.75% 2.95% 3.06% 3.00% 2.98% Efficiency Ratio 58.90% 55.44% 59.27% 64.95% 65.02% 62.56% 64.82% 60.67% 59.47% NPLs / Loans 0.58% 0.58% 0.73% 0.65% 0.65% 0.44% 0.38% 0.51% 0.53% NPAs / Assets 0.38% 0.41% 0.57% 0.33% 0.53% 0.38% 0.33% 0.43% 0.42% Reserves / Loans 0.92% 0.50% 0.56% 0.58% 0.60% 0.58% 0.58% 0.60% 0.66% NCOs / Average Loans 0.00% 0.04% 0.05% 0.03% 0.02% 0.08% 0.18% 0.02% 0.06% Yield on Earning Assets 3.72% 3.86% 4.00% 4.16% 4.17% 4.15% 4.14% 3.81% 3.67% Cost of Interest Bearing Deposits 0.75% 0.60% 0.98% 1.27% 1.33% 1.19% 1.08% 0.81% 0.66% Cost of Total Interest Bearing Liabilities 0.86% 0.87% 1.31% 1.61% 1.65% 1.42% 1.28% 0.96% 0.82% Current Stock Price $20.42 Price / BV 75% 52 Week High $26.44 Price / TBV 110% 52 Week Low $13.77 Price / LTM EPS 9.37x Market Capitalization $304.8 Dividend Yield 4.28% Capital Earnings & Profitability Asset Quality Yield and Cost Market Information (10/30/2020) For the Year Ended, For the Quarter Ended, Dollar values in thousands, except per share amounts or otherwise noted Balance Sheet |
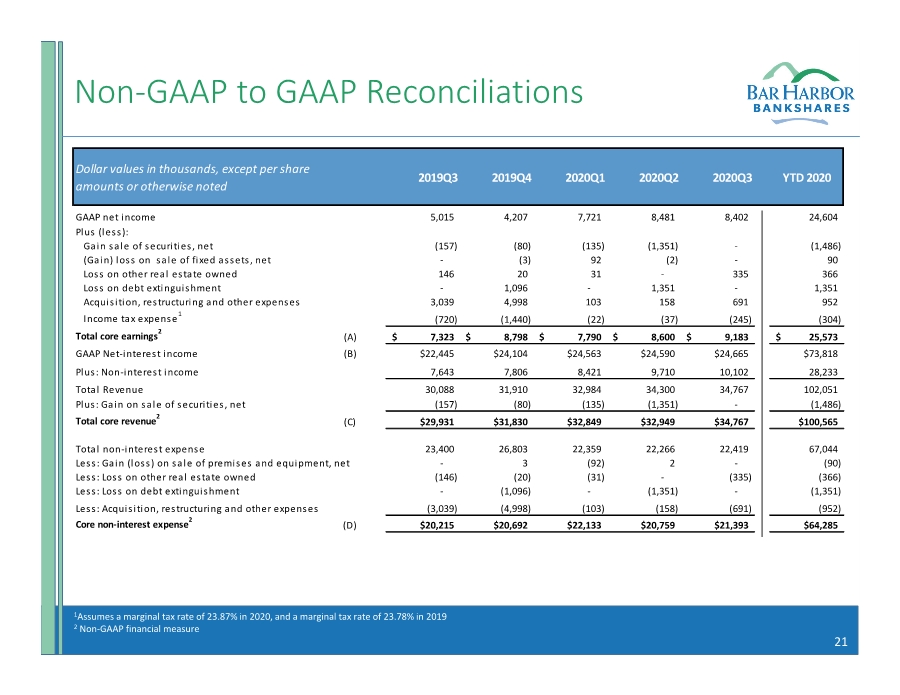
| 21 Non‐GAAP to GAAP Reconciliations 1Assumes a marginal tax rate of 23.87% in 2020, and a marginal tax rate of 23.78% in 2019 2 Non‐GAAP financial measure GAAP net income 5,015 4,207 7,721 8,481 8,402 24,604 Plus (less): Gain sale of securities, net (157) (80) (135) (1,351) ‐ (1,486) (Gain) loss on sale of fixed assets, net ‐ (3) 92 (2) ‐ 90 Loss on other real estate owned 146 20 31 ‐ 335 366 Loss on debt extinguishment ‐ 1,096 ‐ 1,351 ‐ 1,351 Acquisition, restructuring and other expenses 3,039 4,998 103 158 691 952 Income tax expense1 (720) (1,440) (22) (37) (245) (304) Total core earnings2 (A) 7,323 $ 8,798 $ 7,790 $ 8,600 $ 9,183 $ 25,573 $ GAAP Net‐interest income (B) $22,445 $24,104 $24,563 $24,590 $24,665 $73,818 Plus: Non‐interest income 7,643 7,806 8,421 9,710 10,102 28,233 Total Revenue 30,088 31,910 32,984 34,300 34,767 102,051 Plus: Gain on sale of securities, net (157) (80) (135) (1,351) ‐ (1,486) Total core revenue2 (C) $29,931 $31,830 $32,849 $32,949 $34,767 $100,565 Total non‐interest expense 23,400 26,803 22,359 22,266 22,419 67,044 Less: Gain (loss) on sale of premises and equipment, net ‐ 3 (92) 2 ‐ (90) Less: Loss on other real estate owned (146) (20) (31) ‐ (335) (366) Less: Loss on debt extinguishment ‐ (1,096) ‐ (1,351) ‐ (1,351) Less: Acquisition, restructuring and other expenses (3,039) (4,998) (103) (158) (691) (952) Core non‐interest expense2 (D) $20,215 $20,692 $22,133 $20,759 $21,393 $64,285 YTD 2020 Dollar values in thousands, except per share amounts or otherwise noted 2020Q3 2020Q2 2020Q1 2019Q4 2019Q3 |
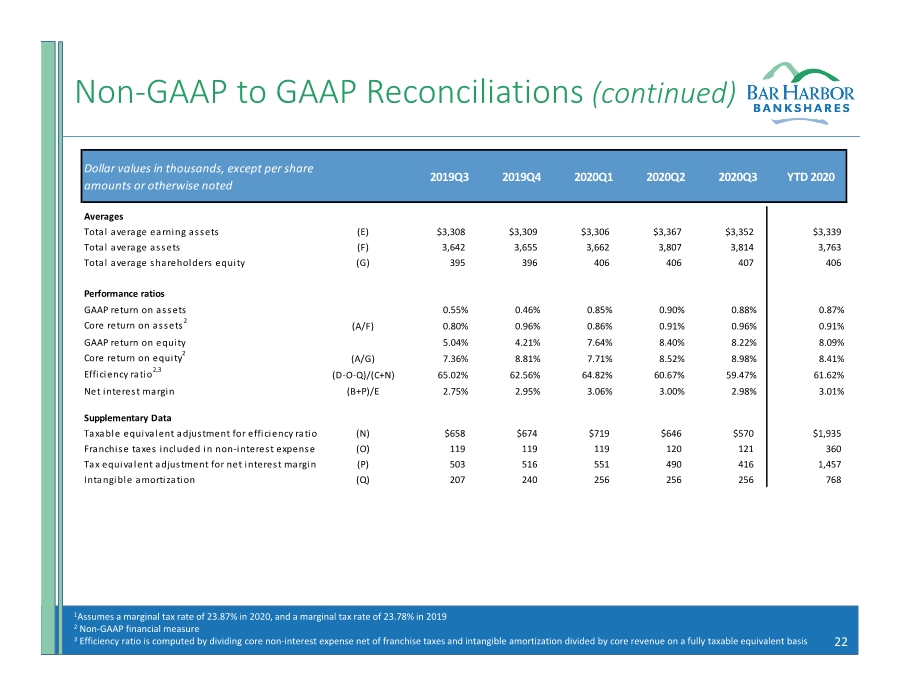
| 22 Non‐GAAP to GAAP Reconciliations (continued) Averages Total average earning assets (E) $3,308 $3,309 $3,306 $3,367 $3,352 $3,339 Total average assets (F) 3,642 3,655 3,662 3,807 3,814 3,763 Total average shareholders equity (G) 395 396 406 406 407 406 Performance ratios GAAP return on assets 0.55% 0.46% 0.85% 0.90% 0.88% 0.87% Core return on assets2 (A/F) 0.80% 0.96% 0.86% 0.91% 0.96% 0.91% GAAP return on equity 5.04% 4.21% 7.64% 8.40% 8.22% 8.09% Core return on equity2 (A/G) 7.36% 8.81% 7.71% 8.52% 8.98% 8.41% Efficiency ratio2,3 (D‐O‐Q)/(C+N) 65.02% 62.56% 64.82% 60.67% 59.47% 61.62% Net interest margin (B+P)/E 2.75% 2.95% 3.06% 3.00% 2.98% 3.01% Supplementary Data Taxable equivalent adjustment for efficiency ratio (N) $658 $674 $719 $646 $570 $1,935 Franchise taxes included in non‐interest expense (O) 119 119 119 120 121 360 Tax equivalent adjustment for net interest margin (P) 503 516 551 490 416 1,457 Intangible amortization (Q) 207 240 256 256 256 768 2020Q3 YTD 2020 Dollar values in thousands, except per share amounts or otherwise noted 2019Q3 2019Q4 2020Q1 2020Q2 1Assumes a marginal tax rate of 23.87% in 2020, and a marginal tax rate of 23.78% in 2019 2 Non‐GAAP financial measure 3 Efficiency ratio is computed by dividing core non‐interest expense net of franchise taxes and intangible amortization divided by core revenue on a fully taxable equivalent basis |
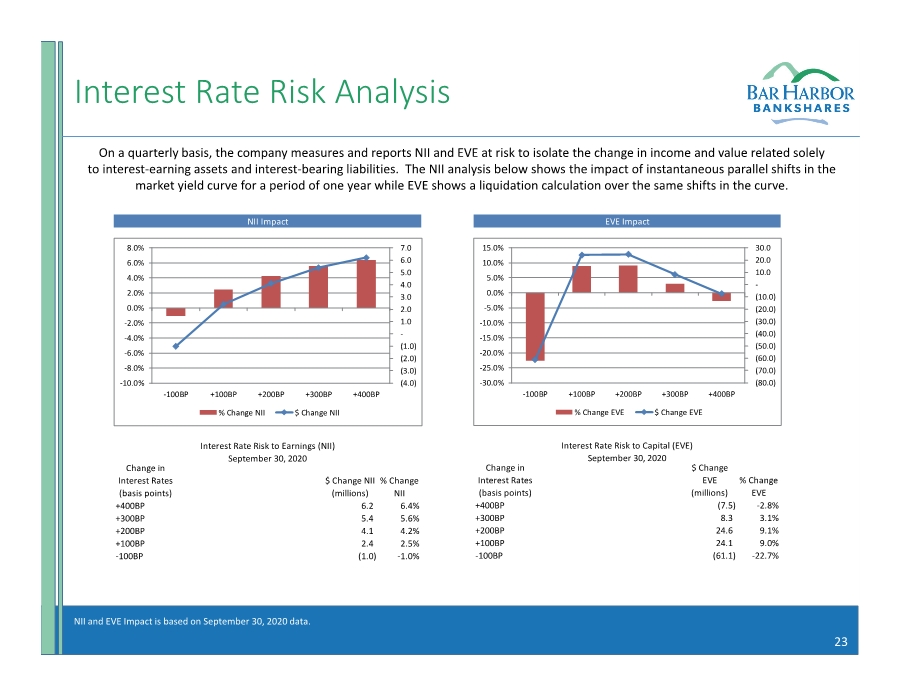
| 23 Interest Rate Risk Analysis On a quarterly basis, the company measures and reports NII and EVE at risk to isolate the change in income and value related solely to interest‐earning assets and interest‐bearing liabilities. The NII analysis below shows the impact of instantaneous parallel shifts in the market yield curve for a period of one year while EVE shows a liquidation calculation over the same shifts in the curve. NII and EVE Impact is based on September 30, 2020 data. Change in Interest Rates (basis points) $ Change NII (millions) % Change NII +400BP 6.2 6.4% +300BP 5.4 5.6% +200BP 4.1 4.2% +100BP 2.4 2.5% ‐100BP (1.0) ‐1.0% Interest Rate Risk to Earnings (NII) September 30, 2020 NII Impact (4.0) (3.0) (2.0) (1.0) ‐ 1.0 2.0 3.0 4.0 5.0 6.0 7.0 ‐10.0% ‐8.0% ‐6.0% ‐4.0% ‐2.0% 0.0% 2.0% 4.0% 6.0% 8.0% ‐100BP +100BP +200BP +300BP +400BP % Change NII $ Change NII Change in Interest Rates (basis points) $ Change EVE (millions) % Change EVE +400BP (7.5) ‐2.8% +300BP 8.3 3.1% +200BP 24.6 9.1% +100BP 24.1 9.0% ‐100BP (61.1) ‐22.7% EVE Impact Interest Rate Risk to Capital (EVE) September 30, 2020 (80.0) (70.0) (60.0) (50.0) (40.0) (30.0) (20.0) (10.0) ‐ 10.0 20.0 30.0 ‐30.0% ‐25.0% ‐20.0% ‐15.0% ‐10.0% ‐5.0% 0.0% 5.0% 10.0% 15.0% ‐100BP +100BP +200BP +300BP +400BP % Change EVE $ Change EVE |