Attached files
| file | filename |
|---|---|
| 8-K - CURRENT REPORT - TherapeuticsMD, Inc. | txmd-8k_110920.htm |
| EX-99.1 - PRESS RELEASE FROM THERAPEUTICSMD, INC. - TherapeuticsMD, Inc. | ex99-1.htm |
Exhibit 99.2

FOR INVESTOR PRESENTATION PURPOSES ONLY. 3Q 2020 Earnings November 9, 2020

FOR INVESTOR PRESENTATION PURPOSES ONLY. Forward - Looking Statements This presentation by TherapeuticsMD, Inc . (referred to as “we,” “our,” or “the Company”) may contain forward - looking statements . Forward - looking statements may include, but are not limited to, statements relating to our objectives, plans and strategies, as well as statements, other than historical facts, that address activities, events or developments that we intend, expect, project, believe or anticipate will or may occur in the future . These statements are often characterized by terminology such as “believe,” “hope,” “may,” “anticipate,” “should,” “intend,” “plan,” “will,” “expect,” “estimate,” “project,” “positioned,” “strategy” and similar expressions and are based on assumptions and assessments made in light of our managerial experience and perception of historical trends, current conditions, expected future developments and other factors we believe to be appropriate . Forward - looking statements in this presentation are made as of the date of this presentation, and we undertake no duty to update or revise any such statements, whether as a result of new information, future events or otherwise . Forward - looking statements are not guarantees of future performance and are subject to risks and uncertainties, many of which may be outside of our control . Important factors that could cause actual results, developments and business decisions to differ materially from forward - looking statements are described in the sections titled “Risk Factors” in our filings with the Securities and Exchange Commission (SEC), including our most recent Annual Report on Form 10 - K and Quarterly Reports on Form 10 - Q, as well as our current reports on Form 8 - K, and include the following : the company’s ability to protect the intellectual property related to its products ; the effects of the COVID - 19 pandemic ; the company’s ability to maintain or increase sales of its products ; the company’s ability to develop and commercialize IMVEXXY®, ANNOVERA®, and BIJUVA® and obtain additional financing necessary therefor ; whether the company will be able to comply with the covenants and conditions under its term loan facility ; whether the company will be able to successfully divest its vitaCare business and the proceeds that may be generated by such divestiture ; the potential of adverse side effects or other safety risks that could adversely affect the commercialization of the company’s current or future approved products or preclude the approval of the company’s future drug candidates ; whether the FDA will approve the efficacy supplement for the lower dose of BIJUVA ; the company’s ability to protect its intellectual property, including with respect to the Paragraph IV notice letters the company received regarding IMVEXXY and BIJUVA ; the length, cost and uncertain results of future clinical trials ; the company’s reliance on third parties to conduct its manufacturing, research and development and clinical trials ; the ability of the company’s licensees to commercialize and distribute the company’s products ; the ability of the company’s marketing contractors to market ANNOVERA ; the availability of reimbursement from government authorities and health insurance companies for the company’s products ; the impact of product liability lawsuits ; the influence of extensive and costly government regulation ; the volatility of the trading price of the company’s common stock and the concentration of power in its stock ownership . This non - promotional presentation is intended for investor audiences only . 2

FOR INVESTOR PRESENTATION PURPOSES ONLY. Strategic Overview 3

FOR INVESTOR PRESENTATION PURPOSES ONLY. 3Q 2020 and Recent Highlights Increased net revenue across product portfolio from 2Q20 to 3Q20 ✓ Total net revenue increased 80% from 2Q20 to ~$19.3M in 3Q20 ✓ Net revenue per unit held or improved Reestablished growth in new prescriptions ( NRx ) and total prescriptions ( TRx ) from 2Q20 to 3Q20 ✓ ANNOVERA TRx increased ~115% ✓ IMEXXY TRx increased ~11%; IMVEXXY NRx increased ~32% ✓ BIJUVA TRx increased ~16%; BIJUVA NRx increased ~59% Reduced operating expenses and cash burn from 2Q to 3Q20 ✓ Operating expenses, excluding non - cash items, decreased by ~$11M from 2Q20 to ~$37M in 3Q20 ✓ Net cash used in operating activities decreased by $22M from $55.9M in 2Q20 to ~$34M in 3Q20 Expanded U.S. patent protection for product portfolio with Orange Book listed patents x 2 new ANNOVERA listed patents (5 patent applications pending; 3 patents listed in the Orange Book, which expire as late as 20 39) x 1 new IMVEXXY listed patent issued (17 patent applications pending; 9 patents listed in the Orange Book, which expire as late as 2033) x 1 new BIJUVA listed patent (10 patent applications pending; 15 patents listed in the Orange Book, which expire as late as 203 2) 4
FOR INVESTOR PRESENTATION PURPOSES ONLY. 3Q20 Financial Overview 5

FOR INVESTOR PRESENTATION PURPOSES ONLY. $0 $2 $4 $6 $8 $10 $12 $14 $16 $18 $20 2Q20 3Q20 Quarterly Net Revenue Trends Millions 3 Q20 Highlights ▪ Overall Net Revenue from Products increased 62% quarter over quarter: ▪ ANNOVERA increased ~250% ▪ Average net revenue per unit ~$1,339 ▪ IMVEXXY increased ~35% ▪ Average net revenue per unit ~$51 ▪ BIJUVA increased ~22% ▪ Average net revenue per unit ~$47 $10.7 $ 19.3 Quarterly Net Revenue 6 (1) Average net revenue per unit calculated based on units sold to wholesalers and pharmacies divided into net revenue for the quarter 80%

FOR INVESTOR PRESENTATION PURPOSES ONLY. Financial Results: Comparison 3Q 2020 to 2Q 2020 Note: (1) E xcluding non - cash items ▪ Gross Margin returned to normal level of ~81% ▪ Operating expenses, excluding non - cash items, decreased $11M from $48.1M in 2Q20 to $37.1M in 3Q20 ▪ Net loss improved by $19.3M from ($51.9M) in 2Q20 to ($32.6M) in 3Q20 ▪ Net loss improved by $19.4M and cash used in operations improved by $21.9M ▪ Net cash used in operating activities decreased by $22M from $55.9M in 2Q20 to ~$34M in 3Q20 3Q20 2Q20 Increase (Decrease) Balance Sheet Cash $79,634 $113,839 ($34,205) Working Capital $75,114 $102,460 ($27,346) Long - term Debt $237,051 $243,802 ($6,751) Income Statement Net Product Revenue $17,343 $10,701 $6,642 Gross Profit from Products $14,064 $6,301 $7,763 % of Gross Margin 81% 59% Total Operating Expenses (1) $37,061 $48,080 ($11,019) Net loss ($32,611) ($51,977) $19,366 Statement of Cash Flow Net Cash Used In Operating Activities ($34,049) ($55,990) $21,941 Comparison of Key Financial Statement Items [in 1,000’s] 7

FOR INVESTOR PRESENTATION PURPOSES ONLY. 8 Potential vitaCare Divesture ▪ vitaCare makes a complex process of filling prescriptions simple, cost - effective, and stress free for patients ▪ In recent months, COVID - 19 has highlighted the value of pharmaceutical companies being able to connect directly with patients ▪ This in combination with the rise of interest and investment in both HUB service and pharmacy service companies has driven outside interest in vitaCare ▪ Goal to unlock substantial value for our shareholders by divesting vitaCare to a partner who can capitalize the business opportunity ▪ Based on initial indications received, we believe the enterprise value of vitaCare with the right partner can be upwards of $100M, and, depending on the ultimate transaction structure, could generate at least $50M in non - dilutive proceeds to TherapeuticsMD, while also retaining an interest in the newly - capitalized business ▪ We intend that current vitaCare Management will remain with vitaCare to ensure current service level for TherapeuticsMD and new customers ▪ Company has retained Greenhill & Co. as an advisor for the transaction

FOR INVESTOR PRESENTATION PURPOSES ONLY. Payor Progress 9
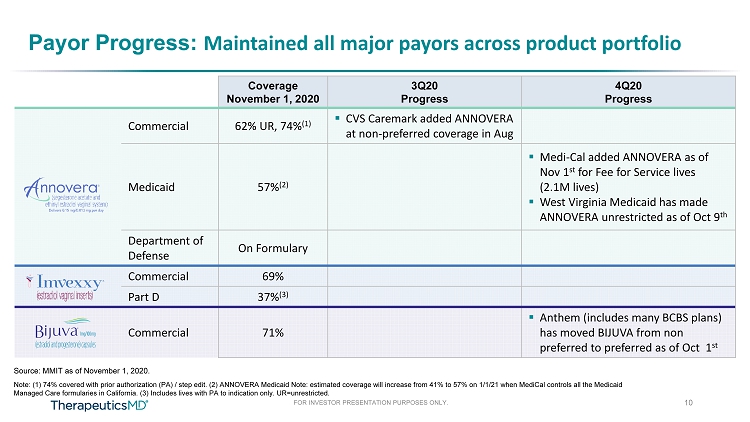
FOR INVESTOR PRESENTATION PURPOSES ONLY. Payor Progress: Maintained all major payors across product portfolio Coverage November 1, 2020 3Q20 Progress 4Q20 Progress Commercial 62% UR, 74% (1) ▪ CVS Caremark added ANNOVERA at non - preferred coverage in Aug Medicaid 57% (2) ▪ Medi - Cal added ANNOVERA as of Nov 1 st for Fee for Service lives (2.1M lives) ▪ West Virginia Medicaid has made ANNOVERA unrestricted as of Oct 9 th Department of Defense On Formulary Commercial 69% Part D 37% (3) Commercial 71% ▪ Anthem (includes many BCBS plans) has moved BIJUVA from non preferred to preferred as of Oct 1 st 10 Note: (1) 74% covered with prior authorization (PA) / step edit. (2) ANNOVERA Medicaid Note: estimated coverage will increase from 41% to 57% on 1/1/21 when MediCal controls all the Medicaid Managed Care formularies in California. (3) Includes lives with PA to indication only. UR=unrestricted. Source: MMIT as of November 1, 2020.

FOR INVESTOR PRESENTATION PURPOSES ONLY. Payor Progress and Birth Control State Laws Supporting Low Out of Pocket Cost ▪ ANNOVERA costs the same or less than the generic for NuvaRing on an annual basis (1) 11 Patient Cost # of Patients % of Patients $0 1434 79.67% $1 - 60 299 16.61% $61 - 100 33 1.83% >$200 34 1.89% Grand Total 1800 100.00% 80% Paid $0 17 % paid between $ 1 - $ 60 per year 80 % of our vitaCare ANNOVERA patients paid $ 0 per year Note: (1) Internal data from a cross section of commercial payors.

FOR INVESTOR PRESENTATION PURPOSES ONLY. 12 ANNOVERA Market Share Shift ▪ For the contraceptive class, ANNOVERA will be the preferred branded contraceptive vaginal ring agent ▪ NuvaRing® excluded from formulary Gained preferred coverage with one of the top pharmaceutical benefit managers (PBM) with ~20% of commercial lives effective Jan 1 st :

FOR INVESTOR PRESENTATION PURPOSES ONLY. 13 IMVEXXY Market Share Shift ▪ For the VVA class, IMVEXXY will be the only branded agent on formulary ▪ Premarin Cream ® , Intrarosa ® , Osphena ® and Estring ® all excluded from formulary Gained preferred coverage with one of the top pharmaceutical benefit managers (PBM) with ~20% of commercial lives effective Jan 1 st :

FOR INVESTOR PRESENTATION PURPOSES ONLY. COVID - 19 Reality 14

FOR INVESTOR PRESENTATION PURPOSES ONLY. Sales Force Ability to Connect with Prescribers is Increasing but still Significantly Down from Pre - COVID Levels 15 3% - 49% - 44% - 2% - 19% - 19% -55% -45% -35% -25% -15% -5% 5% Baseline 4th QTR 2019 January & February 2020 April & May 2020 August & September 2020 Average Reach to Targets Average Frequency to Targets Trend of Salesforce Reach and Frequency from Baseline Baseline (4Q19) ▪ In a normal calendar year, we would expect to see 10 - 15% of patients switch to new contraceptives (1) ▪ However, due to COVID - 19, we expect a much lower percentage of patients switching due to lower prescriber visits (2) Note: (1) 2018 multi - sponsor contraceptive study; (2) Consumer C - Space Community.

FOR INVESTOR PRESENTATION PURPOSES ONLY. Approach to Managing Business with Less Prescriber Access Consumer Marketing to Drive Patient Requests Virtual Detailing and Medical Education Programs Channels that Support Patient Requests Prescriber Surround Sound Education to keep TXMD Brands Top of Mind 16 Virtual Detailing and Programs if Access or Time is Limited

FOR INVESTOR PRESENTATION PURPOSES ONLY. Key Performance Metrics for Portfolio 17
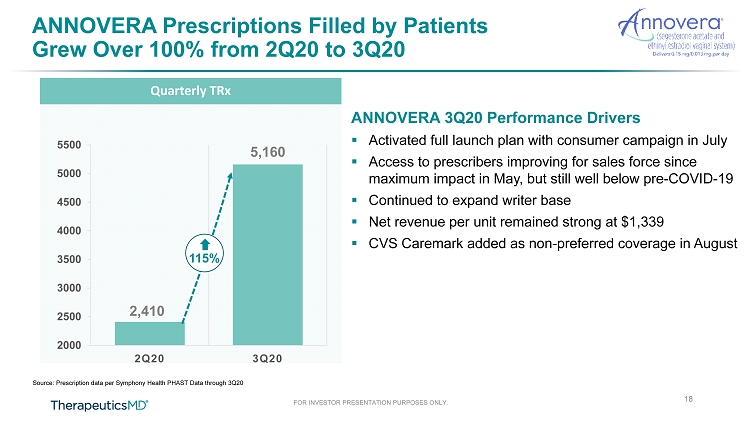
FOR INVESTOR PRESENTATION PURPOSES ONLY. 2,410 5,160 2000 2500 3000 3500 4000 4500 5000 5500 2Q20 3Q20 ANNOVERA 3Q20 Performance Drivers ▪ Activated full launch plan with consumer campaign in July ▪ Access to prescribers improving for sales force since maximum impact in May, but still well below pre - COVID - 19 ▪ Continued to expand writer base ▪ Net revenue per unit remained strong at $1,339 ▪ CVS Caremark added as non - preferred coverage in August Quarterly TRx ANNOVERA Prescriptions Filled by Patients Grew Over 100% from 2Q20 to 3Q20 Source: Prescription data per Symphony Health PHAST Data through 3Q20 18 115%

FOR INVESTOR PRESENTATION PURPOSES ONLY. 1,100 2,400 0 500 1000 1500 2000 2500 2Q20 3Q20 Quarterly Increase in ANNOVERA Writers Continued to Expand the Base of Writers for ANNOVERA Despite COVID - 19 Source: Prescription data per Symphony Health PHAST Data through 3Q20 19 118% ANNOVERA Quarterly Writer Trends ▪ Percentage of writers with more than one fill increased to 42% from 32% 3Q20 over 2Q20 ▪ Repeat writers from 2Q20 doubled their average volume in 3Q20 (from 3.4 to 6.4 avg units per writer)
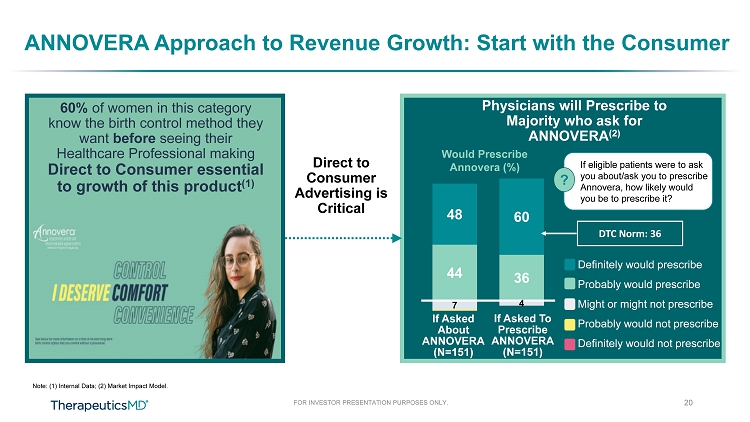
FOR INVESTOR PRESENTATION PURPOSES ONLY. ANNOVERA Approach to Revenue Growth: Start with the Consumer Note: (1) Internal Data; (2) Market Impact Model. 60% of women in this category know the birth control method they want before seeing their Healthcare Professional making Direct to Consumer essential to growth of this product (1) Physicians will Prescribe to Majority who ask for ANNOVERA (2) 44 36 48 60 7 4 Would Prescribe Annovera (%) Definitely would prescribe Probably would prescribe Might or might not prescribe Probably would not prescribe Definitely would not prescribe If eligible patients were to ask you about/ask you to prescribe Annovera, how likely would you be to prescribe it? DTC Norm: 36 If Asked About ANNOVERA (N=151) If Asked To Prescribe ANNOVERA (N=151) Direct to Consumer Advertising is Critical ? 20
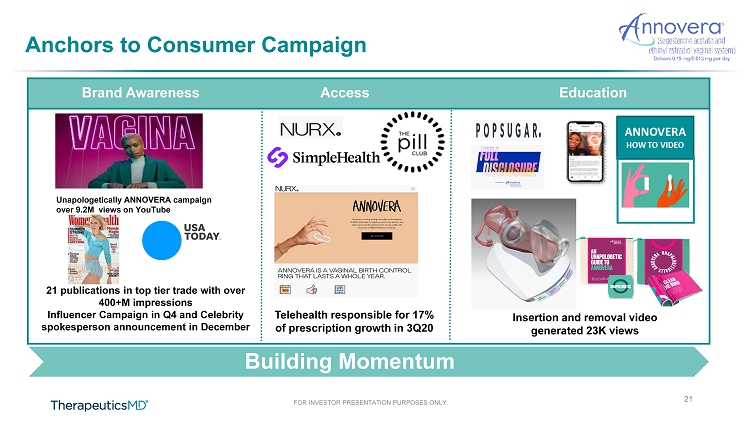
FOR INVESTOR PRESENTATION PURPOSES ONLY. Anchors to Consumer Campaign Building Momentum Unapologetically ANNOVERA campaign over 9.2M views on YouTube Brand Awareness Access Education 21 publications in top tier trade with over 400+M impressions Influencer Campaign in Q4 and Celebrity spokesperson announcement in December Telehealth responsible for 17% of prescription growth in 3Q20 Insertion and removal video generated 23K views 21

FOR INVESTOR PRESENTATION PURPOSES ONLY. Anchors to Prescriber Initiatives J Building Momentum Field Force Promotion Brand Awareness Peer to Peer Engagement 33 virtual speaker programs O ver 500+ attendees to date Sales force promoting ANNOVERA in primary position 80% of Prescribers felt the Owned and Operated Campaign was relevant and motivating 1 Media efforts beat industry standard benchmarks 22 Note:(1) Internal research

FOR INVESTOR PRESENTATION PURPOSES ONLY. Note: (1) Based on patients who filled prescription through vitaCare Prescription Services which is representative of all pre scr iptions filled. Definition of refill is patients who filled through VPS initially and either filled 2 nd through VPS or we had approved prescription from HCP and insurance but patient requested transferred to a retail pharmacy. Patient Satisfaction and Low Out of Pocket Cost for Patients Leads to Strong Refill Rates: Very Low Out of Pocket Cost 1 ▪ 80% of ANNOVERA patients paid $0 Copay per year ▪ 17% paid between $1 to $60 Copay per year 23 Strong Refill Rates 1 ▪ After 1 year of use: Intent to refill high in 1,036 women: Phase 3 acceptability study (1) 75% of the women indicated that they would consider using ANNOVERA, even if they had to pay for it 85% of the women indicated that they would consider using ANNOVERA if it were free Very high Intent to Refill in Phase 3 Acceptability Study 343 patients eligible for Refill (initially filled in Sept, Oct and Nov 2019) ▪ 148 have received their refill ▪ 54 patients have requested a refill & pending prescribers approval 59% refill rate as of 11/3

FOR INVESTOR PRESENTATION PURPOSES ONLY. Medicaid market ~15% of all contraceptive sales US Military market ~3% of all contraceptive sales Telemedicine Platforms Large/Growing Segment Secondary Channels Supplement TherapeuticsMD Sales Force ~135 Reps and Managers Delivering our Current ANNOVERA Volume 18.8M women on birth control annually Note: All trademarks are the property of their respective owners . Source: Symphony Health PHAST Data and Government Reporting for Medicaid and TriCare Secondary Channels Designed to Amplify Growth for ANNOVERA in 2021 24

FOR INVESTOR PRESENTATION PURPOSES ONLY. 25 Source: Prescription data per Symphony Health PHAST Data through 10/31/2020 IMVEXXY Weekly NRx Thousands IMVEXXY TRX Growth Following Rebound of NRX 118.13 130.8 25.1 33.0 20 25 30 35 100 105 110 115 120 125 130 135 2Q20 3Q20 2Q20 3Q20 TRx NRx IMVEXXY Quarterly Performance IMVEXXY 3Q20 Performance Drivers ▪ Activated “Sex Care is Self Care” consumer campaign in August ▪ Access to prescribers improving for sales force since maximum impact in May, but still well below pre - COVID - 19 ▪ ~6% increase in prescribers writing a prescription in 3Q20 compared to 2Q20 (~12,700 vs ~12,000) ▪ ~10% increase in prescribers writing a NRX in the 3Q over the 2Q ▪ ~14% increase in average number of NRx per prescriber (~2.8 to ~3.2) ▪ Net revenue per unit improved to $51 32% 11%

FOR INVESTOR PRESENTATION PURPOSES ONLY. Build a Strong Q4 Close for IMVEXXY Leveraging Prescriber Engagement, Access and Consumer Activation Consumer Activation Pull Through Access Prescriber Engagement and Multi - Channel Marketing ▪ Sex Care is Self Care Campaign Full display launch + Social + Search + In pharmacy ▪ Increased MOA Video distribution via YouTube, Teads and Women’s Interest sites ▪ Facebook Premier (Menopause below the Belt Video Series) ▪ Reinforce Access and affordability messages via Direct mail to prescribers with a call to action to request samples and resources ▪ Increase depth of prescribing with “reached” prescribers ▪ Supplement message frequency and accessibility to samples leveraging calls via Byte Success ▪ Surround sound via prescriber Media plus Patient Direct branded custom program featuring KOLs 26

FOR INVESTOR PRESENTATION PURPOSES ONLY. Thousands Source: Symphony 27 Data Source: Prescription data per Symphony Health PHAST Data through September 30, 2020 27.6 32.0 4.8 7.6 4 5 6 7 8 20 25 30 35 2Q20 3Q20 2Q20 3Q20 TRx NRx BIJUVA Quarterly Performance BIJUVA Volume Increased with Bio - Ignite Focus BIJUVA 3Q20 Performance Drivers ▪ Targeted approach with supporting Bio - Ignite to maintain brand loyalists with 7 sales representatives ▪ Access to prescribers improving for sales force since maximum impact in May, but still well below pre - COVID - 19 ▪ ~10% increase in prescribers writing a prescription in 3Q20 compared to 2Q20 (~4,600 vs ~4,200) ▪ Continued NRx growth ▪ Net revenue per unit improved to $47 16% 59%

FOR INVESTOR PRESENTATION PURPOSES ONLY. 28 NASEM Report ▪ Compounded preparations are often marketed as safer alternatives to the FDA - approved hormone products; however, the FDA does not review or approve compounded preparations for safety, quality, or effectiveness ▪ As a result, FDA asked the National Academies to convene a consensus study to evaluate the safety, effectiveness, use, and overall clinical utility of cBHRT National Academies of Science, Engineering and Medicine (NASEM) ▪ Report commissioned by FDA and published on July 1, 2020 to gain independent analysis of the safety and public health risk related to compounded bio - identical hormones ( cBHRT ) ▪ NASEM recommendations for stronger regulation and discipline around promotion and dispensing of compounded bio - identical hormones ▪ The cBHRT market size is ~12 - 18 million prescriptions a year in the US

FOR INVESTOR PRESENTATION PURPOSES ONLY. CONTRACEPTION PRENATAL CARE CONTRACEPTION/ FAMILY PLANNING - PERIMENOPAUSE VASOMOTOR SYMPTOMS DYSPAREUNIA (Vulvar & Vaginal Atrophy) REPRODUCTIVE HEALTH MENOPAUSE MANAGEMENT Prenatal Vitamins Closing Remarks 29

FOR INVESTOR PRESENTATION PURPOSES ONLY. CONTRACEPTION PRENATAL CARE CONTRACEPTION/ FAMILY PLANNING - PERIMENOPAUSE VASOMOTOR SYMPTOMS DYSPAREUNIA (Vulvar & Vaginal Atrophy) REPRODUCTIVE HEALTH MENOPAUSE MANAGEMENT Prenatal Vitamins Q&A 30
FOR INVESTOR PRESENTATION PURPOSES ONLY. Appendix 31

FOR INVESTOR PRESENTATION PURPOSES ONLY. 32 Reported Prescription Volume for TherapeuticsMD Products • TherapeuticsMD’s continues to see growing trends in orders from wholesalers, retail pharmacies, online telemedicine pharmacies and our secondary channels (internal data) for all of our FDA approved products . • The trend in these sales to wholesalers and pharmacies on a unit basis are consistent with the trends in the reported prescriptions filled by patients in the quarter . • Based on comparison of our internal data vs prescription tracking data, t he Company believes that industry prescription tracking databases (both Symphony and IQVIA) do not fully capture the diversity of prescriptions being filled particularly in our multiple secondary channels, such as Bio - ignite pharmacies, telemedicine pharmacies, public health and the military . • ANNOVERA volume levels are relatively small ( 1 / 100 th % ) compared to birth control for the category reported on a weekly basis causing certain data to be under - represented in the projection methodology . • Menopause Products – Prescription volume to patients as reported has been understated by approximately 10 - 15 % • October Trends in ANNOVERA prescription reported by Symphony Health (week ended 10 / 30 / 2020 ) • 21 % increase in last 4 weeks over previous 4 weeks

FOR INVESTOR PRESENTATION PURPOSES ONLY. 33 vitaCare Makes Complex Filling of Prescription Simple, Cost Effective and Stress Fee for Patients Divestiture can unlock substantial value for our shareholders □ Events of COVID - 19 highlighted the value of pharmaceutical companies being able to connect directly with patients. □ Recent rise of interest and investment in both HUB service and pharmacy service companies like BLINK and GoodRx , has driven outside interest in vitaCare. □ Based on initial indications received, we believe the enterprise value of vitaCare with the right partner can be upwards of $100 million and could generate at least $50 million in non - dilutive proceeds to TherapeuticsMD while maintaining a minority interest going forward . □ We intend that current vitaCare management will remain with vitaCare to ensure current service level for TXMD products and new customers. □ Company has retained Greenhill & Co. as an advisor for this opportunity .

FOR INVESTOR PRESENTATION PURPOSES ONLY. Manufacturers can now manage their business at the pharmacy transaction level. Real - time pharmacy transaction and business intelligence data is now available to the manufacturer. Manufacturers now have access to real - time inventory data throughout the retail supply chain API integrated with key pharmacy partners allowing access to information manufacturers have never had before Manufacturers can manage relationships and contracts with payors in real - time Confidential vitaCare Empowers Manufacturers to Manage their Product with Precision that Reaches Each Script Received 34

FOR INVESTOR PRESENTATION PURPOSES ONLY. ANNOVERA Refills: Illustrative Power of Increased Refill Rates $159.8 $232.5 $120.0 $366.1 $0 $50 $100 $150 $200 $250 $300 $350 $400 Year 1 Year 2 Year 3 Year 4 Year 5 Net Revenue ($M) 25% Refill Rate 50% Refill Rate 75% Refill Rate Key Assumptions for Model Below Assumes consistent 100,000 patients start on ANNOVERA each year (1 - 5 year) Net Revenue Per Unit of $1,200 (Low End of 2020 Net Price Assumptions) Refill stickiness leads to compounded net revenue growth ~45% Increase in year 5 revenue ~129% Increase in year 5 revenue Focus on refills is a TherapeuticsMD core competency Illustrative ANNOVERA Net Revenue Opportunity at Year 5 Women currently on prescription contraception, have stayed on therapy for an avg of ~11.5 years (including interruptions) (1) Note: (1) Women’s perceptions and treatment patterns related to contraception: results of a survey of US women. See appendix sli de for more details. Source: Contraception 97 (2018) 256 – 263 35
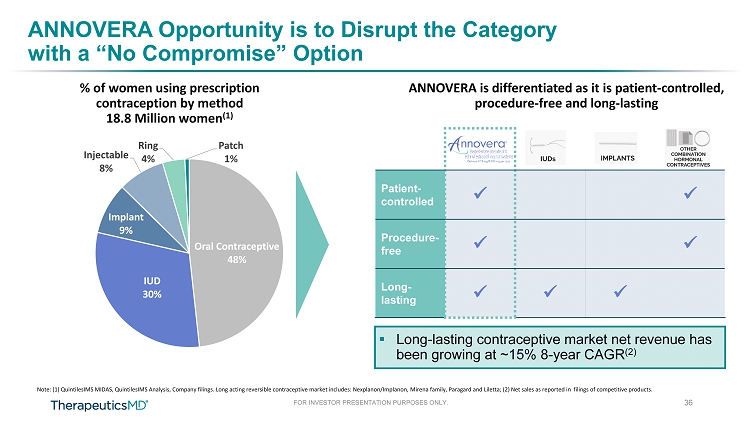
FOR INVESTOR PRESENTATION PURPOSES ONLY. Note: (1) QuintilesIMS MIDAS, QuintilesIMS Analysis, Company filings. Long acting reversible contraceptive market includes: Nexplanon/Implanon, Mire na family, Paragard and Liletta ; (2) Net sales as reported in filings of competitive products. ANNOVERA is differentiated as it is patient - controlled, procedure - free and long - lasting % of women using prescription contraception by method 18.8 Million women (1) ▪ Long - lasting contraceptive market net revenue has been growing at ~15% 8 - year CAGR (2) Patient - controlled x x Procedure - free x x Long - lasting x x x Oral Contraceptive 48% IUD 30% Implant 9% Injectable 8% Ring 4% Patch 1% 36 ANNOVERA Opportunity is to Disrupt the Category with a “No Compromise” Option

37 ANNOVERA Patient Types ▪ Broad based product – a single contraceptive product for most patient and prescriber types • Benefits for the diversity of women – supports patient preference • Amenable to women of broad ages and demographics • Available to all prescribers – no special training, equipment, or inventory ▪ Control of both fertility and menstruation* ▪ Self - administered, long - lasting benefits with immediate reversibility (without requiring a procedure for insertion and removal like IUDs or Implants) * When inserted for 21 continuous days and removed for 7 days each cycle. Nulliparous women and those not in monogamous relationships Ideal for adolescents and anyone who does not want to take a product every day and doesn’t want a procedure Women birth - spacing – between children College women – no need for monthly refills Women in the military – control fertility and menstruation for 1 year (13 cycles)* Women who are approaching menopause and still want contraception FOR PRESENTATION PURPOSES ONLY. DO NOT COPY OR DISTRIBUTE.