Attached files
| file | filename |
|---|---|
| EX-99.1 - EXHIBIT 99.1 - SOUTHSIDE BANCSHARES INC | tm2035142d1_ex99-1.htm |
| EX-10.2 - EXHIBIT 10.2 - SOUTHSIDE BANCSHARES INC | tm2035142d1_ex10-2.htm |
| EX-10.1 - EXHIBIT 10.1 - SOUTHSIDE BANCSHARES INC | tm2035142d1_ex10-1.htm |
| EX-4.1 - EXHIBIT 4.1 - SOUTHSIDE BANCSHARES INC | tm2035142d1_ex4-1.htm |
| 8-K - FORM 8-K - SOUTHSIDE BANCSHARES INC | tm2035142-1_8k.htm |
Exhibit 99.2

1 NASDAQ: SBSI Subordinated Notes Offering Investor Presentation October 2020

Safe Harbor Statement The information contained herein is a summary and it is not complete . It has been prepared for use only in connection with the private placement (the “Placement”) of securities (the “Securities”) of Southside Bancshares, Inc . (the “Company”, “Southside” or “SBSI”), the holding company of Southside Bank (the “Bank”) . The Securities have not been registered under the Securities Act of 1933 , as amended (the “Securities Act”), and are being offered in a private placement exempt from registration under the Securities Act and other applicable securities laws, and may not be re - offered or re - sold absent registration or an applicable exemptions from the registration requirements . The Securities are not a deposit or an account that is insured by the Federal Deposit Insurance Corporation (“FDIC”) or any other government agency . The information contained herein is being furnished solely for the purpose of enabling prospective investors to determine whether they wish to proceed with further investigation of the Company and the Placement . As it is a summary, such information is not intended to and does not contain all the information that you will require to form the basis of any investment decision . The information contained herein speaks as of the date hereof . Neither the delivery of this information or any eventual sale of the Securities shall, under any circumstances, imply that the information contained herein is correct as of any future date or that there has been no change in the Company’s business affairs described herein after the date hereof . Nothing contained herein is, or should be relied upon as, a promise or representation as to future performance . Neither the Company nor any of its affiliates undertakes any obligation to update or revise this presentation . The Company anticipates providing you with the opportunity to ask questions, receive answers, obtain additional information and complete your own due diligence review concerning the Company and the Placement prior to entering into any agreement to purchase Securities . By accepting delivery of the information contained herein, you agree to undertake and rely upon your own independent investigation and analysis and consult with your own attorneys, accountants, and other professional advisors regarding the Company and the merits and risks of an investment in the Securities, including all related legal, investment, tax, and other matters . The Company shall not have any liability for any information included herein or otherwise made available in connection with the Placement, except for liabilities expressly assumed by the Company in the definitive purchase agreement and the related documentation for each purchase of Securities . The information contained herein does not constitute an offer to sell or a solicitation of an offer to purchase the Securities described herein nor shall there be any sale of such Securities in any state or jurisdiction in which such an offer or solicitation is not permitted or would be unlawful . Each investor must comply with all legal requirements in each jurisdiction in which it purchases, offers, or sells the Securities, and must obtain any consent, approval, or permission required by it in connection with the Securities or the Placement . The Company does not make any representation or warranty regarding, and has no responsibility for, the legality of an investment in the Securities under any investment, securities, or similar laws . THE SECURITIES HAVE NOT BEEN APPROVED OR DISAPPROVED BY THE SECURITIES AND EXCHANGE COMMISSION (“SEC”), THE FDIC, OR ANY OTHER GOVERNMENT AGENCY, NOR HAS THE SEC, THE FDIC, OR ANY OTHER GOVERNMENT AGENCY PASSED ON THE ADEQUACY OR ACCURACY OF THIS PRESENTATION . ANY REPRESENTATION TO THE CONTRARY IS UNLAWFUL . 2

Forward - Looking Statements Certain statements of other than historical fact that are contained in this investor presentation and in other written material, documents and oral statements issued by or on behalf of the Company may be considered to be “forward - looking statements” within the meaning of and subject to the safe harbor protections of the Private Securities Litigation Reform Act of 1995 . These forward - looking statements are not guarantees of future performance, nor should they be relied upon as representing management’s views as of any subsequent date . These statements may include words such as “expect,” “estimate,” “project,” “anticipate,” “appear,” “believe,” “could,” “should,” “may,” “likely,” “intend,” “probability,” “risk,” “target,” “objective,” “plans,” “potential,” and similar expressions . Forward - looking statements are statements with respect to the Company’s beliefs, plans, expectations, objectives, goals, anticipations, assumptions and estimates about the Company's future performance and are subject to significant known and unknown risks and uncertainties, which could cause the Company's actual results to differ materially from the results discussed in the forward - looking statements . For example, discussions about trends in asset quality, capital, liquidity, the pace of loan and revenue growth, the Company's ability to sell nonperforming assets, expense reductions, planned operational efficiencies, earnings, successful integration of completed acquisitions and certain market risk disclosures, including the impact of interest rates, tax reform and other economic factors, are based upon information presently available to management and are dependent on choices about key model characteristics and assumptions and are subject to various limitations . By their nature, certain of the market risk disclosures are only estimates and could be materially different from what actually occurs in the future . The most recent factor that could cause future results to differ materially from those anticipated by our forward - looking statements include the negative impact of the COVID - 19 pandemic on our business, financial position, operations and prospects, including our ability to continue our business activities in certain communities we serve, the duration of the pandemic and its continued effects on financial markets, a reduction in financial transactions and business activities resulting in decreased deposits and reduced loan originations, increases in unemployment rates impacting our borrowers' ability to repay their loans, our ability to manage liquidity in a rapidly changing and unpredictable market, additional interest rate changes by the Federal Reserve and other government actions in response to the pandemic, including additional quarantines, regulations or laws enacted to counter the effects of the COVID - 19 pandemic on the economy . Additional information concerning the Company and its business, including additional factors that could materially affect the Company’s financial results, is included in the Company’s Annual Report on Form 10 - K for the year ended December 31 , 2019 , under “Part I - Item 1 . Forward Looking Information” and “Part I - Item 1 A . Risk Factors,” “the Company's Quarterly Report on Form 10 - Q for the quarter ended March 31 , 2020 and the quarter ended June 30 , 2020 , under Part II - Item 1 A . Risk Factors” and in the Company’s other filings with the Securities and Exchange Commission . The Company disclaims any obligation to update any factors or to announce publicly the result of revisions to any of the forward - looking statements included herein to reflect future events or developments . Pro Forma and Projected Information This investor presentation contains certain pro forma and projected information, including projected pro forma information that reflects the Company’s current expectations and assumptions . This pro forma information does not purport to present the results that the Company will ultimately realize . 3

Non - GAAP Reconciliation This presentation contains certain financial information determined by methods other than in accordance with accounting principles generally accepted in the United States (GAAP) . These non - GAAP financial measures include return on average tangible common equity, tangible book value per common share, tangible common equity to tangible assets, efficiency ratio on a fully taxable - equivalent (FTE) basis, net interest income (FTE), net interest margin (FTE) and net interest spread ( FTE) . In calculating return on average tangible common equity, Southside (i) adds back the after tax amortization expense to net income available to common shareholders and (ii) subtracts average intangible assets for the period from average shareholders’ equity . In calculating tangible book value per common share, Southside subtracts intangible assets for the period from shareholders’ equity . In calculating the ratio of tangible common equity to tangible assets, Southside subtracts intangible assets both from shareholders’ equity and total assets at the end of the period . Management believes that the presentation of these measures excluding the impact of intangible assets provides useful supplemental information that is helpful in understanding Southside’s financial condition and results of operations, as they provide a method to assess management’s success in utilizing Southside’s tangible capital as well as its capital strength . Management also believes that providing measures that exclude balances of intangible assets, which are subjective components of valuation, facilitates the comparison of Southside’s performance with the performance of its peers . In addition, management believes that these are standard financial measures used in the banking industry to evaluate performance . The efficiency ratio (FTE) is a non - GAAP measure that provides a measure of productivity in the banking industry . This ratio is calculated to measure the cost of generating one dollar of revenue . The ratio is designed to reflect the percentage of one dollar which must be expended to generate that dollar of revenue . We calculate this ratio by dividing noninterest expense, excluding amortization expense on intangibles and certain nonrecurring expense by the sum of net interest income (FTE) and noninterest income, excluding net gain (loss) on sale of securities available for sale and certain nonrecurring impairments . The most directly comparable financial measure calculated in accordance with GAAP is our efficiency ratio . Net interest income (FTE) is a non - GAAP measure that adjusts for the tax - favored status of net interest income from certain loans and investments . We believe this measure to be the preferred industry measurement of net interest income and it enhances comparability of net interest income arising from taxable and tax - exempt sources . The most directly comparable financial measure calculated in accordance with GAAP is our net interest income . Net interest margin (FTE) is the ratio of net interest income (FTE) to average earning assets . The most directly comparable financial measure calculated in accordance with GAAP is our net interest margin . Net interest spread (FTE) is the difference in the average yield on average earning assets on a tax - equivalent basis and the average rate paid on average interest bearing liabilities . The most directly comparable financial measure calculated in accordance with GAAP is our net interest spread . These non - GAAP financial measures are supplemental and are not a substitute for any analysis based on GAAP financial measures . Because not all companies use the same calculation of non - GAAP financial measures, this presentation may not be comparable to other similarly titled measures as calculated by other companies . 4

5 Terms of the Proposed Subordinated Debt Offering Issuer Security Amount Security Rating 1 Issuance Type Offering Structure Term No Call Period Use of Proceeds Placement Agent Southside Bancshares, Inc. (NASDAQ: SBSI) Subordinated Notes due 2030 $70 million BBB (Stable) by Kroll Bond Rating Agency Regulation D Private Placement with Registration Rights Fixed - to - Floating Rate (Fixed during First Five Years) 10 Years 5 Years G eneral Corporate Purposes (1) A rating is not a recommendation to buy, sell or hold securities. Ratings may be subject to revision or withdrawal at any time by the assigning rating organization. Each rating organization has its own methodology for assigning ratings and, accordingly, each rating should be evaluated independently of an y other rating

Southside Snapshot 6 » Founded in 1960 with headquarters in Tyler, Texas » Community - focused financial institution » Offers a broad range of consumer, commercial and mortgage banking services, as well as private banking, wealth management and trust services, and brokerage services » Diversified branch footprint consisting of 57 branches, 15 of which are located in grocery stores » Experienced management t eam, each with over 20 years of experience in Banking » T rack record of consistent growth, 11.5% CAGR in total assets from 2013 to Q3 2020 » Strong asset quality, with NPA to Total Assets of 0.23% » 825 Full - Time Equivalent Employees » Southside has paid a dividend to common shareholders for 92 consecutive quarters Company Overview (1) See Non - GAAP Reconciliation (2) Calculated on a fully taxable - equivalent basis (FTE) (3) Reserves / Total Loans ex - PPP of 1.58% as of 9/30/2020 Source: Company documents; S&P Global Market Intelligence Financial Highlights ($mm) As of and for the As of and for the Years Ended Nine Months Ended December 31, September 30, 2018 2019 2020 Total Assets $6,123 $6,749 $7,191 Total Loans (Ex. HFS) 3,313 3,568 3,790 Total Deposits 4,425 4,703 5,103 Total Equity 731 805 839 Loans / Deposits 74.87% 75.87% 74.27% ROAA 1.19% 1.17% 0.98% ROATCE(1) 14.78 13.80 12.05 Net Interest Margin (FTE)(1)(2) 3.18 3.06 3.02 Efficiency Ratio (FTE)(1)(2) 49.98 52.36 50.06 TCE / TA(1) 8.68% 9.03% 8.99% Common Equity Tier 1 Ratio 14.77 14.07 14.24 Tier 1 Risk-Based Ratio 16.29 15.46 15.63 Total Risk-Based Ratio 19.59 18.43 19.03 Leverage Ratio 10.64 10.18 9.50 CRE Concentration 189.1 204.8 202.8 NPAs / Loans and OREO 1.29% 0.49% 0.44% NCOs / Average Loans 0.07 0.21 0.04 Reserve / Total Loans(3) 0.82 0.69 1.45 Reserve / NPLs 64.79 146.06 338.56 Tangible Book Value(1) $15.19 $17.45 $18.97 Diluted Earnings 2.11 2.20 1.58 Cash Dividends Paid 1.20 1.26 0.93 Diluted Dividend Payout Ratio 56.9% 57.3% 58.9% Balance Sheet Profitability Ratios Capital Asset Quality Per Share Amounts

Experienced Management Team 7 Lee Gibson President & Chief Executive Officer 36 years with Southside • Board member of Tyler Junior College Foundation • Board and Executive Committee member of Tyler Economic Development Council • Past Chairman, FHLB Dallas and Council of FHLBanks Julie Shamburger Chief Financial Officer 38 years with Southside • Previously the Chief Accounting Officer of Southside Bank from 2011 to 2016 • Board member of CASA for Kids of East Texas Tim Alexander Chief Lending Officer 14 years with Southside • Trustee Board member of the The Great Commission Foundation of Episcopal Diocese of Texas • Over 36 years of experience in commercial lending TL Arnold Chief Credit Officer 5 years with Southside • Board member of William Mann Community Development Corporation • 30 years of experience in the banking and financial services industry Brian McCabe Chief Operations Officer 37 years with Southside • Board member of East Texas Lighthouse for the Blind • Board member of CHRISTUS Trinity Mother Frances Foundation Suni Davis Chief Risk Officer 20 years with Southside • Financial Managers Society Audit and Risk Council Member

Our Texas Presence 8 Note: Branch count reflects full - service and in - store branches only, excludes non - deposit offices and cyber branches Source: FDIC (as of 6/30/2020), S&P Market Intelligence, Fortune Magazine Branch Network Overview of Our Markets Fort Worth Dallas Longview Tyler Lufkin Austin Houston Gun Barrel City Palestine Nacogdoches Jasper Kingwood Cleburne Granbury Frisco Weatherford Mineloa Total Branches (57) Full Service (42) In - Store (15) Market (Branches) Background and Highlights East Texas (27) » Founded in 1960 in Tyler, TX » Leading deposit m arket s hare (37%) in Smith County » Tyler metropolitan area population of approximately 235,000 Dallas / Fort Worth (15) » Acquired Fort Worth Bancshares, Inc. ($129m in Assets) in 2007 and OmniAmerican Bancorp, Inc. ($1.4b in Assets) in 2014 » #1 largest MSA in Texas and #4 in U.S. » 24 Fortune 500 Companies Southeast Texas (12) » Acquired Diboll State Bancshares, Inc. ($1.0b in Assets) in 2017 » Leading deposit market share (27%) in Angelina County » Lufkin metropolitan area population of approximately 90,000 Austin (2) » Expanded footprint to Austin with LPO acquired through Fort Worth Bancshares, Inc. transaction in 2007, became a full service branch in 2011 » #4 largest MSA in Texas » Fastest growing MSA in Texas, with a 34% increase in the last 10 years Houston (1) » Expanded footprint to the Greater Houston Area in 2019 with an in - store branch in Kingwood » #2 largest MSA in Texas and #5 in the US » 22 Fortune 500 Companies Texas

Total Assets ($mm) Loans HFI ($mm) Total Deposits ($mm) $0 $1,000 $2,000 $3,000 $4,000 $5,000 $6,000 $7,000 $8,000 $0 $1,000 $2,000 $3,000 $4,000 $5,000 $6,000 $0 $500 $1,000 $1,500 $2,000 $2,500 $3,000 $3,500 $4,000 Balance Sheet Growth 9 Source: Company documents

$44.0 $49.3 $54.3 $74.1 $74.6 $57.2 $52.6 $ 0 $ 10 $ 20 $ 30 $ 40 $ 50 $ 60 $ 70 $ 80 2015 2016 2017 2018 2019 YTD Q3 2019 YTD Q3 2020 10 Profitability Net Income ($mm) Net Interest Income ($mm ) ROAA Fee Income / Revenue & Efficiency Ratio (FTE) (1) 3.40% 3.02% $134.7 $139.6 $144.0 $172.1 $169.8 $126.6 $138.6 $ 0 $ 20 $ 40 $ 60 $ 80 $ 100 $ 120 $ 140 $ 160 $ 180 $ 200 2015 2016 2017 2018 2019 YTD Q3 2019 YTD Q3 2020 0.90% 0.94% 0.96% 1.19% 1.17% 1.21% 0.98% 0.00% 0.20% 0.40% 0.60% 0.80% 1.00% 1.20% 1.40% 2015 2016 2017 2018 2019 YTD Q3 2019 YTD Q3 2020 (1) Calculated on a fully taxable - equivalent basis (FTE); See Non - GAAP Reconciliation Source: Company documents; S&P Global Market Intelligence 20.3% 20.8% 20.4% 19.8% 19.7% 19.8% 18.1% 56.4% 54.1% 50.3% 50.0% 52.4% 51.9% 50.1% 0% 10% 20% 30% 40% 50% 60% 2015 2016 2017 2018 2019 YTD Q3 2019 YTD Q3 2020 Fee Income / Operating Revenue Efficiency Ratio (FTE) (1)

(1) Calculated on a fully taxable - equivalent basis (FTE), a non - GAAP measure Note: Figures are annualized Source: Company documents; S&P Global Market Intelligence 11 Quarterly Yield & Cost Trends 3.03% 2.98% 3.03% 3.02% 3.02% 2.68% 2.66% 2.76% 2.82% 2.84% 1.31% 1.20% 1.08% 0.69% 0.57% 1.01% 0.91% 0.84% 0.51% 0.38% 0.00% 0.50% 1.00% 1.50% 2.00% 2.50% 3.00% 3.50% 9/30/19 12/31/19 3/31/20 6/30/20 9/30/20 Net Interest Margin (FTE) ¹ Net Interest Spread (FTE) ¹ Cost of Funds Cost of Total Deposits

Lending & Asset Quality 12

4.57% 4.89% 5.04% 4.77% 4.18% 4.05% 2017Y 2018Y 2019Y 2020Q1 2020Q2 2020Q3 13 Loan Composition (1) Calculated on a fully taxable - equivalent basis (FTE), a non - GAAP measure Note: Financial data is unaudited and per Company regulatory filings; As of, or for the three months ended, September 30, 202 0, except for annual data which is as of, or for the year ended, December 31 Source: Company documents; S&P Global Market Intelligence 35% 19 % 16% 17% 10 % 3% 2017 2018 2019 Q1 2020 Q2 2020 Q3 2020 Construction 1-4 Family Residential CRE Commercial Municipal Individuals Historical Loan Composition Historical Yield on Loans (1) 16% 19% 35% 17% 10% 3% 15% 20% 36% 17% 10% 2 % 17% 22% 37% 11% 10% 3% 18% 22% 35% 11% 11% 3% 15% 24% 36% 11% 11% 3% 14% 25% 38% 8% 11% 4%

14 Loan Deferrals - 200 400 600 800 1,000 1,200 $0 $50 $100 $150 $200 $250 $300 $350 $400 $450 6/30/2020 7/31/2020 8/31/2020 9/30/2020 10/20/2020 Loan Amount ($mm) Number of Loans Deferrals Continue to Decrease » Total $ Deferrals have decreased by 80% since Q2 10.9% 7.2% 5.8% 3.7% 2.2% (1) PPP Loans excluded from Loan Totals Source: Company documents Date # of Loans % of Total Loans (1) Loan Amount ($mm) % of Total Loan Amount (1) 6/30/2020 933 3.9% $386.3 10.9% 7/31/2020 461 1.9% $254.0 7.2% 8/31/2020 336 1.4% $203.5 5.8% 9/30/2020 252 1.1% $127.9 3.7% 10/20/2020 198 0.8% $76.5 2.2%

15 Select Sensitive Industries ($ in thousands) # of Loans Commitment Loan Amount Amount as a % of Total Loans Retail CRE 163 382,550$ 329,645$ 8.70% Oil and Gas 292 144,661 116,428 3.07 Retail Trade 387 141,405 85,443 2.25 Hotels 16 69,377 68,881 1.82 Food Services 249 47,203 43,401 1.15 Arts, Entertainment and Recreation 76 10,987 10,400 0.27 Total Sectors 1,183 796,183$ 654,198$ 17.26% As of September 30, 2020 $41,457 $22,287 $9,043 $2,078 $1,649 $- $10,000 $20,000 $30,000 $40,000 $50,000 Hotels Consumer Other Industries Retail CRE Food Services Deferral Totals as of October 20, 2020 by Industry Note: Other Industries includes Arts, Entertainment and Recreation deferrals of $165k. There were no deferrals in Oil and Ga s o r Retail Trade as of 10/20/2020. Source: Company documents

16 Oil and Gas Portfolio » Oil and Gas Portfolio (as of 9/30/2020) » 3.07% of Total Loans » $6.8 million classified (5.83%); 0.18% of Total Loans » $718k on nonaccrual (0.02% of Total Loans) » No deferrals in the Oil and Gas portfolio Downstream 3% Midstream 1% Upstream 30% Support Activities and Services 66% Oil and Gas Portfolio Composition as of September 30, 2020 ($ in thousands) # of Loans Commitment Loan Amount Amount as a % of O&G Loans Reserve Downstream (Refining and Retailing) 38 3,837$ 3,566$ 3% 40$ Midstream (Storage and Transportation) 20 4,339 1,672 1 2 Upstream (Exploration and Production) 93 54,679 34,496 30 457 Support Activities and Services for Oil and Gas Operations 141 81,806 76,694 66 1,226 Total Oil and Gas 292 144,661$ 116,428$ 100% 1,725$ As of September 30, 2020 Source: Company documents

Asset Quality Trends 17 NPAs / Loans and OREO (1) Nonaccrual Loans / Loans (1) NCOs / Average Loans Reserve / NPLs (1) Prior to the adoption of CECL, excluded purchased credit impaired loans measured at fair value at acquisition if the timing and amo unt of cash flows expected to be collected from those sales could be reasonably estimated. Source: Company documents; S&P Global Market Intelligence 1.34% 0.59% 0.32% 1.29% 0.49% 0.44% 0.00% 0.50% 1.00% 1.50% 2.00% 2015 2016 2017 2018 2019 Q3 2020 0.84% 0.32% 0.09% 1.08% 0.14% 0.16% 0.00% 0.50% 1.00% 1.50% 2.00% 2015 2016 2017 2018 2019 Q3 2020 0.09% 0.47% 0.07% 0.07% 0.21% 0.04% 0.00% 0.50% 1.00% 1.50% 2.00% 2015 2016 2017 2018 2019 YTD Q3 2020 62.3% 121.7% 238.7% 64.8% 146.1% 338.6% 0.0% 100.0% 200.0% 300.0% 400.0% 500.0% 2015 2016 2017 2018 2019 Q3 2020

$24.8 $53.6 $59.9 $55.1 $5.3 $24.0 $6.4 ($4.4) ($0.5) ($0.1) ($0.4) $- $10.0 $20.0 $30.0 $40.0 $50.0 $60.0 $70.0 ALLL 12/31/2019 Day 1 adjustment Net Charge Offs Provision ALLL 3/31/2020 Net Charge Offs Provision ALLL 6/30/2020 Net Charge Offs Provision ALLL 9/30/2020 CECL Impact and Changes to ALLL 18 Allowance for Loan Losses (ALLL) ( in millions) YTD 2020 (1) The adoption of ASU 2016 - 13 (CECL) on January 1, 2020 replaced the incurred loss model with an expected credit loss methodology. As such, 12/31/2019 is presented under the incurred loss model and 2020 quarter ends are presented under the current expected credit l oss model. Source: Company documents (1) » Day 1 CECL adoption resulted in an ALLL increase of $5.3 million, including $0.2 million for Purchased Credit Deteriorated loans » Provision expense is largely driven by the economic forecast. The reversal of provision for Q3 was driven by an improved economic forecast and a decrease in commercial real estate loans outstanding. » ALLL totaled 1.45% of total loans at 9/30/2020 compared to 0.69% of total loans at 12/31/2019

Deposits & Funding 19

2017 2018 2019 Q1 2020 Q2 2020 Q3 2020 Jumbo Time Retail Time Savings Interest Bearing Demand Noninterest Bearing 20 Deposit Composition Trends Note: Financial data is unaudited and per Company regulatory filings; As of, or for the three months ended, September 30, 202 0, except for annual data which is as of, or for the year ended, December 31 Note: Jumbo time deposits defined as time deposits with a value of $100,000, or more Source: Company documents; S&P Global Market Intelligence $3.6 $3.6 $3.6 $3.5 $3.7 $3.6 $3.6 $4.5 $4.6 $4.5 $4.6 $4.4 $4.6 $4.5 $4.5 $4.7 $4.7 $5.1 $5.1 $0.0 $1.0 $2.0 $3.0 $4.0 $5.0 $6.0 Q1 Q2 Q3 Q4 Q1 Q2 Q3 Q4 Q1 Q2 Q3 Q4 Q1 Q2 Q3 Q4 Q1 Q2 Q3 Total Deposits ($B) Fed Funds Rate (bps) Cost of Deposits (bps) 2016Y 36bps 38 bps 9 bps 25 bps Historical Deposit Composition Historical Cost of Deposits 2017Y 2018Y 2019Y 2020YTD 14% 9 % 9 % 41% 27% 14% 9 % 9 % 40% 28% 18% 9 % 8% 42% 23% 18% 10% 8% 42% 22% 18% 6% 8 % 45% 23% 14% 10% 8 % 46% 22%

21 Sources of Liquidity » Current loan - to - deposit ratio of 74.3% positions Southside with a strong and stable funding base » The Company opportunistically uses their strong capital position with wholesale borrowing to increase their absolute earnings » The Company has ample sources of liquidity Sources of Liquidity as of September 30, 2020 Balance Limit Excess Capacity Excess Capacity ($000s) ($000s) ($000s) (%) FHLB Advances $952,944 $2,107,000 $1,154,056 55% Fed Funds Purchased - 62,500 62,500 100 Federal Reserve Discount Window - 786,000 786,000 100 Repurchase Agreements 41,568 100,000 58,432 58 Brokered Deposits 338,708 450,000 111,292 25 Public Funds 854,647 - - - Total $2,172,280 Source: Company documents

22 Securities Portfolio Total Securities Historical Trend 2.00% 2.50% 3.00% 3.50% 4.00% 4.50% $- $500 $1,000 $1,500 $2,000 $2,500 $3,000 FY 2018 FY 2019 Q1'20 Q2'20 Q3'20 Securities (in millions) State and Political Subdivision Agency MBS Residential Other Stocks and Bonds Agency MBS Commercial Avg Yield Securities as of 9/30/2020 Securities ($mm) AFS HTM Total % State and Political Subdivisions $1,513 $1 $1,514 55% Agency MBS Residential 945 54 999 36% Other Stocks and Bonds 48 0 48 2% Agency MBS Commercial 128 60 188 7% Total $2,634 $115 $2,749 100% % of Total 96% 4% Agency MBS Residential 36% State and Political Subdivisions 55% Agency MBS Commercial 7% Other Stocks and Bonds 2% Source: Company documents

Capitalization 23

24 Capital Ratios TCE / TA (1) 14.7% 14.8% 14.1% 14.2% 14.2% 18.3% 18.6% 17.6% 17.8% 17.8% 2017 2018 2019 3Q20 Pro Forma² Total RBC Common Equity Tier 1 8.5% 8.7% 9.0% 9.0% 8.9% 10.7% 11.2% 11.3% 11.1% 11.1% 2017 2018 2019 3Q20 Pro Forma² 19.2% 19.6% 18.4% 19.0% 20.7% 18.9% 19.3% 18.2% 18.9% 18.9% 2017 2018 2019 3Q20 Pro Forma² Tier 1 Leverage Tier 1 Capital 11.2% 10.6% 10.2% 9.5% 9.4% 12.7% 12.1% 11.6% 10.8% 10.8% 2017 2018 2019 3Q20 Pro Forma² 16.1% 16.3% 15.5% 15.6% 15.6% 18.3% 18.6% 17.6% 17.8% 17.8% 2017 2018 2019 3Q20 Pro Forma² Holding Company Bank Level (1) See Non - GAAP reconciliation ( 2 ) Pro forma assumes gross offering proceeds of $70.0 million (with an underwriting spread of 1.25% and $150,000 of other offering expenses); assumes risk - weighting of 0% to net proceeds Source : Company documents ; S&P Global Market Intelligence

25 Pro Forma Interest Coverage & Double Leverage LTM LTM For the Year Ended December 31, Actual Offering Pro Forma ($ in millions) 2017Y 2018Y 2019Y 9/30/2020 Adjustments 9/30/2020 Investment in Subsidiaries $895.8 $877.6 $951.5 $989.9 $0.0¹ $989.9 Consolidated Equity 754.1 731.3 804.6 839.1 - 839.1 Double Leverage Ratio 118.8% 120.0% 118.3% 118.0% 118.0% Total Deposit Interest $20.7 $35.9 $44.6 $31.5 - $31.5 Other Borrowing Expense 22.8 21.2 26.4 22.2 3.0² 25.2 Total Interest Expense 43.5 57.1 71.0 53.7 56.7 Pre-Tax Income (GAAP) $70.4 $84.3 $87.8 $79.8 ($3.0) $76.9 Interest Coverage: Including Deposit Expense 2.6x 2.5x 2.2x 2.5x 2.4x Excluding Deposit Expense 4.1x 5.0x 4.3x 4.6x 4.1x Double Leverage LTM Interest Coverage (1) For illustrative purposes only. Assumes gross offering proceeds of $70.0 million ( based on an underwriting spread of 1.25% and $150,000 of other offering expenses ),assumes that net proceeds are not down streamed to the Bank; (2) For illustrative purposes only. Assumes gross offering proceeds of $70.0 million with an illustrative 4.25% coupon; does not inc lude the pro forma impact of any potential redemption of any outstanding notes Note : Financial data is unaudited and per Company regulatory filings; as of, or for the twelve months ended, September 30, 2020, except for annual data which is for the year ended, December 31 Source: Company documents

Appendix 26
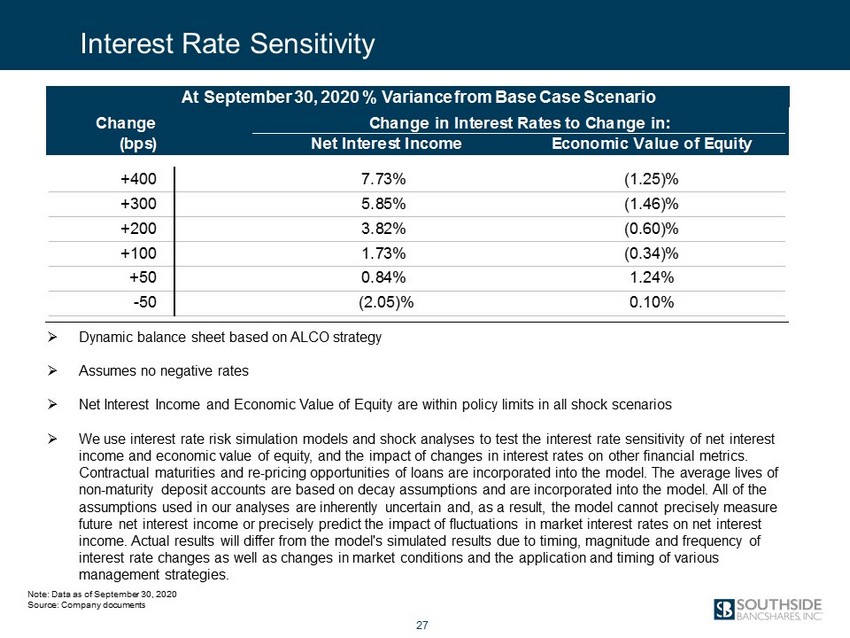
Interest Rate Sensitivity Note: Data as of September 30, 2020 Source: Company documents Change Change in Interest Rates to Change in: (bps) Net Interest Income Economic Value of Equity +400 7.73% (1.25)% +300 5.85% (1.46)% +200 3.82% (0.60)% +100 1.73% (0.34)% +50 0.84% 1.24% -50 (2.05)% 0.10% 27 » Dynamic balance sheet based on ALCO strategy » Assumes no negative rates » Net Interest Income and Economic Value of Equity are within policy limits in all shock scenarios » We use interest rate risk simulation models and shock analyses to test the interest rate sensitivity of net interest income and economic value of equity, and the impact of changes in interest rates on other financial metrics. Contractual maturities and re - pricing opportunities of loans are incorporated into the model. The average lives of non - maturity deposit accounts are based on decay assumptions and are incorporated into the model. All of the assumptions used in our analyses are inherently uncertain and, as a result, the model cannot precisely measure future net interest income or precisely predict the impact of fluctuations in market interest rates on net interest income. Actual results will differ from the model's simulated results due to timing, magnitude and frequency of interest rate changes as well as changes in market conditions and the application and timing of various management strategies. At September 30, 2020 % Variance from Base Case Scenario
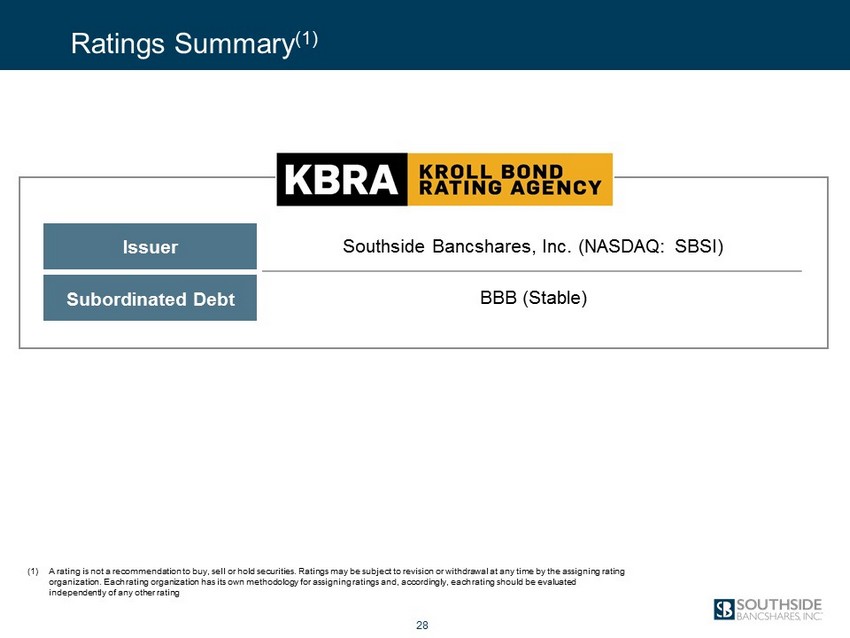
(1) A rating is not a recommendation to buy, sell or hold securities. Ratings may be subject to revision or withdrawal at any tim e b y the assigning rating organization. Each rating organization has its own methodology for assigning ratings and, accordingly, each rating should be eva luated independently of any other rating 28 Issuer Subordinated Debt Southside Bancshares, Inc. (NASDAQ: SBSI) BBB (Stable) Ratings Summary (1)

(dollars in thousands) 9/30/2019 12/31/2019 3/31/2020 6/30/2020 9/30/2020 Net income available to common shareholders $19,792 $17,335 $3,953 $21,554 $27,074 Plus: After-tax amortization expense 853 814 774 735 696 Adjusted net income available to common shareholders [a] $20,645 $18,149 $4,727 $22,289 $27,770 Average shareholders' equity $802,953 $816,848 $824,759 $801,413 $835,330 Less: Average intangible assets for the period 216,169 215,101 214,104 213,135 212,221 Average tangible shareholders' equity [b] $586,784 $601,747 $610,655 $588,278 $623,109 Return on average tangible common equity (ROATCE)[a] /[b](1) 13.96% 11.97% 3.11% 15.24% 17.73% Net interest income (GAAP) $42,373 $43,176 $44,701 $47,271 $46,586 Tax equivalent adjustments: Loans $641 $653 $668 $679 $688 Tax-exempt investment securities 1,161 1,387 1,631 2,339 2,415 Net interest income (FTE)(2) $44,175 $45,216 $47,000 $50,289 $49,689 Plus: Noninterest income 11,111 10,465 15,498 12,193 11,141 Less: Nonrecurring income 42 42 5,541 2,662 78 Total Revenue [c] $55,244 $55,639 $56,957 $59,820 $60,752 Noninterest expense $29,026 $30,944 $30,520 $29,856 $31,616 Less: Pre-tax amoritzation expense 1,080 1,030 980 931 881 Less: Nonrecurring expense 33 (56) (29) 39 315 Adjusted noninterest expense [d] $27,913 $29,970 $29,569 $28,886 $30,420 Average earning assets $5,782,704 $6,029,624 $6,248,759 $6,696,235 $6,548,935 Efficiency Ratio 52.23% 55.92% 54.10% 50.85% 52.77% Efficiency Ratio (FTE)(2) [d]/ [c] 50.53% 53.87% 51.91% 48.29% 50.07% Net interest margin(1) 2.91% 2.84% 2.88% 2.84% 2.83% Net interest marging (FTE) (1)(2) 3.03% 2.98% 3.03% 3.02% 3.02% Net interest spread(1) 2.55% 2.52% 2.61% 2.64% 2.65% Net interest spread(FTE) (1)(2) 2.68% 2.66% 2.76% 2.82% 2.84% As of and for the Three Months Ended 29 Non - GAAP Reconciliation (1) Annualized (2) Fully taxable - equivalent (FTE) Source: Company documents
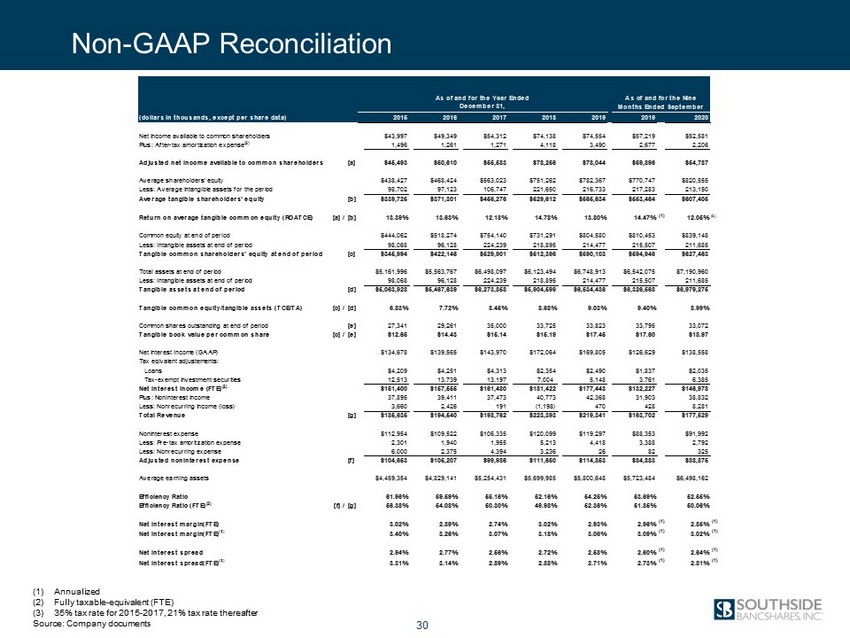
(1) Annualized (2) Fully taxable - equivalent (FTE) (3) 35% tax rate for 2015 - 2017, 21% tax rate thereafter Source: Company documents 30 Non - GAAP Reconciliation (dollars in thousands, except per share data) 2015 2016 2017 2018 2019 2019 2020 Net income available to common shareholders $43,997 $49,349 $54,312 $74,138 $74,554 $57,219 $52,581 Plus: After-tax amortization expense(3) 1,496 1,261 1,271 4,118 3,490 2,677 2,206 Adjusted net income available to common shareholders [a] $45,493 $50,610 $55,583 $78,256 $78,044 $59,896 $54,787 Average shareholders' equity $438,427 $468,424 $563,023 $751,262 $782,367 $770,747 $820,555 Less: Average intangible assets for the period 98,702 97,123 106,747 221,650 216,733 217,283 213,150 Average tangible shareholders' equity [b] $339,725 $371,301 $456,276 $529,612 $565,634 $553,464 $607,405 Return on average tangible common equity (ROATCE) [a] /[b] 13.39% 13.63% 12.18% 14.78% 13.80% 14.47% (1) 12.05% (1) Common equity at end of period $444,062 $518,274 $754,140 $731,291 $804,580 $810,453 $839,148 Less: Intangible assets at end of period 98,068 96,128 224,239 218,895 214,477 215,507 211,685 Tangible common shareholders' equity at end of period [c] $345,994 $422,146 $529,901 $512,396 $590,103 $594,946 $627,463 Total assets at end of period $5,161,996 $5,563,767 $6,498,097 $6,123,494 $6,748,913 $6,542,075 $7,190,960 Less: Intangible assets at end of period 98,068 96,128 224,239 218,895 214,477 215,507 211,685 Tangible assets at end of period [d] $5,063,928 $5,467,639 $6,273,858 $5,904,599 $6,534,436 $6,326,568 $6,979,275 Tangible common equity/tangible assets (TCE/TA) [c] /[d] 6.83% 7.72% 8.45% 8.68% 9.03% 9.40% 8.99% Common shares outstanding at end of period [e] 27,341 29,261 35,000 33,725 33,823 33,795 33,072 Tangible book value per common share [c] /[e] $12.65 $14.43 $15.14 $15.19 $17.45 $17.60 $18.97 Net interest income (GAAP) $134,678 $139,565 $143,970 $172,064 $169,805 $126,629 $138,558 Tax eqivalent adjustements: Loans $4,209 $4,251 $4,313 $2,354 $2,490 $1,837 $2,035 Tax-exempt investment securities 12,513 13,739 13,197 7,004 5,148 3,761 6,385 Net interest income (FTE)(2) $151,400 $157,555 $161,480 $181,422 $177,443 $132,227 $146,978 Plus: Noninterest income 37,895 39,411 37,473 40,773 42,368 31,903 38,832 Less: Nonrecurring income (loss) 3,660 2,426 191 (1,198) 470 428 8,281 Total Revenue [g] $185,635 $194,540 $198,762 $223,393 $219,341 $163,702 $177,529 Noninterest expense $112,954 $109,522 $106,335 $120,099 $119,297 $88,353 $91,992 Less: Pre-tax amoritzation expense 2,301 1,940 1,955 5,213 4,418 3,388 2,792 Less: Nonrecurring expense 6,000 2,375 4,394 3,236 26 82 325 Adjusted noninterest expense [f] $104,653 $105,207 $99,986 $111,650 $114,853 $84,883 $88,875 Average earning assets $4,459,354 $4,829,141 $5,254,431 $5,699,985 $5,800,648 $5,723,484 $6,498,162 Efficiency Ratio 61.96% 59.59% 55.16% 52.16% 54.25% 53.69% 52.55% Efficiency Ratio (FTE)(2) [f] /[g] 56.38% 54.08% 50.30% 49.98% 52.36% 51.85% 50.06% Net interest margin(FTE) 3.02% 2.89% 2.74% 3.02% 2.93% 2.96% (1) 2.85% (1) Net interest margin(FTE) (2) 3.40% 3.26% 3.07% 3.18% 3.06% 3.09% (1) 3.02% (1) Net interest spread 2.94% 2.77% 2.56% 2.72% 2.58% 2.60% (1) 2.64% (1) Net interest spread(FTE) (2) 3.31% 3.14% 2.89% 2.88% 2.71% 2.73% (1) 2.81% (1) As of and for the Year Ended December 31, As of and for the Nine Months Ended September

31 NASDAQ: SBSI Thank You