Attached files
| file | filename |
|---|---|
| 8-K - FORM 8-K - PLUG POWER INC | tm2035418-1_8k.htm |
Exhibit 99.1

Plug Power Reports a Record Third Quarter in the Company’s History
Raising 2020 gross billing guidance
| ● | Reported gross billings of $125.6M; reflecting growth of 106% year-over-year and 73.4% sequentially |
| ● | Reflecting strong performance in the quarter; raising 2020 gross billings guidance to $325M-$330M from $310M |
| ● | Hosted second annual virtual Plug Symposium showcasing strategic priorities in green hydrogen, market expansion, gigafactory and reaffirming revenue and EBITDA targets for 2024 |
| ● | Announced strategic partnerships with Brookfield Energy and Apex Clean Energy to source renewable electricity and build liquid green hydrogen plants |
| ● | Signed an MOU with Linde to deploy pilot class-6 and class-8 vehicles on road in 2021 |
| ● | Recent capital raise positions the company with over $725M in cash to execute on its growth initiatives |
Recap of the Third Quarter Financials
Plug Power achieved a record third quarter with gross billings of $125.6M, the highest quarter in the company's 22-year history. This gross billing is over 10% higher than the previous guidance and reflects growth of 106% year-over-year and 73.4% sequentially, above another record quarter in Q2 2020. Plug Power is raising 2020 full-year gross billings guidance to $325M-$330M up from $310M. |  |
Plug Power deployed another record 4,100 fuel cell systems and 13 hydrogen fueling stations in Q3 2020. This reflects year-over-year growth of 130% for fuel cell units deployed. This record growth aligns with Plug Power’s target to have cumulatively deployed over 40,000 GenDrive systems by year end, and to design, build and operate a fueling network in excess of 100 hydrogen fueling stations.
1
| The record number of GenDrive units deployed have logged almost 600M hours of runtime in the field and 32.4M hydrogen fills performed, which has resulted in 6.7M lbs of CO2 removed in 2020. These staggering numbers underscore the importance of the impact our products are making on the global logistics industry and sustainability during this ongoing pandemic. During the height of the pandemic, Plug Power’s robust products were operating at 99% efficiency and moved ~30% of the retail food and groceries through the United States to support the needs of customers like Walmart, Amazon, Kroger, SuperValu, Wegmans, and Aryzta. As the COVID-19 global crisis continues, Plug Power fuel systems continue to run at record high levels, and we continue to be deemed an essential business due to our role within the global food supply chain. |  |
Pedestal Customer Warrants Update
As has been previously disclosed, in 2017 Plug Power entered into commercial agreements with two key pedestal multisite customers which provide warrants for each customer to procure shares of Plug Power's common stock at varied negotiated stock prices. The vesting for the warrants occurs commensurate with each customer paying Plug $600 million in cash for fuel cell technology solutions. Based on the agreements, the strike price of the warrants varies and includes portions where the strike price is set at certain milestones. The Company primarily records the non-cash warrant charges commensurate with the associated revenues as recognized. As such, the total non-cash warrant charges recorded in the third quarter 2020 of $22.9 million were substantially higher than previous reporting periods as a result of higher purchases during the quarter. On November 2, 2020, one of the customers met a critical milestone and the strike price was set for their next tranche at $13.81 (based on the contractual formula). This strike price is substantially higher than previous warrants, given the recent growth in Plug’s share price. The details of the warrants and vesting activities will be described in more detail in the 3rd quarter 2020 Form 10-Q.
2
For reference and context of the current results and future results if and when these customer warrant charges have been fully recorded, Plug Power’s 3rd quarter results without the impact of the total non-cash warrant charges would have been as follows:
| Results (millions except EPS) | Q3 2020 GAAP | Q3 2020 Proforma | ||||||
| Gross Billings | $ | 125.6 | $ | 125.6 | ||||
| Gross Margin (Loss) | $ | (1.3 | ) | $ | 21.6 | |||
| Operating Income (Loss) | $ | (27.5 | ) | $ | (4.6 | ) | ||
| Adjusted EBITDA | N/A | $ | 24.0 | |||||
| EPS | $ | (0.11 | ) | $ | (0.04 | ) | ||
Summary of the 2020 Plug Symposium
Plug Power held its second annual Plug Symposium virtually on September 24, 2020. As a leading provider of comprehensive hydrogen fuel cell solutions, Plug Power is at the center of the paradigm shift in the energy, transportation and power industries. The Symposium presented an engaging dialogue on advancing sustainable solutions for an electrified world and featured a deep dive into the state of the global green hydrogen economy. A replay of the 2020 Plug Symposium can be found at https://www.youtube.com/watch?v=SNoFyTUy--Y&t=2871s and the full Plug Symposium slide deck is available at https://www.ir.plugpower.com/Home/default.aspx.

3
Key discussions during the Plug Symposium included:
| ● | Green Hydrogen: |
Plug Power announced plans to build 5 green hydrogen plants in the US working with strategic partners. The company has started work on the design phase of the first two plants with expected completion by the end of 2022. Plug Power expects to have all five plants operational by 2024 with a total capacity of 100 tons per day (TPD). Plug Power green hydrogen generation plants will be one of the first green hydrogen generation networks in North America, with plans to expand globally. The company’s recent acquisitions of Giner ELX and United Hydrogen ideally position Plug Power to execute on this green hydrogen generation buildout.

4
| ● | World’s first PEM technology gigafactory: |
Plug Power’s gigafactory will have more than 1.5 gigawatts of capacity with room for upside expansion. That’s more than 7 million MEAs annually, more than 7 million bipolar plates, 500 megawatts of electrolyzer stacks, and more than 60,000 fuel-cell stacks per year. State-of-the-art equipment for the factory has been ordered. We will have high-speed roll-to-roll coating, high-volume MEA lamination processes, automated metal plate stamping, laser cutting, and laser welding, robotic gasketing, and, of course, automated stack assembly for fuel cells and electrolyzers. The operations will be inline and linked with automatic visual defect detection and IoT-based process measurement.

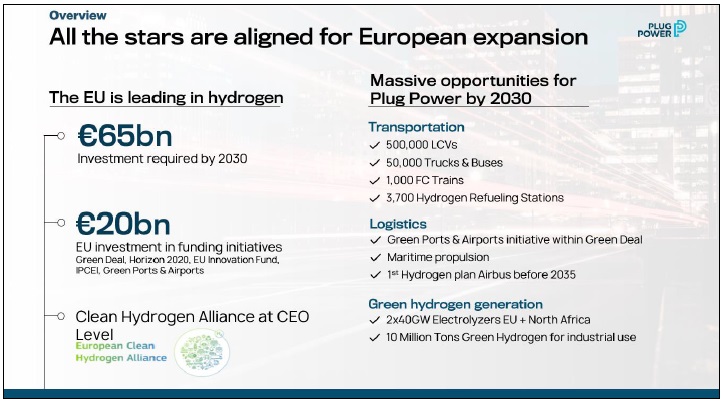
| ● | European Expansion: |
In the third quarter, Plug Power added Corine Dubruel to its executive team as Vice President and Managing Director, Europe. Corine has extensive experience in the fields of hydrogen energy, renewables, e-mobility, smart grids and energy storage and will lead initiatives to strengthen the company’s European sales strategy for material handling, on-road and other applications.
5
Europe has rolled out ambitious targets for the hydrogen economy and Plug Power is executing on its strategy to become one of the European leaders. This includes a targeted account strategy for material handling as well as securing strategic partnerships with European OEMs, energy companies, utility leaders and accelerating our electrolyzer business.
| ● | Data Centers: |
With the release of the GenSure HP product in the third quarter, Plug Power entered the $30 billion large scale stationary power and data center markets. We have utilized our 125 kw ProGen engine in a scalable array to produce a containerized megawatt scale system that is targeted at the diesel Genset replacement market. For this product line, we will begin shipments of 1.5 megawatt stationary solutions in the first half of 2021.
Demand for these products is increasing in the US, where corporate sustainability goals are being set, and in Europe, where low cost of electricity is allowing new greenfield data centers. We are seeing major data center operators, like Microsoft, move to eliminate dirty diesel to use cleaner fuels - Plug Power has a scalable solution to meet this need and we will be deploying large-scale power systems in 2021.
6
Guidance for 2021 and Outlook for 2024 Recap
We remain focused on building the green hydrogen economy in an electrified world. Plug Power is raising the 2020 full-year gross billings guidance to $325M-$330M from $310M. We are pleased to report that the proforma Adjusted EBITDA margin in Q3 2020 of 19%, as outlined above, is approaching our target Adjusted EBITDA margin of 20% by 2024. The improvement in the 3rd quarter 2020 is driven by growth in sales, ongoing cost reductions, and the increasing leverage on operating costs. Furthermore, the annualized rate based on Q3 deployments of over 4,000 units represents almost 65% of the annual deployment forecast of 25,000 units in the material handling market in 2024. Considering our 2021 gross billing guidance of $450 million, which we are also reaffirming, we believe we are well on our way to deliver on our 2024 targets of $1.2B in gross billings, $200M in operating income, and over 20% Adjusted EBITDA.
Again, we’d like to thank our employees for their hard work, especially during these trying times.
Be well,
 |  |
| Andrew Marsh, President and CEO | Paul Middleton, Chief Financial Officer |
Conference Call Information
The Company will host a live conference call and webcast today, November 9, 2020.
● Time: 10:00 am ET
● Toll-free: 877-405-1239
The webcast can be accessed at www.plugpower.com, selecting the conference call link on the home page, or directly at https://event.webcasts.com/starthere.jsp?ei=1351078&tp_key=c7fe17e5fa.
7
Cautionary Note on Forward-Looking Statements
This communication contains "forward-looking statements" within the meaning of the Private Securities Litigation Reform Act of 1995 that involve significant risks and uncertainties about Plug Power Inc. ("Plug"), including but not limited to statements about Plug's expectations regarding our 2020 and 2021 full-year guidance and 2024 financial targets; expectations regarding the effects of the acquisitions; expectations regarding the success of its partnerships; expectations regarding the number of GenDrive deployments and fueling stations by the end of 2020; expectations that its collaborations with pedestal customers will continue to increase and associated customer forecasts, including the timing of the non-cash warrant charges; expectations regarding the building of a fuel cell Gigafactory and green hydrogen plants and the timing of such operations; expectations regarding our ongoing expansion opportunities in Europe and expansion into on-road and other applications, including the green hydrogen generation business; expectations regarding the shipment of stationary solutions and our belief that we have the scalable solution and ability to deploy large scale power systems by 2021; the anticipated growth of the hydrogen economy; our position and capabilities in hydrogen generation, liquefaction and distribution of green hydrogen fuel, including our ability to facilitate the growth of the hydrogen economy; our ability to become one of the largest green hydrogen generation companies; our capabilities to drive costs down for the electrolyzer and liquefaction business; statements regarding our comprehensive solutions generating long-term growth and successfully serving multiple industries with low-cost green hydrogen; and expectations that hydrogen will play a systemic role in the transition to renewable energy sources. You are cautioned that such statements should not be read as a guarantee of future performance or results and will not necessarily be accurate indications of the times that, or by which, such performance or results will have been achieved. Such statements are subject to risks and uncertainties that could cause actual performance or results to differ materially from those expressed in these statements. You are cautioned that such statements should not be read as a guarantee of future performance or results and will not necessarily be accurate indications of the times that, or by which, such performance or results will have been achieved. Such statements are subject to risks and uncertainties that could cause actual performance or results to differ materially from those expressed in these statements. In particular, the risks and uncertainties include, among other things, the risk that we continue to incur losses and might never achieve or maintain profitability; the risk that we will need to raise additional capital to fund our operations and such capital may not be available to us; the risk of dilution to our stockholders and/or stock price; the risk that our lack of extensive experience in manufacturing and marketing products may impact our ability to manufacture and market products on a profitable and large-scale commercial basis; the risk that unit orders may not ship, be installed and/or converted to revenue, in whole or in part; the risk that a loss of one or more of our major customers, or if one of our major customers delays payment of or is unable to pay its receivables, a material adverse effect could result on our financial condition; the risk that a sale of a significant number of shares of stock could depress the market price of our common stock; the risk that our convertible senior notes, if settled in cash, could have a material effect on our financial results; the risk that our convertible note hedges may affect the value of our convertible senior notes and our common stock; the risk that negative publicity related to our business or stock could result in a negative impact on our stock value and profitability; the risk of potential losses related to any product liability claims or contract disputes; the risk of loss related to an inability to maintain an effective system of internal controls; our ability to attract and maintain key personnel; the risks related to the use of flammable fuels in our products; the risk that pending orders may not convert to purchase orders, in whole or in part; the cost and timing of developing, marketing and selling our products; the risks of delays in or not completing our product development goals; our ability to obtain financing arrangements to support the sale or leasing of our products and services to customers; our ability to achieve the forecasted gross margin on the sale of our products; the cost and availability of fuel and fueling infrastructures for our products; the risks, liabilities, and costs related to environmental, health and safety matters; the risk of elimination of government subsidies and economic incentives for alternative energy products; market acceptance of our products and services, including GenDrive, GenSure and GenKey systems; the volatility of our stock price; our ability to establish and maintain relationships with third parties with respect to product development, manufacturing, distribution and servicing, and the supply of key product components; the cost and availability of components and parts for our products; the risk that possible new tariffs could have a material adverse effect on our business; our ability to develop commercially viable products; our ability to reduce product and manufacturing costs; our ability to successfully market, distribute and service our products and services internationally; our ability to improve system reliability for our products; competitive factors, such as price competition and competition from other traditional and alternative energy companies; our ability to protect our intellectual property; the risk of dependency on information technology on our operations and the failure of such technology; the cost of complying with current and future federal, state and international governmental regulations; our subjectivity to legal proceedings and legal compliance; the risks associated with potential future acquisitions; and other risks and uncertainties referenced in our public filings with the Securities and Exchange Commission (the “SEC”). For additional disclosure regarding these and other risks faced by Plug, see the disclosures contained in Plug's public filings with the SEC including the "Risk Factors" section of Plug's Annual Report on Form 10-K for the year ended December 31, 2019 and Quarterly Reports on Form 10-Q for the quarters ended March 31, 2020 and June 30, 2020. You should consider these factors in evaluating the forward-looking statements included in this communication and not place undue reliance on such statements. The forward-looking statements are made as of the date hereof, and Plug undertakes no obligation to update such statements as a result of new information.
Plug Power Investor Contact
Roberto Frielander
investors@plugpower.com
Plug Power Media Contact
Teal Hoyos
plugpowerPR@bulleitgroup.com
8
Plug Power Inc. and Subsidiaries
Consolidated Balance Sheets
(In thousands, except share and per share amounts)
(Unaudited)
| September 30, | December 31, | |||||||
| 2020 | 2019 | |||||||
| Assets | ||||||||
| Current assets: | ||||||||
| Cash and cash equivalents | $ | 448,140 | $ | 139,496 | ||||
| Restricted cash | 55,704 | 54,813 | ||||||
| Accounts receivable | 113,133 | 25,448 | ||||||
| Inventory | 134,306 | 72,391 | ||||||
| Prepaid expenses and other current assets | 26,731 | 21,192 | ||||||
| Total current assets | 778,014 | 313,340 | ||||||
| Restricted cash | 227,528 | 175,191 | ||||||
| Property, plant, and equipment, net of accumulated depreciation of $20,661 and $17,417, respectively | 64,820 | 14,959 | ||||||
| Leased property, net | 309,475 | 244,740 | ||||||
| Goodwill | 71,962 | 8,842 | ||||||
| Intangible assets, net | 39,169 | 5,539 | ||||||
| Other assets | 9,661 | 8,573 | ||||||
| Total assets | $ | 1,500,629 | $ | 771,184 | ||||
| Liabilities, Redeemable Preferred Stock, and Stockholders’ Equity | ||||||||
| Current liabilities: | ||||||||
| Accounts payable | $ | 58,793 | $ | 40,376 | ||||
| Accrued expenses | 32,031 | 14,213 | ||||||
| Deferred revenue | 17,226 | 11,691 | ||||||
| Finance obligations | 63,692 | 49,507 | ||||||
| Current portion of long-term debt | 74,829 | 26,461 | ||||||
| Other current liabilities | 17,280 | 8,543 | ||||||
| Total current liabilities | 263,851 | 150,791 | ||||||
| Deferred revenue | 29,648 | 23,369 | ||||||
| Finance obligations | 337,150 | 265,228 | ||||||
| Convertible senior notes, net | 105,088 | 110,246 | ||||||
| Long-term debt | 120,380 | 85,708 | ||||||
| Other liabilities | 27,068 | 13 | ||||||
| Total liabilities | 883,185 | 635,355 | ||||||
| Redeemable preferred stock: | ||||||||
| Series C redeemable convertible preferred stock, $0.01 par value per share (aggregate involuntary liquidation preference $16,664); 10,431 shares authorized; Issued and outstanding: zero at September 30, 2020 and 2,620 at December 31, 2019 | — | 709 | ||||||
| Series E redeemable preferred stock, $0.01 par value per share; Shares authorized: 35,000 at both September 30, 2020 and December 31, 2019; Issued and outstanding: zero at September 30, 2020 and 500 at December 31, 2019 | — | 441 | ||||||
| Stockholders’ equity: | ||||||||
| Common stock, $0.01 par value per share; 750,000,000 shares authorized; Issued (including shares in treasury): 406,123,816 at September 30, 2020 and 318,637,560 at December 31, 2019 | 4,061 | 3,186 | ||||||
| Additional paid-in capital | 2,083,199 | 1,507,116 | ||||||
| Accumulated other comprehensive income | 1,958 | 1,400 | ||||||
| Accumulated deficit | (1,431,340 | ) | (1,345,807 | ) | ||||
| Less common stock in treasury: 15,926,068 at September 30, 2020 and 15,259,045 at December 31, 2019 | (40,434 | ) | (31,216 | ) | ||||
| Total stockholders’ equity | 617,444 | 134,679 | ||||||
| Total liabilities, redeemable preferred stock, and stockholders’ equity | $ | 1,500,629 | $ | 771,184 | ||||
9
Plug Power Inc. and Subsidiaries
Consolidated Statement of Operations
(In thousands, except share and per share amounts)
(Unaudited)
| Three Months Ended | Nine Months Ended | |||||||||||||||
| September 30, | September 30, | |||||||||||||||
| 2020 | 2019 | 2020 | 2019 | |||||||||||||
| Net revenue: | ||||||||||||||||
| Sales of fuel cell systems and related infrastructure | $ | 83,528 | $ | 38,877 | $ | 151,661 | $ | 80,117 | ||||||||
| Services performed on fuel cell systems and related infrastructure | 6,829 | 6,205 | 19,586 | 17,889 | ||||||||||||
| Power Purchase Agreements | 6,704 | 6,595 | 19,854 | 19,114 | ||||||||||||
| Fuel delivered to customers | 9,831 | 7,649 | 24,536 | 21,320 | ||||||||||||
| Other | 97 | 135 | 235 | 135 | ||||||||||||
| Net revenue | 106,989 | 59,461 | 215,872 | 138,575 | ||||||||||||
| Cost of revenue: | ||||||||||||||||
| Sales of fuel cell systems and related infrastructure | 68,509 | 24,990 | 115,929 | 50,440 | ||||||||||||
| Services performed on fuel cell systems and related infrastructure | 7,074 | 6,461 | 21,746 | 18,802 | ||||||||||||
| Provision for loss contracts related to service | 4,306 | — | 4,306 | — | ||||||||||||
| Power Purchase Agreements | 14,087 | 10,353 | 42,034 | 28,064 | ||||||||||||
| Fuel delivered to customers | 14,172 | 9,160 | 32,267 | 25,935 | ||||||||||||
| Other | 131 | 150 | 275 | 150 | ||||||||||||
| Total cost of revenue | 108,279 | 51,114 | 216,557 | 123,391 | ||||||||||||
| Gross profit | (1,290 | ) | 8,347 | (685 | ) | 15,184 | ||||||||||
| Operating expenses: | ||||||||||||||||
| Research and development | 11,964 | 8,028 | 32,133 | 24,334 | ||||||||||||
| Selling, general and administrative | 14,277 | 10,400 | 46,948 | 33,351 | ||||||||||||
| Total operating expenses | 26,241 | 18,428 | 79,081 | 57,685 | ||||||||||||
| Operating loss | (27,531 | ) | (10,081 | ) | (79,766 | ) | (42,501 | ) | ||||||||
| Interest and other expense, net | (17,241 | ) | (7,972 | ) | (42,022 | ) | (24,178 | ) | ||||||||
| Change in fair value of common stock warrant liability | — | 427 | — | 7 | ||||||||||||
| Change in fair value of contingent consideration | (1,130 | ) | — | (1,130 | ) | — | ||||||||||
| Gain (loss) on extinguishment of debt | — | (518 | ) | 13,222 | (518 | ) | ||||||||||
| Loss before income taxes | $ | (45,902 | ) | $ | (18,144 | ) | $ | (109,696 | ) | $ | (67,190 | ) | ||||
| Income tax benefit | 6,523 | — | 24,182 | — | ||||||||||||
| Net loss attributable to the Company | $ | (39,379 | ) | $ | (18,144 | ) | $ | (85,514 | ) | $ | (67,190 | ) | ||||
| Preferred stock dividends declared and accretion of discount | — | (13 | ) | (19 | ) | (39 | ) | |||||||||
| Net loss attributable to common stockholders | $ | (39,379 | ) | $ | (18,157 | ) | $ | (85,533 | ) | $ | (67,229 | ) | ||||
| Net loss per share: | ||||||||||||||||
| Basic and diluted | $ | (0.11 | ) | $ | (0.08 | ) | $ | (0.26 | ) | $ | (0.29 | ) | ||||
| Weighted average number of common stock outstanding | 371,010,544 | 236,759,521 | 330,949,265 | 229,519,323 | ||||||||||||
| 10 |
Plug Power Inc. and Subsidiaries
Consolidated Statement of Cash Flows
(In thousands)
(Unaudited)
| Nine months ended | ||||||||
| September 30, | ||||||||
| 2020 | 2019 | |||||||
| Operating Activities | ||||||||
| Net loss attributable to the Company | $ | (85,514 | ) | $ | (67,190 | ) | ||
| Adjustments to reconcile net loss to net cash used in operating activities: | ||||||||
| Depreciation of property, plant and equipment, and leased property | 9,381 | 8,944 | ||||||
| Amortization of intangible assets | 835 | 518 | ||||||
| Stock-based compensation | 9,258 | 7,927 | ||||||
| Gain on extinguishment of debt | (13,222 | ) | — | |||||
| Provision for bad debts and other assets | — | 1,253 | ||||||
| Amortization of debt issuance costs and discount on convertible senior notes | 12,183 | 6,257 | ||||||
| Provision for common stock warrants | 25,198 | 3,706 | ||||||
| Loss on disposal of leased assets | — | 212 | ||||||
| Fair value adjustment to contingent consideration | 1,130 | — | ||||||
| Provision for loss contracts related to service | 4,306 | — | ||||||
| Change in fair value of common stock warrant liability | — | (7 | ) | |||||
| Income tax benefit | (24,182 | ) | — | |||||
| Accounts receivable | (86,004 | ) | 11,702 | |||||
| Inventory | (57,718 | ) | (32,691 | ) | ||||
| Prepaid expenses, and other assets | (4,956 | ) | 427 | |||||
| Accounts payable, accrued expenses, and other liabilities | 35,748 | 13,293 | ||||||
| Deferred revenue | 16,647 | (6,152 | ) | |||||
| Net cash used in operating activities | (156,910 | ) | (51,801 | ) | ||||
| Investing Activities | ||||||||
| Purchases of property, plant and equipment | (11,265 | ) | (4,635 | ) | ||||
| Purchase of intangible assets | (1,638 | ) | (1,860 | ) | ||||
| Purchases for construction of leased property | (13,699 | ) | (2,851 | ) | ||||
| Net cash paid for acquisitions | (45,113 | ) | — | |||||
| Proceeds from sale of leased assets | — | 375 | ||||||
| Net cash used in investing activities | (71,715 | ) | (8,971 | ) | ||||
| Financing Activities | ||||||||
| Proceeds from issuance of preferred stock, net of transaction costs | — | (37 | ) | |||||
| Proceeds from public offerings, net of transaction costs | 344,398 | 38,098 | ||||||
| Proceeds from exercise of stock options | 23,335 | (116 | ) | |||||
| Payments for redemption of preferred stock | — | (4,040 | ) | |||||
| Proceeds from issuance of convertible senior notes, net | 205,098 | 39,052 | ||||||
| Repurchase of convertible senior notes | (90,238 | ) | — | |||||
| Purchase of capped calls | (16,253 | ) | — | |||||
| Proceeds from termination of capped calls | 24,158 | — | ||||||
| Principal payments on long-term debt | (27,845 | ) | (21,186 | ) | ||||
| Proceeds from long-term debt, net | 99,000 | 99,496 | ||||||
| Repayments of finance obligations | (18,634 | ) | (59,461 | ) | ||||
| Proceeds from finance obligations | 47,568 | 57,249 | ||||||
| Net cash provided by financing activities | 590,587 | 149,055 | ||||||
| Effect of exchange rate changes on cash | (90 | ) | (119 | ) | ||||
| Increase in cash, cash equivalents and restricted cash | 361,872 | 88,164 | ||||||
| Cash, cash equivalents, and restricted cash beginning of period | 369,500 | 110,153 | ||||||
| Cash, cash equivalents, and restricted cash end of period | $ | 731,372 | 198,317 | |||||
| Supplemental disclosure of cash flow information | ||||||||
| Cash paid for interest | $ | 16,975 | 8,673 | |||||
| Summary of non-cash investing and financing activity | ||||||||
| Recognition of right of use asset | $ | 56,377 | 78,626 | |||||
| Conversion of preferred stock to common stock | — | 1,883 | ||||||
| Conversion of convertible notes to common stock | 42,873 | — | ||||||
| 11 |
Plug Power Inc.
Reconciliation of Non-GAAP Financial Measures
(Dollars in 000's)
As referenced in our third quarter shareholder letter, the proforma amounts below reflect adjusted basis for context and reference on Q3 2020 results and for future reporting
| For the three months ended September 30, | ||||
| Reconciliation of Reported Operating Loss to Proforma Adjusted EBITDA | 2020 | |||
| Operating loss, as reported | $ | (27,531 | ) | |
| Stock-based compensation(1) | 3,070 | |||
| Depreciation and amortization(2) | 4,035 | |||
| Right-of-use asset depreciation and interest associated with PPA financings(3) | 14,607 | |||
| Costs associated with acquisitions, restructuring and other charges(4) | 6,890 | |||
| Provision for loss contracts related to service (5) | 4,306 | |||
| Provision for common stock warrants (5) | 18,626 | |||
| Proforma Adjusted EBITDA | $ | 24,003 | ||
| Reconciliation of Reported Operating Loss to Proforma Operating Loss | ||||
| Operating loss, as reported | $ | (27,531 | ) | |
| Provision for loss contracts related to service | 4,306 | |||
| Provision for common stock warrants | 18,626 | |||
| Proforma Operating Loss | $ | (4,599 | ) | |
| Reconciliation of Reported Gross Profit to Proforma Gross Profit | ||||
| Gross profit, as reported | $ | (1,290 | ) | |
| Provision for loss contracts related to service | 4,306 | |||
| Provision for common stock warrants | 18,626 | |||
| Proforma Gross Profit | $ | 21,642 | ||
| Reconciliation of Reported Net Loss Attributable
to Common Stockholders to Proforma Net Loss Attributable to Common Stockholders | For the three months ended September 30, 2020 | |||
| Net loss attributable to common stockholders, as reported | $ | (39,379 | ) | |
| Provision for loss contracts related to service | $ | 4,306 | ||
| Provision for common stock warrants | 18,626 | |||
| Proforma net loss attributable to common stockholders | $ | (16,447 | ) | |
| Proforma diluted net loss per share | $ | (0.04 | ) | |
| Diluted weighted average number of common shares outstanding | 371,010,544 | |||
| Reconciliation of Forecasted Operating Income to Adjusted EBITDA | For the year ended December 31, 2024 | |||
| Operating (loss) income, as forecasted | $ | 200,000 | ||
| Stock-based compensation(1) | 15,000 | |||
| Depreciation and amortization(2) | 35,000 | |||
| Adjusted EBITDA | $ | 250,000 | ||
Non-GAAP Measures
To supplement the Company’s unaudited financial data presented on a generally accepted accounting principles (GAAP) basis, management has used proforma adjusted/adjusted EBITDA, proforma operating loss, proforma gross profit, proforma net loss attributable to common stockholders, and proforma diluted net loss per share, which are non-GAAP measures. Proforma adjusted/adjusted EBITDA is defined as operating income (loss), plus stock-based compensation, plus depreciation and amortization, plus right-of-use asset depreciation and interest associated with PPA financings, plus costs associated with acquisitions, restructuring and other charges, plus provision for loss contracts related to service, plus provisions associated with common stock warrants. Proforma operating loss is defined as operating loss, as reported, plus provision for loss contracts related to service plus provisions associated with common stock warrants. Proforma gross profit is defined as gross profit, as reported, plus provision for loss contracts related to service plus provisions associated with common stock warrants. Proforma net loss attributable to common stockholders is defined as net loss attributable to common stockholders, plus provision for loss contracts related to service plus provision associated with common stock warrants. Proforma diluted net loss per share is defined as proforma net loss attributable to common stockholders divided by diluted weighted average number of shares of common stock outstanding. These non-GAAP measures are indicators management uses as a basis for evaluating the Company’s performance as well as for forecasting future periods. Management also establishes performance targets, annual budgets and makes operating decisions based in part upon proforma adjusted/adjusted EBITDA, proforma operating loss, proforma gross profit, proforma net loss attributable to common stockholders, and proforma diluted net loss per share. Disclosure of these non-GAAP measures provide investors with the same information that management uses for these purposes. In addition, investors have historically requested and the Company has historically reported these non-GAAP financial measures as a means of providing consistent and comparable information with past reports of financial results. Proforma adjusted/adjusted EBITDA, proforma operating loss, proforma gross profit, proforma net loss attributable to common stockholders, and proforma diluted net loss per share are not measures of our performance under GAAP and should not be considered in isolation or as an alternative to reported operating loss, reported gross profit, reported net loss attributable to common stockholders, reported diluted net loss per share, or any other measures prepared in accordance with GAAP. While management believes that proforma adjusted/adjusted EBITDA, proforma operating loss, proforma gross profit, proforma net loss attributable to common stockholders, and proforma diluted net loss per share provide useful supplemental information to investors, there are limitations associated with the use of these measures. Proforma adjusted/adjusted EBITDA, proforma operating loss, proforma gross profit, proforma net loss attributable to common stockholders, and proforma diluted net loss per share are not prepared in accordance with GAAP and may not be directly comparable to similarly titled measures of other companies due to potential differences in the exact method of calculations. Proforma adjusted/adjusted EBITDA, proforma operating loss, proforma gross profit, proforma net loss attributable to common stockholders, and proforma diluted net loss per share should be read only in conjunction with the Company’s consolidated financial statements prepared in accordance with GAAP.
Notes
(1) Represents employee compensation in the form of the Company's stock or stock-based awards.
(2) Represents depreciation and amortization expense related to the Company's fixed assets and intangibles.
(3) Represents right-of-use asset depreciation and interest associated with operating leases. The right-of-use asset depreciation and interest expense associated with operating leases is calculated in accordance with ASC Topic 842, and is equal to operating lease expense during any given reporting period.
(4) Represents legal fees and costs associated with acquistions, restructuring and impact of COVID-19.
(5) Represents proforma adjustments associated with common stock warrant charges.
| 12 |