Attached files
| file | filename |
|---|---|
| 8-K - 8-K - PARK NATIONAL CORP /OH/ | prk-20201109.htm |

Piper Sandler East Coast Financial Services Conference PARK NATIONAL CORPORATION: Where you mean more

Safe Harbor Statement This presentation contains forward-looking statements that are provided to assist in the understanding of anticipated future financial performance. Forward-looking statements provide current expectations or forecasts of future events and are not guarantees of future performance. The forward-looking statements are based on management’s expectations and are subject to a number of risks and uncertainties. Although management believes that the expectations reflected in such forward-looking statements are reasonable, actual results may differ materially from those expressed or implied in such statements. Risks and uncertainties that could cause actual results to differ materially include, without limitation: the ever-changing effects of the novel coronavirus (COVID-19) pandemic - - the duration, extent and severity of which are impossible to predict, including the possibility of further resurgence in the spread of COVID-19 - - on economies (local, national and international) and markets, and on our customers, counterparties, employees and third-party service providers, as well as the effects of various responses of governmental and nongovernmental authorities to the COVID-19 pandemic, including public health actions directed toward the containment of the COVID-19 pandemic, and the implementation of fiscal stimulus packages; the impact of future governmental and regulatory actions upon our participation in and execution of government programs related to the COVID-19 pandemic; Park's ability to execute our business plan successfully and within the expected timeframe as well as our ability to manage strategic initiatives in light of the impact of the COVID-19 pandemic and the various responses to the COVID-19 pandemic; general economic and financial market conditions, specifically in the real estate markets and the credit markets, either nationally or in the states in which Park and our subsidiaries do business, may experience a weaker recovery than anticipated, in addition to the continuing impact of the COVID-19 pandemic on our customers’ operations and financial condition, either of which may result in adverse impacts on the demand for loan, deposit and other financial services, delinquencies, defaults and counterparties' inability to meet credit and other obligations and the possible impairment of collectability of loans; factors that can impact the performance of our loan portfolio, including real estate values and liquidity in our primary market areas, the financial health of our commercial borrowers and the success of construction projects that we finance, including any loans acquired in acquisition transactions; the effect of monetary and other fiscal policies (including the impact of money supply and interest rate policies of the Federal Reserve Board) as well as disruption in the liquidity and functioning of U.S. financial markets, as a result of the COVID-19 pandemic and government policies implemented in response thereto, may adversely impact prepayment penalty income, mortgage banking income, income from fiduciary activities, the value of securities, deposits and other financial instruments, in addition to the loan demand and the performance of our loan portfolio, and the interest rate sensitivity of our consolidated balance sheet as well as reduce interest margins; changes in consumer spending, borrowing and saving habits, whether due to changes in retail distribution strategies, consumer preferences and behavior, changes in business and economic conditions (including as a result of the COVID-19 pandemic and reactions thereto), legislative and regulatory initiatives (including those undertaken in response to the COVID-19 pandemic), or other factors may be different than anticipated; changes in unemployment levels in the states in which Park and our subsidiaries do business may be different than anticipated due to the continuing impact of the COVID-19 pandemic; changes in customers', suppliers', and other counterparties' performance and creditworthiness may be different than anticipated due to the continuing impact of the COVID-19 pandemic; the adequacy of our internal controls and risk management program in the event of changes in the market, economic, operational (including those which may result from more of our associates working remotely), asset/liability repricing, legal, compliance, strategic, cybersecurity, liquidity, credit and interest rate risks associated with Park's business; competitive pressures among financial services organizations could increase significantly, including product and pricing pressures (which could in turn impact our credit spreads), changes to third-party relationships and revenues, changes in the manner of providing services, customer acquisition and retention pressures, and our ability to attract, develop and retain qualified banking professionals; uncertainty regarding the nature, timing, cost and effect of changes in banking regulations or other regulatory or legislative requirements affecting the respective businesses of Park and our subsidiaries, including major reform of the regulatory oversight structure of the financial services industry and changes in laws and regulations concerning taxes, FDIC insurance premium levels, pensions, bankruptcy, consumer protection, rent regulation and housing, financial accounting and reporting, environmental protection, insurance, bank products and services, bank and bank holding company capital and liquidity standards, fiduciary standards, securities and other aspects of the financial services industry, specifically the reforms provided for in the Coronavirus Aid, Relief and Economic Security (CARES) Act, the Dodd-Frank Wall Street Reform and Consumer Protection Act of 2010 (the “Dodd-Frank Act”) and the Basel III regulatory capital reforms, as well as regulations already adopted and which may be adopted in the future by the relevant regulatory agencies, including the Consumer Financial Protection Bureau, the Office of the Comptroller of the Currency, the Federal Deposit Insurance Corporation, and the Federal Reserve Board, to implement the provisions of the CARES Act, the provisions of the Dodd-Frank Act, and the Basel III regulatory capital reforms; the effect of changes in accounting policies and practices, as may be adopted by the Financial Accounting Standards Board (the "FASB"), the SEC, the Public Company Accounting Oversight Board and other regulatory agencies, including the extent to which the new current expected credit loss ("CECL") accounting standard issued by the FASB in June 2016 and in accordance with the CARES Act, the adoption of which can be deferred by Park (with retrospective application as of January 1, 2020) until the earlier of: (1) the date on which the national emergency concerning the COVID-19 outbreak terminates; or (2) December 31, 2020, may adversely affect Park's reported financial condition or results of operations; Park's assumptions and estimates used in applying critical accounting policies and modeling, including under the CECL model, when adopted by Park, which may prove unreliable, inaccurate or not predictive of actual results; significant changes in the tax laws, which may adversely affect the fair values of net deferred tax assets and obligations of state and political subdivisions held in Park's investment securities portfolio; the impact of Park's ability to anticipate and respond to technological changes on Park's ability to respond to customer needs and meet competitive demands; operational issues stemming from and/or capital spending necessitated by the potential need to adapt to industry changes in information technology systems on which Park and our subsidiaries are highly dependent; the ability to secure confidential information and deliver products and services through the use of computer systems and telecommunications networks; a failure in or breach of Park's operational or security systems or infrastructure, or those of our third-party vendors and other service providers, resulting in failures or disruptions in customer account management, general ledger, deposit, loan, or other systems, including as a result of cyber attacks; the existence or exacerbation of general geopolitical instability and uncertainty as well as the effect of trade policies (including the impact of potential or imposed tariffs, a U.S. withdrawal from or significant renegotiation of trade agreements, trade wars and other changes in trade regulations and changes in the relationship of the U.S. and its global trading partners); the impact on financial markets and the economy of any changes in the credit ratings of the U.S. Treasury obligations and other U.S. government- backed debt, as well as issues surrounding the levels of U.S., European and Asian government debt and concerns regarding the growth rates and financial stability of certain sovereign governments, supranationals and financial institutions in Europe and Asia and the risk they may face difficulties servicing their sovereign debt; the uncertainty surrounding the actions to be taken to implement the referendum by United Kingdom voters to exit the European Union; our litigation and regulatory compliance exposure, including the costs and effects of any adverse developments in legal proceedings or other claims and the costs and effects of unfavorable resolution of regulatory and other governmental examinations or other inquiries; continued availability of earnings and excess capital sufficient for the lawful and prudent declaration of dividends; the impact on Park's business, personnel, facilities or systems of losses related to acts of fraud, scams and schemes of third parties; the impact of widespread natural and other disasters, pandemics (including the COVID-19 pandemic), dislocations, regional or national protests and civil unrest, terrorist activities or international hostilities on the economy and financial markets generally and on us or our counterparties specifically; any of the foregoing factors, or other cascading effects of the COVID-19 pandemic that are not currently foreseeable, could materially affect our business, including our customers' willingness to conduct banking transactions and their ability to pay on existing obligations; the effect of healthcare laws in the U.S. and potential changes for such laws, especially in light of the COVID-19 pandemic, which may increase our healthcare and other costs and negatively impact our operations and financial results; risk and uncertainties associated with Park's entry into new geographic markets with our recent acquisitions, including expected revenue synergies and cost savings from recent acquisitions not being fully realized or realized within the expected time frame; the discontinuation of the London Inter-Bank Offered Rate or LIBOR and other reference rates which may result in increased expenses and litigation, and adversely impact the effectiveness of hedging strategies; and other risk factors relating to the banking industry as detailed from time to time in Park's reports filed with the SEC including those described in "Item 1A. Risk Factors" of Part I of Park's Annual Report on Form 10-K for the fiscal year ended December 31, 2019 and in "Item 1A. Risk Factors" of Part II of Park’s Quarterly Report on Form 10-Q for the quarterly period ended September 30, 2020. Park does not undertake, and specifically disclaims any obligation, to publicly release the results of any revisions that may be made to update any forward-looking statement to reflect the events or circumstances after the date on which the forward-looking statement was made, or reflect the occurrence of unanticipated events, except to the extent required by law. 2 PARK NATIONAL CORPORATION
Disclaimer Non-GAAP Financial Metrics This presentation contains certain financial information determined by methods other than in accordance with accounting principles generally accepted in the United States (“GAAP”). Management believes that the disclosure of these “non-GAAP” financial measures presents additional information which, when read in conjunction with Park’s consolidated financial statements prepared in accordance with GAAP, assists in analyzing Park’s operating performance, ensures comparability of operating performance from period to period, and facilitates comparisons with the performance of Park’s peer financial holding companies, while eliminating certain non-operational effects of acquisitions. Additionally, Park believes this financial information is utilized by regulators and market analysts to evaluate a company’s financial condition, and therefore, such information is useful to investors. The non-GAAP financial measures should not be viewed as substitutes for operating results determined in accordance with GAAP, nor are they necessarily comparable to non-GAAP performance measures that may be presented by other companies. A reconciliation of the non-GAAP financial measures used in this presentation to the most directly comparable GAAP measures is provided beginning on pages 37 and 38 of this presentation. 3 PARK NATIONAL CORPORATION

Overview of Park National Corporation PARK NATIONAL CORPORATION
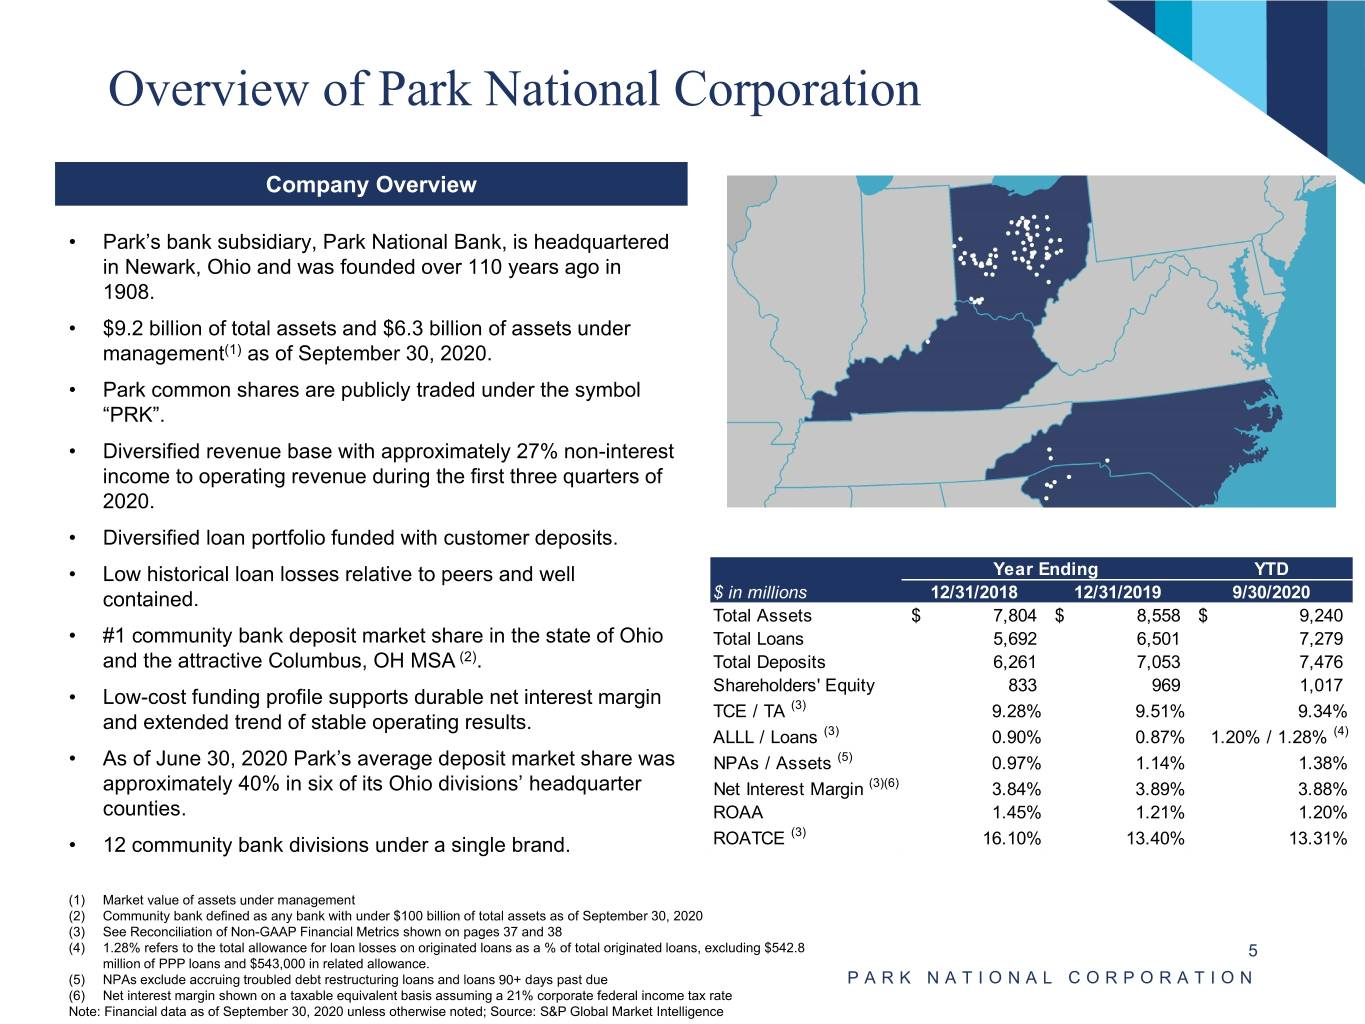
Overview of Park National Corporation Company Overview • Park’s bank subsidiary, Park National Bank, is headquartered in Newark, Ohio and was founded over 110 years ago in 1908. • $9.2 billion of total assets and $6.3 billion of assets under management(1) as of September 30, 2020. • Park common shares are publicly traded under the symbol “PRK”. • Diversified revenue base with approximately 27% non-interest income to operating revenue during the first three quarters of 2020. • Diversified loan portfolio funded with customer deposits. • Low historical loan losses relative to peers and well Year Ending YTD contained. $ in millions 12/31/2018 12/31/2019 9/30/2020 Total Assets $ 7,804 $ 8,558 $ 9,240 • #1 community bank deposit market share in the state of Ohio Total Loans 5,692 6,501 7,279 and the attractive Columbus, OH MSA (2). Total Deposits 6,261 7,053 7,476 Shareholders' Equity 833 969 1,017 • Low-cost funding profile supports durable net interest margin TCE / TA (3) 9.28% 9.51% 9.34% and extended trend of stable operating results. ALLL / Loans (3) 0.90% 0.87% 1.20% / 1.28% (4) • As of June 30, 2020 Park’s average deposit market share was NPAs / Assets (5) 0.97% 1.14% 1.38% approximately 40% in six of its Ohio divisions’ headquarter Net Interest Margin (3)(6) 3.84% 3.89% 3.88% counties. ROAA 1.45% 1.21% 1.20% (3) • 12 community bank divisions under a single brand. ROATCE 16.10% 13.40% 13.31% (1) Market value of assets under management (2) Community bank defined as any bank with under $100 billion of total assets as of September 30, 2020 (3) See Reconciliation of Non-GAAP Financial Metrics shown on pages 37 and 38 (4) 1.28% refers to the total allowance for loan losses on originated loans as a % of total originated loans, excluding $542.8 5 million of PPP loans and $543,000 in related allowance. (5) NPAs exclude accruing troubled debt restructuring loans and loans 90+ days past due PARK NATIONAL CORPORATION (6) Net interest margin shown on a taxable equivalent basis assuming a 21% corporate federal income tax rate Note: Financial data as of September 30, 2020 unless otherwise noted; Source: S&P Global Market Intelligence
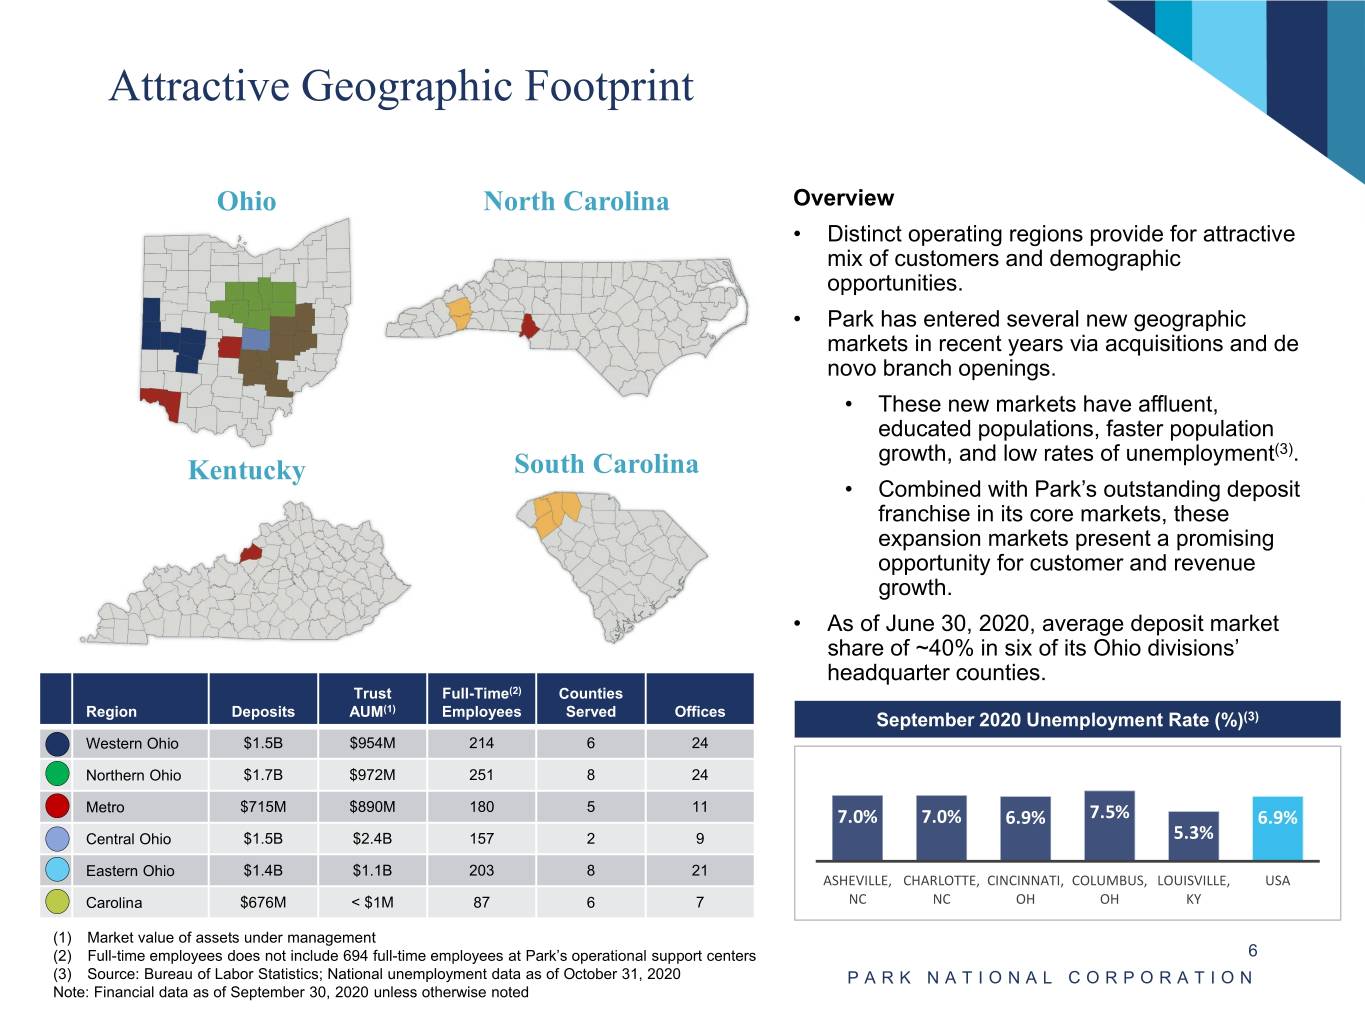
Attractive Geographic Footprint Ohio North Carolina Overview • Distinct operating regions provide for attractive mix of customers and demographic opportunities. • Park has entered several new geographic markets in recent years via acquisitions and de novo branch openings. • These new markets have affluent, educated populations, faster population growth, and low rates of unemployment(3). Kentucky South Carolina • Combined with Park’s outstanding deposit franchise in its core markets, these expansion markets present a promising opportunity for customer and revenue growth. • As of June 30, 2020, average deposit market share of ~40% in six of its Ohio divisions’ headquarter counties. Trust Full-Time(2) Counties (1) Region Deposits AUM Employees Served Offices September 2020 Unemployment Rate (%)(3) Western Ohio $1.5B $954M 214 6 24 Northern Ohio $1.7B $972M 251 8 24 Metro $715M $890M 180 5 11 7.0% 7.0% 6.9% 7.5% 6.9% Central Ohio $1.5B $2.4B 157 2 9 5.3% Eastern Ohio $1.4B $1.1B 203 8 21 ASHEVILLE, CHARLOTTE, CINCINNATI, COLUMBUS, LOUISVILLE, USA Carolina $676M < $1M 87 6 7 NC NC OH OH KY (1) Market value of assets under management (2) Full-time employees does not include 694 full-time employees at Park’s operational support centers 6 (3) Source: Bureau of Labor Statistics; National unemployment data as of October 31, 2020 PARK NATIONAL CORPORATION Note: Financial data as of September 30, 2020 unless otherwise noted
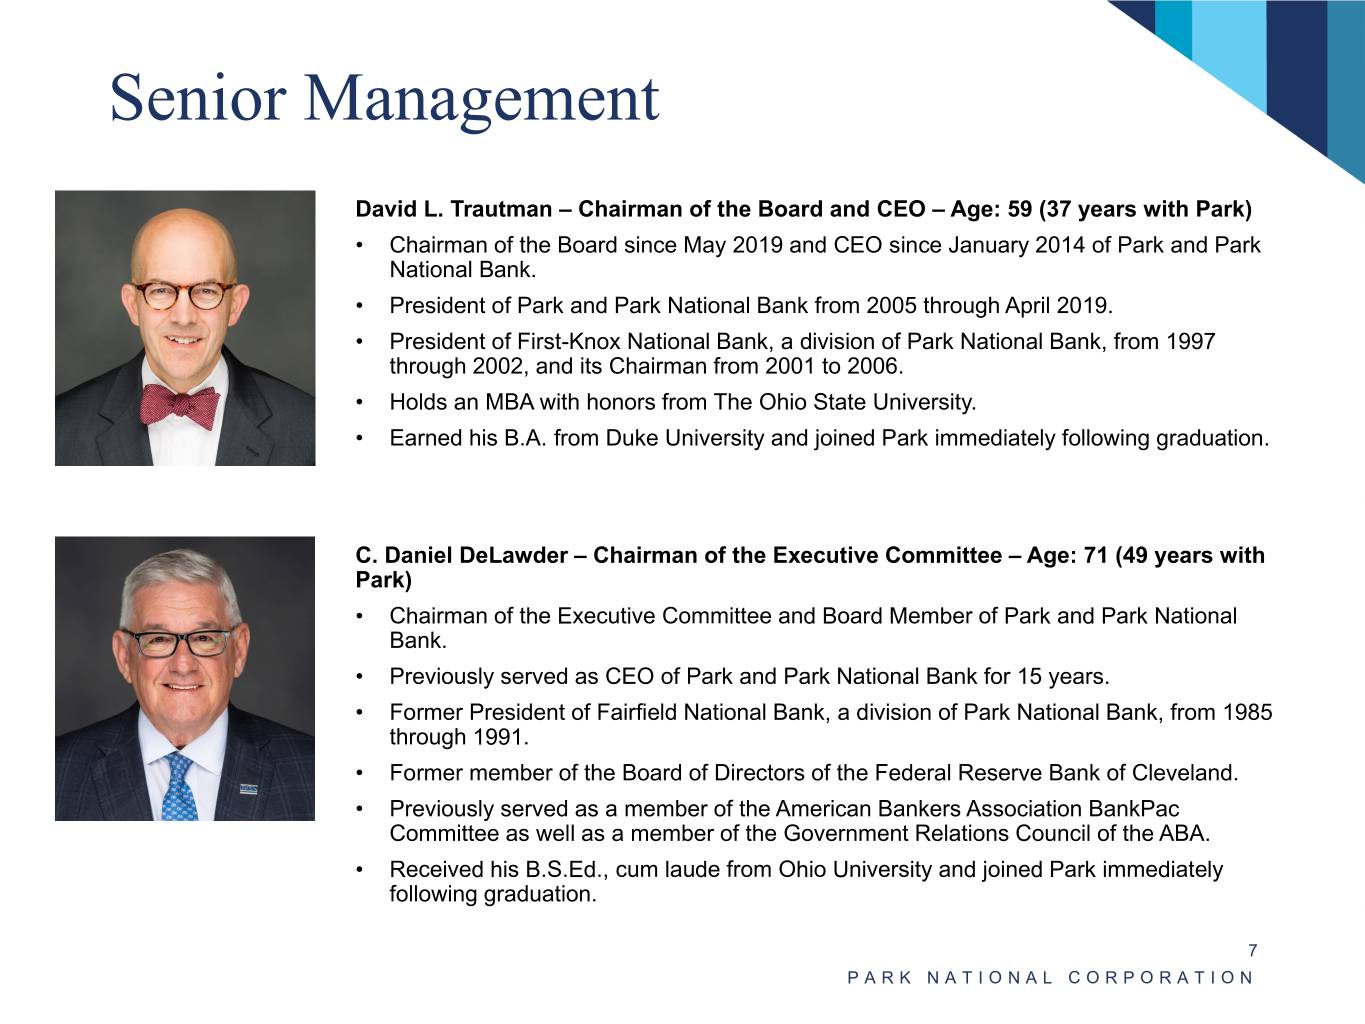
Senior Management David L. Trautman – Chairman of the Board and CEO – Age: 59 (37 years with Park) • Chairman of the Board since May 2019 and CEO since January 2014 of Park and Park National Bank. • President of Park and Park National Bank from 2005 through April 2019. • President of First-Knox National Bank, a division of Park National Bank, from 1997 through 2002, and its Chairman from 2001 to 2006. • Holds an MBA with honors from The Ohio State University. • Earned his B.A. from Duke University and joined Park immediately following graduation. C. Daniel DeLawder – Chairman of the Executive Committee – Age: 71 (49 years with Park) • Chairman of the Executive Committee and Board Member of Park and Park National Bank. • Previously served as CEO of Park and Park National Bank for 15 years. • Former President of Fairfield National Bank, a division of Park National Bank, from 1985 through 1991. • Former member of the Board of Directors of the Federal Reserve Bank of Cleveland. • Previously served as a member of the American Bankers Association BankPac Committee as well as a member of the Government Relations Council of the ABA. • Received his B.S.Ed., cum laude from Ohio University and joined Park immediately following graduation. 7 PARK NATIONAL CORPORATION
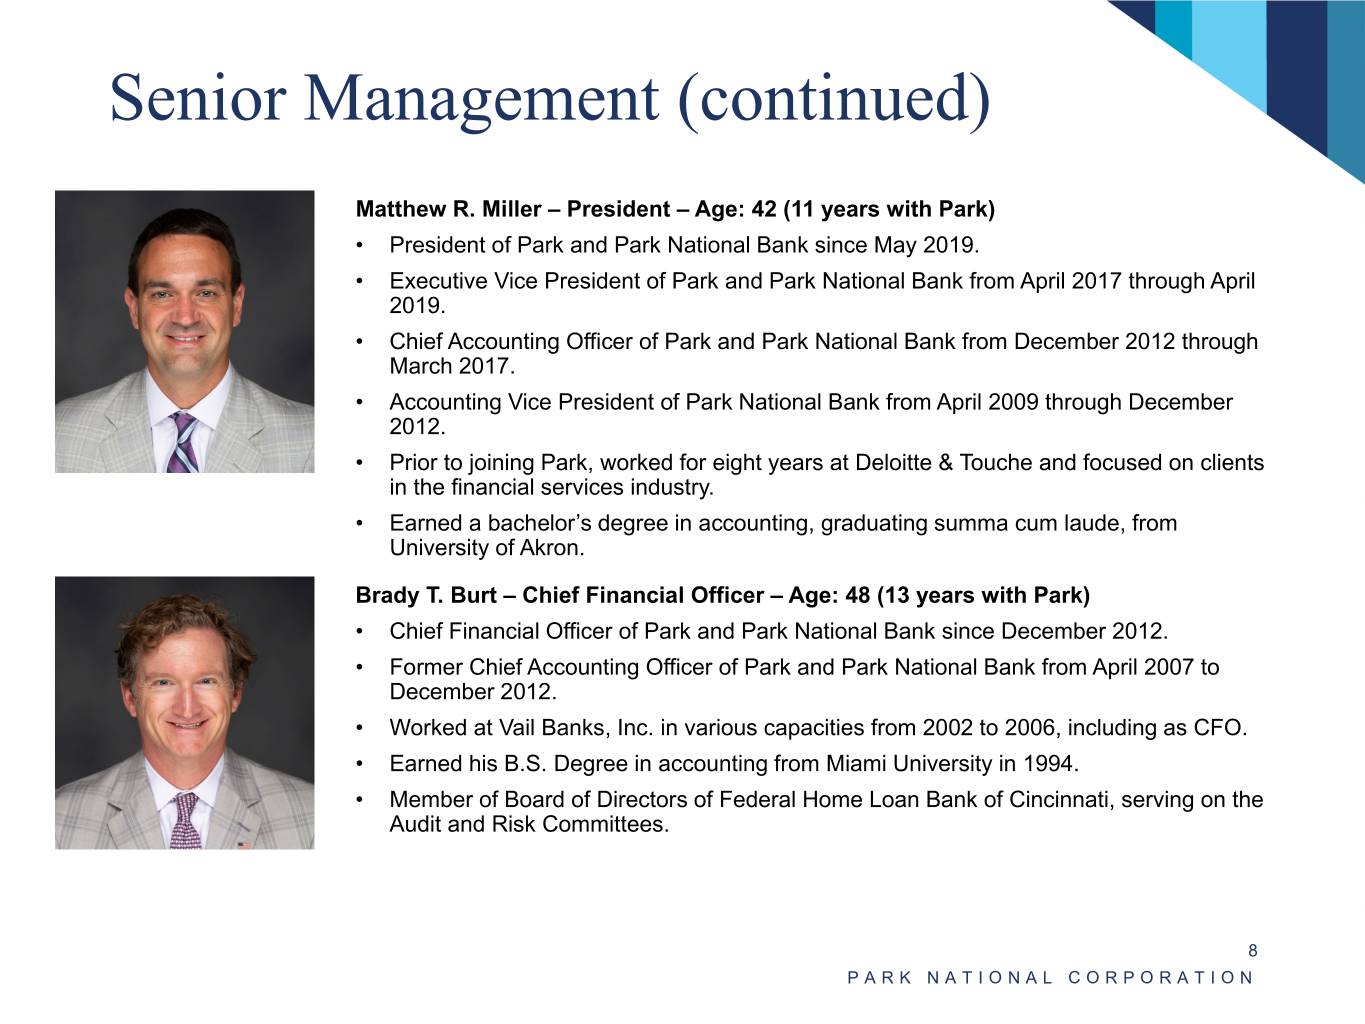
Senior Management (continued) Matthew R. Miller – President – Age: 42 (11 years with Park) • President of Park and Park National Bank since May 2019. • Executive Vice President of Park and Park National Bank from April 2017 through April 2019. • Chief Accounting Officer of Park and Park National Bank from December 2012 through March 2017. • Accounting Vice President of Park National Bank from April 2009 through December 2012. • Prior to joining Park, worked for eight years at Deloitte & Touche and focused on clients in the financial services industry. • Earned a bachelor’s degree in accounting, graduating summa cum laude, from University of Akron. Brady T. Burt – Chief Financial Officer – Age: 48 (13 years with Park) • Chief Financial Officer of Park and Park National Bank since December 2012. • Former Chief Accounting Officer of Park and Park National Bank from April 2007 to December 2012. • Worked at Vail Banks, Inc. in various capacities from 2002 to 2006, including as CFO. • Earned his B.S. Degree in accounting from Miami University in 1994. • Member of Board of Directors of Federal Home Loan Bank of Cincinnati, serving on the Audit and Risk Committees. 8 PARK NATIONAL CORPORATION
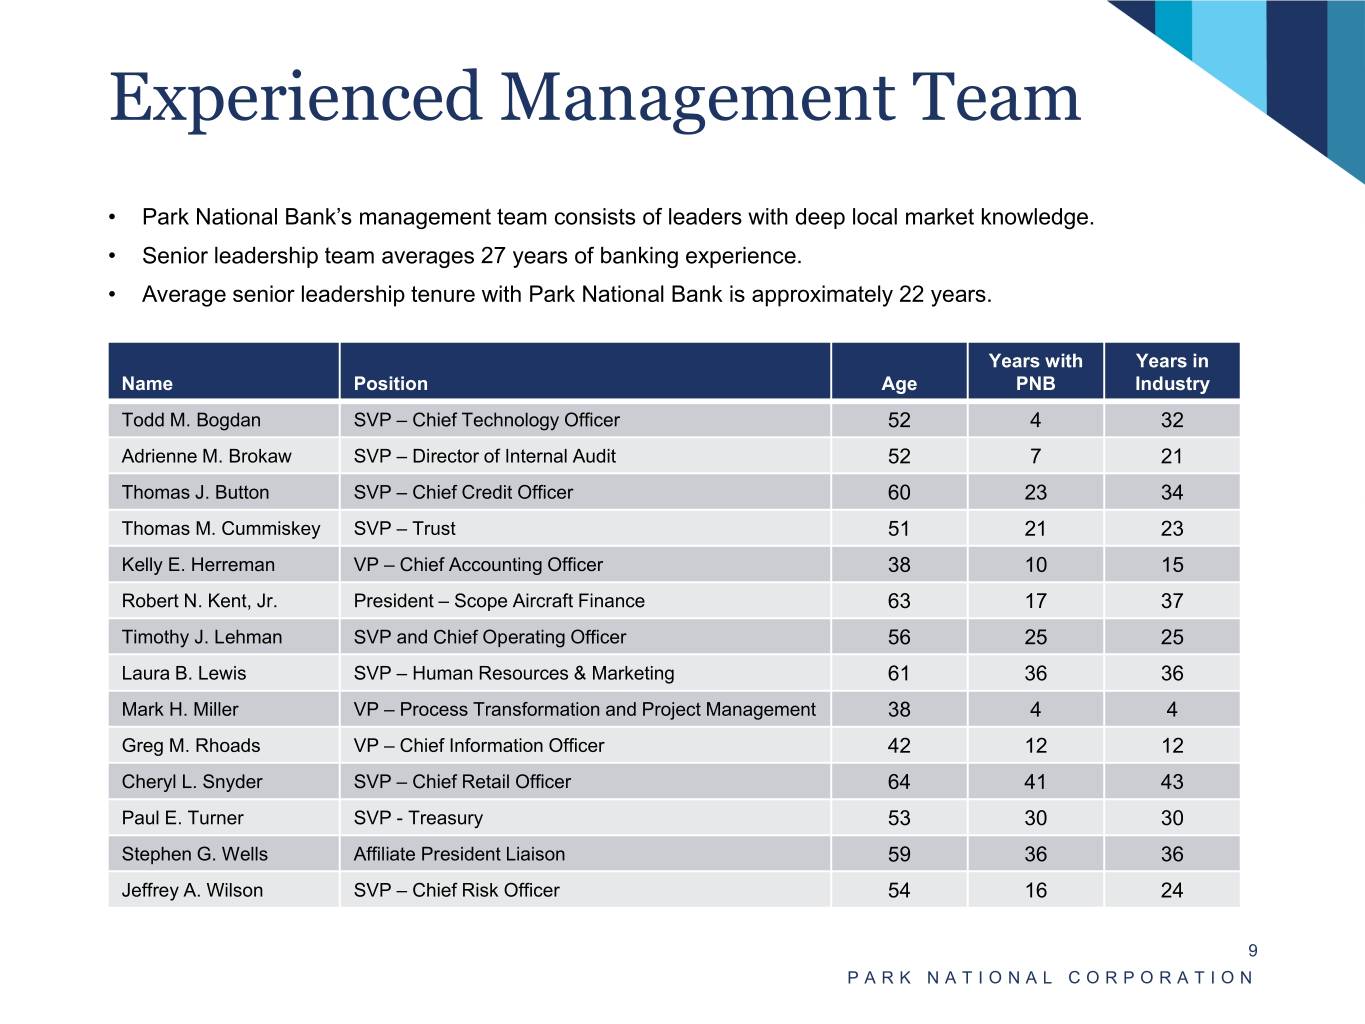
Experienced Management Team • Park National Bank’s management team consists of leaders with deep local market knowledge. • Senior leadership team averages 27 years of banking experience. • Average senior leadership tenure with Park National Bank is approximately 22 years. Years with Years in Name Position Age PNB Industry Todd M. Bogdan SVP – Chief Technology Officer 52 4 32 Adrienne M. Brokaw SVP – Director of Internal Audit 52 7 21 Thomas J. Button SVP – Chief Credit Officer 60 23 34 Thomas M. Cummiskey SVP – Trust 51 21 23 Kelly E. Herreman VP – Chief Accounting Officer 38 10 15 Robert N. Kent, Jr. President – Scope Aircraft Finance 63 17 37 Timothy J. Lehman SVP and Chief Operating Officer 56 25 25 Laura B. Lewis SVP – Human Resources & Marketing 61 36 36 Mark H. Miller VP – Process Transformation and Project Management 38 4 4 Greg M. Rhoads VP – Chief Information Officer 42 12 12 Cheryl L. Snyder SVP – Chief Retail Officer 64 41 43 Paul E. Turner SVP - Treasury 53 30 30 Stephen G. Wells Affiliate President Liaison 59 36 36 Jeffrey A. Wilson SVP – Chief Risk Officer 54 16 24 9 PARK NATIONAL CORPORATION
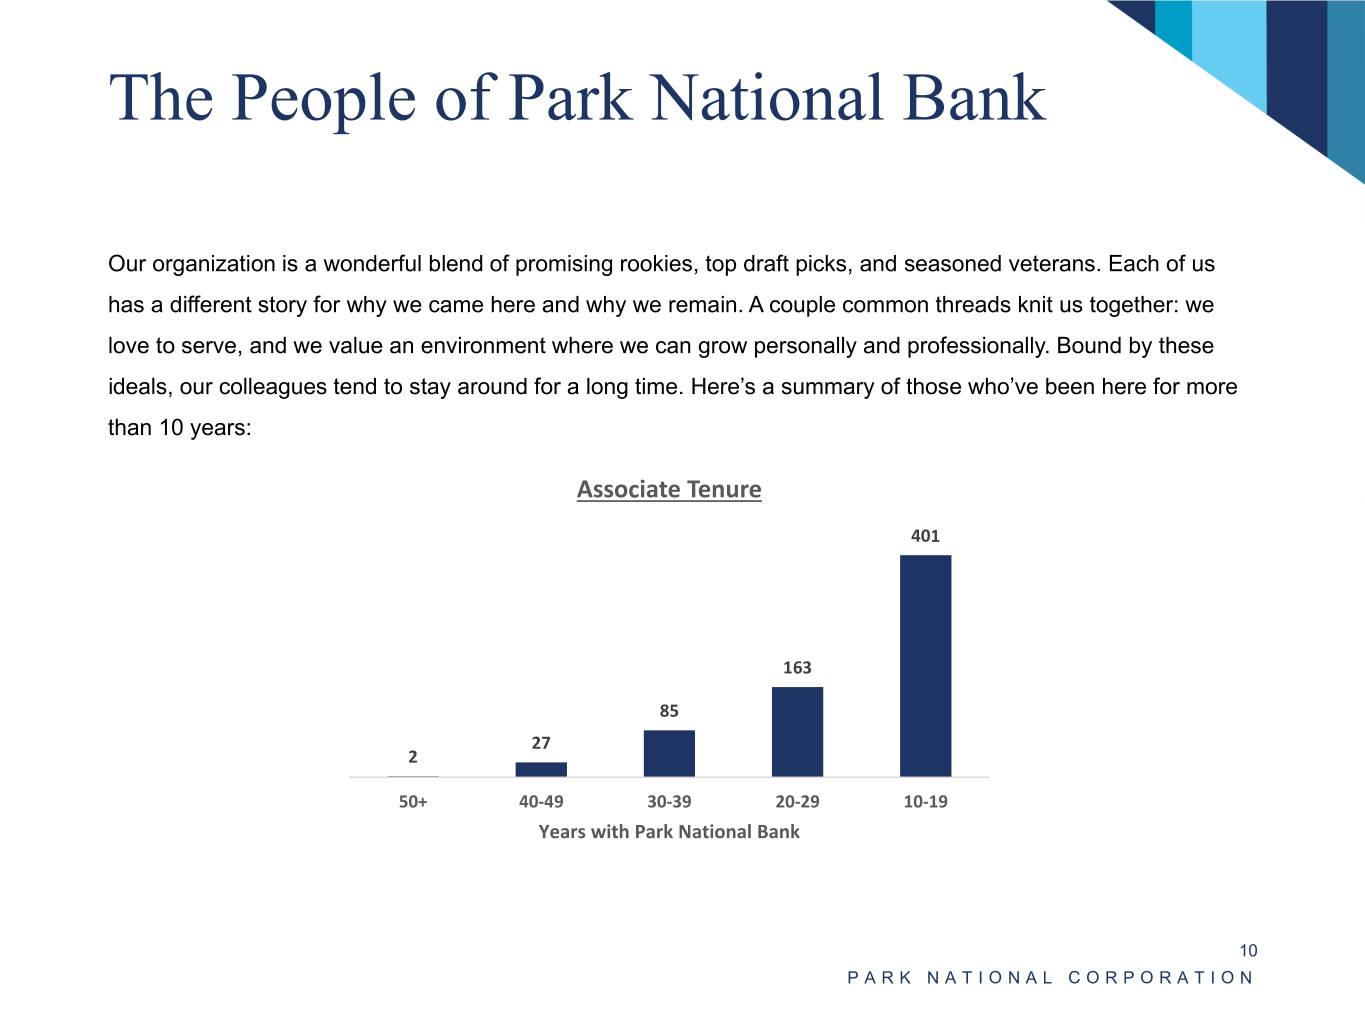
The People of Park National Bank Our organization is a wonderful blend of promising rookies, top draft picks, and seasoned veterans. Each of us has a different story for why we came here and why we remain. A couple common threads knit us together: we love to serve, and we value an environment where we can grow personally and professionally. Bound by these ideals, our colleagues tend to stay around for a long time. Here’s a summary of those who’ve been here for more than 10 years: Associate Tenure 401 163 85 27 2 50+ 40-49 30-39 20-29 10-19 Years with Park National Bank 10 PARK NATIONAL CORPORATION
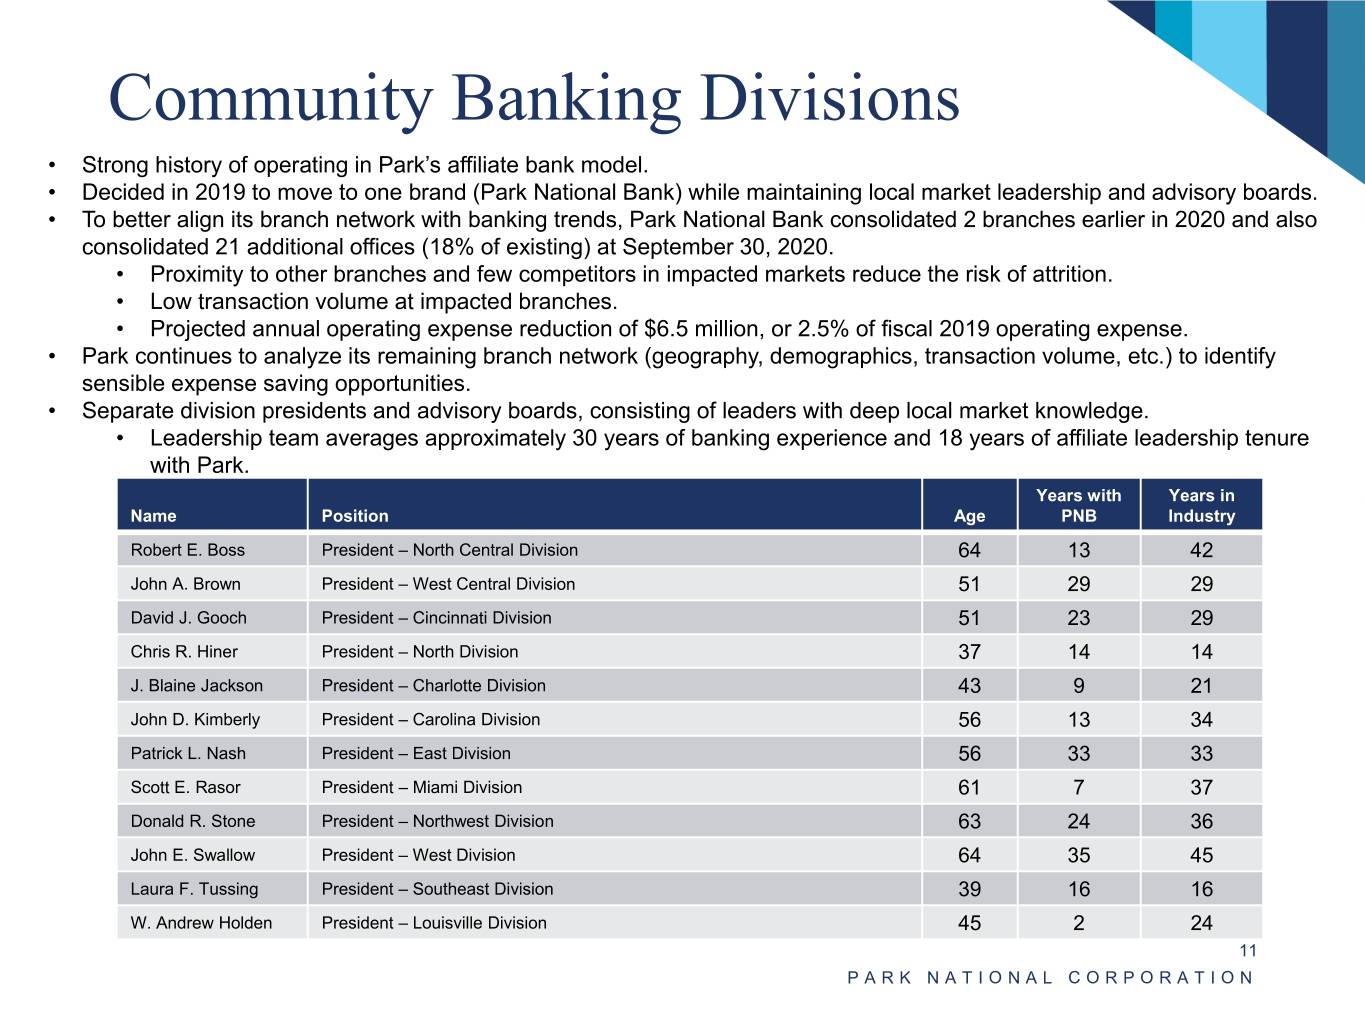
Community Banking Divisions • Strong history of operating in Park’s affiliate bank model. • Decided in 2019 to move to one brand (Park National Bank) while maintaining local market leadership and advisory boards. • To better align its branch network with banking trends, Park National Bank consolidated 2 branches earlier in 2020 and also consolidated 21 additional offices (18% of existing) at September 30, 2020. • Proximity to other branches and few competitors in impacted markets reduce the risk of attrition. • Low transaction volume at impacted branches. • Projected annual operating expense reduction of $6.5 million, or 2.5% of fiscal 2019 operating expense. • Park continues to analyze its remaining branch network (geography, demographics, transaction volume, etc.) to identify sensible expense saving opportunities. • Separate division presidents and advisory boards, consisting of leaders with deep local market knowledge. • Leadership team averages approximately 30 years of banking experience and 18 years of affiliate leadership tenure with Park. Years with Years in Name Position Age PNB Industry Robert E. Boss President – North Central Division 64 13 42 John A. Brown President – West Central Division 51 29 29 David J. Gooch President – Cincinnati Division 51 23 29 Chris R. Hiner President – North Division 37 14 14 J. Blaine Jackson President – Charlotte Division 43 9 21 John D. Kimberly President – Carolina Division 56 13 34 Patrick L. Nash President – East Division 56 33 33 Scott E. Rasor President – Miami Division 61 7 37 Donald R. Stone President – Northwest Division 63 24 36 John E. Swallow President – West Division 64 35 45 Laura F. Tussing President – Southeast Division 39 16 16 W. Andrew Holden President – Louisville Division 45 2 24 11 PARK NATIONAL CORPORATION
Pandemic Response • Park began work from home the week of March 16th and went to drive-thru only the week of March 23rd. Park successfully operated 90+ branches in this fashion and served customers through digital channels and by appointment only. • As of October 15th, 74 lobbies (of 94 locations) across the Park footprint were reopened, and approximately 18 were operating as drive-thru and/or by appointment only. • Management is continually watching COVID-19 levels by county, to determine if lobbies will be opened or closed. • Quietly launched a digital app called ParkDirect, a new virtual relationship banking experience. • Suspended share repurchases and slightly increased cash dividends from the 2019 rate. 12 PARK NATIONAL CORPORATION
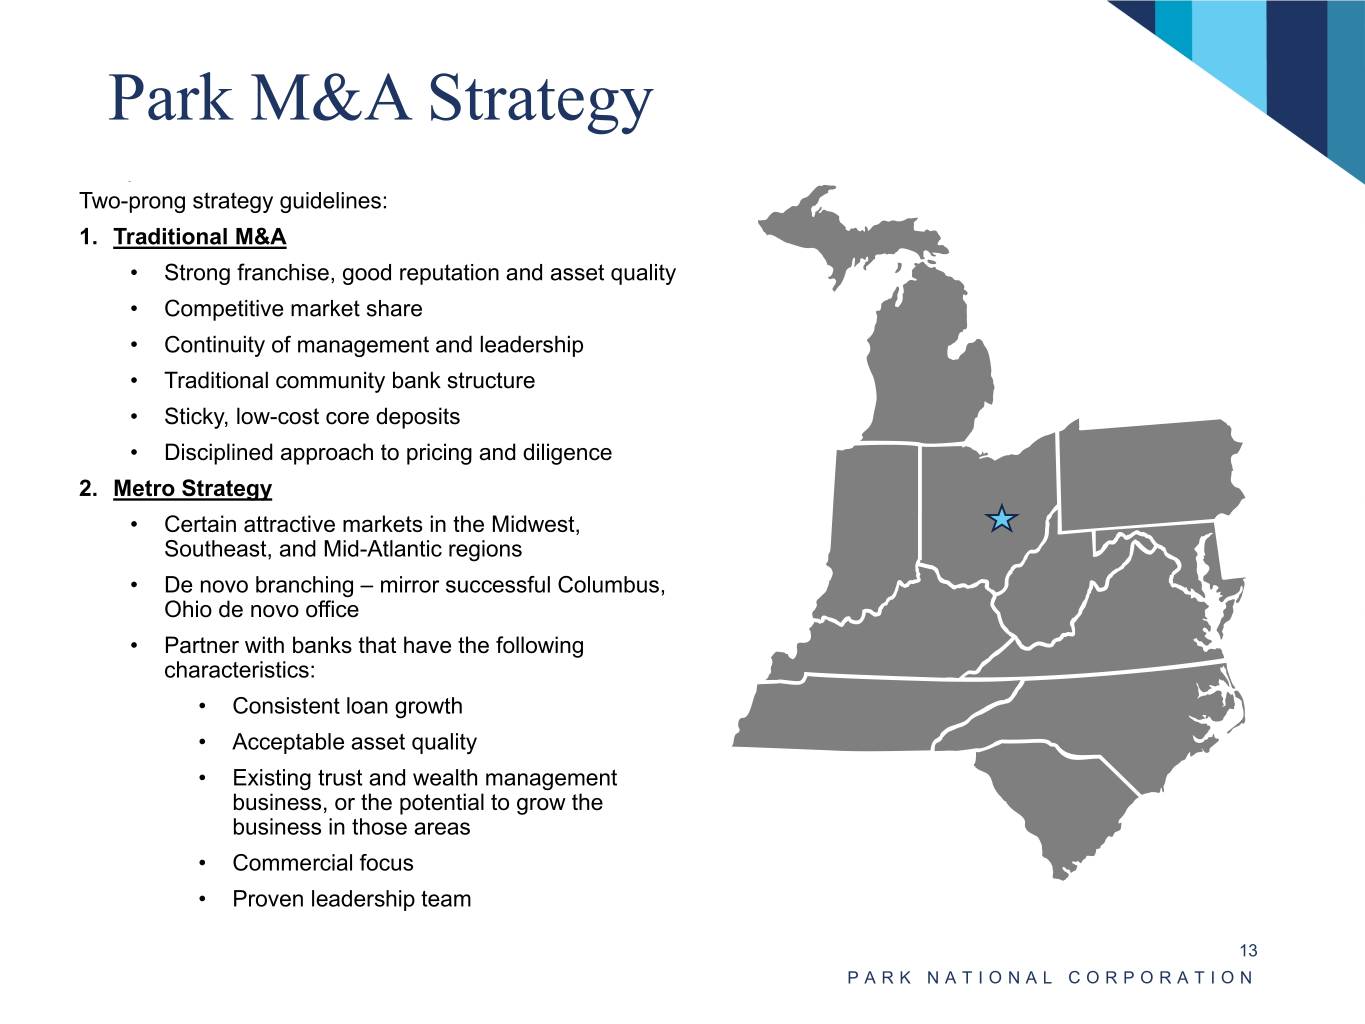
Park M&A Strategy Two-prong strategy guidelines: 1. Traditional M&A • Strong franchise, good reputation and asset quality • Competitive market share • Continuity of management and leadership • Traditional community bank structure • Sticky, low-cost core deposits • Disciplined approach to pricing and diligence 2. Metro Strategy • Certain attractive markets in the Midwest, Southeast, and Mid-Atlantic regions • De novo branching – mirror successful Columbus, Ohio de novo office • Partner with banks that have the following characteristics: • Consistent loan growth • Acceptable asset quality • Existing trust and wealth management business, or the potential to grow the business in those areas • Commercial focus • Proven leadership team 13 PARK NATIONAL CORPORATION
Recent M&A Highlights • The acquisition of CAB Financial Corporation, the • The acquisition of NewDominion Bank ($329 million of parent of Carolina Alliance Bank ($761 million of assets) assets) closed on July 1, 2018. closed on April 1, 2019. • Demographically accretive, given attractive Charlotte • Consistent with Park’s strategy of adding attractive market. growth markets to its historical markets. • Charlotte’s population growth rate is projected to • CAB’s Asheville, North Carolina and Greenville exceed that of Park’s Ohio markets and the and Spartanburg, South Carolina markets have national average in the coming years. superior demographic and employment trends • Charlotte is the largest metropolitan area in the relative to Park’s legacy markets. Carolinas with over 2.5 million residents. • Complimentary market extension to the July 2018 • Charlotte was rated among the top 20 places to completion of NewDominion Bank acquisition in live in the U.S. by U.S. News & World Report. Charlotte, NC. • Charlotte is home to six Fortune 500 companies • CAB has a history of being very focused on personal and a young, educated, and affluent labor service and community involvement – a hallmark of market. Park’s approach to banking. • Culturally similar, Park had become very familiar with • Principles and core values are closely aligned NewDominion Bank since initially investing $3.5 million with those of Park. in NewDominion Bank in a friendly transaction in • Experienced management team that built an attractive November 2016. merger partner operating in a safe and sound manner. • Strategically important as a small, lower-risk acquisition • Partnership increased CAB’s lending capacity providing for Park. additional lending opportunities in the middle-market and will diversify CAB’s wealth management business. 14 PARK NATIONAL CORPORATION
Financial Summary PARK NATIONAL CORPORATION
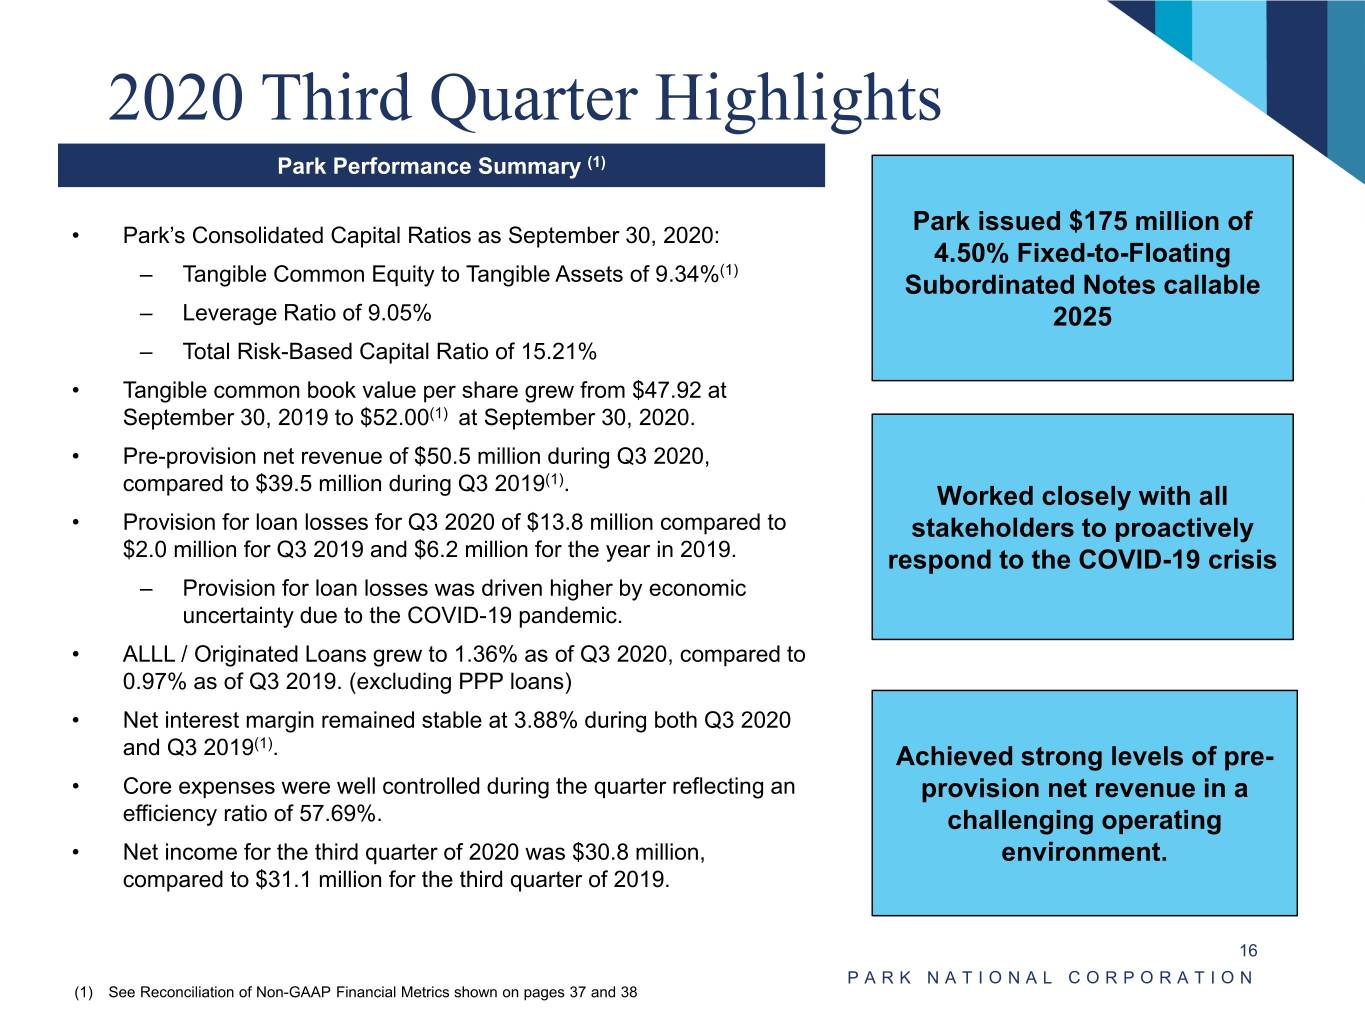
2020 Third Quarter Highlights Park Performance Summary (1) • Park’s Consolidated Capital Ratios as September 30, 2020: Park issued $175 million of 4.50% Fixed-to-Floating (1) – Tangible Common Equity to Tangible Assets of 9.34% Subordinated Notes callable – Leverage Ratio of 9.05% 2025 – Total Risk-Based Capital Ratio of 15.21% • Tangible common book value per share grew from $47.92 at September 30, 2019 to $52.00(1) at September 30, 2020. • Pre-provision net revenue of $50.5 million during Q3 2020, compared to $39.5 million during Q3 2019(1). Worked closely with all • Provision for loan losses for Q3 2020 of $13.8 million compared to stakeholders to proactively $2.0 million for Q3 2019 and $6.2 million for the year in 2019. respond to the COVID-19 crisis – Provision for loan losses was driven higher by economic uncertainty due to the COVID-19 pandemic. • ALLL / Originated Loans grew to 1.36% as of Q3 2020, compared to 0.97% as of Q3 2019. (excluding PPP loans) • Net interest margin remained stable at 3.88% during both Q3 2020 (1) and Q3 2019 . Achieved strong levels of pre- • Core expenses were well controlled during the quarter reflecting an provision net revenue in a efficiency ratio of 57.69%. challenging operating • Net income for the third quarter of 2020 was $30.8 million, environment. compared to $31.1 million for the third quarter of 2019. 16 PARK NATIONAL CORPORATION (1) See Reconciliation of Non-GAAP Financial Metrics shown on pages 37 and 38
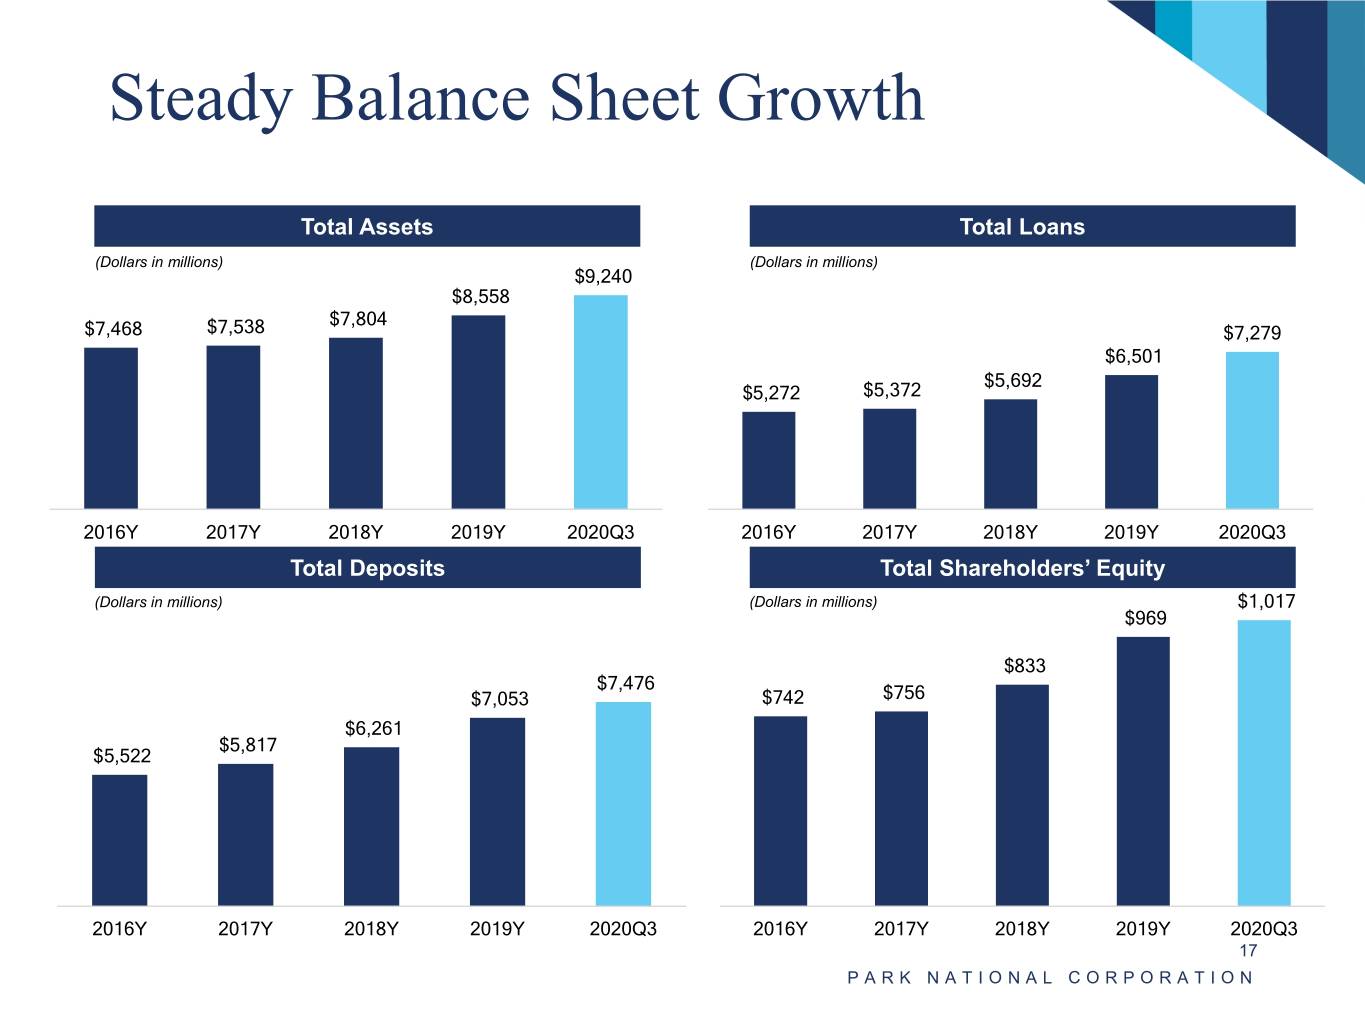
Steady Balance Sheet Growth Total Assets Total Loans (Dollars in millions) (Dollars in millions) $9,240 $8,558 $7,804 $7,468 $7,538 $7,279 $6,501 $5,692 $5,272 $5,372 2016Y 2017Y 2018Y 2019Y 2020Q3 2016Y 2017Y 2018Y 2019Y 2020Q3 Total Deposits Total Shareholders’ Equity (Dollars in millions) (Dollars in millions) $1,017 $969 $833 $7,476 $7,053 $742 $756 $6,261 $5,817 $5,522 2016Y 2017Y 2018Y 2019Y 2020Q3 2016Y 2017Y 2018Y 2019Y 2020Q3 17 PARK NATIONAL CORPORATION
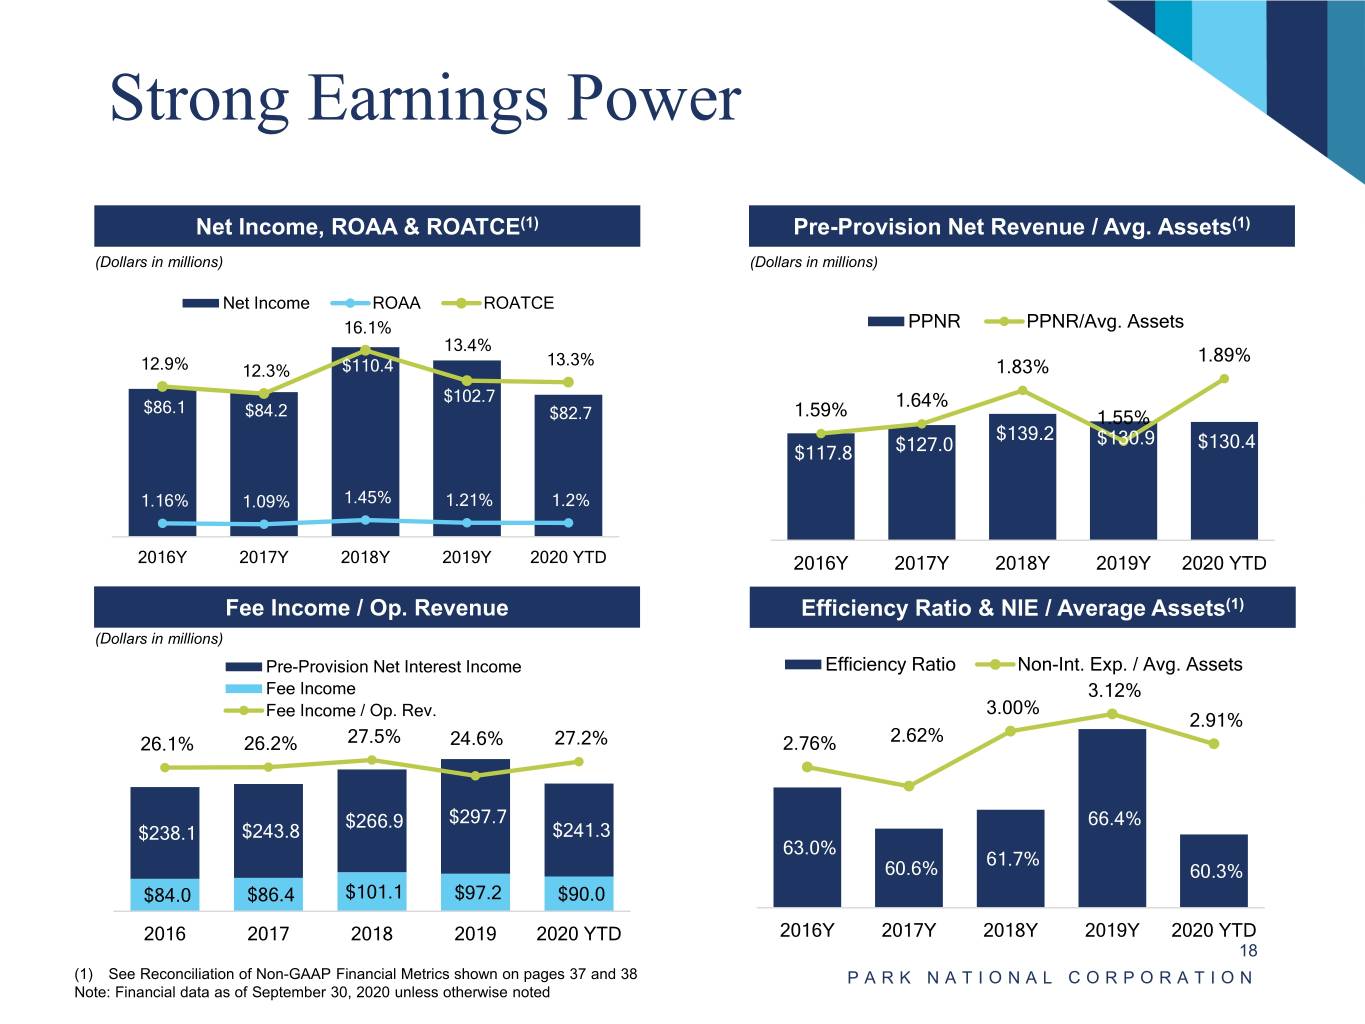
Strong Earnings Power Net Income, ROAA & ROATCE(1) Pre-Provision Net Revenue / Avg. Assets(1) (Dollars in millions) (Dollars in millions) Net Income ROAA ROATCE 16.1% PPNR PPNR/Avg. Assets 16.00% 13.4% 2.00% $200.0 $100.0 1.89% 12.9% $110.4 13.3% 12.3% 1.90% 1.83% $180.0 1.80% $160.0 12.00% $102.7 $80.0 1.64% $86.1 1.70% $140.0 $84.2 $82.7 1.59% 1.55% 1.60% $120.0 $60.0 $139.2 8.00% $130.9 1.50% $130.4 $100.0 $117.8 $127.0 $40.0 1.40% $80.0 1.30% $60.0 4.00% $20.0 1.16% 1.09% 1.45% 1.21% 1.2% 1.20% $40.0 1.10% $20.0 – – 1.00% – 2016Y 2017Y 2018Y 2019Y 2020 YTD 2016Y 2017Y 2018Y 2019Y 2020 YTD Fee Income / Op. Revenue Efficiency Ratio & NIE / Average Assets(1) (Dollars in millions) Pre-Provision Net Interest Income Efficiency Ratio Non-Int. Exp. / Avg. Assets Fee Income 3.12% Fee Income / Op. Rev. 3.00% 2.91% 26.1% 26.2% 27.5% 24.6% 27.2% 2.76% 2.62% $266.9 $297.7 66.4% $238.1 $243.8 $241.3 63.0% 61.7% 60.6% 60.3% $84.0 $86.4 $101.1 $97.2 $90.0 2016 2017 2018 2019 2020 YTD 2016Y 2017Y 2018Y 2019Y 2020 YTD 18 (1) See Reconciliation of Non-GAAP Financial Metrics shown on pages 37 and 38 PARK NATIONAL CORPORATION Note: Financial data as of September 30, 2020 unless otherwise noted
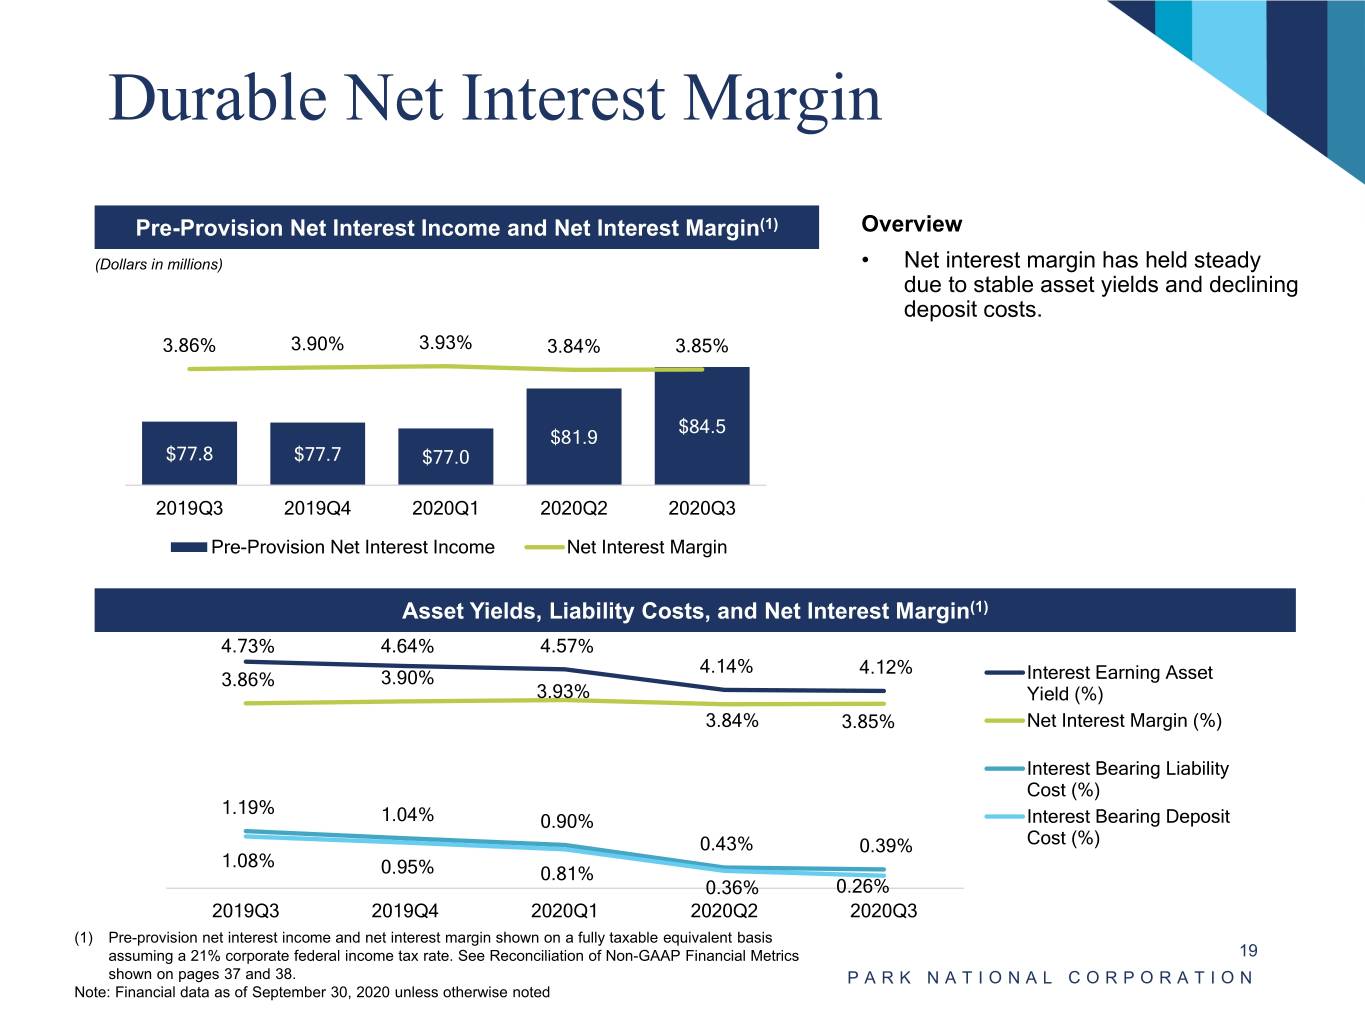
Durable Net Interest Margin Pre-Provision Net Interest Income and Net Interest Margin(1) Overview (Dollars in millions) • Net interest margin has held steady due to stable asset yields and declining deposit costs. 3.86% 3.90% 3.93% 3.84% 3.85% $84.5 $81.9 $77.8 $77.7 $77.0 2019Q3 2019Q4 2020Q1 2020Q2 2020Q3 Pre-Provision Net Interest Income Net Interest Margin Asset Yields, Liability Costs, and Net Interest Margin(1) 4.73% 4.64% 4.57% 4.14% 4.12% 3.86% 3.90% Interest Earning Asset 3.93% Yield (%) 3.84% 3.85% Net Interest Margin (%) Interest Bearing Liability Cost (%) 1.19% 1.04% 0.90% Interest Bearing Deposit 0.43% 0.39% Cost (%) 1.08% 0.95% 0.81% 0.36% 0.26% 2019Q3 2019Q4 2020Q1 2020Q2 2020Q3 (1) Pre-provision net interest income and net interest margin shown on a fully taxable equivalent basis assuming a 21% corporate federal income tax rate. See Reconciliation of Non-GAAP Financial Metrics 19 shown on pages 37 and 38. PARK NATIONAL CORPORATION Note: Financial data as of September 30, 2020 unless otherwise noted
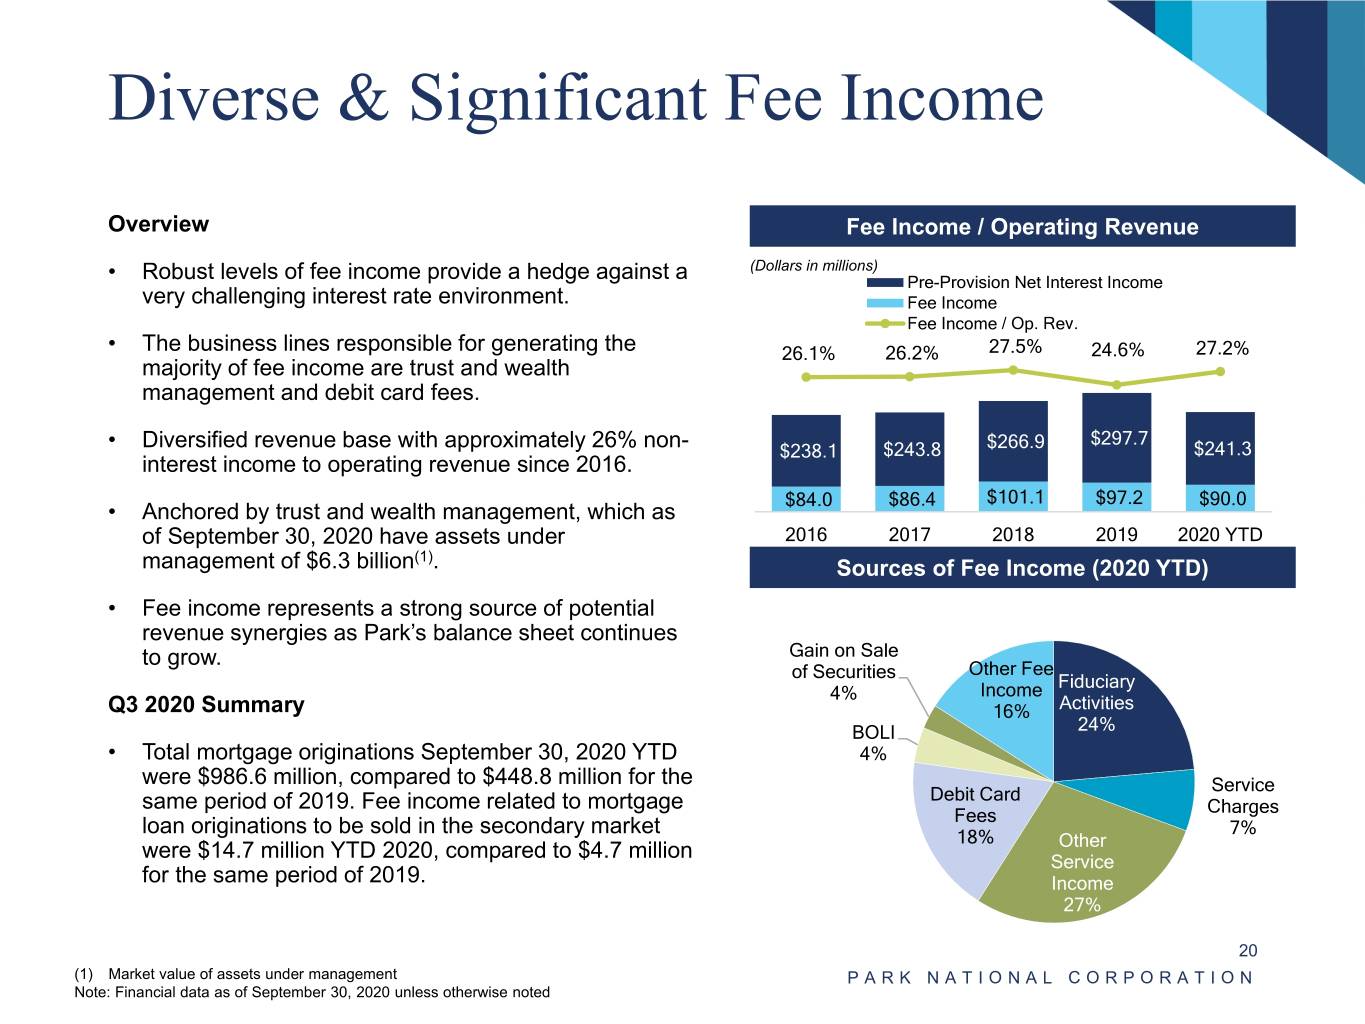
Diverse & Significant Fee Income Overview Fee Income / Operating Revenue (Dollars in millions) • Robust levels of fee income provide a hedge against a Pre-Provision Net Interest Income very challenging interest rate environment. Fee Income Fee Income / Op. Rev. • The business lines responsible for generating the 26.1% 26.2% 27.5% 24.6% 27.2% majority of fee income are trust and wealth management and debit card fees. $297.7 • Diversified revenue base with approximately 26% non- $238.1 $243.8 $266.9 $241.3 interest income to operating revenue since 2016. $84.0 $86.4 $101.1 $97.2 $90.0 • Anchored by trust and wealth management, which as of September 30, 2020 have assets under 2016 2017 2018 2019 2020 YTD (1) management of $6.3 billion . Sources of Fee Income (2020 YTD) • Fee income represents a strong source of potential revenue synergies as Park’s balance sheet continues to grow. Gain on Sale of Securities Other Fee Fiduciary 4% Income Q3 2020 Summary 16% Activities BOLI 24% • Total mortgage originations September 30, 2020 YTD 4% were $986.6 million, compared to $448.8 million for the Service same period of 2019. Fee income related to mortgage Debit Card Fees Charges loan originations to be sold in the secondary market 7% 18% Other were $14.7 million YTD 2020, compared to $4.7 million Service for the same period of 2019. Income 27% 20 (1) Market value of assets under management PARK NATIONAL CORPORATION Note: Financial data as of September 30, 2020 unless otherwise noted
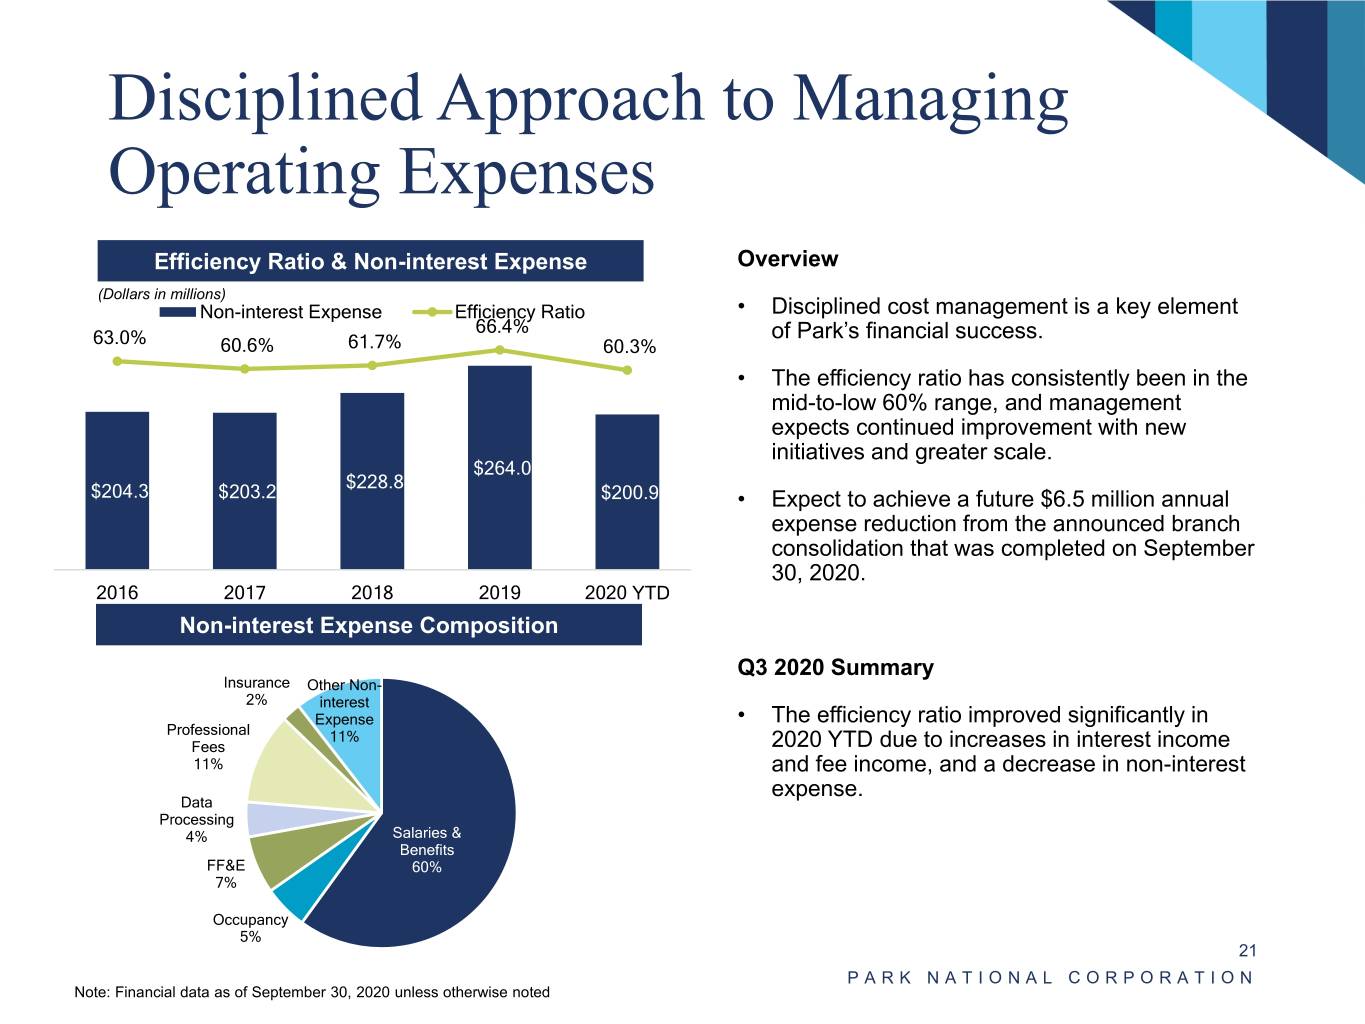
Disciplined Approach to Managing Operating Expenses Efficiency Ratio & Non-interest Expense Overview (Dollars in millions) Non-interest Expense Efficiency Ratio • Disciplined cost management is a key element 66.4% of Park’s financial success. 63.0% 60.6% 61.7% 60.3% • The efficiency ratio has consistently been in the mid-to-low 60% range, and management expects continued improvement with new initiatives and greater scale. $264.0 $228.8 $204.3 $203.2 $200.9 • Expect to achieve a future $6.5 million annual expense reduction from the announced branch consolidation that was completed on September 30, 2020. 2016 2017 2018 2019 2020 YTD Non-interest Expense Composition Q3 2020 Summary Insurance Other Non- 2% interest Expense • The efficiency ratio improved significantly in Professional 11% Fees 2020 YTD due to increases in interest income 11% and fee income, and a decrease in non-interest expense. Data Processing 4% Salaries & Benefits FF&E 60% 7% Occupancy 5% 21 PARK NATIONAL CORPORATION Note: Financial data as of September 30, 2020 unless otherwise noted
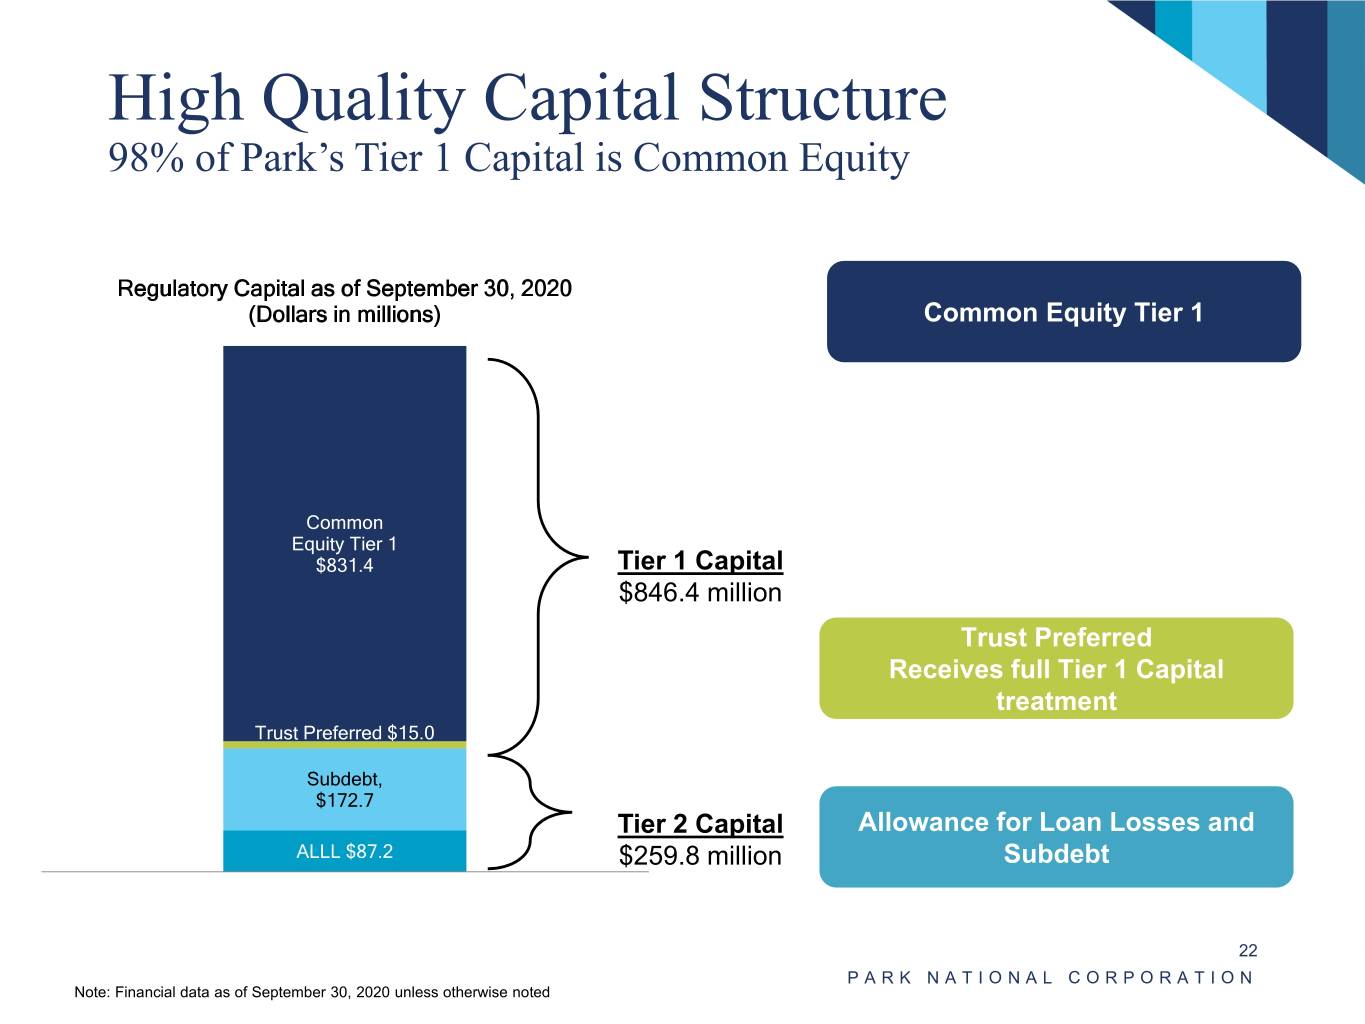
High Quality Capital Structure 98% of Park’s Tier 1 Capital is Common Equity Regulatory Capital as of September 30, 2020 (Dollars in millions) Common Equity Tier 1 Common Equity Tier 1 $831.4 Tier 1 Capital $846.4 million Trust Preferred Receives full Tier 1 Capital treatment Trust Preferred $15.0 Subdebt, $172.7 Tier 2 Capital Allowance for Loan Losses and ALLL $87.2 $259.8 million Subdebt 1 22 PARK NATIONAL CORPORATION Note: Financial data as of September 30, 2020 unless otherwise noted
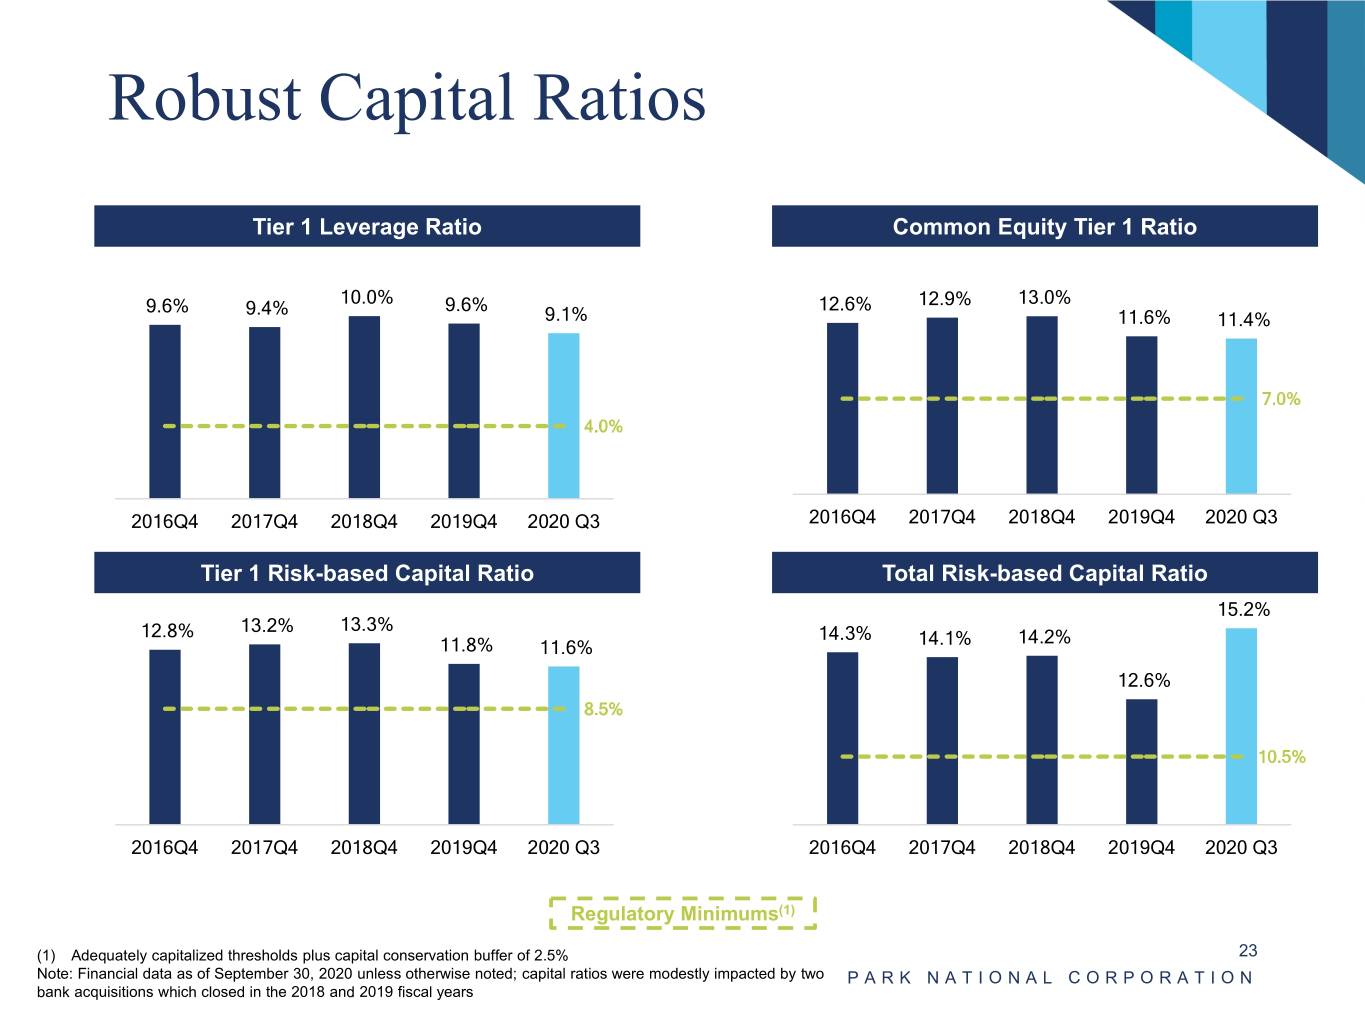
Robust Capital Ratios Tier 1 Leverage Ratio Common Equity Tier 1 Ratio 16.0% 12.0% 9.6% 10.0% 9.6% 14.0% 12.6% 12.9% 13.0% 10.0% 9.4% 9.1% 11.6% 11.4% 12.0% 8.0% 10.0% 8.0% 6.0% 7.0% 6.0% 4.0% 4.0% 4.0% 2.0% 2.0% – – 2016Q4 2017Q4 2018Q4 2019Q4 2020 Q3 2016Q4 2017Q4 2018Q4 2019Q4 2020 Q3 Tier 1 Risk-based Capital Ratio Total Risk-based Capital Ratio 16.0% 16.0% 15.2% 14.0% 13.2% 13.3% 15.0% 12.8% 14.3% 14.2% 11.8% 11.6% 14.1% 12.0% 14.0% 10.0% 13.0% 12.6% 8.0% 8.5% 12.0% 6.0% 11.0% 10.5% 4.0% 10.0% 2.0% 9.0% – 8.0% 2016Q4 2017Q4 2018Q4 2019Q4 2020 Q3 2016Q4 2017Q4 2018Q4 2019Q4 2020 Q3 Regulatory Minimums(1) (1) Adequately capitalized thresholds plus capital conservation buffer of 2.5% 23 Note: Financial data as of September 30, 2020 unless otherwise noted; capital ratios were modestly impacted by two PARK NATIONAL CORPORATION bank acquisitions which closed in the 2018 and 2019 fiscal years
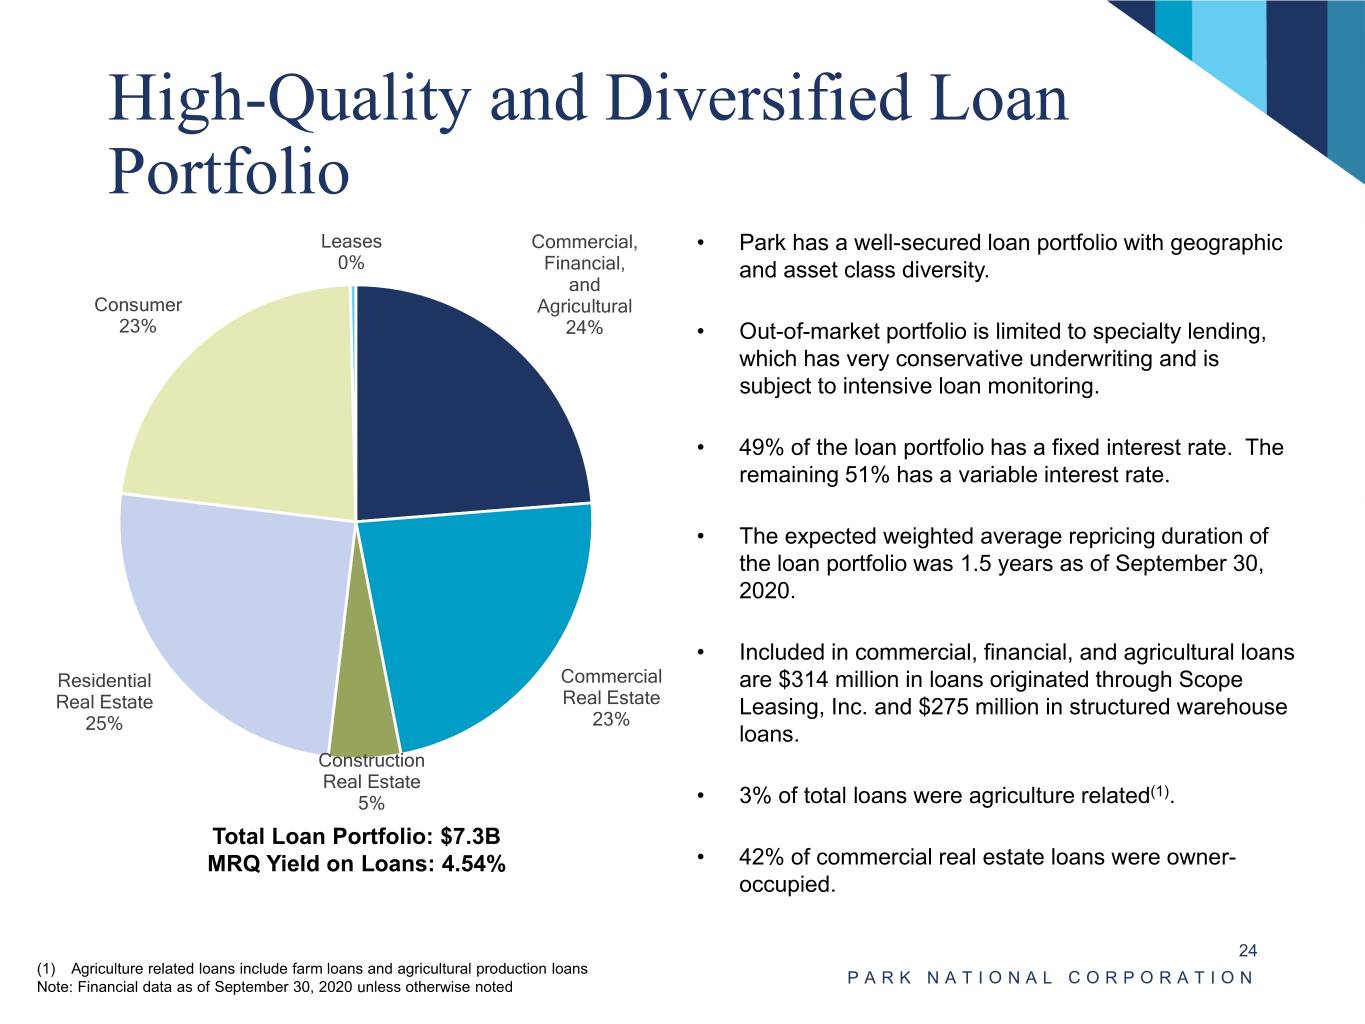
High-Quality and Diversified Loan Portfolio Leases Commercial, • Park has a well-secured loan portfolio with geographic 0% Financial, and asset class diversity. and Consumer Agricultural 23% 24% • Out-of-market portfolio is limited to specialty lending, which has very conservative underwriting and is subject to intensive loan monitoring. • 49% of the loan portfolio has a fixed interest rate. The remaining 51% has a variable interest rate. • The expected weighted average repricing duration of the loan portfolio was 1.5 years as of September 30, 2020. • Included in commercial, financial, and agricultural loans Residential Commercial are $314 million in loans originated through Scope Real Estate Real Estate Leasing, Inc. and $275 million in structured warehouse 25% 23% loans. Construction Real Estate (1) 5% • 3% of total loans were agriculture related . Total Loan Portfolio: $7.3B MRQ Yield on Loans: 4.54% • 42% of commercial real estate loans were owner- occupied. 24 (1) Agriculture related loans include farm loans and agricultural production loans PARK NATIONAL CORPORATION Note: Financial data as of September 30, 2020 unless otherwise noted
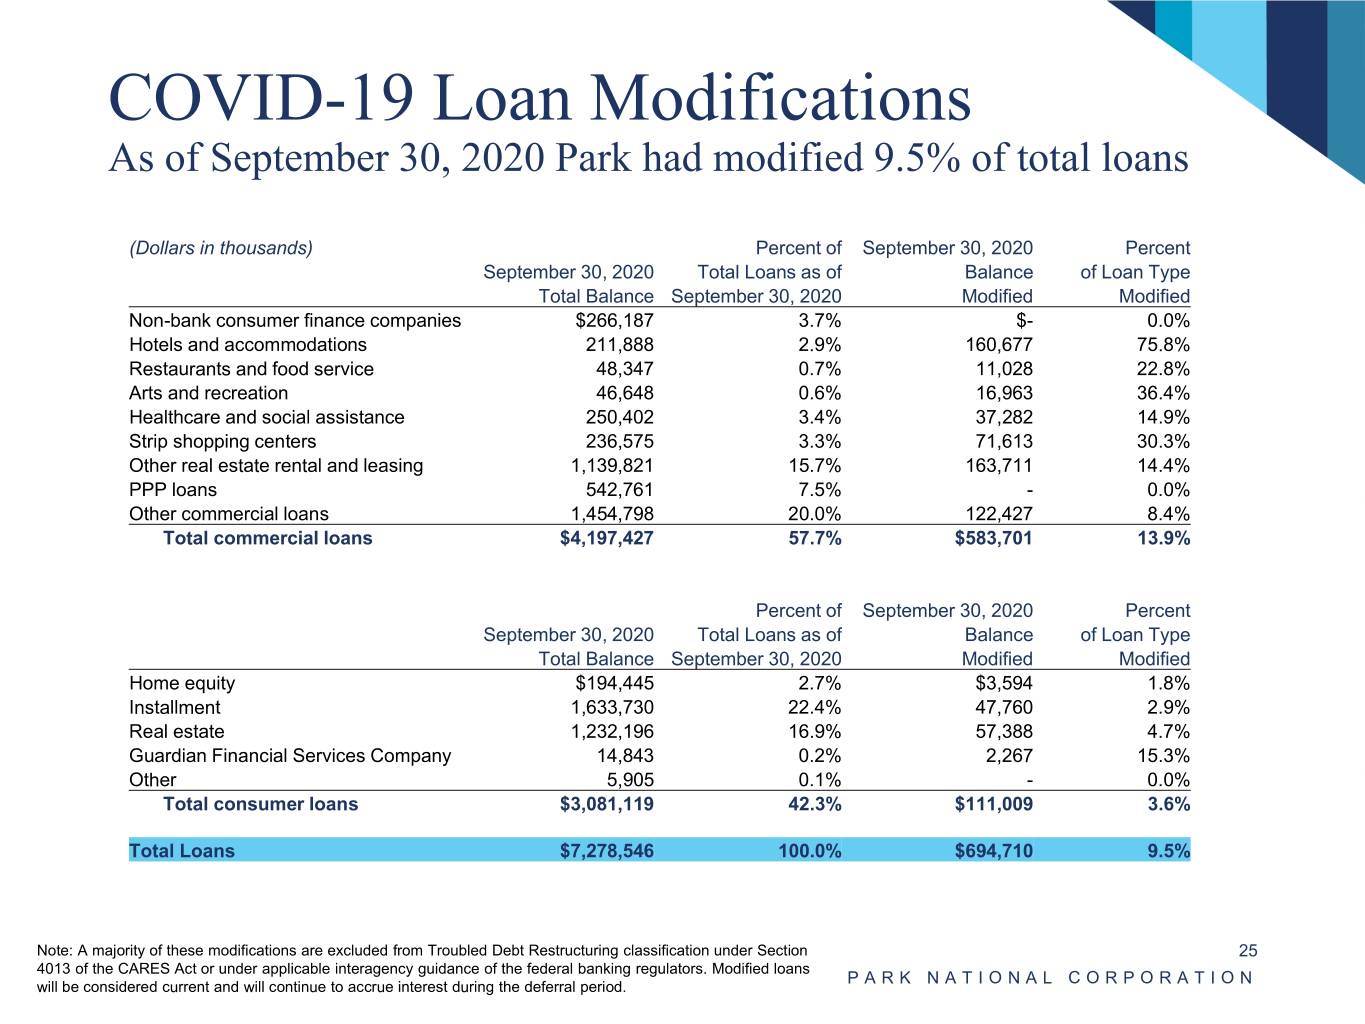
COVID-19 Loan Modifications As of September 30, 2020 Park had modified 9.5% of total loans (Dollars in thousands) Percent of September 30, 2020 Percent September 30, 2020 Total Loans as of Balance of Loan Type Total Balance September 30, 2020 Modified Modified Non-bank consumer finance companies $266,187 3.7% $- 0.0% Hotels and accommodations 211,888 2.9% 160,677 75.8% Restaurants and food service 48,347 0.7% 11,028 22.8% Arts and recreation 46,648 0.6% 16,963 36.4% Healthcare and social assistance 250,402 3.4% 37,282 14.9% Strip shopping centers 236,575 3.3% 71,613 30.3% Other real estate rental and leasing 1,139,821 15.7% 163,711 14.4% PPP loans 542,761 7.5% - 0.0% Other commercial loans 1,454,798 20.0% 122,427 8.4% Total commercial loans $4,197,427 57.7% $583,701 13.9% Percent of September 30, 2020 Percent September 30, 2020 Total Loans as of Balance of Loan Type Total Balance September 30, 2020 Modified Modified Home equity $194,445 2.7% $3,594 1.8% Installment 1,633,730 22.4% 47,760 2.9% Real estate 1,232,196 16.9% 57,388 4.7% Guardian Financial Services Company 14,843 0.2% 2,267 15.3% Other 5,905 0.1% - 0.0% Total consumer loans $3,081,119 42.3% $111,009 3.6% Total Loans $7,278,546 100.0% $694,710 9.5% Note: A majority of these modifications are excluded from Troubled Debt Restructuring classification under Section 25 4013 of the CARES Act or under applicable interagency guidance of the federal banking regulators. Modified loans PARK NATIONAL CORPORATION will be considered current and will continue to accrue interest during the deferral period.
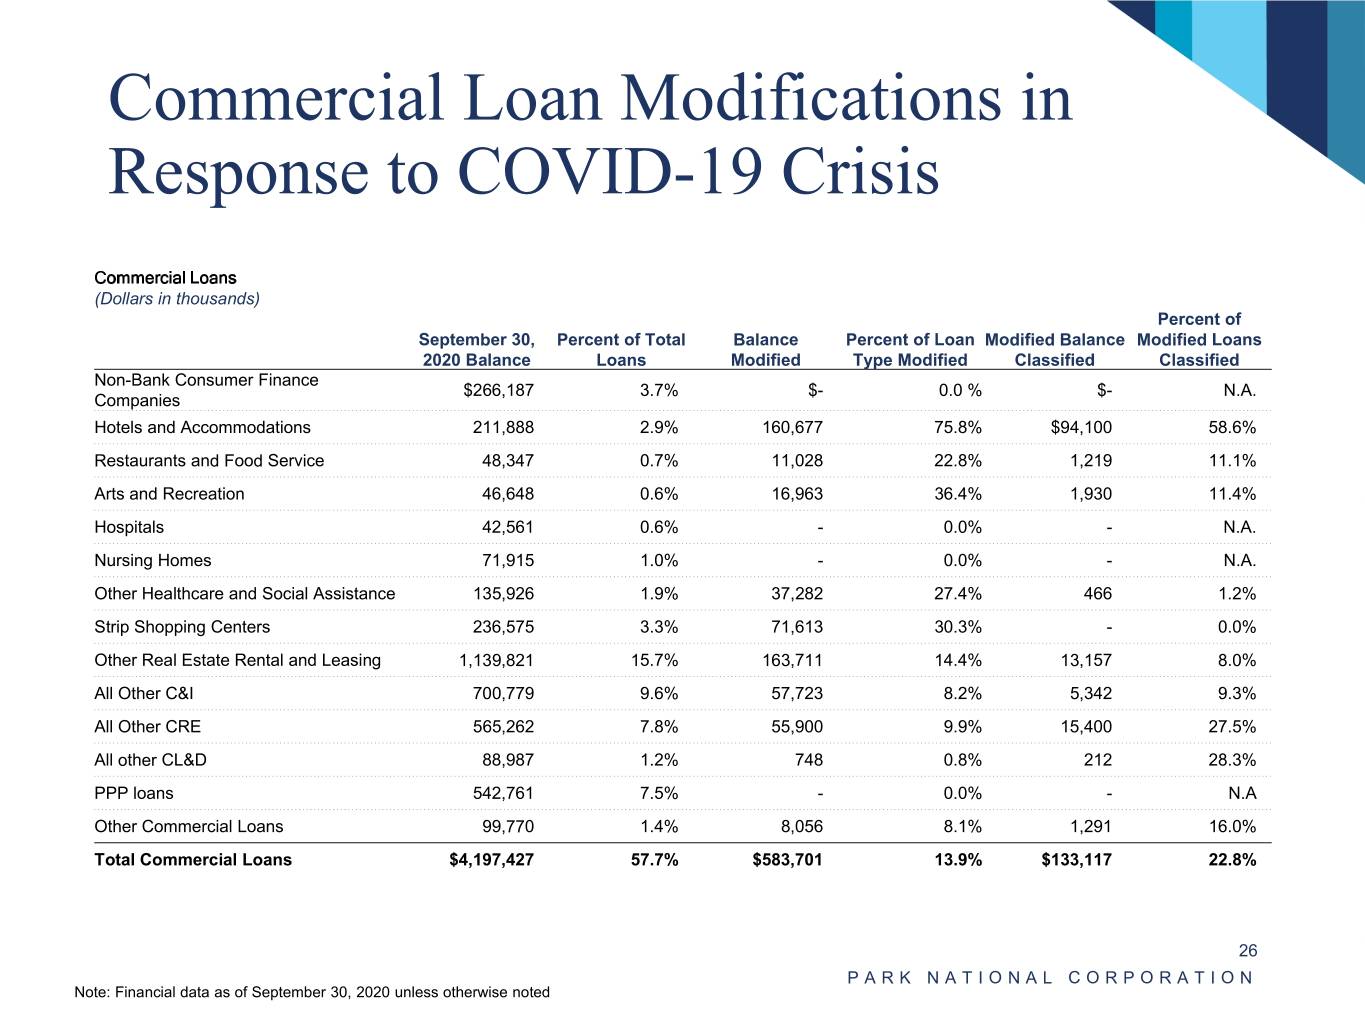
Commercial Loan Modifications in Response to COVID-19 Crisis Commercial Loans (Dollars in thousands) Percent of September 30, Percent of Total Balance Percent of Loan Modified Balance Modified Loans 2020 Balance Loans Modified Type Modified Classified Classified Non-Bank Consumer Finance $266,187 3.7% $- 0.0 % $- N.A. Companies Hotels and Accommodations 211,888 2.9% 160,677 75.8% $94,100 58.6% Restaurants and Food Service 48,347 0.7% 11,028 22.8% 1,219 11.1% Arts and Recreation 46,648 0.6% 16,963 36.4% 1,930 11.4% Hospitals 42,561 0.6% - 0.0% - N.A. Nursing Homes 71,915 1.0% - 0.0% - N.A. Other Healthcare and Social Assistance 135,926 1.9% 37,282 27.4% 466 1.2% Strip Shopping Centers 236,575 3.3% 71,613 30.3% - 0.0% Other Real Estate Rental and Leasing 1,139,821 15.7% 163,711 14.4% 13,157 8.0% All Other C&I 700,779 9.6% 57,723 8.2% 5,342 9.3% All Other CRE 565,262 7.8% 55,900 9.9% 15,400 27.5% All other CL&D 88,987 1.2% 748 0.8% 212 28.3% PPP loans 542,761 7.5% - 0.0% - N.A Other Commercial Loans 99,770 1.4% 8,056 8.1% 1,291 16.0% Total Commercial Loans $4,197,427 57.7% $583,701 13.9% $133,117 22.8% 26 PARK NATIONAL CORPORATION Note: Financial data as of September 30, 2020 unless otherwise noted
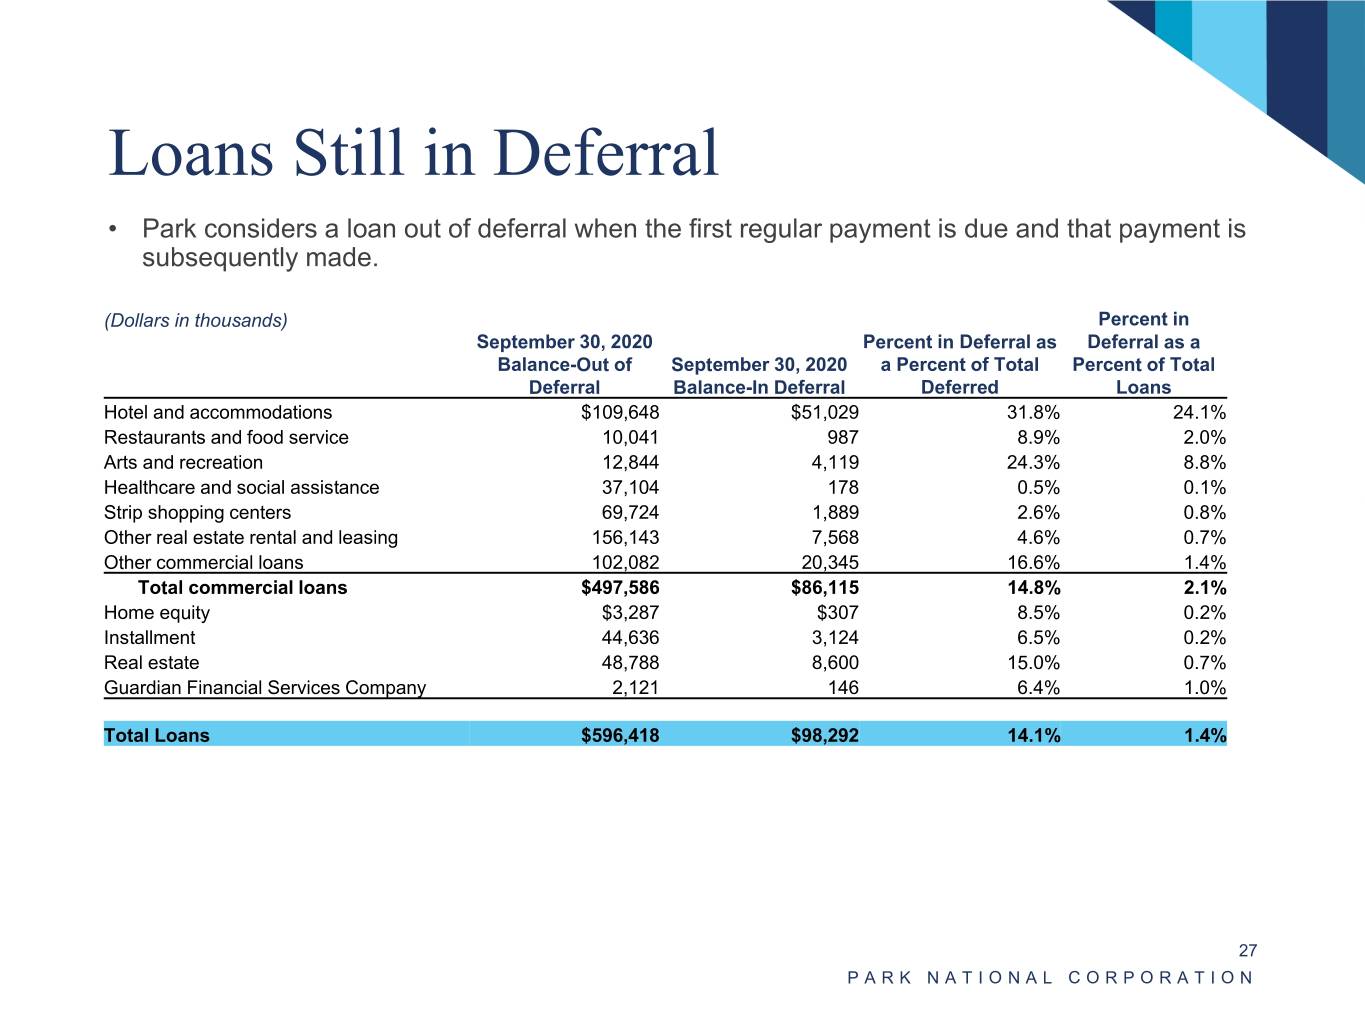
Loans Still in Deferral • Park considers a loan out of deferral when the first regular payment is due and that payment is subsequently made. (Dollars in thousands) Percent in September 30, 2020 Percent in Deferral as Deferral as a Balance-Out of September 30, 2020 a Percent of Total Percent of Total Deferral Balance-In Deferral Deferred Loans Hotel and accommodations $109,648 $51,029 31.8% 24.1% Restaurants and food service 10,041 987 8.9% 2.0% Arts and recreation 12,844 4,119 24.3% 8.8% Healthcare and social assistance 37,104 178 0.5% 0.1% Strip shopping centers 69,724 1,889 2.6% 0.8% Other real estate rental and leasing 156,143 7,568 4.6% 0.7% Other commercial loans 102,082 20,345 16.6% 1.4% Total commercial loans $497,586 $86,115 14.8% 2.1% Home equity $3,287 $307 8.5% 0.2% Installment 44,636 3,124 6.5% 0.2% Real estate 48,788 8,600 15.0% 0.7% Guardian Financial Services Company 2,121 146 6.4% 1.0% Total Loans $596,418 $98,292 14.1% 1.4% 27 PARK NATIONAL CORPORATION
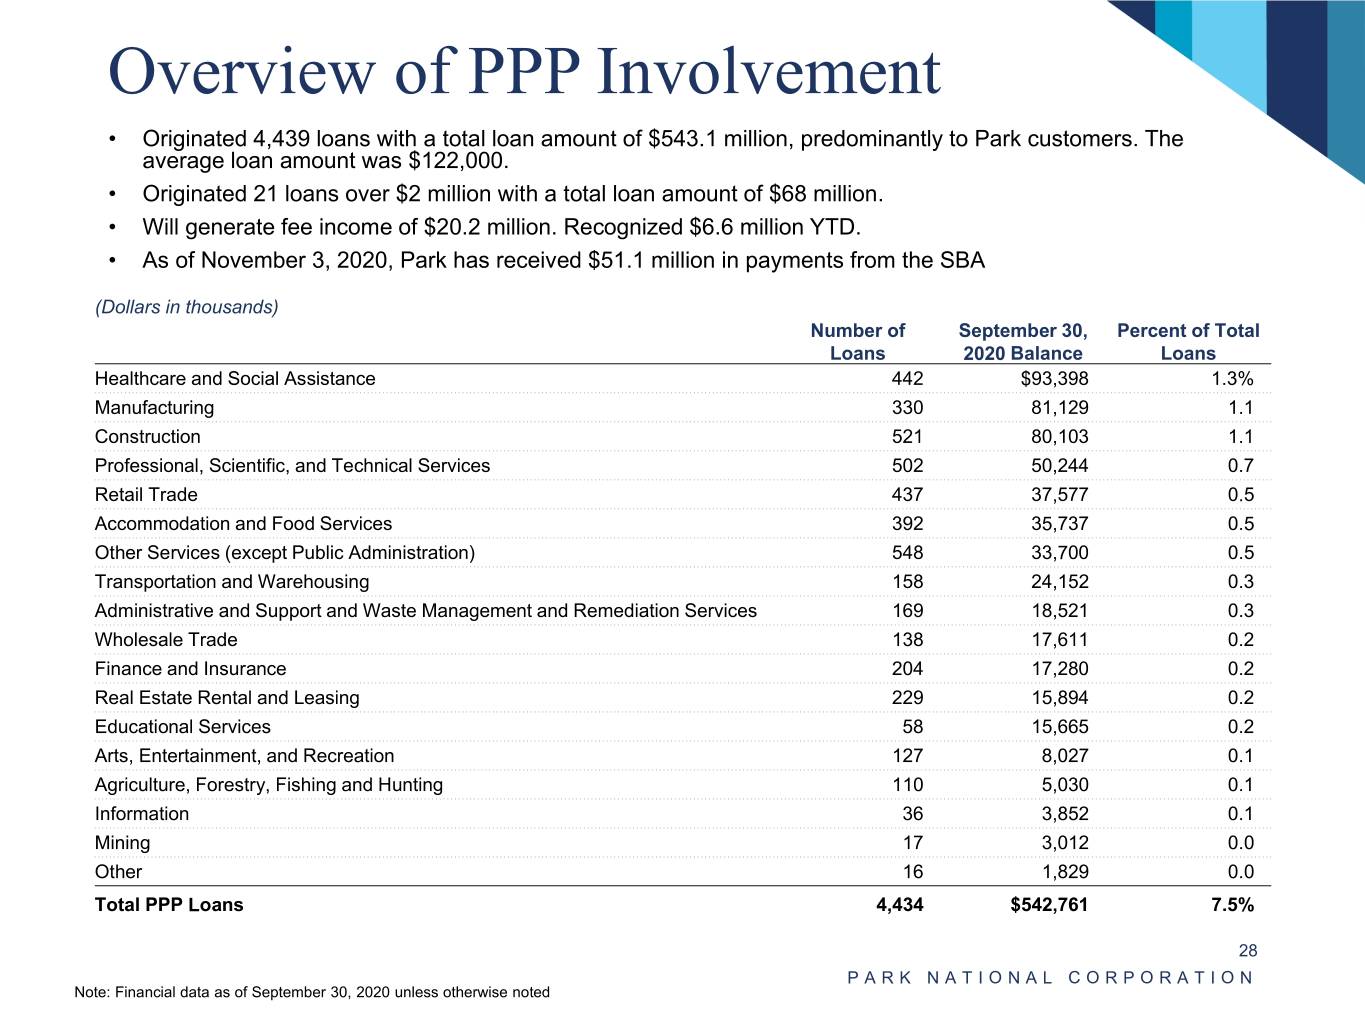
Overview of PPP Involvement • Originated 4,439 loans with a total loan amount of $543.1 million, predominantly to Park customers. The average loan amount was $122,000. • Originated 21 loans over $2 million with a total loan amount of $68 million. • Will generate fee income of $20.2 million. Recognized $6.6 million YTD. • As of November 3, 2020, Park has received $51.1 million in payments from the SBA (Dollars in thousands) Number of September 30, Percent of Total Loans 2020 Balance Loans Healthcare and Social Assistance 442 $93,398 1.3% Manufacturing 330 81,129 1.1 Construction 521 80,103 1.1 Professional, Scientific, and Technical Services 502 50,244 0.7 Retail Trade 437 37,577 0.5 Accommodation and Food Services 392 35,737 0.5 Other Services (except Public Administration) 548 33,700 0.5 Transportation and Warehousing 158 24,152 0.3 Administrative and Support and Waste Management and Remediation Services 169 18,521 0.3 Wholesale Trade 138 17,611 0.2 Finance and Insurance 204 17,280 0.2 Real Estate Rental and Leasing 229 15,894 0.2 Educational Services 58 15,665 0.2 Arts, Entertainment, and Recreation 127 8,027 0.1 Agriculture, Forestry, Fishing and Hunting 110 5,030 0.1 Information 36 3,852 0.1 Mining 17 3,012 0.0 Other 16 1,829 0.0 Total PPP Loans 4,434 $542,761 7.5% 28 PARK NATIONAL CORPORATION Note: Financial data as of September 30, 2020 unless otherwise noted
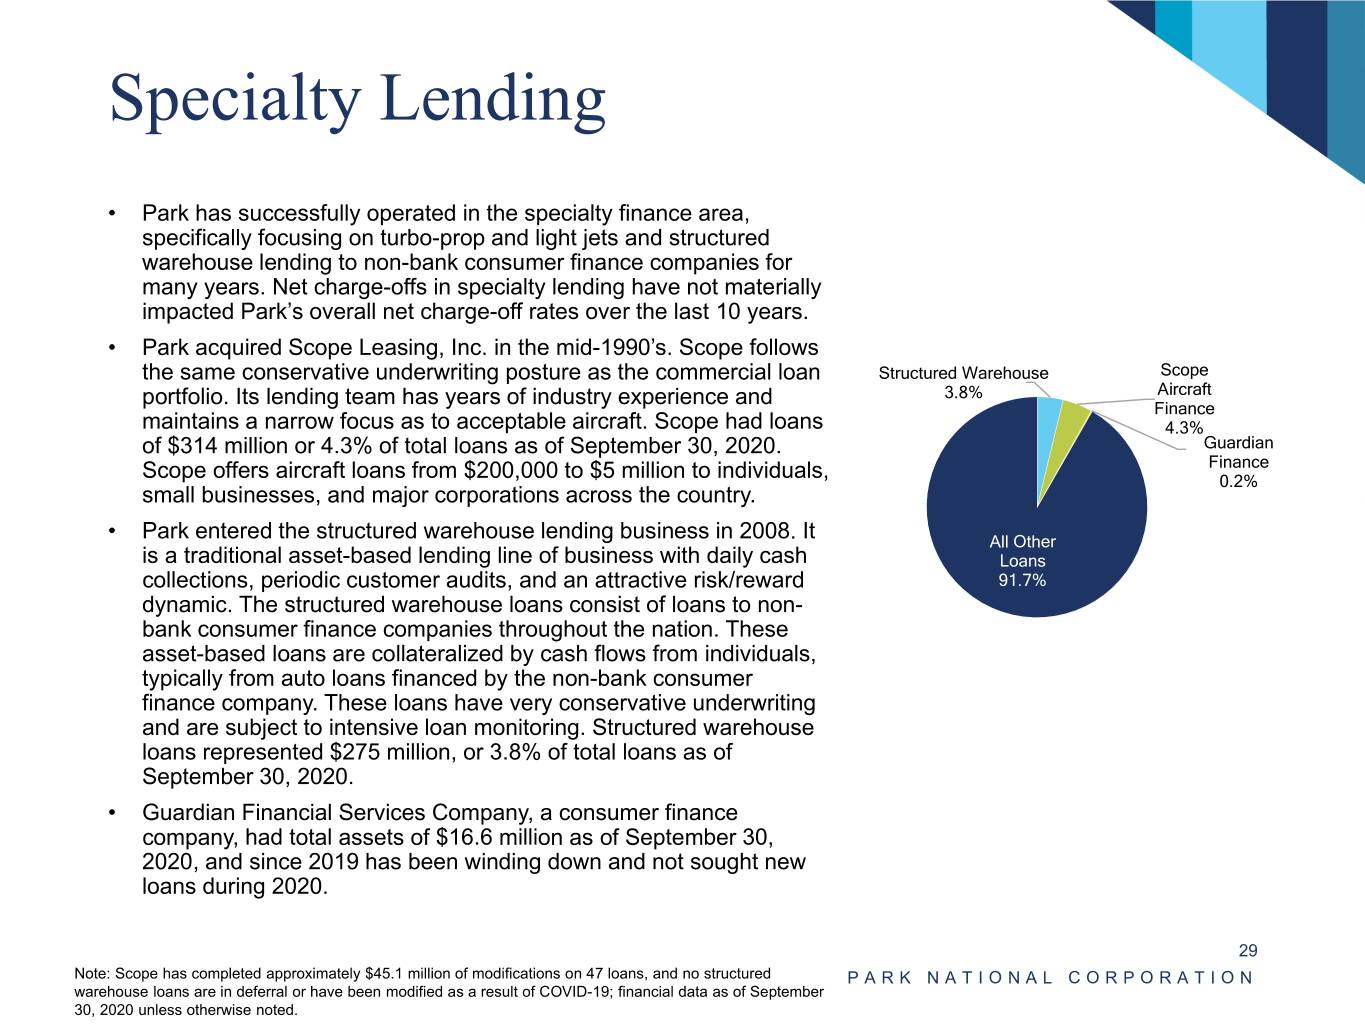
Specialty Lending • Park has successfully operated in the specialty finance area, specifically focusing on turbo-prop and light jets and structured warehouse lending to non-bank consumer finance companies for many years. Net charge-offs in specialty lending have not materially impacted Park’s overall net charge-off rates over the last 10 years. • Park acquired Scope Leasing, Inc. in the mid-1990’s. Scope follows the same conservative underwriting posture as the commercial loan Structured Warehouse Scope 3.8% Aircraft portfolio. Its lending team has years of industry experience and Finance maintains a narrow focus as to acceptable aircraft. Scope had loans 4.3% of $314 million or 4.3% of total loans as of September 30, 2020. Guardian Finance Scope offers aircraft loans from $200,000 to $5 million to individuals, 0.2% small businesses, and major corporations across the country. • Park entered the structured warehouse lending business in 2008. It All Other is a traditional asset-based lending line of business with daily cash Loans collections, periodic customer audits, and an attractive risk/reward 91.7% dynamic. The structured warehouse loans consist of loans to non- bank consumer finance companies throughout the nation. These asset-based loans are collateralized by cash flows from individuals, typically from auto loans financed by the non-bank consumer finance company. These loans have very conservative underwriting and are subject to intensive loan monitoring. Structured warehouse loans represented $275 million, or 3.8% of total loans as of September 30, 2020. • Guardian Financial Services Company, a consumer finance company, had total assets of $16.6 million as of September 30, 2020, and since 2019 has been winding down and not sought new loans during 2020. 29 Note: Scope has completed approximately $45.1 million of modifications on 47 loans, and no structured PARK NATIONAL CORPORATION warehouse loans are in deferral or have been modified as a result of COVID-19; financial data as of September 30, 2020 unless otherwise noted.
Loan Approval Process & Loan Review Loan Approval Process • While Park has a legal lending limit of approximately $128 million, its internal hold limit is $42 million. • Park’s highest individual lending authority is $3 million. • Loans which are greater than an individual’s lending authority go to the Park Commercial Loan Committee (“PCLC”) for approval. • Loans exceeding the PCLC approval limits must be approved by the Park Executive Committee. Loan Review & Special Assets • Park’s management team takes a very conservative approach to classification, primarily based on debt service coverage ratios. A credit will be placed on nonaccrual status with a debt service coverage ratio below 1.0x, and a credit with a lesser degree of stress may be labeled special mention. • Annually, loan review evaluates: • All commercial credit relationships with aggregate exposure over $1 million. • All commercial credit relationships with new notes >= $500,000. • Remaining commercial credit relationships with aggregate exposure between $250,000 and $500,000 are selected based on risk-based sampling. • For the 2018-2019 loan review cycle, 82% of the commercial loan portfolio was reviewed. • Special Assets Committee consists of several bankers with extensive experience working to resolve problem credits acquired over the course of the 2008 financial crisis. 30 PARK NATIONAL CORPORATION
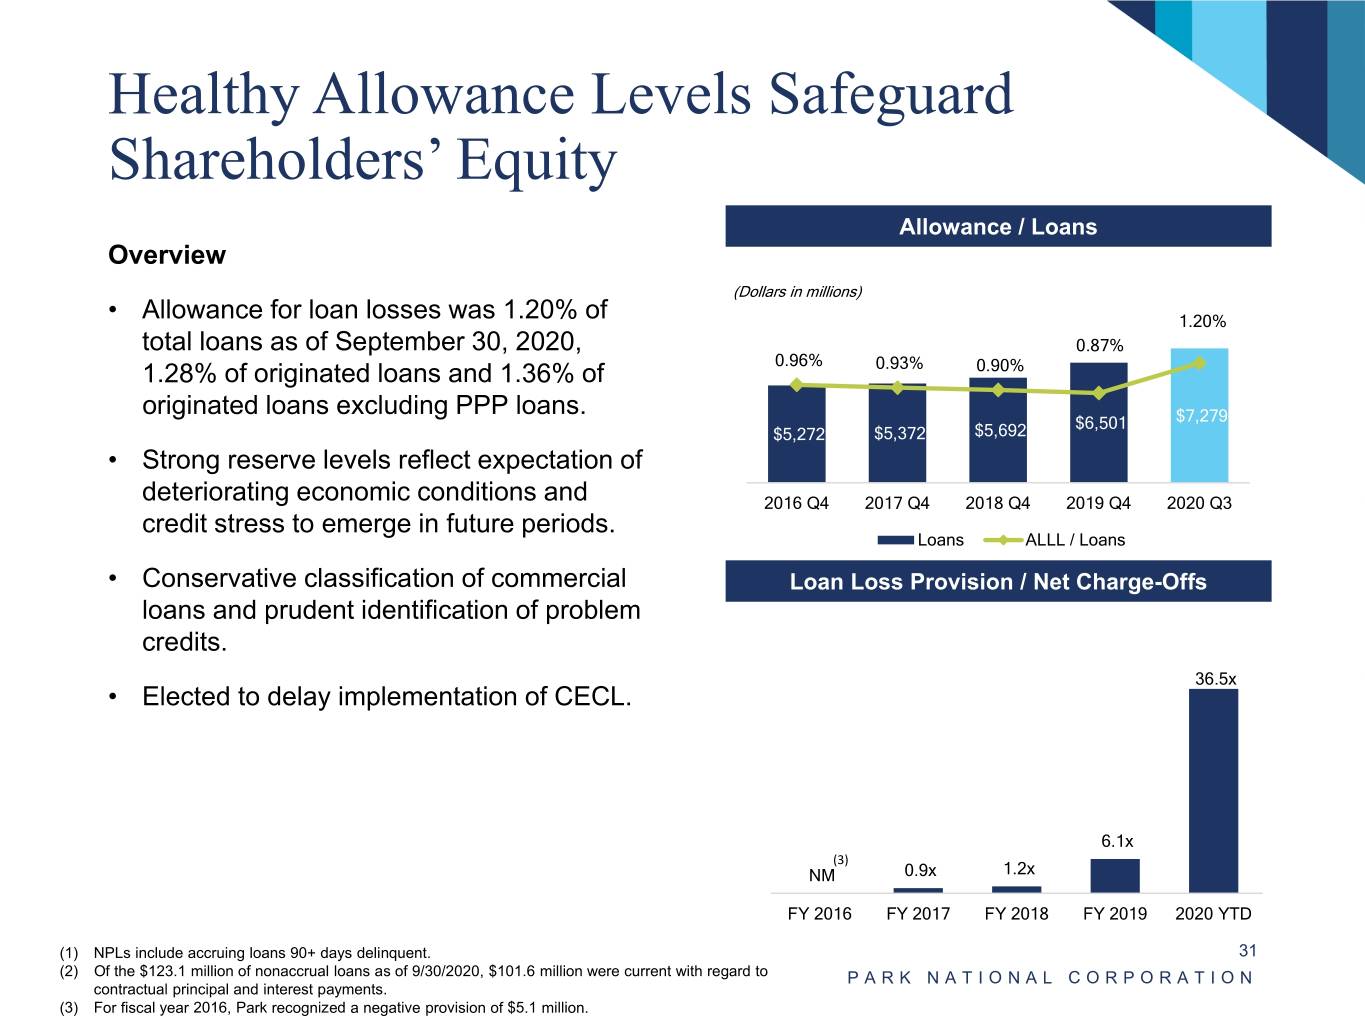
Healthy Allowance Levels Safeguard Shareholders’ Equity Allowance / Loans Overview (Dollars in millions) • Allowance for loan losses was 1.20% of 1.20% total loans as of September 30, 2020, 0.87% 0.96% 1.28% of originated loans and 1.36% of 0.93% 0.90% originated loans excluding PPP loans. $6,501 $7,279 $5,272 $5,372 $5,692 • Strong reserve levels reflect expectation of deteriorating economic conditions and 2016 Q4 2017 Q4 2018 Q4 2019 Q4 2020 Q3 credit stress to emerge in future periods. Loans ALLL / Loans • Conservative classification of commercial Loan Loss Provision / Net Charge-Offs loans and prudent identification of problem credits. 36.5x • Elected to delay implementation of CECL. 6.1x (3) NM 0.9x 1.2x FY 2016 FY 2017 FY 2018 FY 2019 2020 YTD (1) NPLs include accruing loans 90+ days delinquent. 31 (2) Of the $123.1 million of nonaccrual loans as of 9/30/2020, $101.6 million were current with regard to PARK NATIONAL CORPORATION contractual principal and interest payments. (3) For fiscal year 2016, Park recognized a negative provision of $5.1 million.
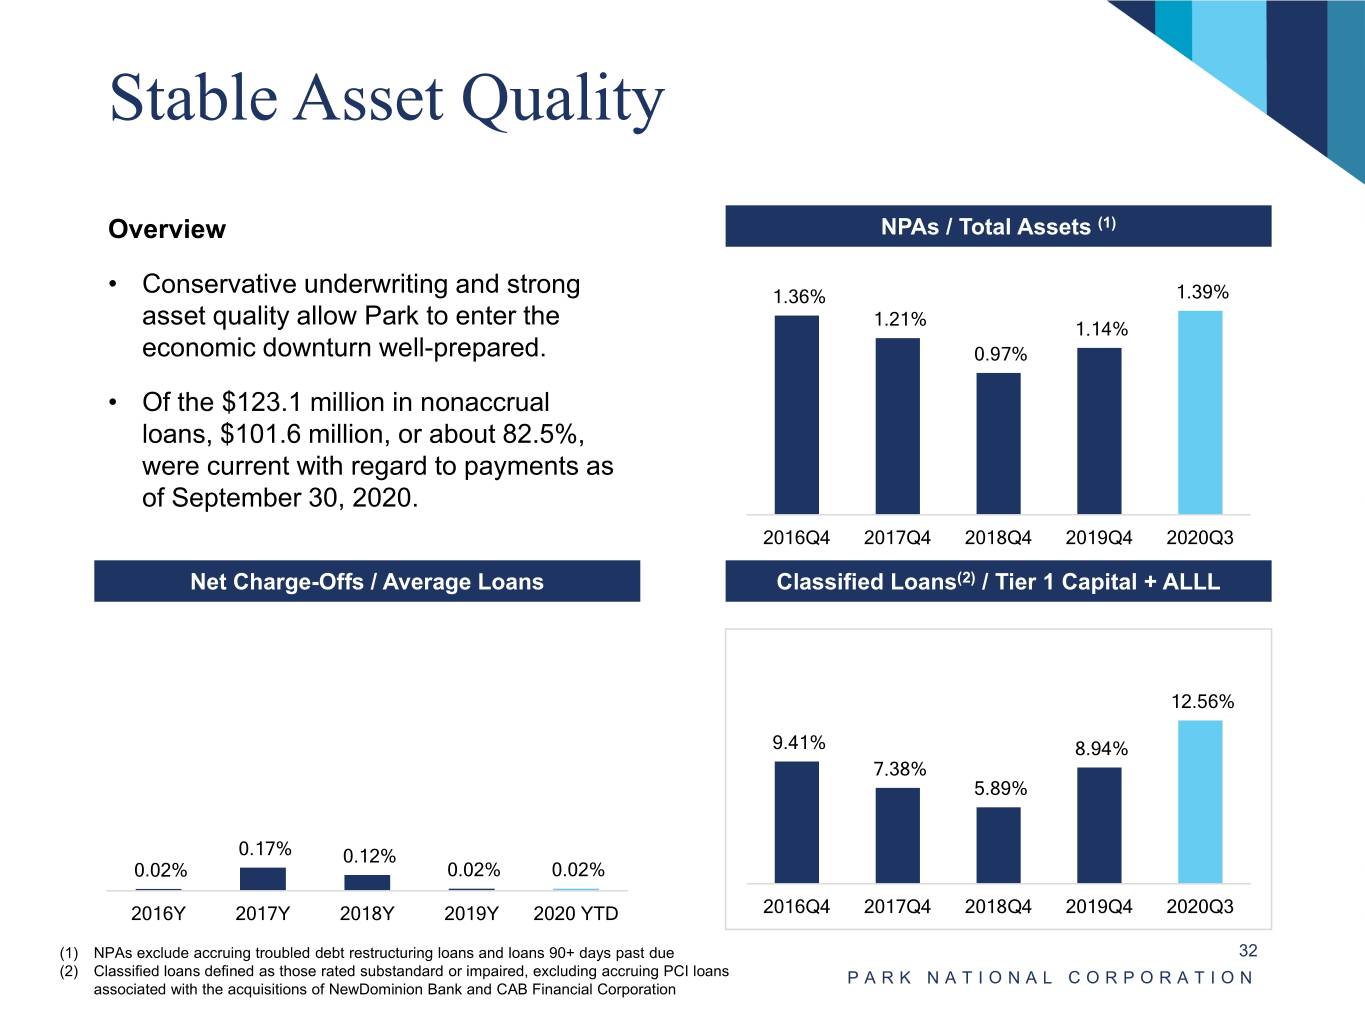
Stable Asset Quality Overview NPAs / Total Assets (1) • Conservative underwriting and strong 1.36% 1.39% 1.21% asset quality allow Park to enter the 1.14% economic downturn well-prepared. 0.97% • Of the $123.1 million in nonaccrual loans, $101.6 million, or about 82.5%, were current with regard to payments as of September 30, 2020. 2016Q4 2017Q4 2018Q4 2019Q4 2020Q3 Net Charge-Offs / Average Loans Classified Loans(2) / Tier 1 Capital + ALLL 1.80% 1.60% 1.40% 12.56% 1.20% 9.41% 1.00% 8.94% 7.38% 0.80% 5.89% 0.60% 0.40% 0.17% 0.20% 0.12% 0.02% 0.02% 0.02% – 2016Y 2017Y 2018Y 2019Y 2020 YTD 2016Q4 2017Q4 2018Q4 2019Q4 2020Q3 (1) NPAs exclude accruing troubled debt restructuring loans and loans 90+ days past due 32 (2) Classified loans defined as those rated substandard or impaired, excluding accruing PCI loans PARK NATIONAL CORPORATION associated with the acquisitions of NewDominion Bank and CAB Financial Corporation
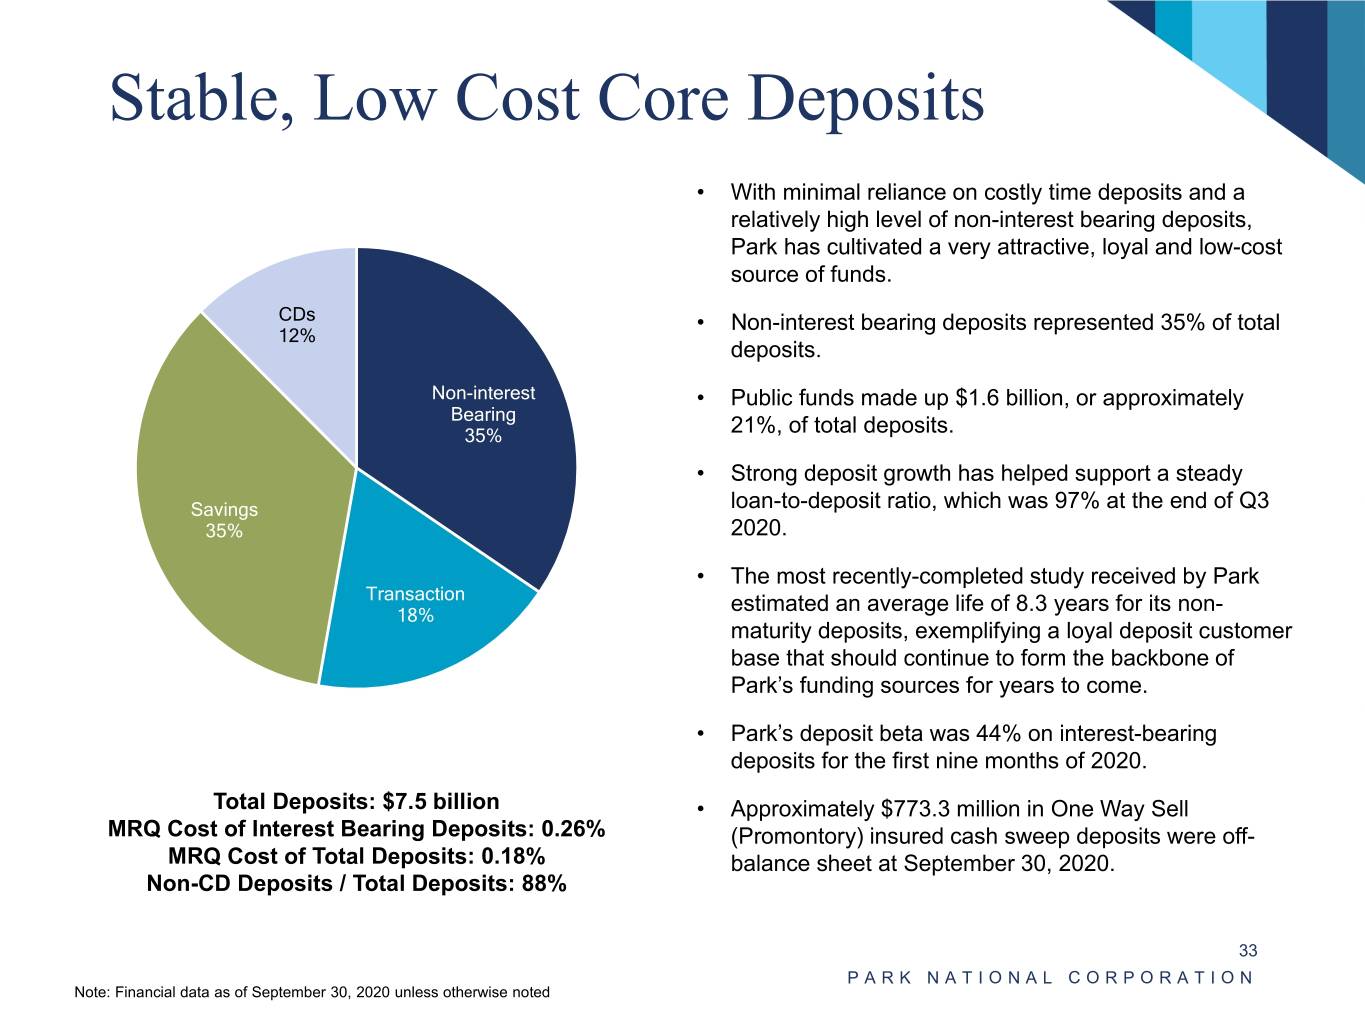
Stable, Low Cost Core Deposits • With minimal reliance on costly time deposits and a relatively high level of non-interest bearing deposits, Park has cultivated a very attractive, loyal and low-cost source of funds. CDs • Non-interest bearing deposits represented 35% of total 12% deposits. Non-interest • Public funds made up $1.6 billion, or approximately Bearing 35% 21%, of total deposits. • Strong deposit growth has helped support a steady Savings loan-to-deposit ratio, which was 97% at the end of Q3 35% 2020. • The most recently-completed study received by Park Transaction 18% estimated an average life of 8.3 years for its non- maturity deposits, exemplifying a loyal deposit customer base that should continue to form the backbone of Park’s funding sources for years to come. • Park’s deposit beta was 44% on interest-bearing deposits for the first nine months of 2020. Total Deposits: $7.5 billion • Approximately $773.3 million in One Way Sell MRQ Cost of Interest Bearing Deposits: 0.26% (Promontory) insured cash sweep deposits were off- MRQ Cost of Total Deposits: 0.18% balance sheet at September 30, 2020. Non-CD Deposits / Total Deposits: 88% 33 PARK NATIONAL CORPORATION Note: Financial data as of September 30, 2020 unless otherwise noted
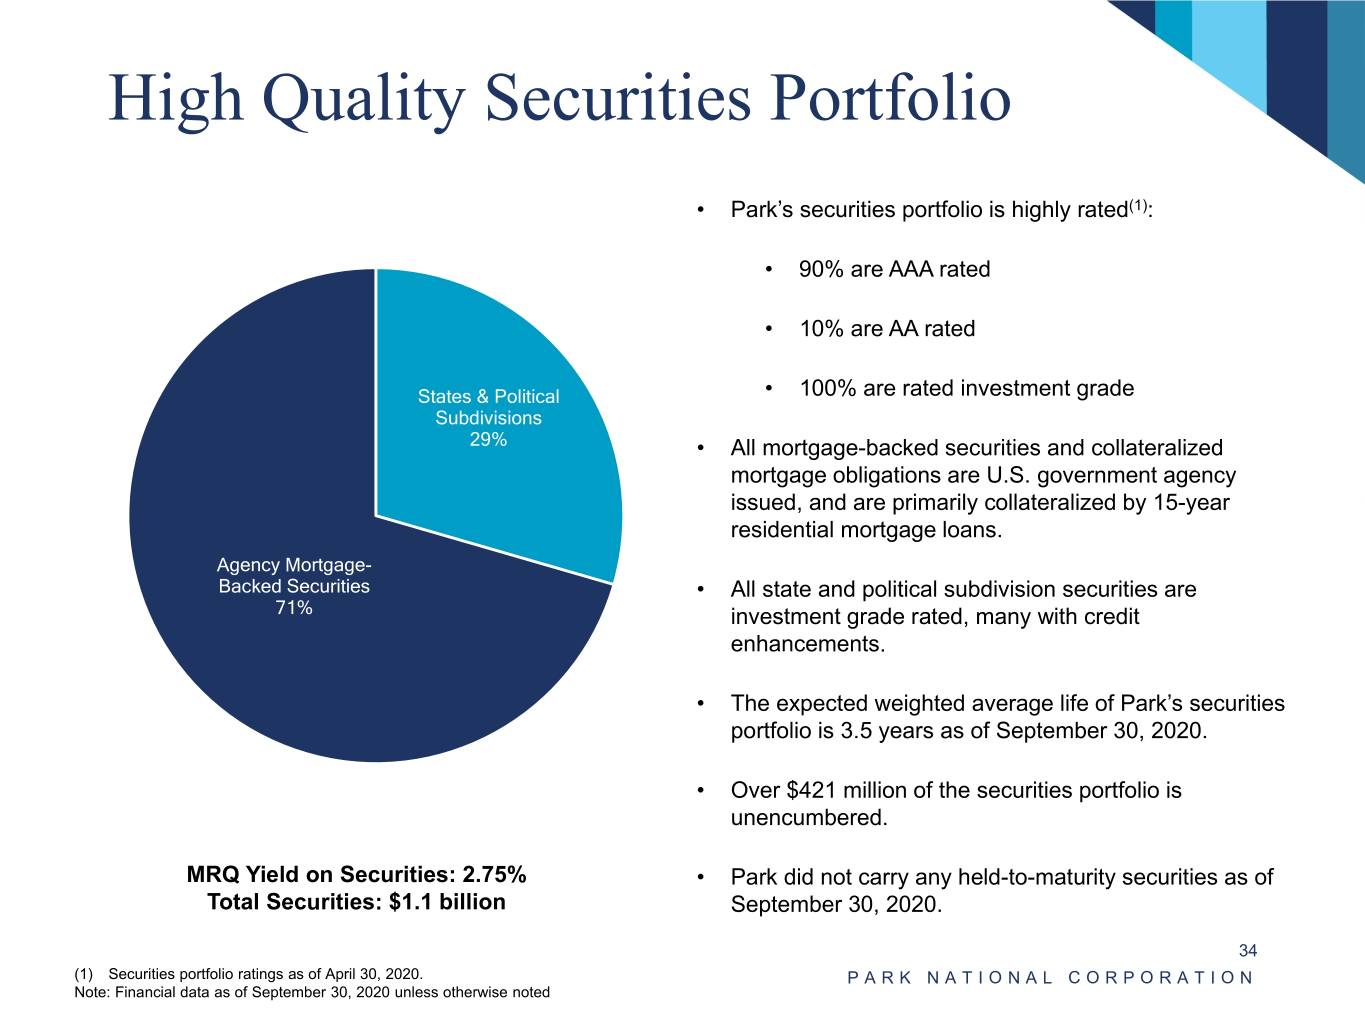
High Quality Securities Portfolio • Park’s securities portfolio is highly rated(1): • 90% are AAA rated • 10% are AA rated States & Political • 100% are rated investment grade Subdivisions 29% • All mortgage-backed securities and collateralized mortgage obligations are U.S. government agency issued, and are primarily collateralized by 15-year residential mortgage loans. Agency Mortgage- Backed Securities • All state and political subdivision securities are 71% investment grade rated, many with credit enhancements. • The expected weighted average life of Park’s securities portfolio is 3.5 years as of September 30, 2020. • Over $421 million of the securities portfolio is unencumbered. MRQ Yield on Securities: 2.75% • Park did not carry any held-to-maturity securities as of Total Securities: $1.1 billion September 30, 2020. 34 (1) Securities portfolio ratings as of April 30, 2020. PARK NATIONAL CORPORATION Note: Financial data as of September 30, 2020 unless otherwise noted
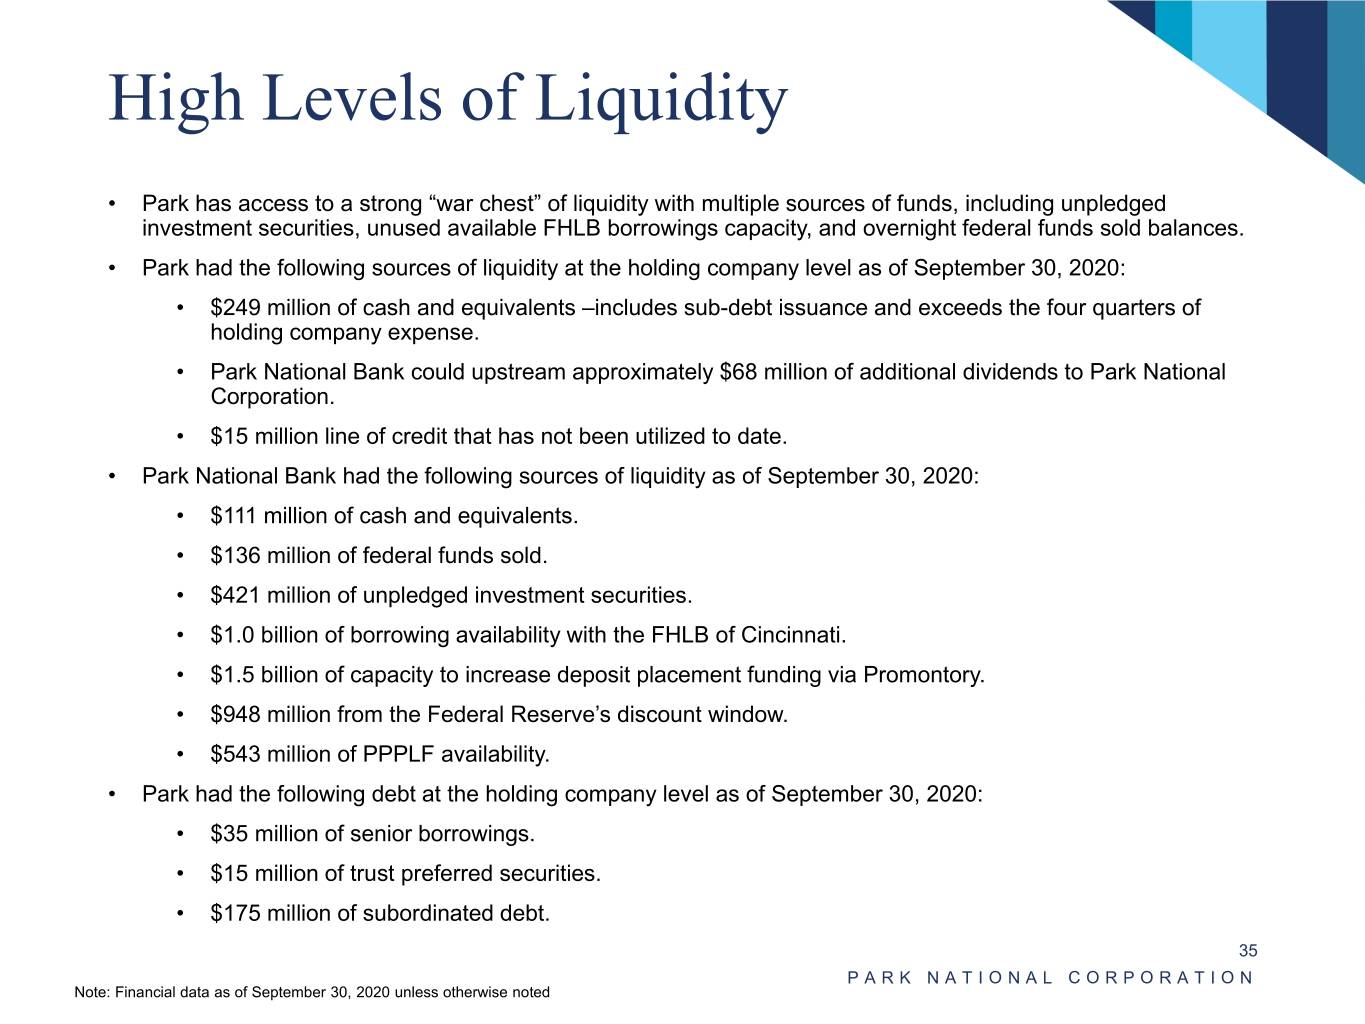
High Levels of Liquidity • Park has access to a strong “war chest” of liquidity with multiple sources of funds, including unpledged investment securities, unused available FHLB borrowings capacity, and overnight federal funds sold balances. • Park had the following sources of liquidity at the holding company level as of September 30, 2020: • $249 million of cash and equivalents –includes sub-debt issuance and exceeds the four quarters of holding company expense. • Park National Bank could upstream approximately $68 million of additional dividends to Park National Corporation. • $15 million line of credit that has not been utilized to date. • Park National Bank had the following sources of liquidity as of September 30, 2020: • $111 million of cash and equivalents. • $136 million of federal funds sold. • $421 million of unpledged investment securities. • $1.0 billion of borrowing availability with the FHLB of Cincinnati. • $1.5 billion of capacity to increase deposit placement funding via Promontory. • $948 million from the Federal Reserve’s discount window. • $543 million of PPPLF availability. • Park had the following debt at the holding company level as of September 30, 2020: • $35 million of senior borrowings. • $15 million of trust preferred securities. • $175 million of subordinated debt. 35 PARK NATIONAL CORPORATION Note: Financial data as of September 30, 2020 unless otherwise noted

Appendix PARK NATIONAL CORPORATION
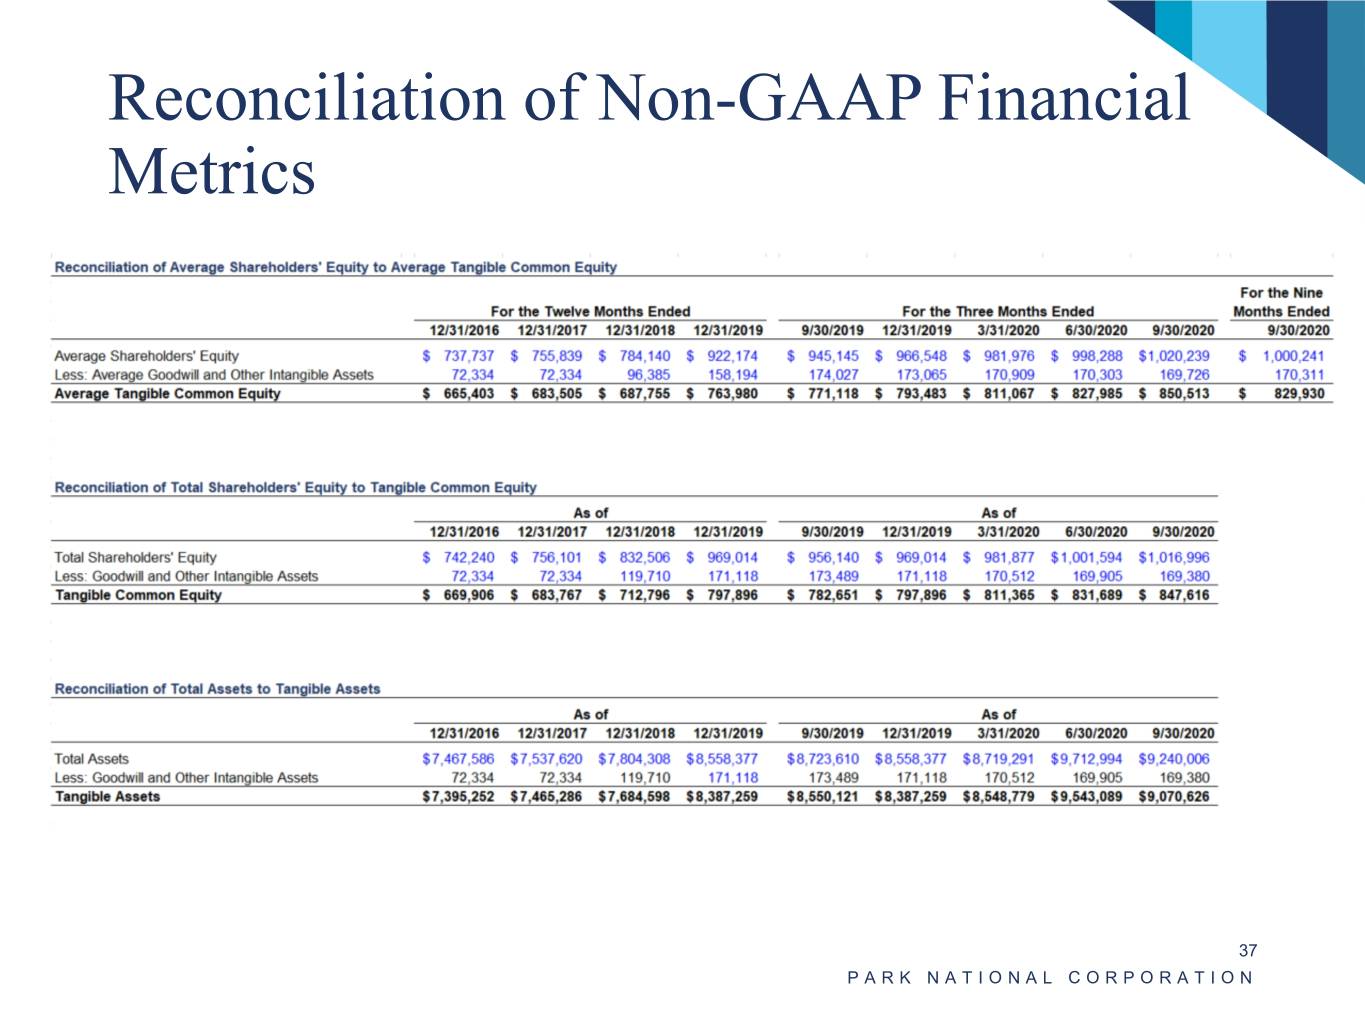
Reconciliation of Non-GAAP Financial Metrics 37 PARK NATIONAL CORPORATION
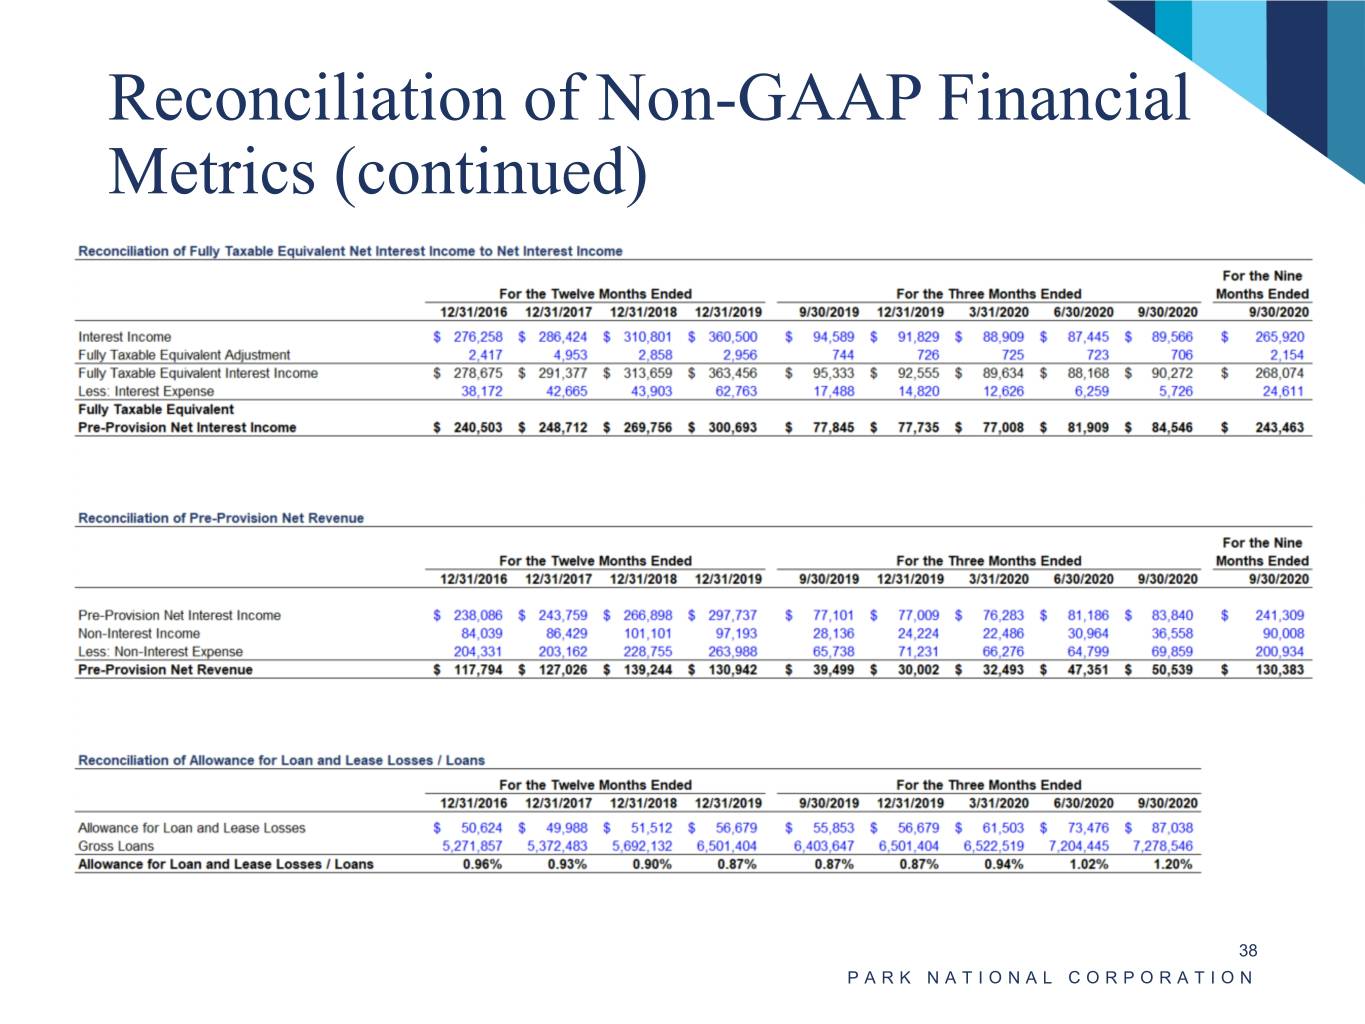
Reconciliation of Non-GAAP Financial Metrics (continued) 38 PARK NATIONAL CORPORATION

PARK NATIONAL CORPORATION: Where you mean more
