Attached files
| file | filename |
|---|---|
| EX-99.1 - EX-99.1 - INNOVATE Corp. | ex991-3q20pressrelease.htm |
| 8-K - 8-K - INNOVATE Corp. | hchc-20201109.htm |

HC2 Holdings, Inc. Q3 2020 Earnings Release Supplement November 9th, 2020 © HC2 HOLDINGS, INC. 2020
Safe Harbor Disclaimers Cautionary Statement Regarding Forward-Looking Statements Safe Harbor Statement under the Private Securities Litigation Reform Act of 1995: This presentation contains, and certain oral statements made by our representatives from time to time may contain, forward-looking statements, including, among others, statements related to the expected or potential impact of the novel coronavirus (COVID-19) pandemic, and the related responses of the government and HC2 on our business, financial condition and results of operations, and any such forward-looking statements, whether concerning the COVID-19 pandemic or otherwise, involve risks, assumptions and uncertainties. Generally, forward-looking statements include information describing actions, events, results, strategies and expectations and are generally identifiable by use of the words “believes,” “expects,” “intends,” “anticipates,” “plans,” “seeks,” “estimates,” “projects,” “may,” “will,” “could,” “might,” or “continues” or similar expressions. The forward-looking statements in this presentation include, without limitation, any statements regarding our expectations regarding entering definitive agreements in respect of and consummating potential divestitures of any of our subsidiaries, reducing debt and related interest expense at the holding company level with the net proceeds of such divestitures, building shareholder value, future cash flow, longer-term growth and invested assets, the timing and effects of redeeming the 11.5% Notes, reducing HC2's leverage and interest expense, and the timing or prospects of any refinancing of HC2's remaining corporate debt, the severity, magnitude and duration of the COVID-19 pandemic, including impacts of the pandemic and of businesses’ and governments’ responses to the pandemic on HC2’s operations and personnel, and on commercial activity and demand across our businesses, HC2’s inability to predict the extent to which the COVID-19 pandemic and related impacts will continue to adversely impact HC2’s business operations, financial performance, results of operations, financial position, the prices of HC2’s securities and the achievement of HC2’s strategic objectives, and changes in macroeconomic and market conditions and market volatility (including developments and volatility arising from the COVID-19 pandemic), including interest rates, the value of securities and other financial assets, and the impact of such changes and volatility on HC2’s financial position. Such statements are based on the beliefs and assumptions of HC2’s management and the management of HC2’s subsidiaries and portfolio companies. The Company believes these judgments are reasonable, but you should understand that these statements are not guarantees of performance or results, and the Company’s actual results could differ materially from those expressed or implied in the forward-looking statements due to a variety of important factors, both positive and negative, that may be revised or supplemented in subsequent statements and reports filed with the Securities and Exchange Commission (“SEC”), including in our reports on Forms 10-K, 10-Q, and 8-K. Such important factors include, without limitation: issues related to the restatement of our financial statements; the fact that we have historically identified material weaknesses in our internal control over financial reporting, and any inability to remediate future material weaknesses; capital market conditions, including the ability of HC2 and HC2’s subsidiaries to raise capital; the ability of HC2’s subsidiaries and portfolio companies to generate sufficient net income and cash flows to make upstream cash distributions; volatility in the trading price of HC2 common stock; the ability of HC2 and its subsidiaries and portfolio companies to identify any suitable future acquisition or disposition opportunities; our ability to realize efficiencies, cost savings, income and margin improvements, growth, economies of scale and other anticipated benefits of strategic transactions; difficulties related to the integration of financial reporting of acquired or target businesses; difficulties completing pending and future acquisitions and dispositions; effects of litigation, indemnification claims, and other contingent liabilities; changes in regulations and tax laws; and risks that may affect the performance of the operating subsidiaries and portfolio companies of HC2. Although HC2 believes its expectations and assumptions regarding its future operating performance are reasonable, there can be no assurance that the expectations reflected herein will be achieved. There can be no assurance that definitive agreements for potential divestitures or other strategic transactions will be entered into with respect to any of our subsidiaries, that any such transactions will be consummated, or the timing, terms, conditions or net proceeds thereof. These risks and other important factors discussed under the caption “Risk Factors” in our most recent Annual Report on Form 10-K filed with the SEC, and our other reports filed with the SEC could cause actual results to differ materially from those indicated by the forward-looking statements made in this presentation. You should not place undue reliance on forward-looking statements. All forward-looking statements attributable to HC2 or persons acting on its behalf are expressly qualified in their entirety by the foregoing cautionary statements. All such statements speak only as of the date made, and unless legally required, HC2 undertakes no obligation to update or revise publicly any forward-looking statements, whether as a result of new information, future events or otherwise. © HC2 HOLDINGS, INC. 2020 2
Safe Harbor Disclaimers Non-GAAP Financial Measures In this earnings release supplement, HC2 refers to certain financial measures that are not presented in accordance with U.S. generally accepted accounting principles (“GAAP”), including Adjusted EBITDA (excluding the Insurance segment) and Adjusted Operating Income and Pre-tax Adjusted Operating Income for our Insurance segment. Adjusted EBITDA Management believes that Adjusted EBITDA provides investors with meaningful information for gaining an understanding of our results as it is frequently used by the financial community to provide insight into an organization’s operating trends and facilitates comparisons between peer companies, since interest, taxes, depreciation, amortization and the other items listed in the definition of Adjusted EBITDA below can differ greatly between organizations as a result of differing capital structures and tax strategies. Adjusted EBITDA can also be a useful measure of a company’s ability to service debt. While management believes that non-U.S. GAAP measurements are useful supplemental information, such adjusted results are not intended to replace our U.S. GAAP financial results. Using Adjusted EBITDA as a performance measure has inherent limitations as an analytical tool as compared to net income (loss) or other U.S. GAAP financial measures, as this non-GAAP measure excludes certain items, including items that are recurring in nature, which may be meaningful to investors. As a result of the exclusions, Adjusted EBITDA should not be considered in isolation and does not purport to be an alternative to net income (loss) or other U.S. GAAP financial measures as a measure of our operating performance. Adjusted EBITDA excludes the results of operations and any consolidating eliminations of our Insurance segment. The calculation of Adjusted EBITDA, as defined by us, consists of Net income (loss) as adjusted for depreciation and amortization; Other operating (income) expense, which is inclusive of (gain) loss on sale or disposal of assets, lease termination costs, and FCC reimbursements; asset impairment expense; interest expense; net gain (loss) on contingent consideration; loss on early extinguishment or restructuring of debt; gain (loss) on sale of subsidiaries; other (income) expense, net; foreign currency transaction (gain) loss included in cost of revenue; income tax (benefit) expense; noncontrolling interest; bonus to be settled in equity; share-based compensation expense; discontinued operations; non-recurring items; costs associated with the COVID-19 pandemic, and acquisition and disposition costs. To help our board, management and investors assess the impact of COVID-19 pandemic on our results of operations, we are excluding the impacts of COVID-19 response initiatives for the cost of personal protective equipment distributed to employees, cleaning and sanitization equipment and procedures, and additional overhead costs to maintain proper social distancing from Adjusted EBITDA. Our board and management find the exclusion of the impact of these COVID-19 response initiatives from Adjusted EBITDA to be useful because it allows us and our investors to assess the impact of these response initiatives on our results of operations. Adjusted Operating Income Adjusted Operating Income (“Insurance AOI”) and Pre-tax Adjusted Operating Income (“Pre-tax Insurance AOI”) for the Insurance segment are non-U.S. GAAP financial measures frequently used throughout the insurance industry and are economic measures the Insurance segment uses to evaluate its financial performance. Management believes that Insurance AOI and Pre-tax Insurance AOI measures provide investors with meaningful information for gaining an understanding of certain results and provide insight into an organization’s operating trends and facilitates comparisons between peer companies. However, Insurance AOI and Pre-tax Insurance AOI have certain limitations, and we may not calculate it the same as other companies in our industry. It should, therefore, be read together with the Company's results calculated in accordance with U.S. GAAP. Management recognizes that using Insurance AOI and Pre-tax Insurance AOI as performance measures have inherent limitations as an analytical tool as compared to income (loss) from operations or other U.S. GAAP financial measures, as these non-U.S. GAAP measures excludes certain items, including items that are recurring in nature, which may be meaningful to investors. As a result of the exclusions, Insurance AOI and Pre-tax Insurance AOI should not be considered in isolation and do not purport to be an alternative to income (loss) from operations or other U.S. GAAP financial measures as a measure of our operating performance. Management defines Insurance AOI as Net income (loss) for the Insurance segment adjusted to exclude the impact of net investment gains (losses), including other-than- temporary impairment ("OTTI") losses recognized in operations; asset impairment; intercompany elimination; gain on bargain purchase; gain on reinsurance recaptures; and acquisition costs. Management defines Pre-tax Insurance AOI as Insurance AOI adjusted to exclude the impact of income tax (benefit) expense recognized during the current period. Management believes that Insurance AOI and Pre-tax Insurance AOI provide meaningful financial metrics that help investors understand certain results and profitability. While these adjustments are an integral part of the overall performance of the Insurance segment, market conditions impacting these items can overshadow the underlying performance of the business. Accordingly, we believe using a measure which excludes their impact is effective in analyzing the trends of our operations. Third Party Sources Third party information presented in this earnings release supplement is based on sources we believe to be reliable, however there can be no assurance information so © HC2 HOLDINGS, INC. 2020 presented will prove accurate in whole or in part. 3
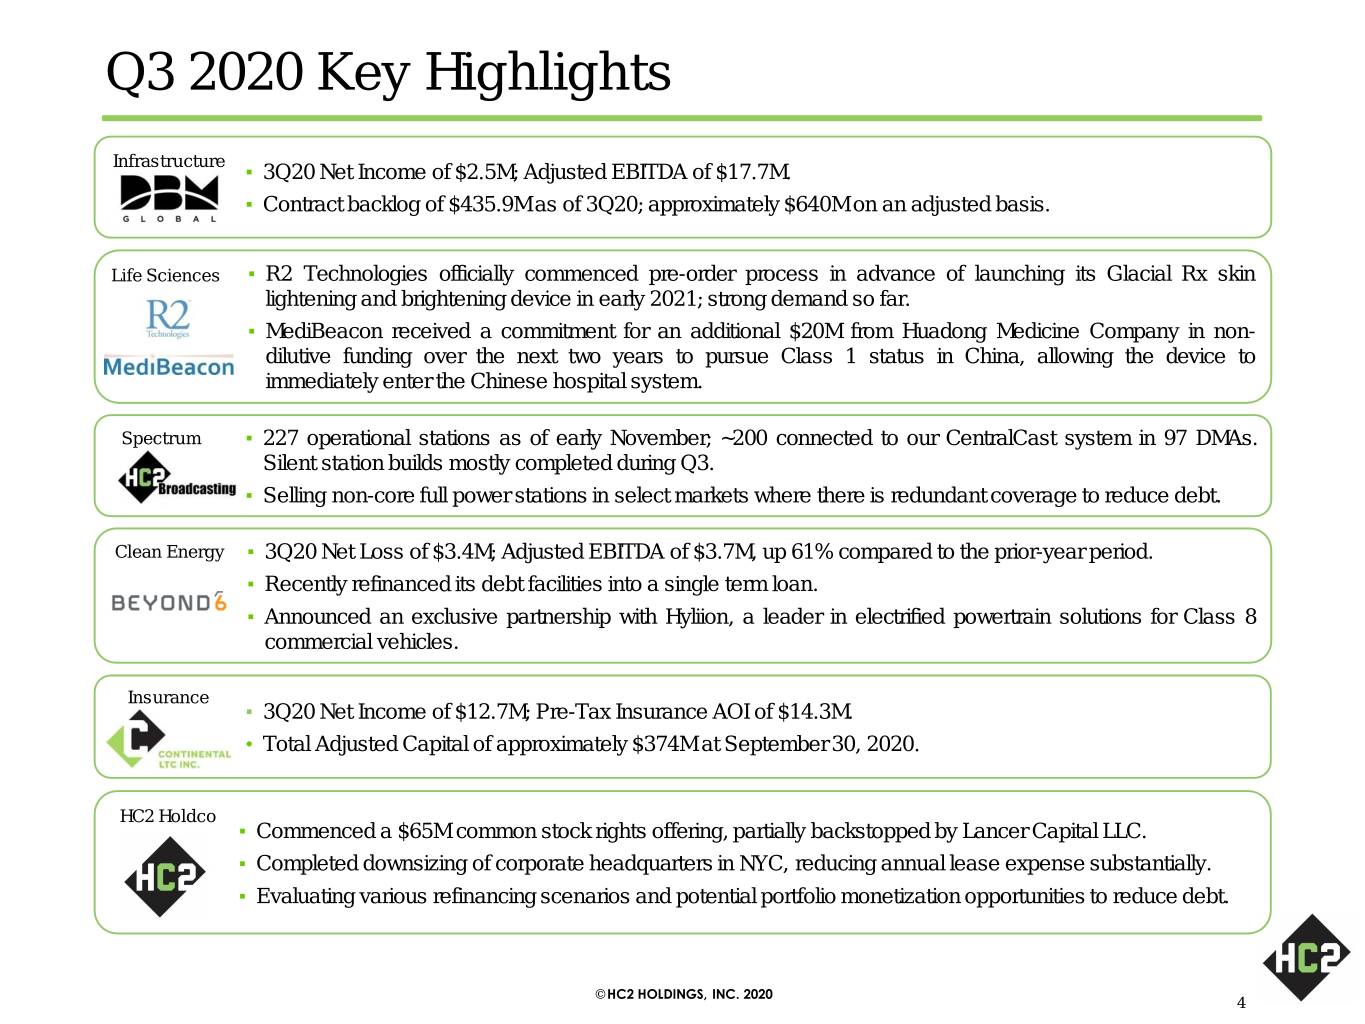
Q3 2020 Key Highlights Infrastructure ▪ 3Q20 Net Income of $2.5M; Adjusted EBITDA of $17.7M. ▪ Contract backlog of $435.9M as of 3Q20; approximately $640M on an adjusted basis. Life Sciences ▪ R2 Technologies officially commenced pre-order process in advance of launching its Glacial Rx skin lightening and brightening device in early 2021; strong demand so far. ▪ MediBeacon received a commitment for an additional $20M from Huadong Medicine Company in non- dilutive funding over the next two years to pursue Class 1 status in China, allowing the device to immediately enter the Chinese hospital system. Spectrum ▪ 227 operational stations as of early November; ~200 connected to our CentralCast system in 97 DMAs. Silent station builds mostly completed during Q3. ▪ Selling non-core full power stations in select markets where there is redundant coverage to reduce debt. Clean Energy ▪ 3Q20 Net Loss of $3.4M; Adjusted EBITDA of $3.7M, up 61% compared to the prior-year period. ▪ Recently refinanced its debt facilities into a single term loan. ▪ Announced an exclusive partnership with Hyliion, a leader in electrified powertrain solutions for Class 8 commercial vehicles. Insurance ▪ 3Q20 Net Income of $12.7M; Pre-Tax Insurance AOI of $14.3M. • Total Adjusted Capital of approximately $374M at September 30, 2020. HC2 Holdco ▪ Commenced a $65M common stock rights offering, partially backstopped by Lancer Capital LLC. ▪ Completed downsizing of corporate headquarters in NYC, reducing annual lease expense substantially. ▪ Evaluating various refinancing scenarios and potential portfolio monetization opportunities to reduce debt. © HC2 HOLDINGS, INC. 2020 4
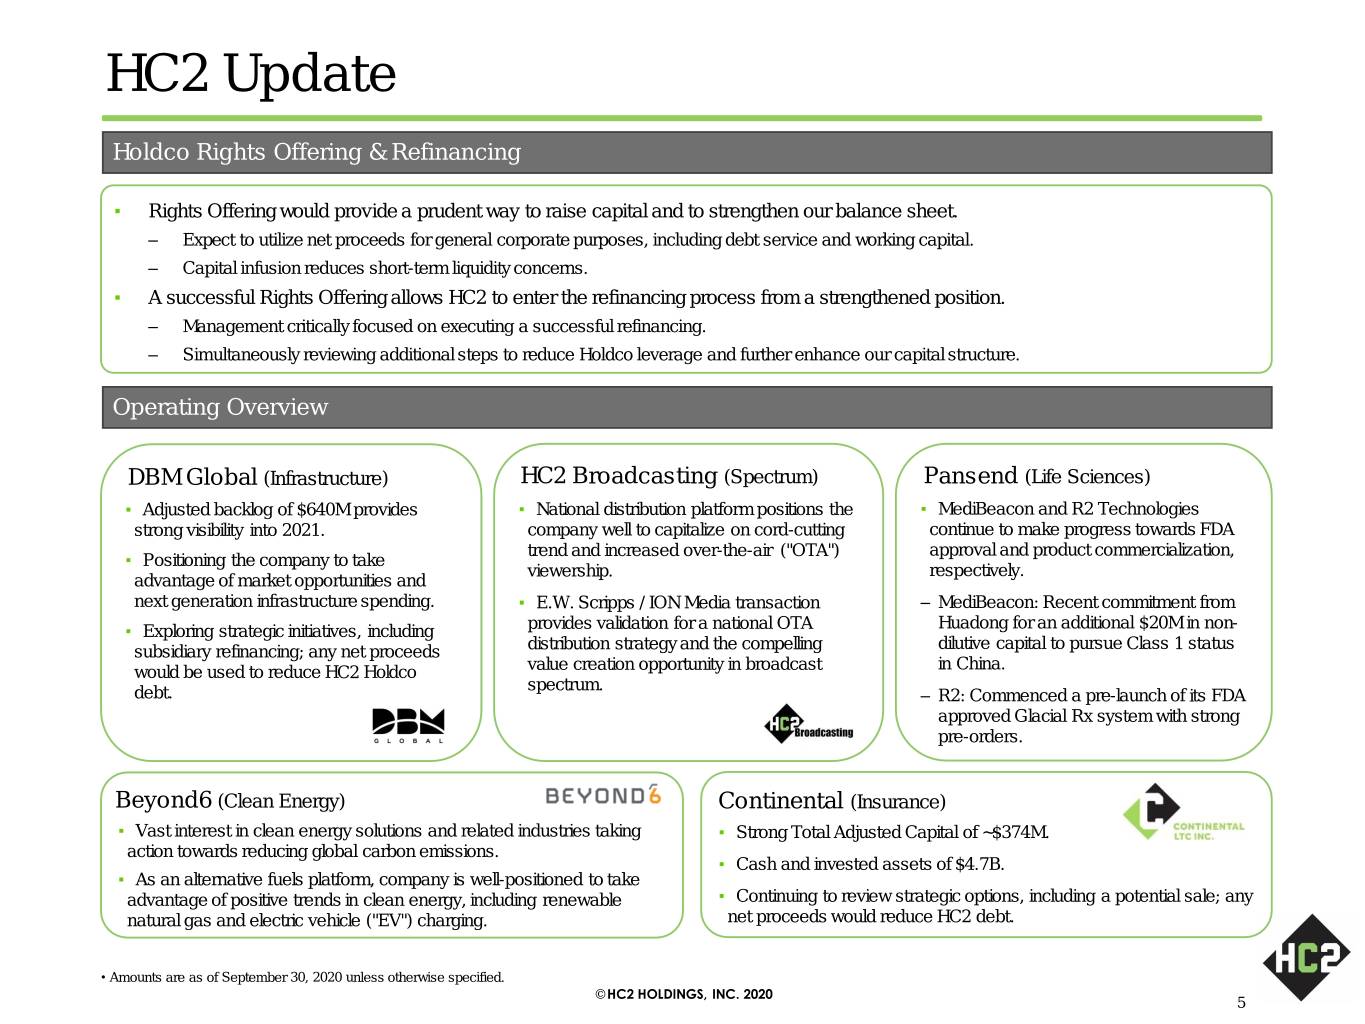
HC2 Update Holdco Rights Offering & Refinancing ▪ Rights Offering would provide a prudent way to raise capital and to strengthen our balance sheet. – Expect to utilize net proceeds for general corporate purposes, including debt service and working capital. – Capital infusion reduces short-term liquidity concerns. ▪ A successful Rights Offering allows HC2 to enter the refinancing process from a strengthened position. – Management critically focused on executing a successful refinancing. – Simultaneously reviewing additional steps to reduce Holdco leverage and further enhance our capital structure. Operating Overview DBM Global (Infrastructure) HC2 Broadcasting (Spectrum) Pansend (Life Sciences) ▪ Adjusted backlog of $640M provides ▪ National distribution platform positions the ▪ MediBeacon and R2 Technologies strong visibility into 2021. company well to capitalize on cord-cutting continue to make progress towards FDA trend and increased over-the-air ("OTA") approval and product commercialization, ▪ Positioning the company to take viewership. respectively. advantage of market opportunities and next generation infrastructure spending. ▪ E.W. Scripps / ION Media transaction – MediBeacon: Recent commitment from ▪ Exploring strategic initiatives, including provides validation for a national OTA Huadong for an additional $20M in non- subsidiary refinancing; any net proceeds distribution strategy and the compelling dilutive capital to pursue Class 1 status would be used to reduce HC2 Holdco value creation opportunity in broadcast in China. spectrum. debt. – R2: Commenced a pre-launch of its FDA approved Glacial Rx system with strong pre-orders. Beyond6 (Clean Energy) Continental (Insurance) ▪ Vast interest in clean energy solutions and related industries taking ▪ Strong Total Adjusted Capital of ~$374M. action towards reducing global carbon emissions. ▪ Cash and invested assets of $4.7B. ▪ As an alternative fuels platform, company is well-positioned to take advantage of positive trends in clean energy, including renewable ▪ Continuing to review strategic options, including a potential sale; any natural gas and electric vehicle ("EV") charging. net proceeds would reduce HC2 debt. • Amounts are as of September 30, 2020 unless otherwise specified. © HC2 HOLDINGS, INC. 2020 5
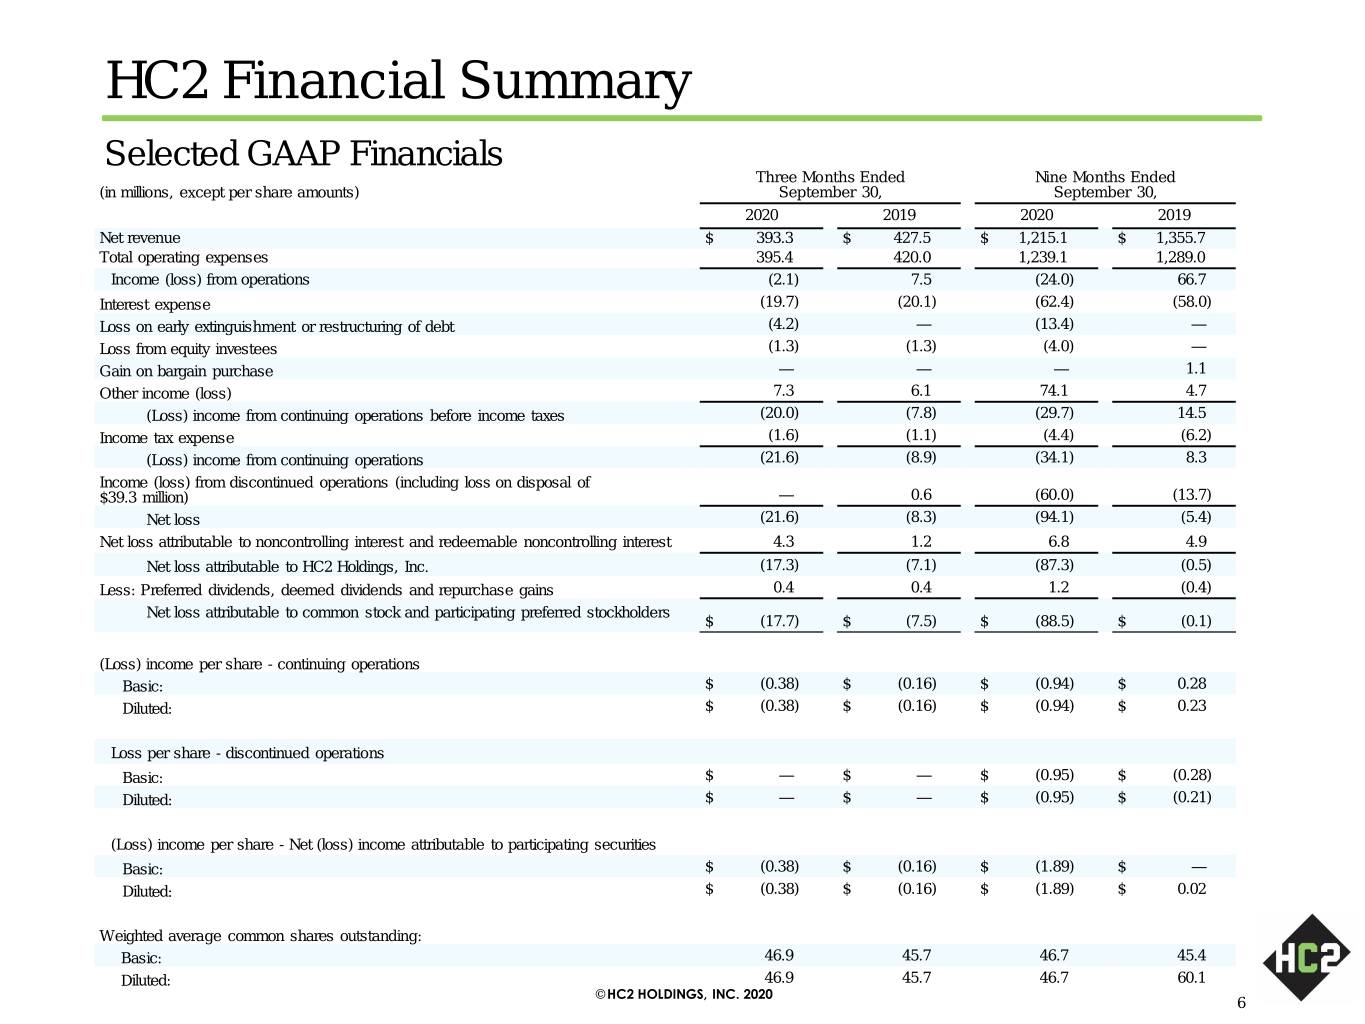
HC2 Financial Summary Selected GAAP Financials Three Months Ended Nine Months Ended (in millions, except per share amounts) September 30, September 30, 2020 2019 2020 2019 Net revenue $ 393.3 $ 427.5 $ 1,215.1 $ 1,355.7 Total operating expenses 395.4 420.0 1,239.1 1,289.0 Income (loss) from operations (2.1) 7.5 (24.0) 66.7 Interest expense (19.7) (20.1) (62.4) (58.0) Loss on early extinguishment or restructuring of debt (4.2) — (13.4) — Loss from equity investees (1.3) (1.3) (4.0) — Gain on bargain purchase — — — 1.1 Other income (loss) 7.3 6.1 74.1 4.7 (Loss) income from continuing operations before income taxes (20.0) (7.8) (29.7) 14.5 Income tax expense (1.6) (1.1) (4.4) (6.2) (Loss) income from continuing operations (21.6) (8.9) (34.1) 8.3 Income (loss) from discontinued operations (including loss on disposal of $39.3 million) — 0.6 (60.0) (13.7) Net loss (21.6) (8.3) (94.1) (5.4) Net loss attributable to noncontrolling interest and redeemable noncontrolling interest 4.3 1.2 6.8 4.9 Net loss attributable to HC2 Holdings, Inc. (17.3) (7.1) (87.3) (0.5) Less: Preferred dividends, deemed dividends and repurchase gains 0.4 0.4 1.2 (0.4) Net loss attributable to common stock and participating preferred stockholders $ (17.7) $ (7.5) $ (88.5) $ (0.1) (Loss) income per share - continuing operations Basic: $ (0.38) $ (0.16) $ (0.94) $ 0.28 Diluted: $ (0.38) $ (0.16) $ (0.94) $ 0.23 Loss per share - discontinued operations Basic: $ — $ — $ (0.95) $ (0.28) Diluted: $ — $ — $ (0.95) $ (0.21) (Loss) income per share - Net (loss) income attributable to participating securities Basic: $ (0.38) $ (0.16) $ (1.89) $ — Diluted: $ (0.38) $ (0.16) $ (1.89) $ 0.02 Weighted average common shares outstanding: Basic: 46.9 45.7 46.7 45.4 Diluted: 46.9 45.7 46.7 60.1 © HC2 HOLDINGS, INC. 2020 6
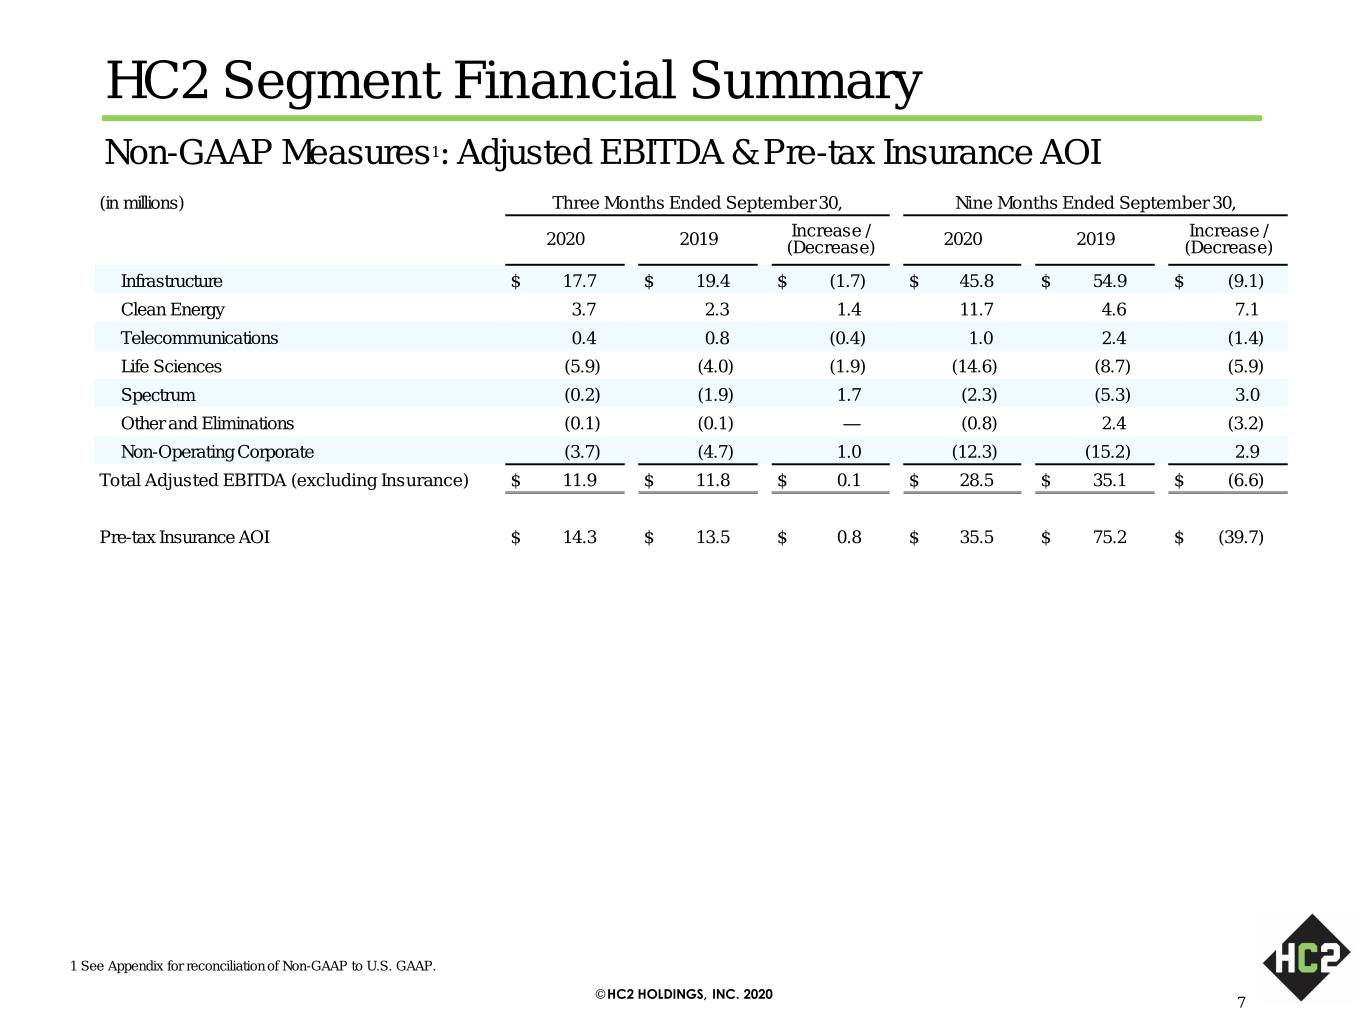
HC2 Segment Financial Summary Non-GAAP Measures1: Adjusted EBITDA & Pre-tax Insurance AOI (in millions) Three Months Ended September 30, Nine Months Ended September 30, Increase / Increase / 2020 2019 (Decrease) 2020 2019 (Decrease) Infrastructure $ 17.7 $ 19.4 $ (1.7) $ 45.8 $ 54.9 $ (9.1) Clean Energy 3.7 2.3 1.4 11.7 4.6 7.1 Telecommunications 0.4 0.8 (0.4) 1.0 2.4 (1.4) Life Sciences (5.9) (4.0) (1.9) (14.6) (8.7) (5.9) Spectrum (0.2) (1.9) 1.7 (2.3) (5.3) 3.0 Other and Eliminations (0.1) (0.1) — (0.8) 2.4 (3.2) Non-Operating Corporate (3.7) (4.7) 1.0 (12.3) (15.2) 2.9 Total Adjusted EBITDA (excluding Insurance) $ 11.9 $ 11.8 $ 0.1 $ 28.5 $ 35.1 $ (6.6) Pre-tax Insurance AOI $ 14.3 $ 13.5 $ 0.8 $ 35.5 $ 75.2 $ (39.7) 1 See Appendix for reconciliation of Non-GAAP to U.S. GAAP. © HC2 HOLDINGS, INC. 2020 7
Non-GAAP Reconciliations © HC2 HOLDINGS, INC. 2020 8
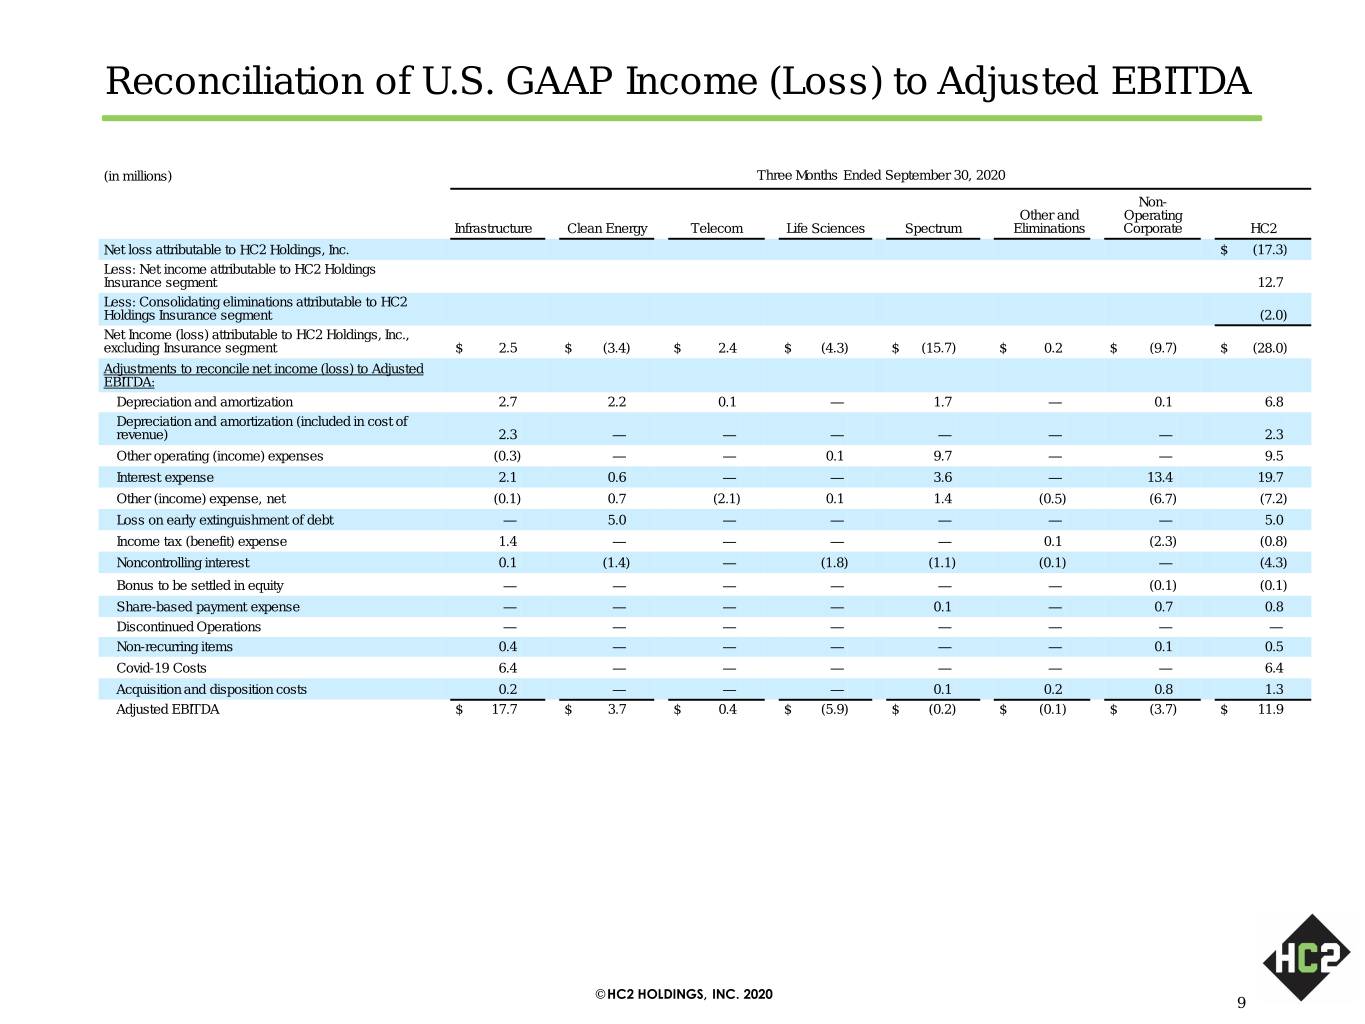
Reconciliation of U.S. GAAP Income (Loss) to Adjusted EBITDA (in millions) Three Months Ended September 30, 2020 Non- Other and Operating Infrastructure Clean Energy Telecom Life Sciences Spectrum Eliminations Corporate HC2 Net loss attributable to HC2 Holdings, Inc. $ (17.3) Less: Net income attributable to HC2 Holdings Insurance segment 12.7 Less: Consolidating eliminations attributable to HC2 Holdings Insurance segment (2.0) Net Income (loss) attributable to HC2 Holdings, Inc., excluding Insurance segment $ 2.5 $ (3.4) $ 2.4 $ (4.3) $ (15.7) $ 0.2 $ (9.7) $ (28.0) Adjustments to reconcile net income (loss) to Adjusted EBITDA: Depreciation and amortization 2.7 2.2 0.1 — 1.7 — 0.1 6.8 Depreciation and amortization (included in cost of revenue) 2.3 — — — — — — 2.3 Other operating (income) expenses (0.3) — — 0.1 9.7 — — 9.5 Interest expense 2.1 0.6 — — 3.6 — 13.4 19.7 Other (income) expense, net (0.1) 0.7 (2.1) 0.1 1.4 (0.5) (6.7) (7.2) Loss on early extinguishment of debt — 5.0 — — — — — 5.0 Income tax (benefit) expense 1.4 — — — — 0.1 (2.3) (0.8) Noncontrolling interest 0.1 (1.4) — (1.8) (1.1) (0.1) — (4.3) Bonus to be settled in equity — — — — — — (0.1) (0.1) Share-based payment expense — — — — 0.1 — 0.7 0.8 Discontinued Operations — — — — — — — — Non-recurring items 0.4 — — — — — 0.1 0.5 Covid-19 Costs 6.4 — — — — — — 6.4 Acquisition and disposition costs 0.2 — — — 0.1 0.2 0.8 1.3 Adjusted EBITDA $ 17.7 $ 3.7 $ 0.4 $ (5.9) $ (0.2) $ (0.1) $ (3.7) $ 11.9 © HC2 HOLDINGS, INC. 2020 9
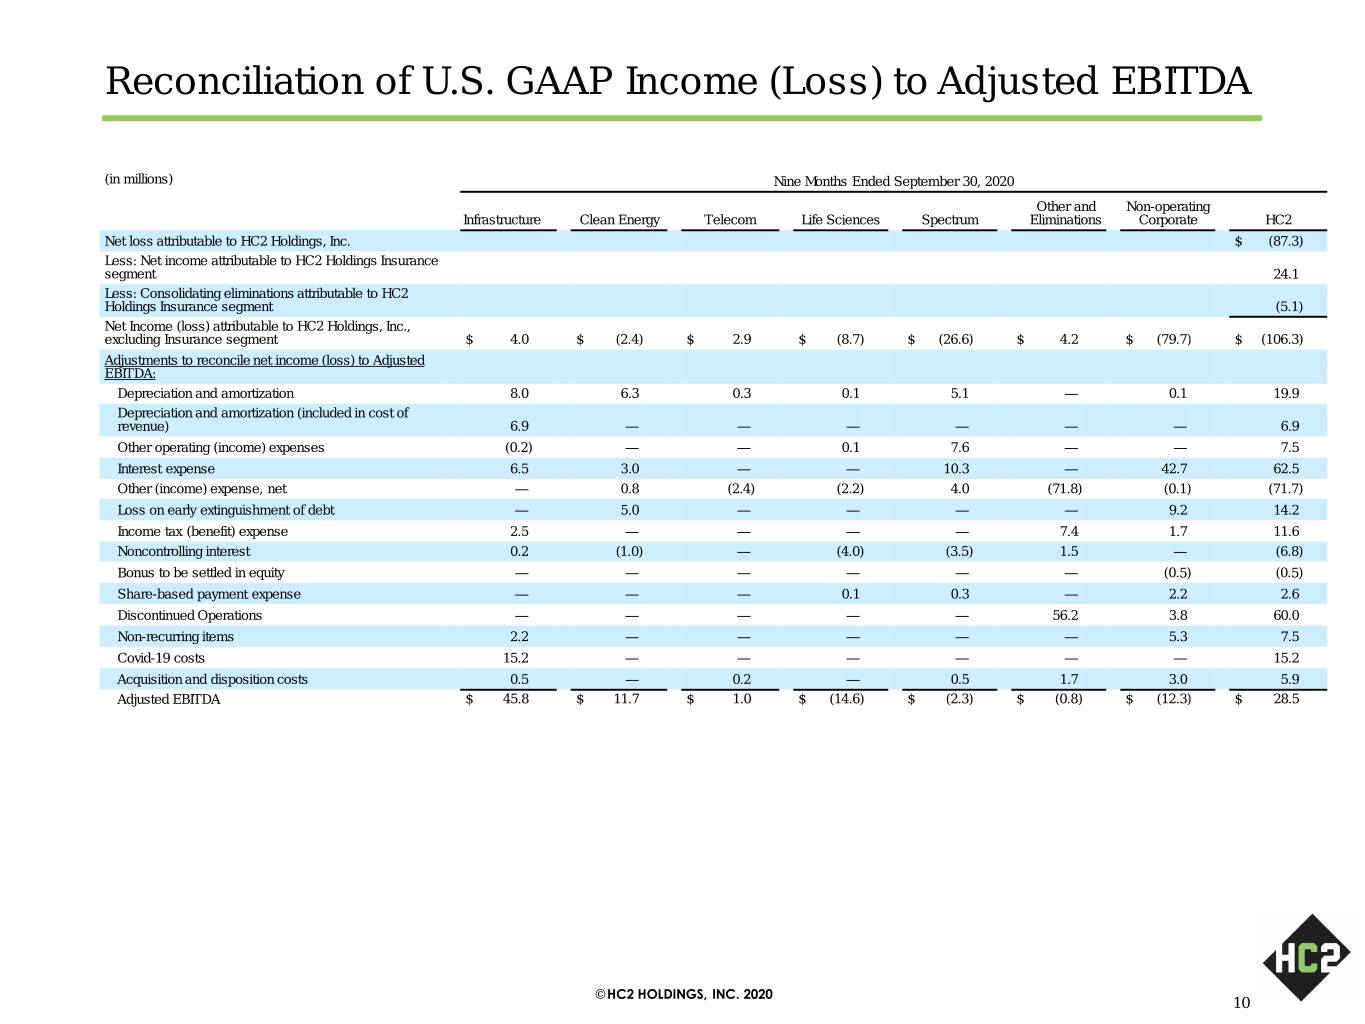
Reconciliation of U.S. GAAP Income (Loss) to Adjusted EBITDA (in millions) Nine Months Ended September 30, 2020 Other and Non-operating Infrastructure Clean Energy Telecom Life Sciences Spectrum Eliminations Corporate HC2 Net loss attributable to HC2 Holdings, Inc. $ (87.3) Less: Net income attributable to HC2 Holdings Insurance segment 24.1 Less: Consolidating eliminations attributable to HC2 Holdings Insurance segment (5.1) Net Income (loss) attributable to HC2 Holdings, Inc., excluding Insurance segment $ 4.0 $ (2.4) $ 2.9 $ (8.7) $ (26.6) $ 4.2 $ (79.7) $ (106.3) Adjustments to reconcile net income (loss) to Adjusted EBITDA: Depreciation and amortization 8.0 6.3 0.3 0.1 5.1 — 0.1 19.9 Depreciation and amortization (included in cost of revenue) 6.9 — — — — — — 6.9 Other operating (income) expenses (0.2) — — 0.1 7.6 — — 7.5 Interest expense 6.5 3.0 — — 10.3 — 42.7 62.5 Other (income) expense, net — 0.8 (2.4) (2.2) 4.0 (71.8) (0.1) (71.7) Loss on early extinguishment of debt — 5.0 — — — — 9.2 14.2 Income tax (benefit) expense 2.5 — — — — 7.4 1.7 11.6 Noncontrolling interest 0.2 (1.0) — (4.0) (3.5) 1.5 — (6.8) Bonus to be settled in equity — — — — — — (0.5) (0.5) Share-based payment expense — — — 0.1 0.3 — 2.2 2.6 Discontinued Operations — — — — — 56.2 3.8 60.0 Non-recurring items 2.2 — — — — — 5.3 7.5 Covid-19 costs 15.2 — — — — — — 15.2 Acquisition and disposition costs 0.5 — 0.2 — 0.5 1.7 3.0 5.9 Adjusted EBITDA $ 45.8 $ 11.7 $ 1.0 $ (14.6) $ (2.3) $ (0.8) $ (12.3) $ 28.5 © HC2 HOLDINGS, INC. 2020 10
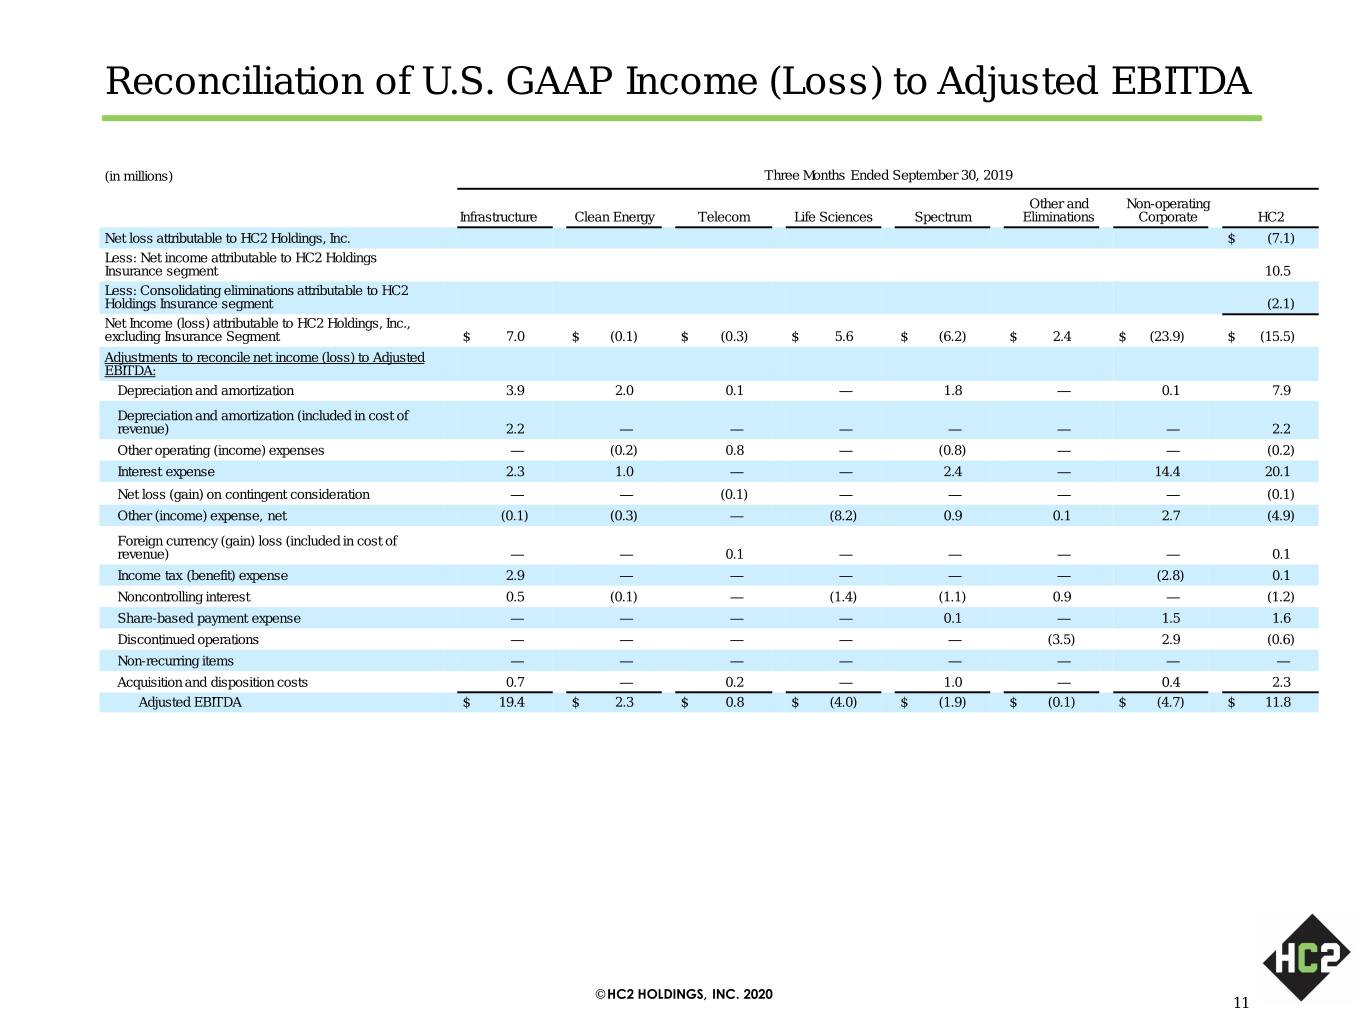
Reconciliation of U.S. GAAP Income (Loss) to Adjusted EBITDA (in millions) Three Months Ended September 30, 2019 Other and Non-operating Infrastructure Clean Energy Telecom Life Sciences Spectrum Eliminations Corporate HC2 Net loss attributable to HC2 Holdings, Inc. $ (7.1) Less: Net income attributable to HC2 Holdings Insurance segment 10.5 Less: Consolidating eliminations attributable to HC2 Holdings Insurance segment (2.1) Net Income (loss) attributable to HC2 Holdings, Inc., excluding Insurance Segment $ 7.0 $ (0.1) $ (0.3) $ 5.6 $ (6.2) $ 2.4 $ (23.9) $ (15.5) Adjustments to reconcile net income (loss) to Adjusted EBITDA: Depreciation and amortization 3.9 2.0 0.1 — 1.8 — 0.1 7.9 Depreciation and amortization (included in cost of revenue) 2.2 — — — — — — 2.2 Other operating (income) expenses — (0.2) 0.8 — (0.8) — — (0.2) Interest expense 2.3 1.0 — — 2.4 — 14.4 20.1 Net loss (gain) on contingent consideration — — (0.1) — — — — (0.1) Other (income) expense, net (0.1) (0.3) — (8.2) 0.9 0.1 2.7 (4.9) Foreign currency (gain) loss (included in cost of revenue) — — 0.1 — — — — 0.1 Income tax (benefit) expense 2.9 — — — — — (2.8) 0.1 Noncontrolling interest 0.5 (0.1) — (1.4) (1.1) 0.9 — (1.2) Share-based payment expense — — — — 0.1 — 1.5 1.6 Discontinued operations — — — — — (3.5) 2.9 (0.6) Non-recurring items — — — — — — — — Acquisition and disposition costs 0.7 — 0.2 — 1.0 — 0.4 2.3 Adjusted EBITDA $ 19.4 $ 2.3 $ 0.8 $ (4.0) $ (1.9) $ (0.1) $ (4.7) $ 11.8 © HC2 HOLDINGS, INC. 2020 11
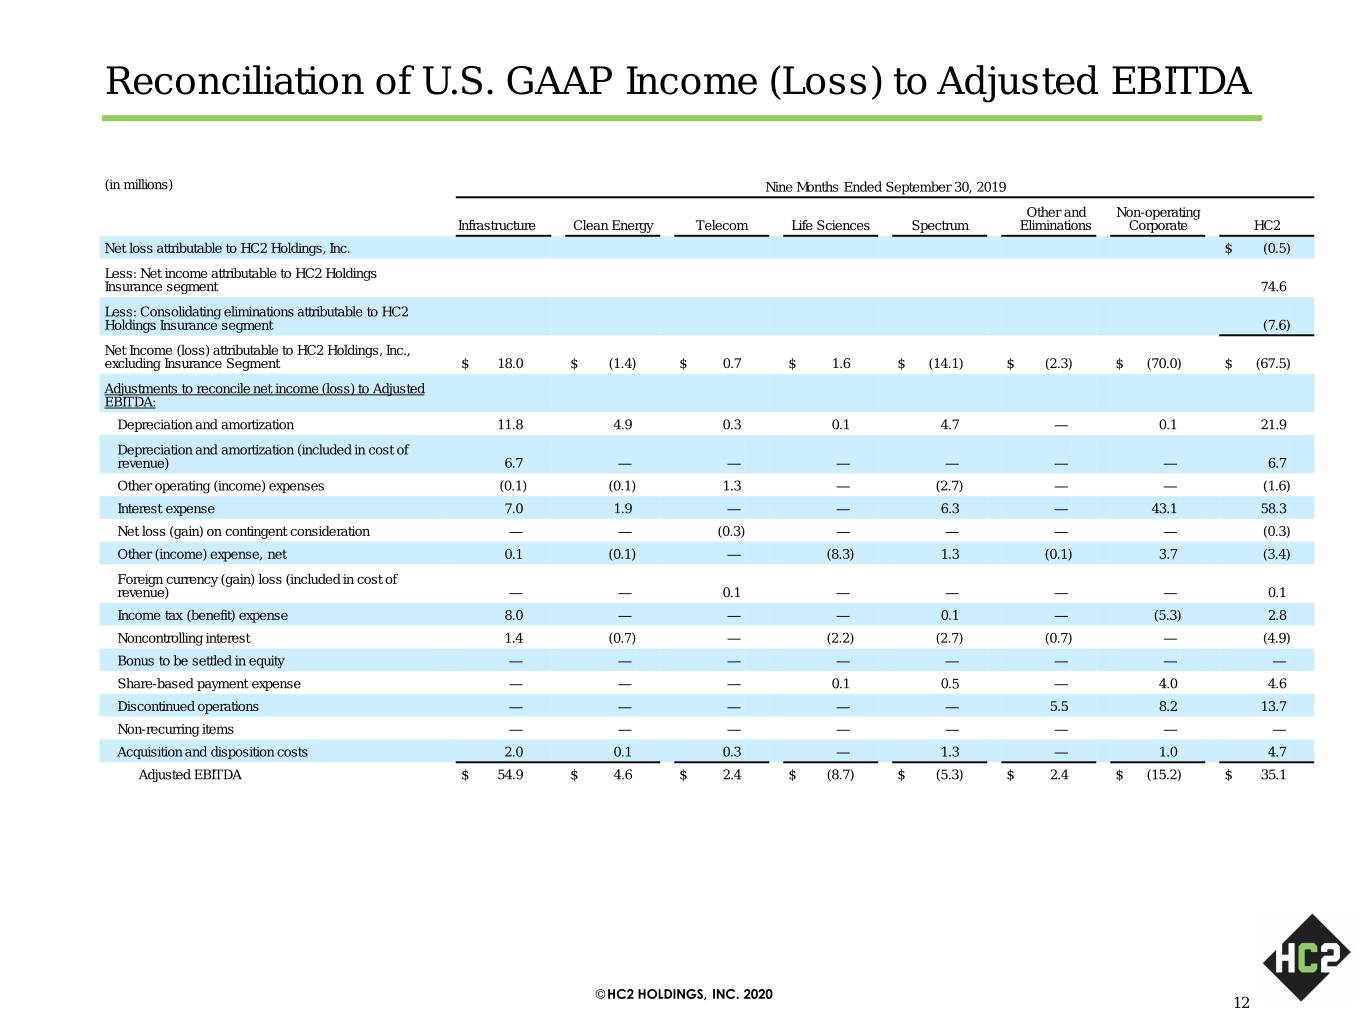
Reconciliation of U.S. GAAP Income (Loss) to Adjusted EBITDA (in millions) Nine Months Ended September 30, 2019 Other and Non-operating Infrastructure Clean Energy Telecom Life Sciences Spectrum Eliminations Corporate HC2 Net loss attributable to HC2 Holdings, Inc. $ (0.5) Less: Net income attributable to HC2 Holdings Insurance segment 74.6 Less: Consolidating eliminations attributable to HC2 Holdings Insurance segment (7.6) Net Income (loss) attributable to HC2 Holdings, Inc., excluding Insurance Segment $ 18.0 $ (1.4) $ 0.7 $ 1.6 $ (14.1) $ (2.3) $ (70.0) $ (67.5) Adjustments to reconcile net income (loss) to Adjusted EBITDA: Depreciation and amortization 11.8 4.9 0.3 0.1 4.7 — 0.1 21.9 Depreciation and amortization (included in cost of revenue) 6.7 — — — — — — 6.7 Other operating (income) expenses (0.1) (0.1) 1.3 — (2.7) — — (1.6) Interest expense 7.0 1.9 — — 6.3 — 43.1 58.3 Net loss (gain) on contingent consideration — — (0.3) — — — — (0.3) Other (income) expense, net 0.1 (0.1) — (8.3) 1.3 (0.1) 3.7 (3.4) Foreign currency (gain) loss (included in cost of revenue) — — 0.1 — — — — 0.1 Income tax (benefit) expense 8.0 — — — 0.1 — (5.3) 2.8 Noncontrolling interest 1.4 (0.7) — (2.2) (2.7) (0.7) — (4.9) Bonus to be settled in equity — — — — — — — — Share-based payment expense — — — 0.1 0.5 — 4.0 4.6 Discontinued operations — — — — — 5.5 8.2 13.7 Non-recurring items — — — — — — — — Acquisition and disposition costs 2.0 0.1 0.3 — 1.3 — 1.0 4.7 Adjusted EBITDA $ 54.9 $ 4.6 $ 2.4 $ (8.7) $ (5.3) $ 2.4 $ (15.2) $ 35.1 © HC2 HOLDINGS, INC. 2020 12
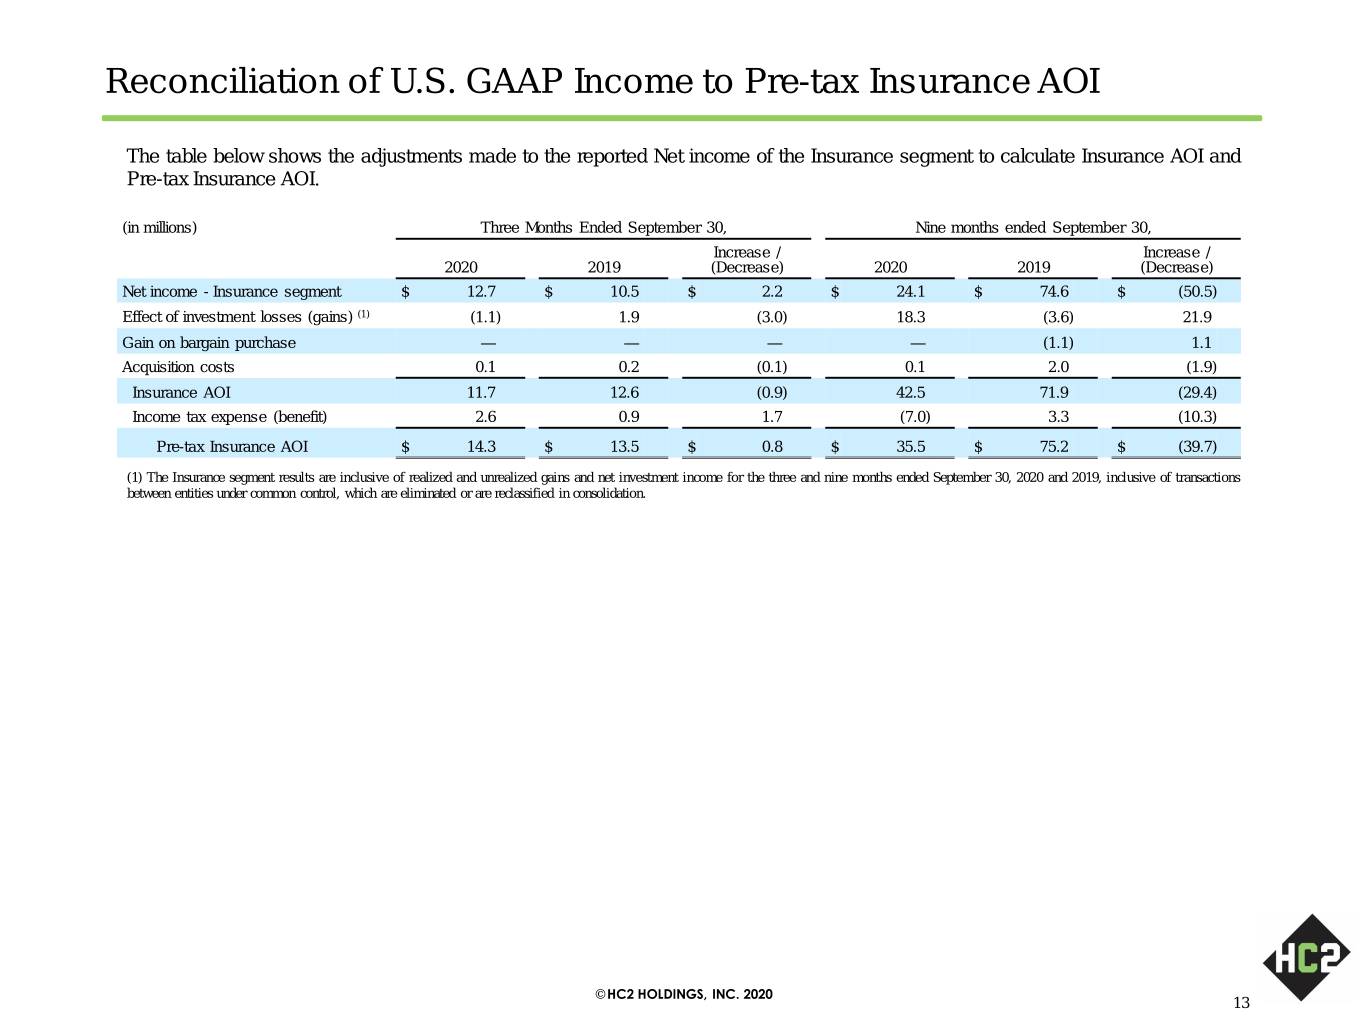
Reconciliation of U.S. GAAP Income to Pre-tax Insurance AOI The table below shows the adjustments made to the reported Net income of the Insurance segment to calculate Insurance AOI and Pre-tax Insurance AOI. (in millions) Three Months Ended September 30, Nine months ended September 30, Increase / Increase / 2020 2019 (Decrease) 2020 2019 (Decrease) Net income - Insurance segment $ 12.7 $ 10.5 $ 2.2 $ 24.1 $ 74.6 $ (50.5) Effect of investment losses (gains) (1) (1.1) 1.9 (3.0) 18.3 (3.6) 21.9 Gain on bargain purchase — — — — (1.1) 1.1 Acquisition costs 0.1 0.2 (0.1) 0.1 2.0 (1.9) Insurance AOI 11.7 12.6 (0.9) 42.5 71.9 (29.4) Income tax expense (benefit) 2.6 0.9 1.7 (7.0) 3.3 (10.3) Pre-tax Insurance AOI $ 14.3 $ 13.5 $ 0.8 $ 35.5 $ 75.2 $ (39.7) (1) The Insurance segment results are inclusive of realized and unrealized gains and net investment income for the three and nine months ended September 30, 2020 and 2019, inclusive of transactions between entities under common control, which are eliminated or are reclassified in consolidation. © HC2 HOLDINGS, INC. 2020 13
