Attached files
| file | filename |
|---|---|
| EX-99.1 - EX-99.1 - Extended Stay America, Inc. | stay20200930ex991-earn.htm |
| 8-K - 8-K - Extended Stay America, Inc. | stay-20201109.htm |

Q3 2020 Earnings Summary November 9, 2020 Extended Stay America, Inc. ESH Hospitality, Inc.

important disclosure information This presentation contains forward-looking statements within the meaning of the federal securities laws. These statements include, but are not limited to, statements related to our expectations regarding our business performance, business strategies, financial results, liquidity and capital resources, capital expenditures, capital returns, Q4 2020 and Full Year 2020 Outlook, distribution policy, plans, goals, beliefs, business trends and future events, as well as the COVID-19 pandemic, its effects on the foregoing, government action taken in response to the pandemic and action that we have or plan to take in response to the pandemic and other non-historical statements, including statements relating to industry RevPAR trends. Forward looking statements involve known and unknown risks, uncertainties and other factors that may cause Extended Stay America, Inc.’s (“ESA”) and ESH Hospitality, Inc.’s (“ESH REIT,” and together with ESA, the “Company”) actual results or performance to differ from those projected in the forward-looking statements, possibly materially. For a description of factors that may cause the Company’s actual results or performance to differ from projected results or performance implied by forward-looking statements, please review the information under the headings “Cautionary Note Regarding Forward-Looking Statements” and “Risk Factors” included in the Company’s combined annual report on Form 10-K filed with the Securities and Exchange Commission (“SEC”) on February 26, 2020 and other documents of the Company on file with or furnished to the SEC, including our combined quarterly reports on Form 10-Q filed with the SEC on November 9, 2020. Any forward-looking statements made in this presentation are qualified by these cautionary statements, and there can be no assurance that the actual results or developments anticipated by the Company will be realized or, even if substantially realized, will have the expected consequences to, or effects on, the Company, its business or operations. Except as required by law, the Company undertakes no obligation to update or revise any forward-looking statement, whether as a result of new information, future developments or otherwise. We caution you that actual results may differ materially from what is expressed, implied or forecasted by the Company’s forward- looking statements. This presentation includes certain non-GAAP financial measures, including Hotel Operating Profit, Hotel Operating Margin, EBITDA, Adjusted EBITDA, Funds from Operations (“FFO”), Adjusted Funds From Operations (“Adjusted FFO”), Adjusted FFO per diluted Paired Share, Paired Share Income, Adjusted Paired Share Income and Adjusted Paired Share Income per diluted Paired Share. These non-GAAP financial measures should be considered only as supplemental to, and not as superior to, financial measures prepared in accordance with U.S. GAAP. Please refer to the Appendix of this presentation for a reconciliation of these non-GAAP financial measures to the most directly comparable financial measures prepared in accordance with U.S. GAAP, and to the Company’s combined annual report on Form 10-K filed with the SEC on February 26, 2020 for definitions of these non-GAAP measures. This presentation includes certain operating metrics presented on a comparable system-wide basis. The term “comparable system-wide” refers to hotels operated under the Extended Stay America brand, including those owned, franchised or managed by the Company, for each of the full three and nine months ended September 30, 2020 and 2019. For franchised or managed hotels, ESA earns certain fees based on a percentage of hotel revenues. 2

Q3 2020 Operating Results and Financial Highlights comparable system-wide revenue per available net income (in millions) room (“RevPAR”) $54.78 $53.2 $46.75 $31.5 Q3 2019 Q3 2020 Q3 2019 Q3 2020 1 hotel operating margin1 adjusted FFO per diluted Paired Share 53.8% 47.3% $0.54 $0.40 Q3 2019 Q3 2020 Q3 2019 Q3 2020 adjusted EBITDA (in millions)1 adjusted Paired Share income per diluted Paired Share1 $156.3 $112.7 $0.33 $0.19 Q3 2019 Q3 2020 Q3 2019 Q3 2020 1See Appendix for Hotel Operating Margin, Adjusted FFO per diluted Paired Share, Adjusted EBITDA and Adjusted Paired Share Income per diluted Paired Share reconciliations. 3

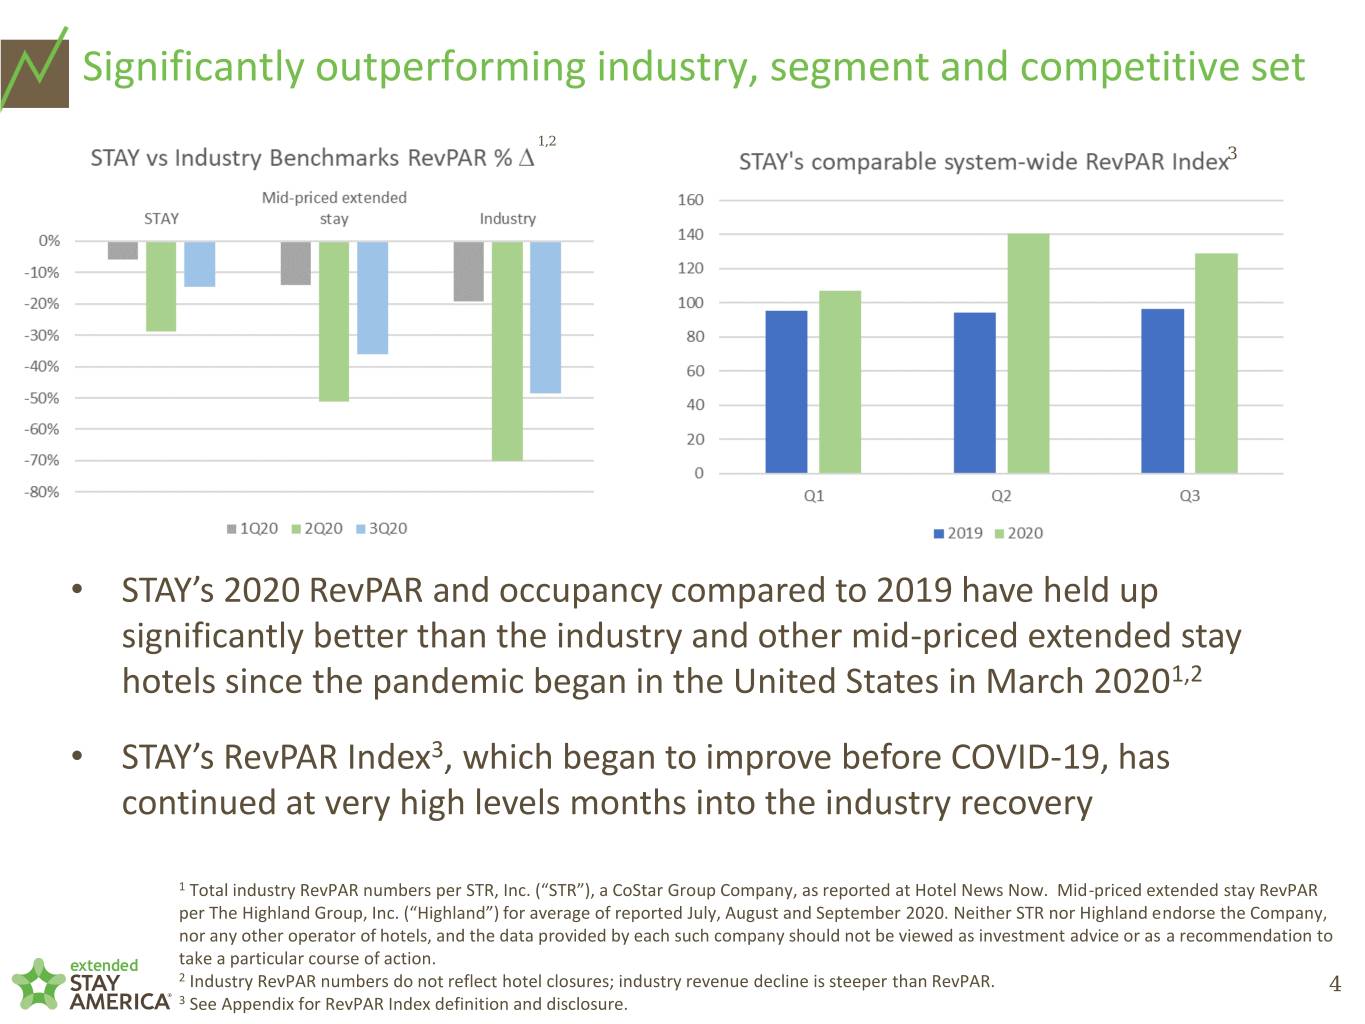
Significantly outperforming industry, segment and competitive set 1,2 3 • STAY’s 2020 RevPAR and occupancy compared to 2019 have held up significantly better than the industry and other mid-priced extended stay hotels since the pandemic began in the United States in March 20201,2 • STAY’s RevPAR Index3, which began to improve before COVID-19, has continued at very high levels months into the industry recovery 1 Total industry RevPAR numbers per STR, Inc. (“STR”), a CoStar Group Company, as reported at Hotel News Now. Mid-priced extended stay RevPAR per The Highland Group, Inc. (“Highland”) for average of reported July, August and September 2020. Neither STR nor Highland endorse the Company, nor any other operator of hotels, and the data provided by each such company should not be viewed as investment advice or as a recommendation to take a particular course of action. 2 Industry RevPAR numbers do not reflect hotel closures; industry revenue decline is steeper than RevPAR. 4 3 See Appendix for RevPAR Index definition and disclosure.

Well positioned in a challenging environment ✓ System-wide occupancy running close to FY 2019 levels in recent months ✓ Majority of STAY’s guests are driving to hotels; ~75% of locations are suburban ✓ STAY’s guests average length of stay is ~30 nights vs ~2 nights for overall industry ✓ RevPAR levels since June generate positive cash flow, even with significant capital investments ✓ Full kitchen and refrigerator in room attract guests concerned about COVID- 19 exposure while traveling or with limited dining out options ✓ Very limited urban, group and in-bound international exposure; no hotels were closed during pandemic 5

Strong free cash flow, despite capital investments into new hotels and renovations 1 1 maturity amount/ interest debt capitalization date millions2 rate Term Loan B 2026 $625 L + 2003 ESH REIT revolver 2024 $0 L + 200 ($350m) ESA revolver ($50m) 2024 $50 L + 225 total secured debt $675 senior unsecured notes 2025 $1,300 5.25% senior unsecured notes 2027 $750 4.63% preferred stock4 2020 $1 8.00% total unsecured debt $2,051 total company debt $2,726 1 Includes restricted and unrestricted cash. 2 Gross debt outstanding (excludes discounts and deferred financing costs). 3 $100m swapped to fixed LIBOR of 1.175% as of 9/30/20. 6 4 Expected to be redeemed on November 15, 2020.

Pipeline Update Company Owned Pipeline & Recently Opened Hotels as of September 30, 2020 Under Option Pre-Development Under Construction Total Pipeline Opened YTD # Hotels # Rooms # Hotels # Rooms # Hotels # Rooms # Hotels # Rooms # Hotels # Rooms 0 0 4 504 6 764 10 1,268 5 612 Third Party Pipeline & Recently Opened Hotels as of September 30, 2020 Commitments Applications Executed Total Pipeline Opened YTD # Hotels # Rooms # Hotels # Rooms # Hotels # Rooms # Hotels # Rooms # Hotels # Rooms 28 3,472 0 0 27 3,184 55 6,656 3 280 • 1 owned hotel and 1 franchised hotel opened during 3Q 2020 Definitions Under Option Locations with a signed purchase and sale agreement Pre-Development Land purchased, permitting and/or site work Under Construction Hotel is under construction Commitments Signed commitment to build or convert a certain number of hotels by a third party, generally associated with a prior portfolio sale Applications Third party filed franchise application with deposit Executed Franchise and development application approved, geography identified and deposits paid, various stages of pre-development and/or under construction 7

Outlook Update1 Q4 2020 Comparable system-wide RevPAR % D: -11% to -15% Company owned RevPAR % D: -12% to -16% Adjusted EBITDA: $78 to $88 million FY 2020 Comparable system-wide RevPAR % D: -15.5% to -16.5% Company owned RevPAR % D: -16.5% to -17.5% Net Income: $31 to $45 million Adjusted EBITDA: $363 to $373 million Capital expenditures: $170 to $190 million Depreciation expense: $203 to $206 million Net interest expense: $130 million 1Outlook for Q4 2020 and Full Year 2020 is as of November 9, 2020. Performance for the fourth quarter is subject to risks and uncertainties, in particular the ongoing impact of the COVID-19 pandemic, which could cause actual results to deviate materially from current trends and expectations. In such event, the Company does not expect to and undertakes no obligation to announce changes in 8 expectations prior to the announcement of actual fourth quarter or full year 2020 results.

appendix

REVPAR INDEX RevPAR Index is stated as a percentage and calculated by comparing RevPAR for comparable system-wide hotels to the aggregate RevPAR of a group of competing hotels generally in the same geographic market. As such, the RevPAR Index is only a measure of RevPAR relative to certain competing hotels and not a measure of our absolute RevPAR or profitability. We subscribe to STR, Inc. ("STR"), an independent third-party service, which collects and compiles the data used to calculate RevPAR Index. We select the competing hotels included in the RevPAR Index calculation subject to STR's guidelines. The competing hotels included in STR guidelines will generally include certain hotels that are not considered part of the extended stay lodging segment of the hospitality industry and, instead, fall within the category of short-term stay hotels. STR does not endorse the Company, or any other company or operator of hotels, and STR data should not be viewed as investment advice or as a recommendation to take a particular course of action. 10

NON-GAAP RECONCILIATION OF NET INCOME TO HOTEL OPERATING PROFIT AND HOTEL OPERATING MARGIN FOR THE THREE AND NINE MONTHS ENDED SEPTEMBER 30, 2020 AND 2019 (In thousands) (Unaudited) Three Months Ended Nine Months Ended September 30, September 30, 2020 2019 Variance 2020 2019 Variance $ 31,492 $ 53,230 (40.8)% Net income $ 30,567 $ 141,292 (78.4)% (7,132) 10,501 (167.9)% Income tax (benefit) expense (12,074) 27,822 (143.4)% 32,276 36,535 (11.7)% Interest expense, net 98,582 95,905 2.8% (155) 101 (253.5)% Other non-operating (income) expense 246 (248) (199.2)% (1) (3) (66.7)% Other income (4) (31) (87.1)% 420 2,679 (84.3)% Impairment of long-lived assets 1,095 2,679 (59.1)% 52,286 49,748 5.1% Depreciation and amortization 153,848 147,543 4.3% 23,193 22,292 4.0% General and administrative expenses 70,234 67,606 3.9% 1,330 1,660 (19.9)% Loss on disposal of assets (1) 6,309 5,037 25.3% (1,443) (1,351) 6.8% Franchise and management fees (3,940) (4,023) (2.1)% 516 499 3.4% System services loss, net 1,571 1,521 3.3% $ 132,782 $ 175,891 (24.5)% Hotel Operating Profit $ 346,434 $ 485,103 (28.6)% $ 273,056 $ 320,669 (14.8)% Room revenues $ 747,371 $ 899,329 (16.9)% 7,552 6,475 16.6% Other hotel revenues 20,640 17,848 15.6% $ 280,608 $ 327,144 (14.2)% Total room and other hotel revenues $ 768,011 $ 917,177 (16.3)% 47.3% 53.8% (650) bps Hotel Operating Margin 45.1% 52.9% (780) bps (1) Included in hotel operating expenses in the consolidated statements of operations. 11

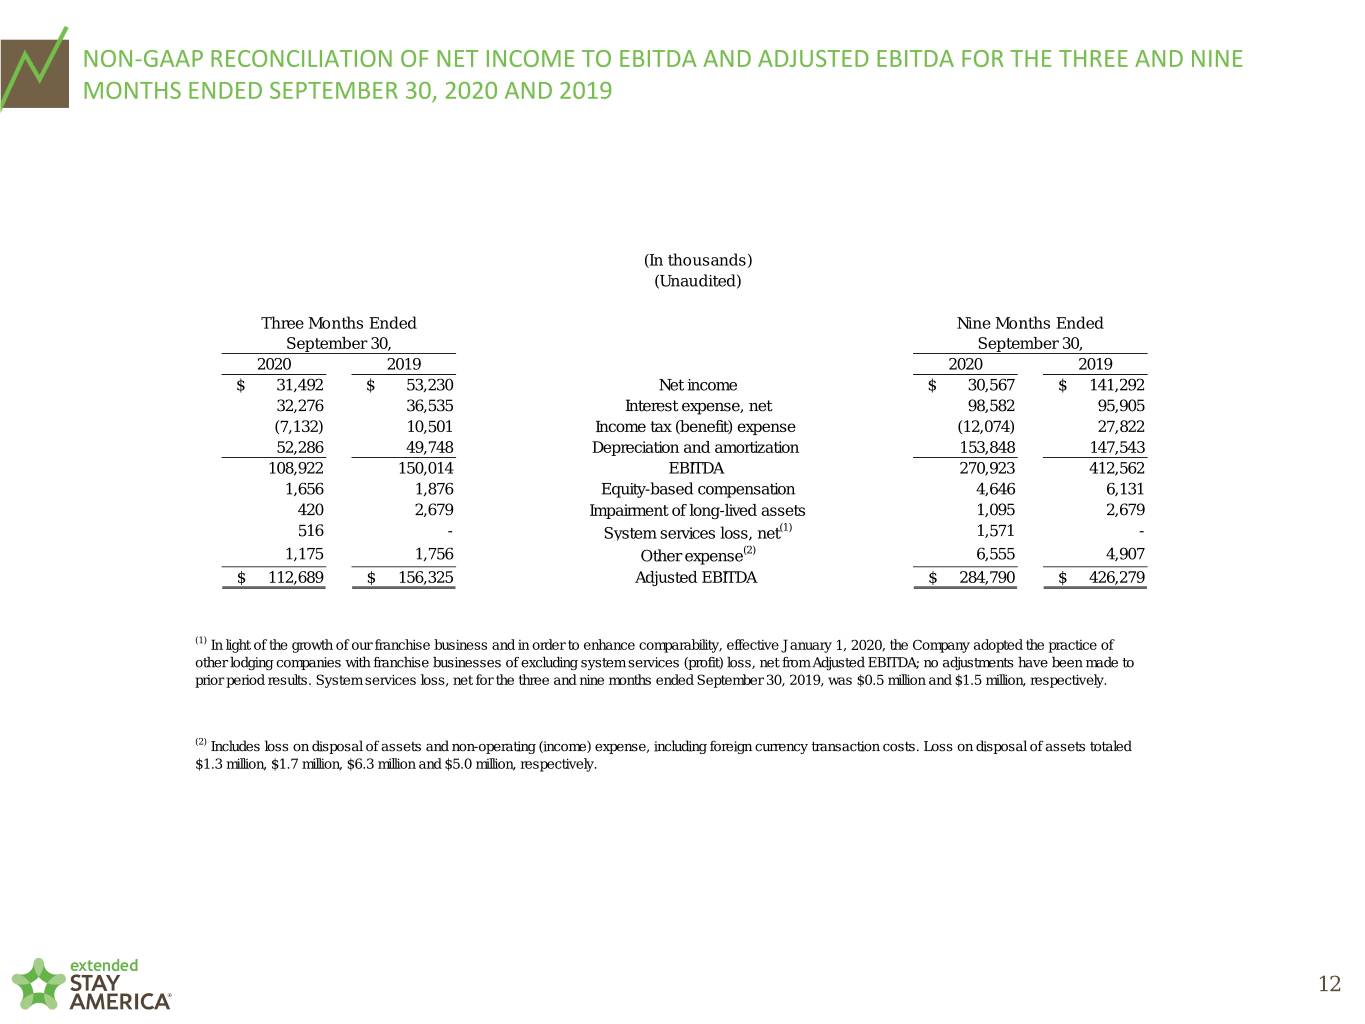
NON-GAAP RECONCILIATION OF NET INCOME TO EBITDA AND ADJUSTED EBITDA FOR THE THREE AND NINE MONTHS ENDED SEPTEMBER 30, 2020 AND 2019 (In thousands) (Unaudited) Three Months Ended Nine Months Ended September 30, September 30, 2020 2019 2020 2019 $ 31,492 $ 53,230 Net income $ 30,567 $ 141,292 32,276 36,535 Interest expense, net 98,582 95,905 (7,132) 10,501 Income tax (benefit) expense (12,074) 27,822 52,286 49,748 Depreciation and amortization 153,848 147,543 108,922 150,014 EBITDA 270,923 412,562 1,656 1,876 Equity-based compensation 4,646 6,131 420 2,679 Impairment of long-lived assets 1,095 2,679 516 - System services loss, net(1) 1,571 - 1,175 1,756 Other expense(2) 6,555 4,907 $ 112,689 $ 156,325 Adjusted EBITDA $ 284,790 $ 426,279 (1) In light of the growth of our franchise business and in order to enhance comparability, effective January 1, 2020, the Company adopted the practice of other lodging companies with franchise businesses of excluding system services (profit) loss, net from Adjusted EBITDA; no adjustments have been made to prior period results. System services loss, net for the three and nine months ended September 30, 2019, was $0.5 million and $1.5 million, respectively. (2) Includes loss on disposal of assets and non-operating (income) expense, including foreign currency transaction costs. Loss on disposal of assets totaled $1.3 million, $1.7 million, $6.3 million and $5.0 million, respectively. 12

NON-GAAP RECONCILIATION OF NET INCOME ATTRIBUTABLE TO EXTENDED STAY AMERICA, INC. COMMON SHAREHOLDERS TO FUNDS FROM OPERATIONS, ADJUSTED FUNDS FROM OPERATIONS AND ADJUSTED FUNDS FROM OPERATIONS PER DILUTED PAIRED SHARE FOR THE THREE AND NINE MONTHS ENDED SEPTEMBER 30, 2020 AND 2019 (In thousands, except per share and per Paired Share data) (Unaudited) Three Months Ended Nine Months Ended September 30, September 30, 2020 2019 2020 2019 Net income per Extended Stay America, Inc. common share - $ 0.14 $ 0.22 $ 0.09 $ 0.62 diluted Net income attributable to Extended Stay America, Inc. common $ 24,220 $ 41,071 $ 16,411 $ 116,502 shareholders Noncontrolling interests attributable to Class B 7,268 12,155 14,144 24,778 common shares of ESH REIT 50,667 48,247 Real estate depreciation and amortization 148,977 143,335 420 2,679 Impairment of long-lived assets 1,095 2,679 Tax effect of adjustments to net income attributable to Extended (11,835) (8,250) (24,265) (23,132) Stay America, Inc. common shareholders(1) 70,740 95,902 Funds from Operations 156,362 264,162 - 6,716 Debt modification and extinguishment costs - 6,716 - (1,088) Tax effect of adjustments to Funds from Operations - (1,088) $ 70,740 $ 101,530 Adjusted Funds from Operations $ 156,362 $ 269,790 Adjusted Funds from Operations $ 0.40 $ 0.54 per Paired Share – diluted $ 0.88 $ 1.43 Weighted average Paired Shares 178,198 187,015 outstanding – diluted 178,071 188,317 (1) The tax effect of adjustments to net income attributable to Extended Stay America, Inc. common shareholders for the three months ended September 30, 2020, is computed using a statutory rate due to the fact that the consolidated effective tax rate for the period is negative. 13

NON-GAAP RECONCILIATION OF NET INCOME ATTRIBUTABLE TO EXTENDED STAY AMERICA, INC. COMMON SHAREHOLDERS TO PAIRED SHARE INCOME, ADJUSTED PAIRED SHARE INCOME AND ADJUSTED PAIRED SHARE INCOME PER DILUTED PAIRED SHARE FOR THE THREE AND NINE MONTHS ENDED SEPTEMBER 30, 2020 AND 2019 (In thousands, except per share and per Paired Share data) (Unaudited) Three Months Ended Nine Months Ended September 30, September 30, 2020 2019 2020 2019 Net income per Extended Stay America, Inc. common share - $ 0.14 $ 0.22 $ 0.09 $ 0.62 diluted Net income attributable to Extended Stay America, Inc. $ 24,220 $ 41,071 common shareholders $ 16,411 $ 116,502 Noncontrolling interests attributable to Class B 7,268 12,155 common shares of ESH REIT 14,144 24,778 31,488 53,226 Paired Share Income 30,555 141,280 - 6,716 Debt modification and extinguishment costs - 6,716 420 2,679 Impairment of long-lived assets 1,095 2,679 516 - System services loss, net(1) 1,571 - 1,175 1,756 Other expense(2) 6,555 4,907 (489) (1,806) Tax effect of adjustments to Paired Share Income(3) (1,209) (2,299) $ 33,110 $ 62,571 Adjusted Paired Share Income $ 38,567 $ 153,283 Adjusted Paired Share Income per $ 0.19 $ 0.33 Paired Share – diluted $ 0.22 $ 0.81 178,198 187,015 Weighted average Paired Shares outstanding – diluted 178,071 188,317 (1) In light of the growth of our franchise business and in order to enhance comparability, effective January 1, 2020, the Company adopted the practice of other lodging companies with franchise businesses of excluding system services (profit) loss, net from Adjusted Paired Share Income; no adjustments have been made to prior period results. System services loss, net for the three and nine months ended September 30, 2019, was $0.5 million and $1.5 million, respectively. (2) Includes loss on disposal of assets and non-operating (income) expense, including foreign currency transaction costs. Loss on disposal of assets totaled $1.3 million, $1.7 million, $6.3 million and $5.0 million, respectively. (3) The tax effect of adjustments to Paired Share Income for the three months ended September 30, 2020, is computed using a statutory rate due to the fact that the consolidated effective tax rate for the period is negative. 14

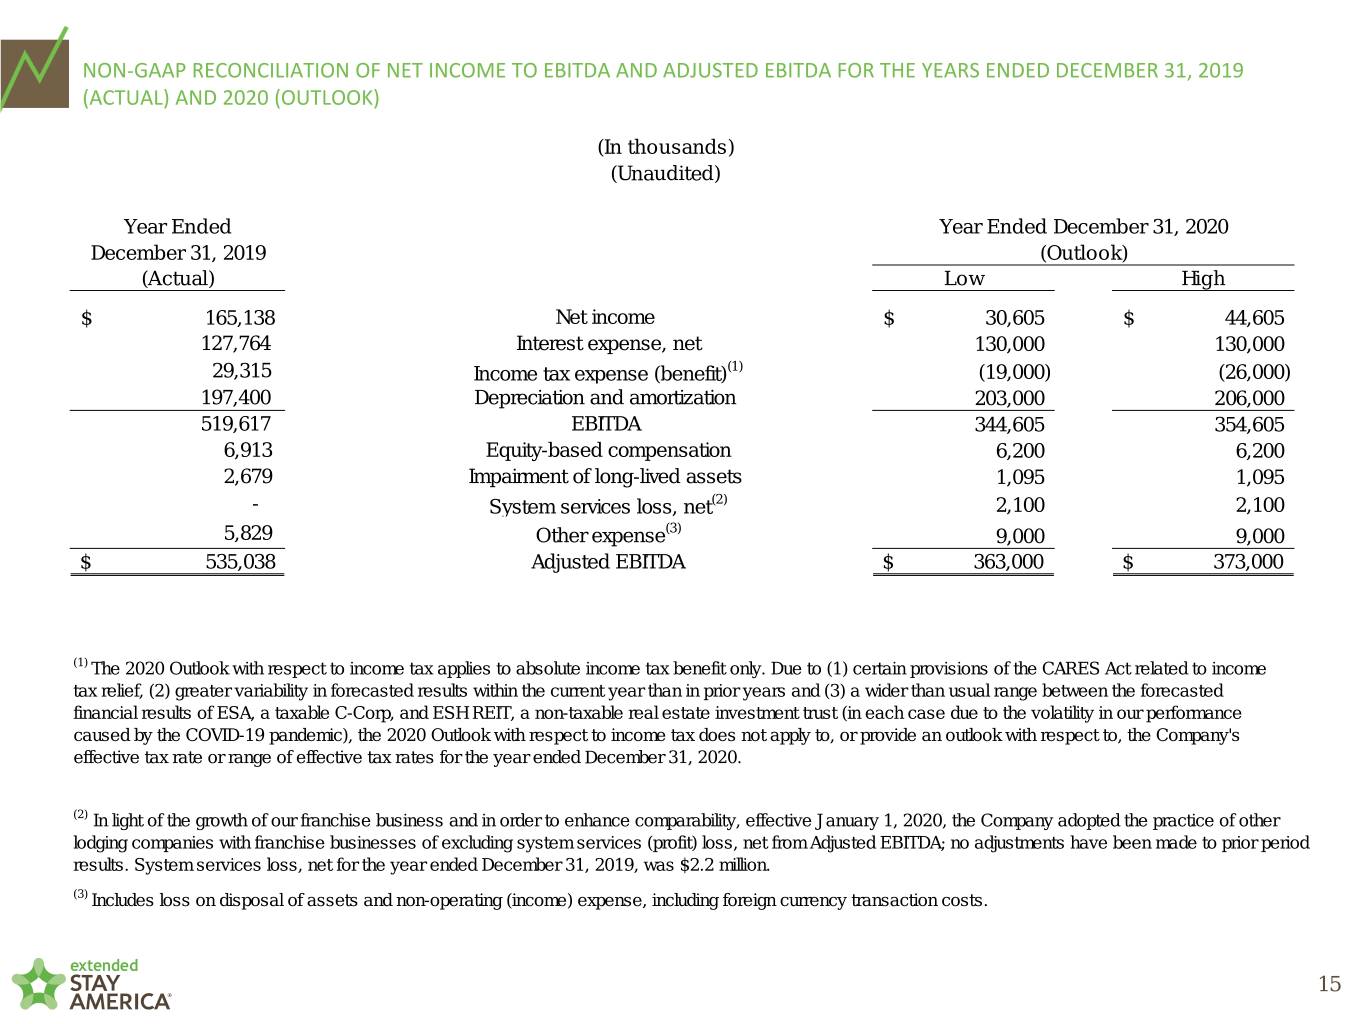
NON-GAAP RECONCILIATION OF NET INCOME TO EBITDA AND ADJUSTED EBITDA FOR THE YEARS ENDED DECEMBER 31, 2019 (ACTUAL) AND 2020 (OUTLOOK) (In thousands) (Unaudited) Year Ended Year Ended December 31, 2020 December 31, 2019 (Outlook) (Actual) Low High $ 165,138 Net income $ 30,605 $ 44,605 127,764 Interest expense, net 130,000 130,000 29,315 Income tax expense (benefit)(1) (19,000) (26,000) 197,400 Depreciation and amortization 203,000 206,000 519,617 EBITDA 344,605 354,605 6,913 Equity-based compensation 6,200 6,200 2,679 Impairment of long-lived assets 1,095 1,095 - System services loss, net(2) 2,100 2,100 5,829 Other expense(3) 9,000 9,000 $ 535,038 Adjusted EBITDA $ 363,000 $ 373,000 (1) The 2020 Outlook with respect to income tax applies to absolute income tax benefit only. Due to (1) certain provisions of the CARES Act related to income tax relief, (2) greater variability in forecasted results within the current year than in prior years and (3) a wider than usual range between the forecasted financial results of ESA, a taxable C-Corp, and ESH REIT, a non-taxable real estate investment trust (in each case due to the volatility in our performance caused by the COVID-19 pandemic), the 2020 Outlook with respect to income tax does not apply to, or provide an outlook with respect to, the Company's effective tax rate or range of effective tax rates for the year ended December 31, 2020. (2) In light of the growth of our franchise business and in order to enhance comparability, effective January 1, 2020, the Company adopted the practice of other lodging companies with franchise businesses of excluding system services (profit) loss, net from Adjusted EBITDA; no adjustments have been made to prior period results. System services loss, net for the year ended December 31, 2019, was $2.2 million. (3) Includes loss on disposal of assets and non-operating (income) expense, including foreign currency transaction costs. 15
