Attached files
| file | filename |
|---|---|
| EX-99.1 - EX-99.1 - Commercial Vehicle Group, Inc. | cvgq32020earningsrelea.htm |
| 8-K - 8-K - Commercial Vehicle Group, Inc. | cvgi-20201109.htm |

Exhibit 99.2

Q3 2020 EARNINGS CALL NOVEMBER 9, 2020

Forward-Looking Statements and Non-GAAP Financial Measures These slides and our remarks during investor presentations about CVG’s future expectations, plans and prospects are forward - looking statements within the meaning of the federal securities laws. Forward-looking statements involve risks, uncertainties and other factors, including those discussed in our earnings press release dated November 9, 2020 and in our filings with the SEC, which could cause our actual results to differ materially from the results expressed or implied by our statements. Any forward -looking statements which we make in this presentation or in our remarks, represent our views only as of the date of such remarks. We disclaim any duty to update such forward-looking statements. All forward-looking statements attributable to the company or persons acting on behalf of the company are expressly qualified in their entirety by cautionary statements in our filings with the SEC. These slides also include and we plan to discuss supplementary non-GAAP financial measures. For a reconciliation of GAAP to non- GAAP measures and the reasons for management’s use of non-GAAP measures, please see supplemental information. 2

Q3 2020 WAS A GOOD QUARTER • Down 17% vs. prior year • Up 48% vs. prior quarter • Commercial vehicle markets recovered sequentially, but below 2019 • Warehouse automation market continues to be a bright spot • Down $0.4 million vs. prior year • Adjusted margins increased to 6.4% from 5.5% vs. prior year • Adjusted operating income increased sequentially by $15.6 million • Adjusted EBITDA increased slightly to $16.4 million vs. $16.3 million, on $38 million less sales • Free Cash Flow generation of $9 million in Q3 • Paid down an additional $20 million of debt • Funded $6 million CapEx Q3 year to date with outlook of $8 to $10 million 3

Q3 2020 SALES MIX IS TURNING THE CORNER Strategic focus areas: • Warehouse automation systems • Delivery vans and Class 5-7 trucks • Electric vehicles • Alternate markets for plastic parts and wire harness CVG’s approximate percentage of sales from Medium-duty and Heavy- duty trucks 2009-2019 2020 10 year average Q3 YTD 4

Q3 2020 TRUCK MARKETS IMPROVED SUBSTANTIALLY e-Commerce Growth and GDP Outlook Driving Favorable Truck Outlook; EV Substitution will Occur in Future Periods *Source: October 2020 ACT Research Report 5

Q3 2020 STRATEGICALLY ADDED OUTPUT CAPACITY TO WAREHOUSE AUTOMATION BUSINESS • Expanded capacity at 4 plants PLANTS • Evaluating next steps for additional capacity • Added dedicated resources in business leadership, procurement PEOPLE • Staffed up hourly production personnel ~ 100 people • Added brand new products in portfolio PRODUCTS • Evaluating further product line additions * *Source: RoboticsBusinessReview.com 6

Q3 2020 FOCUS ON SECURING PLATFORM POSITIONS ON ELECTRIC VEHICLES . • Secured 2 marquee Electric Vehicle contingent awards in 2020 with >$200 million of business potential, with future start dates • Secured 3 smaller Electric Vehicle contingent awards in 2020 with future start dates • Pending business opportunities with multiple other Electric Vehicle companies • Securing positions across the vehicle size spectrum – delivery vans, long-haul trucks, and special purpose vehicles 7

Q3 2020 KEY TAKEAWAYS MARKETS PERFORMED WELL COST REDUCTIONS WERE -- OLD AND NEW -- AGGRESSIVE AND WORKED • Truck markets recovered • Salaried/benefit/discretionary expenses • Warehouse automation stayed strong suppressed, restoring some costs in Q4/Q1 • Permanent reductions still underway GROWTH ACTIONS COVID STILL A CONCERN WORKING WELL • Focused on growth markets, less cyclicality • Cases are increasing rapidly in some • Adding people, capacity, products, countries customers • Supply chains in the industries we serve • Added another marquee Electric Vehicle are having issues customer MILLION ~$20 ~$80 MILLION 8

Q3 2020 FINANCIAL UPDATE 9

Q3 2020 CVG CONSOLIDATED FINANCIALS $ MILLIONS, EXCEPT PER SHARE DATA Q3 2020 Q2 2020 Q3 2019 Q3 2020 NOTES Revenue 187.7 126.9 225.4 Gross Profit 24.2 6.5 29.4 • The P&L benefited in Q3 from Gross Margin 12.9% 5.1% 13.1% revenue rebound, year over year impact of FSE acquisition, SGA 14.4 16.0 17.5 and cost actions Amortization 0.9 0.9 0.4 • Revenues increased 47.9% vs. Impairment - 0.2 - Q2 Operating (Loss)/Income 8.9 (10.5) 11.5 • Adjusted OI and Adjusted EBITDA increased as a percent Operating Margin 4.7% (8.3)% 5.1% of revenue compared to prior Diluted Earnings Per Share $0.13 ($0.40) $0.23 year Adjusted Operating (Loss)/Income* $12.0 (3.6) 12.4 Adjusted Operating Margin* 6.4% (2.8)% 5.5% Adjusted EBITDA* $16.4 1.2 16.3 Adjusted EBITDA Margin* 8.8% 1.0% 7.3% *See reconciliation to non-GAAP financial measures in the appendix 10

Q3 2020 ELECTRICAL SYSTEMS SEGMENT RESULTS $ MILLIONS Q3 2020 Q2 2020 Q3 2019 Q3 2020 NOTES Revenue 121.1 74.2 131.4 Gross Profit 16.1 1.1 17.1 • Revenue increased 63.2% vs. Q2 due to increased truck Gross Margin 13.3% 1.5% 13.0% build and year over year SGA 3.2 6.6 4.0 impact of FSE acquisition Amortization 0.7 0.7 0.3 • Gross margin and Adjusted OI increased as a percent of Operating (Loss)/Income 12.2 (6.2) 12.8 revenue vs. prior year Operating Margin 10.1% (8.3)% 9.7% • Warehouse automation sub- Adjusted Operating (Loss)/Income* 13.4 (0.7) 12.8 systems contributed $26 million of incremental revenue Adjusted Operating Margin* 11.1% (1.0)% 9.7% in Q3 *See reconciliation to non-GAAP financial measures in the appendix 11

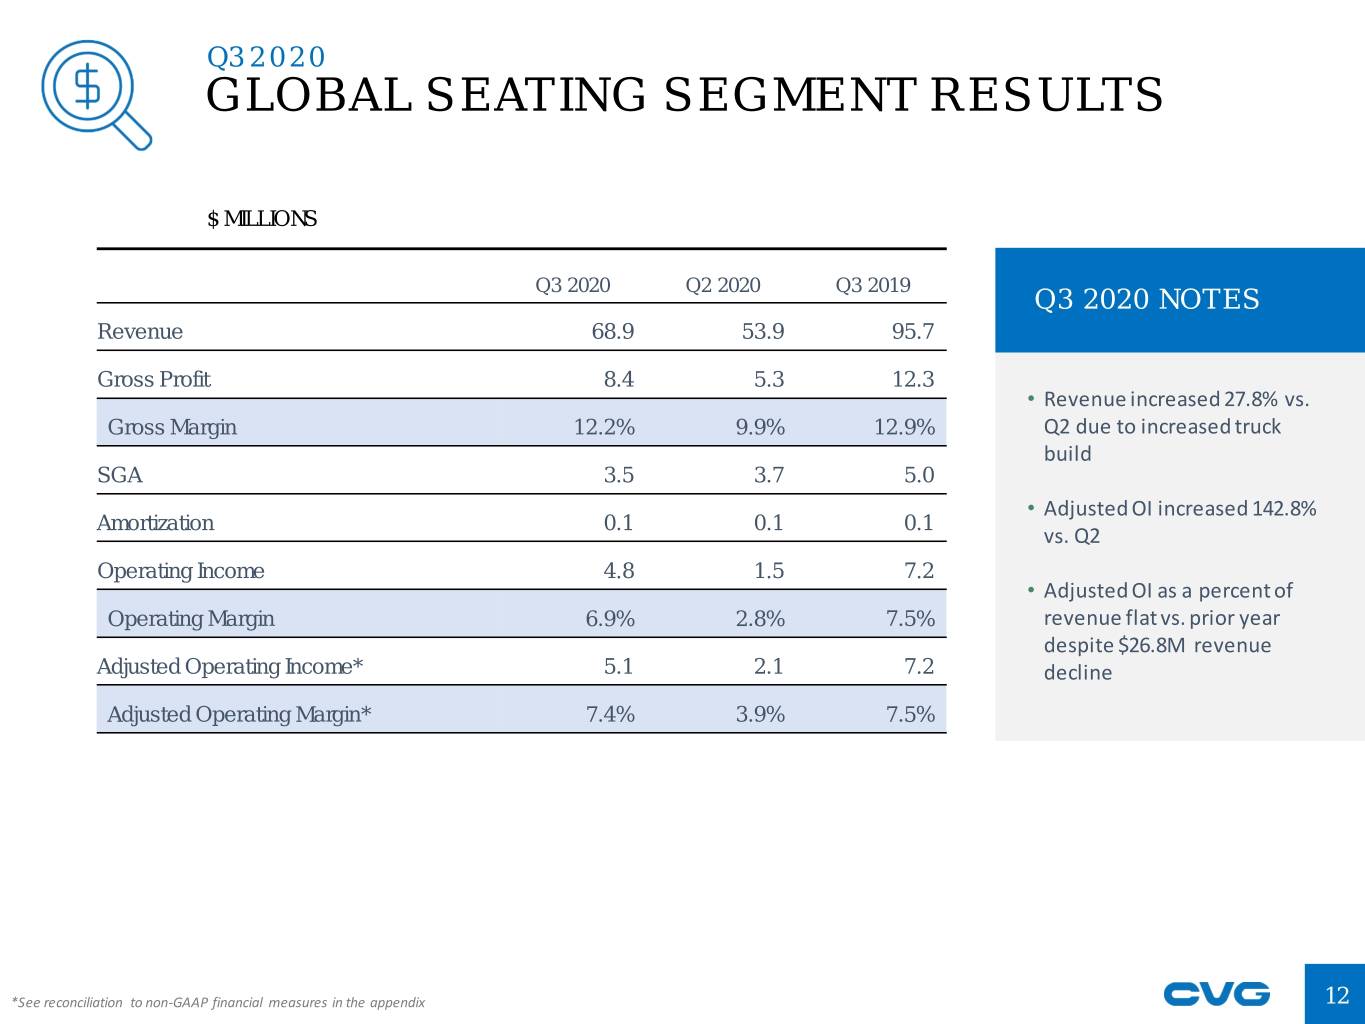
Q3 2020 GLOBAL SEATING SEGMENT RESULTS $ MILLIONS Q3 2020 Q2 2020 Q3 2019 Q3 2020 NOTES Revenue 68.9 53.9 95.7 Gross Profit 8.4 5.3 12.3 • Revenue increased 27.8% vs. Gross Margin 12.2% 9.9% 12.9% Q2 due to increased truck build SGA 3.5 3.7 5.0 • Adjusted OI increased 142.8% Amortization 0.1 0.1 0.1 vs. Q2 Operating Income 4.8 1.5 7.2 • Adjusted OI as a percent of Operating Margin 6.9% 2.8% 7.5% revenue flat vs. prior year despite $26.8M revenue Adjusted Operating Income* 5.1 2.1 7.2 decline Adjusted Operating Margin* 7.4% 3.9% 7.5% *See reconciliation to non-GAAP financial measures in the appendix 12

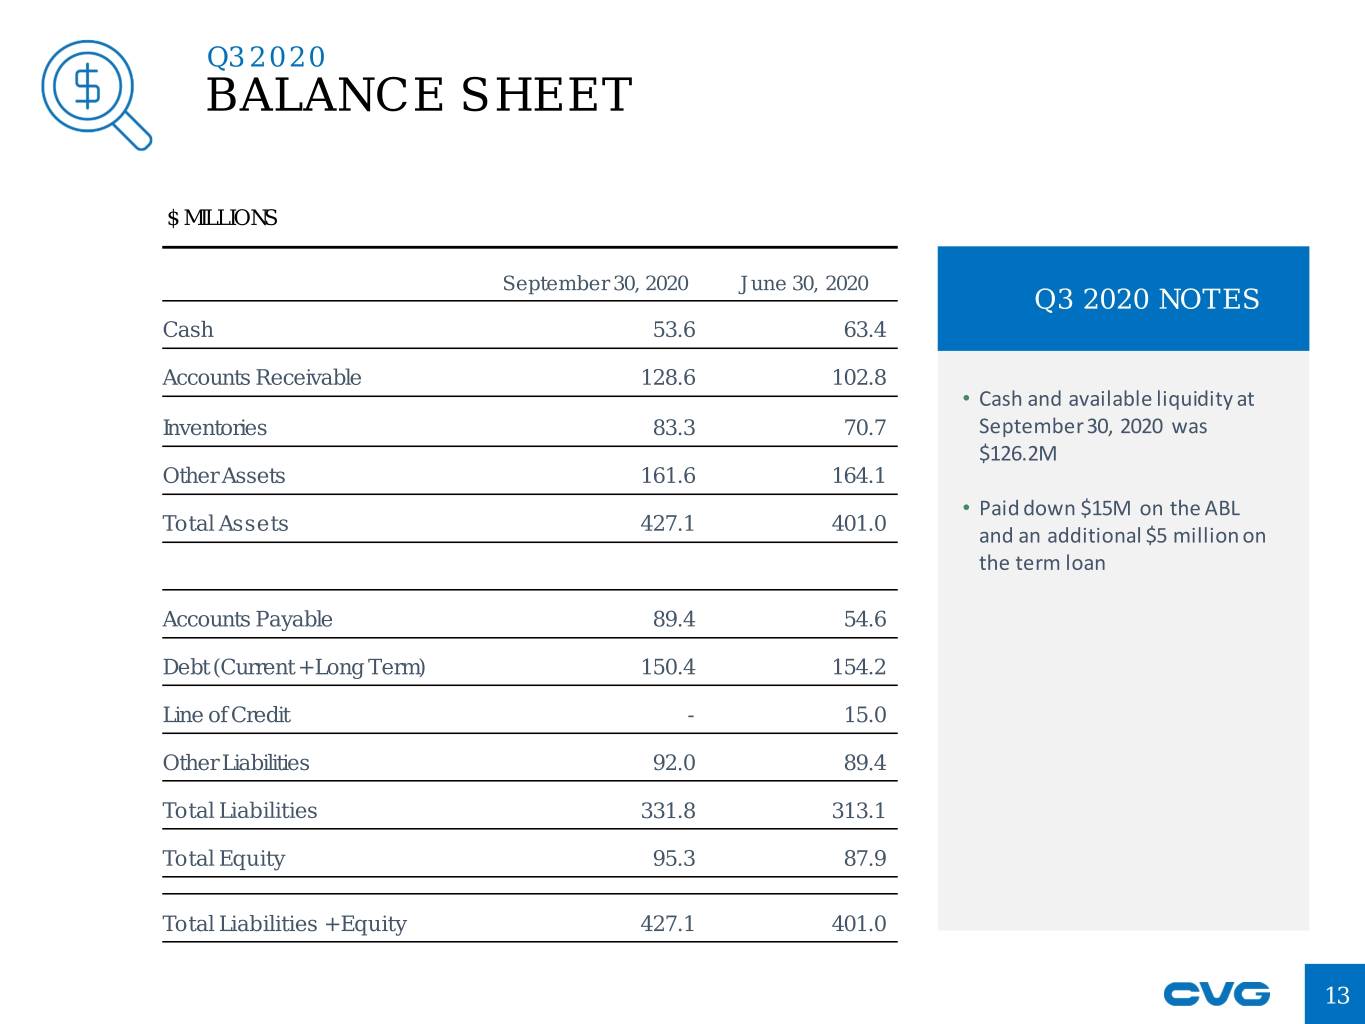
Q3 2020 BALANCE SHEET $ MILLIONS September 30, 2020 June 30, 2020 Q3 2020 NOTES Cash 53.6 63.4 Accounts Receivable 128.6 102.8 • Cash and available liquidity at Inventories 83.3 70.7 September 30, 2020 was $126.2M Other Assets 161.6 164.1 • Paid down $15M on the ABL Total Assets 427.1 401.0 and an additional $5 million on the term loan Accounts Payable 89.4 54.6 Debt (Current + Long Term) 150.4 154.2 Line of Credit - 15.0 Other Liabilities 92.0 89.4 Total Liabilities 331.8 313.1 Total Equity 95.3 87.9 Total Liabilities + Equity 427.1 401.0 13

SUPPLEMENTAL INFORMATION 14

Q3 2020 USE OF NON-GAAP FINANCIAL MEASURES This earnings presentation contains financial measures that are not calculated in accordance with U.S. generally accepted accounting principles (“GAAP”). In general, the non-GAAP measures exclude items that (i) management believes reflect the Company’s multi-year corporate activities; or (ii) relate to activities or actions that may have occurred over multiple or in prior periods without predictable trends. Management uses these non-GAAP financial measures internally to evaluate the Company’s performance, engage in financial and operational planning and to determine incentivecompensation. Management provides these non-GAAP financial measures to investors as supplemental metrics to assist readers in assessing the effects of items and events on the Company’s financial and operating results and in comparing the Company’s performance to that of its competitors and to comparable reporting periods. The non-GAAP financial measures used by the Company may be calculated differently from, and therefore may not be comparable to, similarly titled measures used by othercompanies. The non-GAAP financial measures disclosed by the Company should not be considered a substitute for, or superior to, financial measures calculated in accordance with GAAP. The financial results calculated in accordance with GAAP and reconciliations to those financial statements set forth in the supplemental information. 15

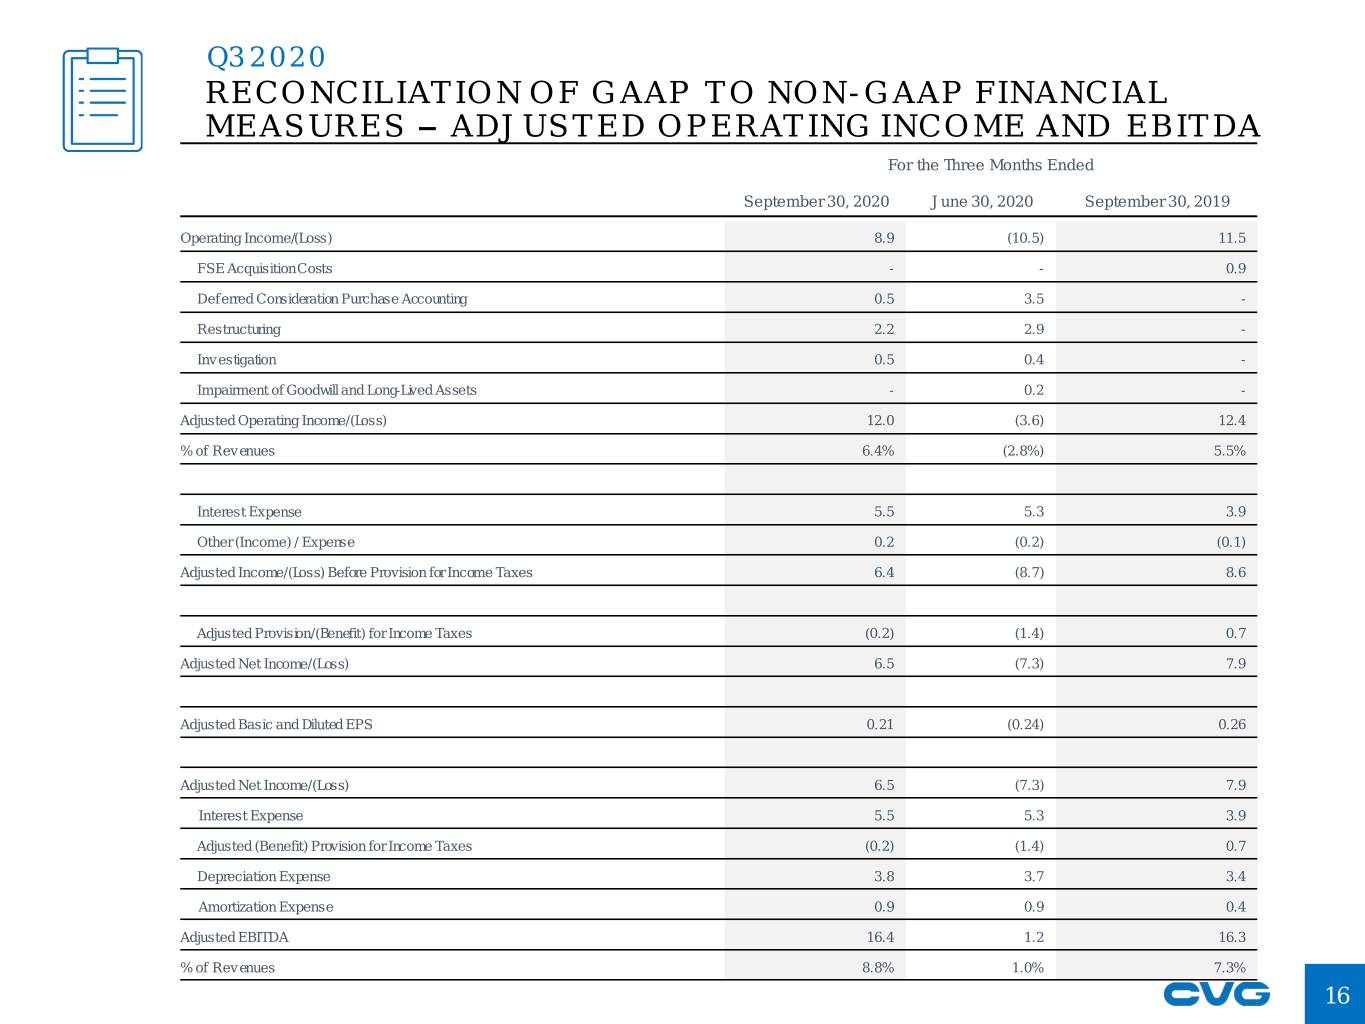
Q3 2020 RECONCILIATION OF GAAP TO NON - GAAP FINANCIAL M E AS URE S – ADJUSTED OPERATING INCOME AND EBITDA For the Three Months Ended September 30, 2020 June 30, 2020 September 30, 2019 Operating Income/(Loss) 8.9 (10.5) 11.5 FSE Acquisition Costs - - 0.9 Def erred Consideration Purchase Accounting 0.5 3.5 - Restructuring 2.2 2.9 - Inv estigation 0.5 0.4 - Impairment of Goodwill and Long-Lived Assets - 0.2 - Adjusted Operating Income/(Loss) 12.0 (3.6) 12.4 % of Rev enues 6.4% (2.8%) 5.5% Interest Expense 5.5 5.3 3.9 Other (Income) / Expense 0.2 (0.2) (0.1) Adjusted Income/(Loss) Before Provision for Income Taxes 6.4 (8.7) 8.6 Adjusted Provision/(Benefit) for Income Taxes (0.2) (1.4) 0.7 Adjusted Net Income/(Loss) 6.5 (7.3) 7.9 Adjusted Basic and Diluted EPS 0.21 (0.24) 0.26 Adjusted Net Income/(Loss) 6.5 (7.3) 7.9 Interest Expense 5.5 5.3 3.9 Adjusted (Benefit) Provision for Income Taxes (0.2) (1.4) 0.7 Depreciation Expense 3.8 3.7 3.4 Amortization Expense 0.9 0.9 0.4 Adjusted EBITDA 16.4 1.2 16.3 % of Rev enues 8.8% 1.0% 7.3% 16

Q3 2020 RECONCILIATION OF GAAP TO NON - GAAP FINANCIAL M E AS URE S – ADJUSTED EBITDA For the three months ended Trailing twelve months March 31, June 30, September December March 31, June 30, September September September 2019 2019 30, 2019 31, 2019 2020 2020 30, 2020 30, 2020 30, 2019 Net Income 10.0 6.1 7.2 (7.5) (24.6) (12.5) 4.2 (40.4) 31.4 Interest 4.6 4.8 3.9 3.6 4.6 5.3 5.5 19.0 18.4 Prov ision for Income Taxes 3.2 2.2 0.5 (0.1) (7.3) (3.1) (1.0) (11.5) 6.3 Depreciation 3.4 3.0 3.4 3.8 3.8 3.7 3.8 15.0 13.1 Amortization 0.3 0.3 0.4 0.9 0.9 0.9 0.9 3.4 1.4 Impairment - - - - 28.9 0.2 - 29.0 - EBITDA 21.4 16.5 15.4 0.6 6.2 (5.6) 13.3 14.5 70.5 Adjustments CEO Transition - - - - 2.3 - - 2.3 - Restructuring - - - 3.0 0.2 2.9 2.2 8.2 - Inv estigation - - - - 2.4 0.4 0.5 3.3 - FSE Acquisition Costs - - 0.9 - - - - - 0.9 Def erred Consideration 4.0 Purchase Accounting - - - - - 3.5 0.5 - Non-Cash Pension Charge - 2.5 - - - - - - - Adjusted EBITDA 21.4 19.0 16.3 3.6 11.0 1.2 16.4 32.3 71.4 17

Q3 2020 BUSINESS SEGMENT FINANCIAL INFORMATION For the three months ended September 30, 2020 Electrical Global Corporate Total Systems Seating Operating (Loss) Income 12.2 4.8 (8.1) 8.9 Restructuring 0.7 0.3 1.1 2.2 Deferred Consideration Purchase Accounting 0.5 - - 0.5 Investigation - - 0.5 0.5 Adjusted Operating Income 13.4 5.1 (6.5) 12.0 Adjusted Operating Margin 11.1% 7.4% 6.4% 18

Q3 2020 FREE CASH FLOW For 4 the quarters ended December March 31, June 30, September 31, 2019 2020 2020 30, 2020 Cash Flow from Operations 8.2 10.3 10.1 10.4 Capital Expenditures (5.2) (3.4) (1.0) (1.5) Free Cash Flow 3.0 6.9 9.1 8.9 19

Q3 2020 CONFERENCE CALL PLAYBACK INFO A telephonic replay of the conference will be available for a period of two weeks following the call. To access the replay, dial (800) 585-8367 using access code 2727789 Webcast / PowerPoint / replay available at ir.cvgrp.com 20
