Attached files
| file | filename |
|---|---|
| 8-K - 8-K - Summit Midstream Partners, LP | smlp-8k_20201106.htm |
EXHIBIT 99.1
|
|
Summit Midstream Partners, LP 910 Louisiana Street, Suite 4200 Houston, TX 77002
|

Summit Midstream Partners, LP Reports Third Quarter 2020
Financial and Operating Results
|
|
▪ |
Third quarter 2020 net income of $25.6 million, primarily attributable to a $24.7 million gain on early extinguishment of debt, adjusted EBITDA of $59.8 million and Distributable Cash Flow (“DCF”) of $37.6 million |
|
|
▪ |
Third quarter 2020 natural gas throughput for operated systems averaged 1,392 MMcf/d and liquids volume throughput averaged 69 Mbbl/d |
|
|
▪ |
Reiterating full-year 2020 adjusted EBITDA guidance range of $250 million to $260 million |
|
|
▪ |
Adjusting 2020 capital expenditure guidance to a new range of $55 million to $65 million, to reflect additional direct SMLP funding of Double E capital expenditures |
|
|
▪ |
Expect SMLP’s share of Double E project development capital expenditures to be approximately $300 million, 15% below the original development budget, of which approximately $175 million remains to be funded as of September 30, 2020 |
|
|
▪ |
Continued to pursue liability management activities which, through September 30, 2020, has resulted in the retirement of $210.9 million of senior notes at a weighted average discount of 39% and the elimination of $120.1 million of outstanding indebtedness, net of cash, relative to December 31, 2019 |
|
|
▪ |
Exchanged 62,816 Series A Preferred Units for approximately 12.3 million SMLP common units during 3Q 2020, reducing the face value of SMLP’s aggregate Series A Preferred Units by approximately $62.8 million at an implied discount of 84% based on SMLP’s common unit trading price at closing |
|
|
▪ |
Announced SMP Holdings Term Loan Restructuring and plan for full settlement of the DPPO; transaction has received consent from 100% of the SMP Holdings’ Term Loan lenders and is expected to close in 4Q 2020 |
|
|
▪ |
Subsequent to September 30, 2020, repurchased $95.6 million face value of 5.75% senior notes due 2025 at a weighted average discount of 32%, resulting in the elimination of $30.8 million of outstanding indebtedness |
Houston, Texas (November 6, 2020) – Summit Midstream Partners, LP (NYSE: SMLP) announced today its financial and operating results for the three months ended September 30, 2020, including net income of $25.6 million, adjusted EBITDA of $59.8 million and DCF of $37.6 million. Net income included a $24.7 million gain from early extinguishment of debt due to SMLP’s open market repurchases and public tender offers for its senior unsecured notes, at discounts to par value. Operated natural gas volume throughput averaged 1,392 million cubic feet per day (“MMcf/d”) and liquids volume throughput averaged 69.0 thousand barrels per day (“Mbbl/d”) for the third quarter of 2020. Operated natural gas volumes were relatively flat with the second quarter of 2020, which was impacted by an aggregate volume increase of 64 MMcf/d from the Marcellus Shale and DJ Basin segments relative to second quarter volumes, partially offset by a 15.4% decrease in Utica Shale segment volume, primarily due to a five-well pad site, representing more than 150 MMcf/d, that was temporarily shut-in due to low commodity prices from mid-June through mid-August. Quarterly liquids volume throughput decreased by 9.2% from the second quarter of 2020, primarily due to natural production declines, the shut-in of approximately 5 Mbbl/d of liquids throughput across our systems due to low commodity prices and the continued deferral of drilling and completion activities by certain customers in the Williston Basin segment.
Heath Deneke, President, Chief Executive Officer and Chairman, commented, “Summit generated $59.8 million of adjusted EBITDA during the third quarter, which was slightly above our expectations in August. Our results improved throughout the third quarter as customers continued to return previously shut-in production to service in large part due to strengthening of natural gas prices. Given that most of the temporary production shut-ins that impacted our
EX 99.1-1
financial results in the second and third quarters have been restored or are in the process of being restored, we continue to expect full-year 2020 adjusted EBITDA to be within our $250 million to $260 million guidance range.”
“We continue to make excellent progress advancing the Double E project while locking in substantial savings relative to the original development budget. Although the project did not receive FERC approval in the third quarter of 2020 as originally anticipated, we were pleased that FERC issued the 7(c) certificate authorizing the project in October. This approval represents a significant milestone for the project and enables us to advance plans to secure third-party financing to fund the vast majority, if not all, of our remaining Double E capital expenditures. We expect to have third-party financing in place concurrent with receipt of FERC’s notice to proceed with construction, which is expected to be obtained in the first quarter of 2021. Given the success we’ve had in locking in capital savings relative to budget, the total estimated cost to complete Double E is now expected to come in under $430 million, gross, which represents an approximate 15% reduction relative to the original capital budget. As a result, SMLP’s 70% share of development capital is now estimated to be approximately $300 million, of which, approximately $175 million remains to be spent as of September 30, 2020.”
“Due to the delay in receiving FERC approval on the Double E project and the associated impact to the timing of our third-party financing plans, SMLP now expects to directly fund an incremental $10 million to $20 million of Double E capital in 2020 beyond what was previously assumed in our capital guidance for the year. As a result, we are revising SMLP’s 2020 capital expenditure guidance to $55 million to $65 million.”
“We also continued to make significant progress on our liability management strategy in the third quarter of 2020, completing and announcing several transactions, consistent with our primary objectives to reduce leverage, simplify the balance sheet and create long-term value for stakeholders across our capital structure. Since closing of the GP Buy-In Transaction in May, including the October 2020 privately negotiated transaction to repurchase $95.6 million of our 2025 senior notes at a substantial discount to par value, we have repurchased a total of $306.5 million face value of our aggregate senior notes and reduced net indebtedness by more than $150 million relative to the end of 2019. Additionally, we exchanged 62,816 Series A Preferred Units for approximately 12.3 million SMLP common units during 3Q 2020, reducing the face value of SMLP’s aggregate Series A Preferred Units by approximately $62.8 million at an implied discount of 84% based on SMLP’s common unit trading price at closing. Furthermore, during the third quarter, we executed a transaction support agreement to retire the $155.2 million SMP Holdings Term Loan through a settlement with the Term Loan lenders. Upon closing of the TL Restructuring, we plan to make a $26.5 million cash payment to SMP Holdings, representing a full settlement of the $180.75 million DPPO, and will release the 34.6 million SMLP common units that were previously pledged as collateral to Term Loan lenders. In exchange, the lenders will forgive the full amount of the $155.2 million Term Loan and the GP interest will be released from the collateral package. The TL Restructuring has garnered the support and consent from 100% of the lenders and is expected to close in the fourth quarter of 2020. Together with the Series A Preferred Equity Exchange, the senior note repurchases and the full settlement of the DPPO, SMLP has eliminated approximately $550.1 million of its fixed capital obligations since closing the GP Buy-In Transaction. These liability management transactions have been highly accretive to SMLP’s equity valuation given the substantial discounts captured and I believe that SMLP is far better situated for long-term success as a result of these initiatives.”
EX 99.1-2
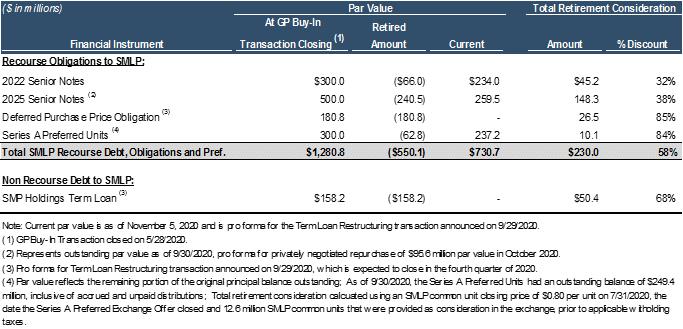
Summary of Selected Balance Sheet Items Impacted by SMLP’s Liability Management Initiatives in 2020
The table below summarizes the par value of key selected SMLP balance sheet line items that have been, or are expected to be impacted by SMLP’s liability management initiatives in 2020. Current par value is shown pro forma as of November 5, 2020 and includes expected impacts from the SMP Holdings Term Loan Restructuring transaction, which was announced in September 2020 and is expected to close in the fourth quarter of 2020.
Third Quarter 2020 Business Highlights
In the third quarter of 2020, SMLP’s average daily natural gas throughput for its operated systems increased 0.1% relative to the second quarter of 2020, to 1,392 MMcf/d, and liquids volumes decreased 9.2% relative to the second quarter of 2020, to 69 Mbbl/d. SMLP’s customers had approximately 21 DUCs in inventory and 18 wells that had been completed but not turned-in-line upstream of its systems as of September 30, 2020.
Core Focus Areas:
|
|
• |
Core Focus Areas generated combined quarterly segment adjusted EBITDA of $32.0 million and had combined capital expenditures of $6.3 million. |
|
|
• |
Utica Shale segment adjusted EBITDA totaled $7.5 million, a $3.2 million decrease from the second quarter of 2020, which was driven by a 15.4% decrease in volume throughput. Volume throughput was lower in the third quarter of 2020 due to the shut-in of a five-well pad site through mid-August that averaged more than 150 MMcf/d once back online, deferrals of new well connections and natural production declines. A total of 10 wells were connected in the Utica Shale segment during the quarter, of which seven wells were turned-in-line upstream of the TPL-7 Connector pipeline. We do not anticipate any new well connections for the remainder of the year, but we do expect additional activity in the first half of 2021 as a result of a previously announced gathering agreement amendment to incentivize accelerated drilling behind our SMU system. |
EX 99.1-3
|
|
approximately 6 DUCs in inventory and 8 wells that have been completed, but not yet turned to production behind our Williston Basin systems. |
Legacy Areas:
|
|
• |
Legacy Areas generated $34.7 million of combined segment adjusted EBITDA in the third quarter of 2020 and had combined capital expenditures of $1.3 million. |
|
|
• |
Piceance Basin segment adjusted EBITDA of $21.5 million decreased by $0.2 million from the second quarter of 2020 due to lower volume throughput of 1.6%, which was primarily driven by the impact of natural production declines. |
|
|
• |
Barnett Shale segment adjusted EBITDA decreased by $1.3 million from the second quarter of 2020 to $7.2 million, primarily due to decreased gas sales and margin mix due to recent contract amendments. Throughput volumes increased by 2.5% primarily due to workovers and recompletions of existing wells behind the DFW Midstream system. |
EX 99.1-4
The following table presents average daily throughput by reportable segment for the periods indicated:
|
|
|
Three months ended September 30, |
|
|
Nine months ended September 30, |
|
||||||||||
|
|
|
2020 |
|
|
2019 |
|
|
2020 |
|
|
2019 |
|
||||
|
Average daily throughput (MMcf/d): |
|
|
|
|
|
|
|
|
|
|
|
|
|
|
|
|
|
Utica Shale |
|
|
352 |
|
|
|
290 |
|
|
|
330 |
|
|
|
279 |
|
|
Williston Basin (1) |
|
|
14 |
|
|
|
9 |
|
|
|
14 |
|
|
|
12 |
|
|
DJ Basin |
|
|
27 |
|
|
|
33 |
|
|
|
26 |
|
|
|
25 |
|
|
Permian Basin |
|
|
34 |
|
|
|
20 |
|
|
|
33 |
|
|
|
17 |
|
|
Piceance Basin (2) |
|
|
361 |
|
|
|
446 |
|
|
|
370 |
|
|
|
464 |
|
|
Barnett Shale |
|
|
208 |
|
|
|
247 |
|
|
|
215 |
|
|
|
255 |
|
|
Marcellus Shale |
|
|
396 |
|
|
|
349 |
|
|
|
366 |
|
|
|
358 |
|
|
Aggregate average daily throughput |
|
|
1,392 |
|
|
|
1,394 |
|
|
|
1,354 |
|
|
|
1,410 |
|
|
|
|
|
|
|
|
|
|
|
|
|
|
|
|
|
|
|
|
Average daily throughput (Mbbl/d): |
|
|
|
|
|
|
|
|
|
|
|
|
|
|
|
|
|
Williston Basin |
|
|
69 |
|
|
|
105 |
|
|
|
81 |
|
|
|
101 |
|
|
Aggregate average daily throughput |
|
|
69 |
|
|
|
105 |
|
|
|
81 |
|
|
|
101 |
|
|
|
|
|
|
|
|
|
|
|
|
|
|
|
|
|
|
|
|
Ohio Gathering average daily throughput (MMcf/d) (3) |
|
|
512 |
|
|
|
777 |
|
|
|
554 |
|
|
|
734 |
|
__________
|
|
(1) |
The Williston Basin segment includes the Tioga Midstream system, which was sold in March 2019. |
|
|
(2) |
The Piceance Basin segment includes the RRG West system, which was sold in December 2019. |
|
|
(3) |
Gross basis, represents 100% of volume throughput for Ohio Gathering, subject to a one-month lag. |
The following table presents adjusted EBITDA by reportable segment for the periods indicated:
|
|
|
Three months ended September 30, |
|
|
Nine months ended September 30, |
|
||||||||||
|
|
|
2020 |
|
|
2019 |
|
|
2020 |
|
|
2019 |
|
||||
|
|
|
(In thousands) |
|
|||||||||||||
|
Reportable segment adjusted EBITDA (1): |
|
|
|
|
|
|
|
|
|
|
|
|
|
|
|
|
|
Utica Shale |
|
$ |
7,453 |
|
|
$ |
7,864 |
|
|
$ |
24,074 |
|
|
$ |
20,697 |
|
|
Ohio Gathering (2) |
|
|
7,129 |
|
|
|
10,435 |
|
|
|
22,582 |
|
|
|
29,584 |
|
|
Williston Basin (3) |
|
|
11,713 |
|
|
|
13,840 |
|
|
|
40,632 |
|
|
|
49,224 |
|
|
DJ Basin |
|
|
4,766 |
|
|
|
6,554 |
|
|
|
15,016 |
|
|
|
12,043 |
|
|
Permian Basin |
|
|
893 |
|
|
|
210 |
|
|
|
4,302 |
|
|
|
(996 |
) |
|
Piceance Basin (4) |
|
|
21,503 |
|
|
|
24,044 |
|
|
|
66,794 |
|
|
|
74,627 |
|
|
Barnett Shale |
|
|
7,205 |
|
|
|
10,901 |
|
|
|
24,475 |
|
|
|
33,483 |
|
|
Marcellus Shale |
|
|
6,022 |
|
|
|
4,958 |
|
|
|
16,230 |
|
|
|
14,735 |
|
|
Total |
|
$ |
66,684 |
|
|
$ |
78,806 |
|
|
$ |
214,105 |
|
|
$ |
233,397 |
|
|
Less: Corporate and Other (5) |
|
|
6,854 |
|
|
|
6,859 |
|
|
|
23,781 |
|
|
|
27,032 |
|
|
Adjusted EBITDA |
|
$ |
59,830 |
|
|
$ |
71,947 |
|
|
$ |
190,324 |
|
|
$ |
206,365 |
|
__________
|
(1) |
We define segment adjusted EBITDA as total revenues less total costs and expenses, plus (i) other income excluding interest income, (ii) our proportional adjusted EBITDA for equity method investees, (iii) depreciation and amortization, (iv) adjustments related to MVC shortfall payments, (v) adjustments related to capital reimbursement activity, (vi) unit-based and noncash compensation, (vii) impairments and (viii) other noncash expenses or losses, less other noncash income or gains. |
|
(2) |
Represents our proportional share of adjusted EBITDA for Ohio Gathering, subject to a one-month lag. We define proportional adjusted EBITDA for our equity method investees as the product of (i) total revenues less total expenses, excluding impairments and other noncash income or expense items and (ii) amortization for deferred contract costs; multiplied by our ownership interest in Ohio Gathering during the respective period. |
|
(3) |
The Williston Basin segment includes the Tioga Midstream system, which was sold in March 2019. |
|
(4) |
The Piceance Basin segment includes the RRG West system, which was sold in December 2019. |
|
(5) |
Corporate and Other represents those results that are not specifically attributable to a reportable segment (such as Double E) or that have not been allocated to our reportable segments, including certain general and administrative expense items and natural gas and crude oil marketing services. |
EX 99.1-5
Capital expenditures totaled $7.9 million in the third quarter of 2020, a decrease of 10.8% compared to the second quarter of 2020, which included maintenance capital expenditures of $3.5 million. Capital expenditures in the third quarter of 2020 were primarily related to growth projects in our DJ Basin segment.
|
|
|
Nine months ended September 30, |
|
|||||
|
|
|
2020 |
|
|
2019 |
|
||
|
|
|
(In thousands) |
|
|||||
|
Cash paid for capital expenditures (1): |
|
|
|
|
|
|
|
|
|
Utica Shale |
|
$ |
2,461 |
|
|
$ |
2,473 |
|
|
Williston Basin |
|
|
8,435 |
|
|
|
20,288 |
|
|
DJ Basin |
|
|
11,349 |
|
|
|
66,775 |
|
|
Permian Basin |
|
|
6,342 |
|
|
|
43,422 |
|
|
Piceance Basin |
|
|
971 |
|
|
|
1,919 |
|
|
Barnett Shale (2) |
|
|
1,627 |
|
|
|
317 |
|
|
Marcellus Shale |
|
|
430 |
|
|
|
347 |
|
|
Total reportable segment capital expenditures |
|
|
31,615 |
|
|
|
135,541 |
|
|
Corporate and Other (3) |
|
|
3,697 |
|
|
|
16,122 |
|
|
Total cash paid for capital expenditures |
|
$ |
35,312 |
|
|
$ |
151,663 |
|
__________
|
(1) |
Excludes cash paid for capital expenditures by Ohio Gathering and Double E (after June 2019) due to equity method accounting. |
|
(2) |
For the nine months ended September 30, 2019, the amount includes sales tax reimbursements of $1.1 million. |
|
(3) |
For the nine months ended September 30, 2019, and through the formation date of the Double E joint venture in June 2019, reflects 100% of the capital expenditures associated with Double E and excludes capital contributions made by our JV partner. |
Capital & Liquidity
As of September 30, 2020, SMLP had $437.4 million of undrawn commitments under its $1.25 billion revolving credit facility, after accounting for a $4.1 million issued but undrawn letter of credit. Subject to covenant limits, our available borrowing capacity at September 30, 2020 totaled approximately $172 million.
Based upon the terms of SMLP’s revolving credit facility and total outstanding debt, net of cash, of $1.35 billion (inclusive of $589.1 million of senior unsecured notes), SMLP’s total leverage ratio and senior secured leverage ratio (as defined in the credit agreement) as of September 30, 2020, were 4.87 to 1.0 and 2.74 to 1.0, respectively, relative to maximum threshold limits of 5.50 to 1.0 and 3.75 to 1.0.
Double E Update
During the third quarter of 2020, SMLP made cash investments totaling $11.2 million with respect to its 70% equity investment in Double E. The estimated cost to complete the Double E Pipeline Project has decreased by approximately 15% relative to original development budget, and as such, SMLP’s 70% share of capital costs is now approximately $300 million, of which approximately $125 million has been funded as of September 30, 2020. As previously reported, on October 15, 2020, Double E received Federal Energy Regulatory Commission (“FERC”) approval of its application to construct and operate the Double E Pipeline Project pursuant to Section 7(c) of the Natural Gas Act. SMLP is in the process of finalizing third-party financing for its remaining Double E capital obligations and expects to secure this financing concurrently with FERC’s notice to proceed with construction, which is anticipated in the first quarter of 2021. SMLP plans to directly fund its Double E capital obligations until third-party financing can be obtained. The estimated in-service date for Double E has been extended to the fourth quarter of 2021.
MVC Shortfall Payments
SMLP billed its customers $12.9 million in the third quarter of 2020 related to MVC shortfalls. For those customers that do not have MVC shortfall credit banking mechanisms in their gathering agreements, the MVC shortfall payments are accounted for as gathering revenue in the period in which they are earned. In the third quarter of 2020, SMLP recognized $12.9 million of gathering revenue associated with MVC shortfall payments. SMLP also recognized $2.3 million of adjustments to MVC shortfall payments in the third quarter of 2020 related to shortfall payment adjustments from customers in the Williston Basin segment and the Piceance Basin segment. SMLP’s MVC shortfall payment mechanisms contributed $15.2 million of total adjusted EBITDA in the third quarter of 2020.
EX 99.1-6
|
|
Three months ended September 30, 2020 |
|
||||||||||||||
|
|
MVC Billings |
|
|
|
Gathering revenue |
|
|
Adjustments to MVC shortfall payments |
|
|
Net impact to adjusted EBITDA |
|
||||
|
|
(In thousands) |
|
||||||||||||||
|
Net change in deferred revenue related to MVC shortfall payments: |
|
|
|
|
|
|
|
|
|
|
|
|
|
|
|
|
|
Piceance Basin |
$ |
3,454 |
|
|
|
$ |
3,454 |
|
|
$ |
— |
|
|
$ |
3,454 |
|
|
Total net change |
$ |
3,454 |
|
|
|
$ |
3,454 |
|
|
$ |
— |
|
|
$ |
3,454 |
|
|
|
|
|
|
|
|
|
|
|
|
|
|
|
|
|
|
|
|
MVC shortfall payment adjustments: |
|
|
|
|
|
|
|
|
|
|
|
|
|
|
|
|
|
Williston Basin |
$ |
954 |
|
|
|
$ |
954 |
|
|
$ |
2,125 |
|
|
$ |
3,079 |
|
|
Piceance Basin |
|
7,155 |
|
|
|
|
7,155 |
|
|
|
167 |
|
|
|
7,322 |
|
|
Marcellus Shale |
|
1,354 |
|
|
|
|
1,354 |
|
|
|
— |
|
|
|
1,354 |
|
|
Total MVC shortfall payment adjustments |
$ |
9,463 |
|
|
|
$ |
9,463 |
|
|
$ |
2,292 |
|
|
$ |
11,754 |
|
|
|
|
|
|
|
|
|
|
|
|
|
|
|
|
|
|
|
|
Total (1) |
$ |
12,917 |
|
|
|
$ |
12,917 |
|
|
$ |
2,292 |
|
|
$ |
15,209 |
|
__________
(1) Exclusive of Ohio Gathering due to equity method accounting.
|
|
Nine months ended September 30, 2020 |
|
||||||||||||||
|
|
MVC Billings |
|
|
|
Gathering revenue |
|
|
Adjustments to MVC shortfall payments |
|
|
Net impact to adjusted EBITDA |
|
||||
|
|
(In thousands) |
|
||||||||||||||
|
Net change in deferred revenue related to MVC shortfall payments: |
|
|
|
|
|
|
|
|
|
|
|
|
|
|
|
|
|
Piceance Basin |
$ |
10,531 |
|
|
|
$ |
10,531 |
|
|
$ |
— |
|
|
$ |
10,531 |
|
|
Total net change |
$ |
10,531 |
|
|
|
$ |
10,531 |
|
|
$ |
— |
|
|
$ |
10,531 |
|
|
|
|
|
|
|
|
|
|
|
|
|
|
|
|
|
|
|
|
MVC shortfall payment adjustments: |
|
|
|
|
|
|
|
|
|
|
|
|
|
|
|
|
|
Williston Basin |
$ |
3,047 |
|
|
|
$ |
10,837 |
|
|
$ |
(1,416 |
) |
|
$ |
9,421 |
|
|
Piceance Basin |
|
21,046 |
|
|
|
|
20,941 |
|
|
|
557 |
|
|
|
21,498 |
|
|
Marcellus Shale |
|
3,898 |
|
|
|
|
3,898 |
|
|
|
— |
|
|
|
3,898 |
|
|
Total MVC shortfall payment adjustments |
$ |
27,991 |
|
|
|
$ |
35,676 |
|
|
$ |
(859 |
) |
|
$ |
34,816 |
|
|
|
|
|
|
|
|
|
|
|
|
|
|
|
|
|
|
|
|
Total (1) |
$ |
38,522 |
|
|
|
$ |
46,207 |
|
|
$ |
(859 |
) |
|
$ |
45,348 |
|
__________
(1) Exclusive of Ohio Gathering due to equity method accounting.
Quarterly Distribution Update
The board of directors of SMLP’s general partner continues to suspend cash distributions payable on its common units and on its 9.50% Series A fixed-to-floating rate cumulative redeemable perpetual preferred units for the period ended September 30, 2020. Unpaid distributions on the preferred units will continue to accrue.
Previously Announced Reverse Unit Split
On October 30, 2020, SMLP announced a 1-for-15 reverse unit split on its common units. Pursuant to the reverse unit split, common unitholders will receive one common unit for every 15 common units owned at the close of business on November 9, 2020. The split will take effect after markets close on Monday, November 9, 2020, and the common units will trade on a split-adjusted basis beginning on Tuesday, November 10, 2020.
Third Quarter 2020 Earnings Call Information
SMLP will host a conference call at 10:00 a.m. Eastern on Friday, November 6, 2020, to discuss its quarterly operating and financial results. Interested parties may participate in the call by dialing 847-585-4405 or toll-free 888-771-4371 and entering the passcode 49988072. The conference call, live webcast and archive of the call can be accessed through the Investors section of SMLP's website at www.summitmidstream.com.
EX 99.1-7
Members of SMLP’s senior management team will attend the RBC Capital Markets Midstream and Energy Infrastructure Conference which will take place on November 18-19, 2020 and the 2020 Wells Fargo Midstream and Utility Symposium which will take place on December 8-9. Presentation materials associated with these events will be accessible through the Investors section of SMLP’s website at www.summitmidstream.com prior to the beginning of each respective conference.
Use of Non-GAAP Financial Measures
We report financial results in accordance with U.S. generally accepted accounting principles (“GAAP”). We also present adjusted EBITDA and distributable cash flow, each a non-GAAP financial measure. We define adjusted EBITDA as net income or loss, plus interest expense, income tax expense, depreciation and amortization, our proportional adjusted EBITDA for equity method investees, adjustments related to MVC shortfall payments, adjustments related to capital reimbursement activity, unit-based and noncash compensation, impairments, items of income or loss that we characterize as unrepresentative of our ongoing operations and other noncash expenses or losses, less interest income, income tax benefit, income (loss) from equity method investees and other noncash income or gains. We define distributable cash flow as adjusted EBITDA plus cash interest received and cash taxes received, less cash interest paid, senior notes interest adjustment, adjusted Series A Preferred Units cash distribution, cash taxes paid and maintenance capital expenditures. Because adjusted EBITDA and distributable cash flow may be defined differently by other entities in our industry, our definitions of these non-GAAP financial measures may not be comparable to similarly titled measures of other entities, thereby diminishing their utility.
Management uses these non-GAAP financial measures in making financial, operating and planning decisions and in evaluating our financial performance. Furthermore, management believes that these non-GAAP financial measures may provide external users of our financial statements, such as investors, commercial banks, research analysts and others, with additional meaningful comparisons between current results and results of prior periods as they are expected to be reflective of our core ongoing business.
Adjusted EBITDA and distributable cash flow are used as supplemental financial measures by external users of our financial statements such as investors, commercial banks, research analysts and others.
Adjusted EBITDA is used to assess:
|
• |
the ability of our assets to generate cash sufficient to make future potential cash distributions and support our indebtedness; |
|
• |
the financial performance of our assets without regard to financing methods, capital structure or historical cost basis; |
|
• |
our operating performance and return on capital as compared to those of other entities in the midstream energy sector, without regard to financing or capital structure; |
|
• |
the attractiveness of capital projects and acquisitions and the overall rates of return on alternative investment opportunities; and |
|
• |
the financial performance of our assets without regard to (i) income or loss from equity method investees, (ii) the impact of the timing of minimum volume commitments shortfall payments under our gathering agreements or (iii) the timing of impairments or other income or expense items that we characterize as unrepresentative of our ongoing operations. |
Distributable cash flow is used to assess:
|
• |
the ability of our assets to generate cash sufficient to support future potential cash distributions and |
|
• |
the attractiveness of capital projects and acquisitions and the overall rates of return on alternative investment opportunities. |
Both of these measures have limitations as analytical tools and investors should not consider them in isolation or as a substitute for analysis of our results as reported under GAAP. For example:
|
• |
certain items excluded from adjusted EBITDA and distributable cash flow are significant components in understanding and assessing an entity's financial performance, such as an entity's cost of capital and tax structure; |
|
• |
adjusted EBITDA and distributable cash flow do not reflect our cash expenditures or future requirements for capital expenditures or contractual commitments; |
EX 99.1-8
|
• |
adjusted EBITDA and distributable cash flow do not reflect changes in, or cash requirements for, our working capital needs; and |
|
• |
although depreciation and amortization are noncash charges, the assets being depreciated and amortized will often have to be replaced in the future, and adjusted EBITDA and distributable cash flow do not reflect any cash requirements for such replacements. |
We compensate for the limitations of adjusted EBITDA and distributable cash flow as analytical tools by reviewing the comparable GAAP financial measures, understanding the differences between the financial measures and incorporating these data points into our decision-making process. Reconciliations of GAAP to non-GAAP financial measures are attached to this press release.
We do not provide the GAAP financial measures of net income or loss or net cash provided by operating activities on a forward-looking basis because we are unable to predict, without unreasonable effort, certain components thereof including, but not limited to, (i) income or loss from equity method investees and (ii) asset impairments. These items are inherently uncertain and depend on various factors, many of which are beyond our control. As such, any associated estimate and its impact on our GAAP performance and cash flow measures could vary materially based on a variety of acceptable management assumptions.
About Summit Midstream Partners, LP
SMLP is a value-driven limited partnership focused on developing, owning and operating midstream energy infrastructure assets that are strategically located in the core producing areas of unconventional resource basins, primarily shale formations, in the continental United States. SMLP provides natural gas, crude oil and produced water gathering, processing and transportation services pursuant to primarily long-term, fee-based agreements with customers and counterparties in six unconventional resource basins: (i) the Appalachian Basin, which includes the Utica and Marcellus shale formations in Ohio and West Virginia; (ii) the Williston Basin, which includes the Bakken and Three Forks shale formations in North Dakota; (iii) the Denver-Julesburg Basin, which includes the Niobrara and Codell shale formations in Colorado and Wyoming; (iv) the Permian Basin, which includes the Bone Spring and Wolfcamp formations in New Mexico; (v) the Fort Worth Basin, which includes the Barnett Shale formation in Texas; and (vi) the Piceance Basin, which includes the Mesaverde formation as well as the Mancos and Niobrara shale formations in Colorado. SMLP has an equity investment in Double E Pipeline, LLC, which is developing natural gas transmission infrastructure that will provide transportation service from multiple receipt points in the Delaware Basin to various delivery points in and around the Waha Hub in Texas. SMLP also has an equity investment in Ohio Gathering, which operates extensive natural gas gathering and condensate stabilization infrastructure in the Utica Shale in Ohio. SMLP is headquartered in Houston, Texas.
Forward-Looking Statements
This press release includes certain statements concerning expectations for the future that are forward-looking within the meaning of the federal securities laws. Forward-looking statements contain known and unknown risks and uncertainties (many of which are difficult to predict and beyond management's control) that may cause SMLP's actual results in future periods to differ materially from anticipated or projected results. An extensive list of specific material risks and uncertainties affecting SMLP is contained in its 2019 Annual Report on Form 10-K filed with the Securities and Exchange Commission on March 9, 2020, and as amended and updated from time to time. Any forward-looking statements in this press release, including forward-looking statements regarding 2020 financial guidance or financial or operating expectations for 2020, are made as of the date of this press release and SMLP undertakes no obligation to update or revise any forward-looking statements to reflect new information or events.
EX 99.1-9
SUMMIT MIDSTREAM PARTNERS, LP AND SUBSIDIARIES
UNAUDITED CONDENSED CONSOLIDATED BALANCE SHEETS
|
|
|
September 30, |
|
|
December 31, |
|
||
|
|
|
2020 |
|
|
2019 |
|
||
|
|
|
(In thousands) |
|
|||||
|
ASSETS |
|
|
|
|
|
|
|
|
|
Cash and cash equivalents |
|
$ |
50,272 |
|
|
$ |
9,530 |
|
|
Restricted cash |
|
|
24 |
|
|
|
27,392 |
|
|
Accounts receivable |
|
|
76,497 |
|
|
|
97,418 |
|
|
Other current assets |
|
|
4,559 |
|
|
|
5,521 |
|
|
Total current assets |
|
|
131,352 |
|
|
|
139,861 |
|
|
Property, plant and equipment, net |
|
|
1,840,284 |
|
|
|
1,882,489 |
|
|
Intangible assets, net |
|
|
207,766 |
|
|
|
232,278 |
|
|
Investment in equity method investees |
|
|
389,088 |
|
|
|
309,728 |
|
|
Other noncurrent assets |
|
|
4,989 |
|
|
|
9,742 |
|
|
TOTAL ASSETS |
|
$ |
2,573,479 |
|
|
$ |
2,574,098 |
|
|
|
|
|
|
|
|
|
|
|
|
LIABILITIES AND CAPITAL |
|
|
|
|
|
|
|
|
|
Trade accounts payable |
|
$ |
16,205 |
|
|
$ |
24,415 |
|
|
Accrued expenses |
|
|
11,353 |
|
|
|
11,339 |
|
|
Deferred revenue |
|
|
17,827 |
|
|
|
13,493 |
|
|
Ad valorem taxes payable |
|
|
6,931 |
|
|
|
8,477 |
|
|
Accrued interest |
|
|
12,092 |
|
|
|
12,346 |
|
|
Accrued environmental remediation |
|
|
1,553 |
|
|
|
1,725 |
|
|
Other current liabilities |
|
|
10,747 |
|
|
|
12,206 |
|
|
Term loan (See TL Restructuring discussion in Note 8) |
|
|
155,200 |
|
|
|
5,546 |
|
|
Total current liabilities |
|
|
231,908 |
|
|
|
89,547 |
|
|
Long-term debt |
|
|
1,390,842 |
|
|
|
1,622,279 |
|
|
Noncurrent deferred revenue |
|
|
41,755 |
|
|
|
38,709 |
|
|
Noncurrent accrued environmental remediation |
|
|
2,003 |
|
|
|
2,926 |
|
|
Other noncurrent liabilities |
|
|
4,536 |
|
|
|
7,951 |
|
|
Total liabilities |
|
|
1,671,044 |
|
|
|
1,761,412 |
|
|
|
|
|
|
|
|
|
|
|
|
Mezzanine Capital |
|
|
|
|
|
|
|
|
|
Subsidiary Series A Preferred Units |
|
|
85,800 |
|
|
|
27,450 |
|
|
|
|
|
|
|
|
|
|
|
|
Partners' Capital |
|
|
|
|
|
|
|
|
|
Series A Preferred Units |
|
|
249,351 |
|
|
|
293,616 |
|
|
Common limited partner capital |
|
|
567,284 |
|
|
|
305,550 |
|
|
Noncontrolling interest |
|
|
— |
|
|
|
186,070 |
|
|
Total partners' capital |
|
|
816,635 |
|
|
|
785,236 |
|
|
TOTAL LIABILITIES AND CAPITAL |
|
$ |
2,573,479 |
|
|
$ |
2,574,098 |
|
EX 99.1-10
SUMMIT MIDSTREAM PARTNERS, LP AND SUBSIDIARIES
UNAUDITED CONDENSED CONSOLIDATED STATEMENTS OF OPERATIONS
|
|
|
Three months ended September 30, |
|
|
Nine months ended September 30, |
|
||||||||||
|
|
|
2020 |
|
|
2019 |
|
|
2020 |
|
|
2019 |
|
||||
|
|
|
(In thousands, except per-unit amounts) |
|
|||||||||||||
|
Revenues: |
|
|
|
|
|
|
|
|
|
|
|
|
|
|
|
|
|
Gathering services and related fees |
|
$ |
71,964 |
|
|
$ |
80,968 |
|
|
$ |
229,667 |
|
|
$ |
243,039 |
|
|
Natural gas, NGLs and condensate sales |
|
|
10,783 |
|
|
|
12,219 |
|
|
|
35,246 |
|
|
|
68,438 |
|
|
Other revenues |
|
|
7,406 |
|
|
|
7,000 |
|
|
|
22,150 |
|
|
|
19,804 |
|
|
Total revenues |
|
|
90,153 |
|
|
|
100,187 |
|
|
|
287,063 |
|
|
|
331,281 |
|
|
Costs and expenses: |
|
|
|
|
|
|
|
|
|
|
|
|
|
|
|
|
|
Cost of natural gas and NGLs |
|
|
8,632 |
|
|
|
7,472 |
|
|
|
22,945 |
|
|
|
50,802 |
|
|
Operation and maintenance |
|
|
22,168 |
|
|
|
26,231 |
|
|
|
65,131 |
|
|
|
74,771 |
|
|
General and administrative (1) |
|
|
10,561 |
|
|
|
10,029 |
|
|
|
39,908 |
|
|
|
38,979 |
|
|
Depreciation and amortization |
|
|
29,505 |
|
|
|
27,443 |
|
|
|
88,801 |
|
|
|
82,044 |
|
|
Transaction costs |
|
|
726 |
|
|
|
129 |
|
|
|
1,944 |
|
|
|
2,562 |
|
|
Gain on asset sales, net |
|
|
(104 |
) |
|
|
(347 |
) |
|
|
(270 |
) |
|
|
(1,595 |
) |
|
Long-lived asset impairment (2) |
|
|
— |
|
|
|
- |
|
|
|
4,475 |
|
|
|
45,021 |
|
|
Goodwill Impairment (3) |
|
|
— |
|
|
|
16,211 |
|
|
|
— |
|
|
|
16,211 |
|
|
Total costs and expenses |
|
|
71,488 |
|
|
|
87,168 |
|
|
|
222,934 |
|
|
|
308,795 |
|
|
Other income |
|
|
795 |
|
|
|
12 |
|
|
|
644 |
|
|
|
304 |
|
|
Interest expense |
|
|
(19,018 |
) |
|
|
(23,462 |
) |
|
|
(64,836 |
) |
|
|
(68,547 |
) |
|
Gain on early extinguishment of debt (4) |
|
|
24,690 |
|
|
|
— |
|
|
|
78,925 |
|
|
|
— |
|
|
Income (loss) before income taxes and equity method investment income (loss) |
|
|
25,132 |
|
|
|
(10,431 |
) |
|
|
78,862 |
|
|
|
(45,757 |
) |
|
Income tax benefit (expense) |
|
|
(298 |
) |
|
|
(21 |
) |
|
|
104 |
|
|
|
(1,427 |
) |
|
Income (loss) from equity method investees |
|
|
795 |
|
|
|
(677 |
) |
|
|
7,146 |
|
|
|
(1,197 |
) |
|
Net income (loss) |
|
$ |
25,629 |
|
|
$ |
(11,129 |
) |
|
$ |
86,112 |
|
|
$ |
(48,381 |
) |
|
|
|
|
|
|
|
|
|
|
|
|
|
|
|
|
|
|
|
Net income (loss) per limited partner unit: |
|
|
|
|
|
|
|
|
|
|
|
|
|
|
|
|
|
Common unit – basic |
|
$ |
1.29 |
|
|
$ |
(0.17 |
) |
|
$ |
2.41 |
|
|
$ |
(0.72 |
) |
|
Common unit – diluted |
|
$ |
1.25 |
|
|
$ |
(0.17 |
) |
|
$ |
2.34 |
|
|
$ |
(0.72 |
) |
|
|
|
|
|
|
|
|
|
|
|
|
|
|
|
|
|
|
|
Weighted-average limited partner units outstanding: |
|
|
|
|
|
|
|
|
|
|
|
|
|
|
|
|
|
Common units – basic |
|
|
51,974 |
|
|
|
45,319 |
|
|
|
47,331 |
|
|
|
45,319 |
|
|
Common units – diluted |
|
|
53,650 |
|
|
|
45,319 |
|
|
|
48,782 |
|
|
|
45,319 |
|
__________
(1) For the three and nine months ended September 30, 2020, the amount includes $0.1 million and $3.4 million, respectively, of restructuring expenses.
(2) For the nine months ended September 30, 2019, the amount is associated with (i) our decision in March 2019 to idle our existing 20 MMcf/d DJ Basin processing plant in conjunction with the commissioning of our new 60 MMcf/d DJ Basin processing plant resulting in an impairment charge of $34.7 million; and (ii) our decommissioning in March 2019 of an underutilized Barnett Shale compressor station resulting in an impairment charge of $10.2 million.
(3) For the three and nine months ended September 30, 2019, the amount represents an impairment charge associated with our annual goodwill testing of the Marcellus Shale reporting unit.
(4) Subsequent to the GP Buy-In Transaction, the Partnership commenced a debt buyback program to repurchase our Senior Notes, which is ongoing. We repurchased $66.0 million of the outstanding $300 million aggregate principal amount of our 5.50% Senior Notes through September 30, 2020. The gain on early extinguishment of debt for the 5.50% Senior Notes during the three and nine months ended September 30, 2020 totaled $11.3 million and $20.5 million, respectively, and is inclusive of a $0.3 million write off of debt issuance costs. We also repurchased $144.9 million of the outstanding $500 million aggregate principal amount of our 5.75% Senior Notes through September 30, 2020. The gain on early extinguishment of debt for the 5.75% Senior Notes during the three and nine months ended September 30, 2020 totaled $15.1 million and $60.2 million, respectively, and is inclusive of a $1.3 million write off of debt issuance costs.
EX 99.1-11
SUMMIT MIDSTREAM PARTNERS, LP AND SUBSIDIARIES
UNAUDITED OTHER FINANCIAL AND OPERATING DATA
|
|
Three months ended September 30, |
|
|
Nine months ended September 30, |
|
||||||||||
|
|
2020 |
|
|
2019 |
|
|
2020 |
|
|
2019 |
|
||||
|
|
(Dollars in thousands) |
|
|||||||||||||
|
Other financial data: |
|
|
|
|
|
|
|
|
|
|
|
|
|
|
|
|
Net income (loss) |
$ |
25,629 |
|
|
$ |
(11,129 |
) |
|
$ |
86,112 |
|
|
$ |
(48,381 |
) |
|
Net cash provided by operating activities |
$ |
41,436 |
|
|
$ |
43,043 |
|
|
$ |
146,807 |
|
|
$ |
127,617 |
|
|
Capital expenditures |
$ |
7,886 |
|
|
$ |
40,571 |
|
|
$ |
35,312 |
|
|
$ |
151,663 |
|
|
Contributions to equity method investees |
$ |
12,344 |
|
|
$ |
5,409 |
|
|
$ |
92,072 |
|
|
$ |
11,330 |
|
|
Adjusted EBITDA |
$ |
59,830 |
|
|
$ |
71,947 |
|
|
$ |
190,324 |
|
|
$ |
206,365 |
|
|
Cash flow available for distributions (1) |
$ |
37,551 |
|
|
$ |
42,591 |
|
|
$ |
118,270 |
|
|
$ |
126,140 |
|
|
Distributions (2) |
$ |
— |
|
|
$ |
30,915 |
|
|
$ |
— |
|
|
$ |
92,718 |
|
|
Distribution coverage ratio (3) |
n/a |
|
|
1.38x |
|
|
n/a |
|
|
1.36x |
|
||||
|
|
|
|
|
|
|
|
|
|
|
|
|
|
|
|
|
|
Operating data: |
|
|
|
|
|
|
|
|
|
|
|
|
|
|
|
|
Aggregate average daily throughput – natural gas (MMcf/d) |
|
1,392 |
|
|
|
1,394 |
|
|
|
1,354 |
|
|
|
1,410 |
|
|
Aggregate average daily throughput – liquids (Mbbl/d) |
|
69 |
|
|
|
105 |
|
|
|
81 |
|
|
|
101 |
|
|
|
|
|
|
|
|
|
|
|
|
|
|
|
|
|
|
|
Ohio Gathering average daily throughput (MMcf/d) (4) |
|
512 |
|
|
|
777 |
|
|
|
554 |
|
|
|
734 |
|
__________
(1) Cash flow available for distributions is also referred to as Distributable Cash Flow, or DCF.
(2) Represents distributions declared and ultimately paid or expected to be paid to preferred and common unitholders in respect of a given period. On May 3, 2020, the board of directors of SMLP’s general partner announced an immediate suspension of the cash distributions payable on its preferred and common units.
(3) Represents the ratio of distributable cash flow to distributions declared and ultimately paid to preferred and common unitholders. Distribution coverage ratio calculation for the three months ended September 30, 2019 is based on distributions declared and ultimately paid to preferred and common unitholders in respect of the third quarter of 2019.
(4) Gross basis, represents 100% of volume throughput for Ohio Gathering, subject to a one-month lag.
EX 99.1-12
SUMMIT MIDSTREAM PARTNERS, LP AND SUBSIDIARIES
UNAUDITED RECONCILIATIONS TO NON-GAAP FINANCIAL MEASURES
|
|
|
Three months ended September 30, |
|
|
Nine months ended September 30, |
|
||||||||||
|
|
|
2020 |
|
|
2019 |
|
|
2020 |
|
|
2019 |
|
||||
|
|
|
(In thousands) |
|
|||||||||||||
|
Reconciliations of net income or loss to adjusted EBITDA and distributable cash flow: |
|
|
|
|
|
|
|
|
|
|
|
|
|
|
|
|
|
Net income (loss) |
|
$ |
25,629 |
|
|
$ |
(11,129 |
) |
|
$ |
86,112 |
|
|
$ |
(48,381 |
) |
|
Add: |
|
|
|
|
|
|
|
|
|
|
|
|
|
|
|
|
|
Interest expense |
|
|
19,018 |
|
|
|
23,462 |
|
|
|
64,836 |
|
|
|
68,547 |
|
|
Income tax (benefit) expense |
|
|
298 |
|
|
|
21 |
|
|
|
(104 |
) |
|
|
1,427 |
|
|
Depreciation and amortization (1) |
|
|
29,739 |
|
|
|
27,677 |
|
|
|
89,505 |
|
|
|
83,030 |
|
|
Proportional adjusted EBITDA for equity method investees (2) |
|
|
7,129 |
|
|
|
10,435 |
|
|
|
22,582 |
|
|
|
29,584 |
|
|
Adjustments related to MVC shortfall payments (3) |
|
|
2,292 |
|
|
|
3,534 |
|
|
|
(859 |
) |
|
|
2,868 |
|
|
Adjustments related to capital reimbursement activity (4) |
|
|
(328 |
) |
|
|
(145 |
) |
|
|
(776 |
) |
|
|
(1,906 |
) |
|
Unit-based and noncash compensation |
|
|
1,622 |
|
|
|
1,291 |
|
|
|
6,191 |
|
|
|
5,370 |
|
|
Gain on early extinguishment of debt (5) |
|
|
(24,690 |
) |
|
|
— |
|
|
|
(78,925 |
) |
|
|
— |
|
|
Gain on asset sales, net |
|
|
(104 |
) |
|
|
(347 |
) |
|
|
(270 |
) |
|
|
(1,595 |
) |
|
Long-lived asset impairment |
|
|
— |
|
|
|
— |
|
|
|
4,475 |
|
|
|
45,021 |
|
|
Goodwill Impairment |
|
|
— |
|
|
|
16,211 |
|
|
|
— |
|
|
|
16,211 |
|
|
Other, net (6) |
|
|
20 |
|
|
|
260 |
|
|
|
4,703 |
|
|
|
4,992 |
|
|
Less: |
|
|
|
|
|
|
|
|
|
|
|
|
|
|
|
|
|
Income (loss) from equity method investees |
|
|
795 |
|
|
|
(677 |
) |
|
|
7,146 |
|
|
|
(1,197 |
) |
|
Adjusted EBITDA |
|
$ |
59,830 |
|
|
$ |
71,947 |
|
|
$ |
190,324 |
|
|
$ |
206,365 |
|
|
Less: |
|
|
|
|
|
|
|
|
|
|
|
|
|
|
|
|
|
Cash interest paid |
|
|
18,368 |
|
|
|
22,752 |
|
|
|
62,441 |
|
|
|
66,435 |
|
|
Cash paid for taxes |
|
|
— |
|
|
|
— |
|
|
|
— |
|
|
|
150 |
|
|
Senior notes interest adjustment (7) |
|
|
410 |
|
|
|
3,063 |
|
|
|
(1,396 |
) |
|
|
3,063 |
|
|
Maintenance capital expenditures |
|
|
3,501 |
|
|
|
3,541 |
|
|
|
11,009 |
|
|
|
10,577 |
|
|
Cash flow available for distributions (8) |
|
$ |
37,551 |
|
|
$ |
42,591 |
|
|
$ |
118,270 |
|
|
$ |
126,140 |
|
|
|
|
|
|
|
|
|
|
|
|
|
|
|
|
|
|
|
|
Distributions (9) |
|
$ |
— |
|
|
$ |
30,915 |
|
|
$ |
— |
|
|
$ |
92,718 |
|
|
|
|
|
|
|
|
|
|
|
|
|
|
|
|
|
|
|
|
Distribution coverage ratio (10) |
|
n/a |
|
|
1.38x |
|
|
n/a |
|
|
1.36x |
|
||||
__________
(1) Includes the amortization expense associated with our favorable gas gathering contracts as reported in other revenues.
(2) Reflects our proportionate share of Ohio Gathering adjusted EBITDA, subject to a one-month lag.
(3) Adjustments related to MVC shortfall payments are recognized ratably over the term of the associated MVC.
(4) Adjustments related to capital reimbursement activity represent contributions in aid of construction revenue recognized in accordance with Accounting Standards Update No. 2014-09 Revenue from Contracts with Customers (“Topic 606”).
(5) Subsequent to the GP Buy-In Transaction, the Partnership commenced a debt buyback program to repurchase our Senior Notes, which is ongoing. We repurchased $66.0 million of the outstanding $300 million aggregate principal amount of our 5.50% Senior Notes through September 30, 2020. The gain on early extinguishment of debt for the 5.50% Senior Notes during the three and nine months ended September 30, 2020 totaled $11.3 million and $20.5 million, respectively, and is inclusive of a $0.3 million write off of debt issuance costs. We also repurchased $144.9 million of the outstanding $500 million aggregate principal amount of our 5.75% Senior Notes through September 30, 2020. The gain on early extinguishment of debt for the 5.75% Senior Notes during the three and nine months ended September 30, 2020 totaled $15.1 million and $60.2 million, respectively, and is inclusive of a $1.3 million write off of debt issuance costs.
EX 99.1-13
(6) Represents items of income or loss that we characterize as unrepresentative of our ongoing operations. For the three months ended September 30, 2020, the amount includes $0.1 million of restructuring expenses and $0.7 million of transaction costs associated with the GP Buy-In Transaction. For the nine months ended September 30, 2020, the amount includes $3.4 million of restructuring expenses and $2.1 million of transaction costs associated with the GP Buy-In Transaction. For the nine months ended September 30, 2019, the amount includes $3.4 million of severance expense associated with our former Chief Executive Officer and $0.9 million of transaction costs associated with the Equity Restructuring.
(7) Senior notes interest adjustment represents the net of interest expense accrued and paid during the period. Interest on the $300.0 million 5.5% senior notes is paid in cash semi-annually in arrears on February 15 and August 15 until maturity in August 2022. Interest on the $500.0 million 5.75% senior notes is paid in cash semi-annually in arrears on April 15 and October 15 until maturity in April 2025.
(8) Represents cash flow available for distribution to preferred and common unitholders. Common distributions cannot be paid unless all accrued preferred distributions are paid. Cash flow available for distributions is also referred to as Distributable Cash Flow, or DCF.
(9) Represents distributions declared and ultimately paid or expected to be paid to preferred and common unitholders in respect of a given period. On May 3, 2020, the board of directors of SMLP’s general partner announced an immediate suspension of the cash distributions payable on its preferred and common units.
(10) Represents the ratio of distributable cash flow to distributions declared and ultimately paid to preferred and common unitholders. Distribution coverage ratio calculation for the three months ended September 30, 2019 is based on distributions declared and ultimately paid to preferred and common unitholders in respect of the third quarter of 2019.
EX 99.1-14
SUMMIT MIDSTREAM PARTNERS, LP AND SUBSIDIARIES
UNAUDITED RECONCILIATIONS TO NON-GAAP FINANCIAL MEASURES
|
|
|
Nine months ended September 30, |
|
|||||
|
|
|
2020 |
|
|
2019 |
|
||
|
|
|
(In thousands) |
|
|||||
|
Reconciliation of net cash provided by operating activities to adjusted EBITDA and distributable cash flow: |
|
|
|
|
|
|
|
|
|
Net cash provided by operating activities |
|
$ |
146,807 |
|
|
$ |
127,617 |
|
|
Add: |
|
|
|
|
|
|
|
|
|
Interest expense, excluding amortization of debt issuance costs |
|
|
59,966 |
|
|
|
63,828 |
|
|
Income tax (benefit) expense |
|
|
(104 |
) |
|
|
1,427 |
|
|
gain on fair value of warrants |
|
|
838 |
|
|
|
— |
|
|
Changes in operating assets and liabilities |
|
|
(21,049 |
) |
|
|
8,262 |
|
|
Proportional adjusted EBITDA for equity method investees (1) |
|
|
22,582 |
|
|
|
29,584 |
|
|
Adjustments related to MVC shortfall payments (2) |
|
|
(859 |
) |
|
|
2,868 |
|
|
Adjustments related to capital reimbursement activity (3) |
|
|
(776 |
) |
|
|
(1,906 |
) |
|
Other, net (4) |
|
|
4,703 |
|
|
|
4,992 |
|
|
Less: |
|
|
|
|
|
|
|
|
|
Distributions from equity method investees |
|
|
19,859 |
|
|
|
28,008 |
|
|
Noncash lease expense |
|
|
1,925 |
|
|
|
2,299 |
|
|
Adjusted EBITDA |
|
$ |
190,324 |
|
|
$ |
206,365 |
|
|
Less: |
|
|
|
|
|
|
|
|
|
Cash interest paid |
|
|
62,441 |
|
|
|
66,435 |
|
|
Cash paid for taxes |
|
|
— |
|
|
|
150 |
|
|
Senior notes interest adjustment (5) |
|
|
(1,396 |
) |
|
|
3,063 |
|
|
Maintenance capital expenditures |
|
|
11,009 |
|
|
|
10,577 |
|
|
Cash flow available for distributions (6) |
|
$ |
118,270 |
|
|
$ |
126,140 |
|
__________
(1) Reflects our proportionate share of Ohio Gathering adjusted EBITDA, subject to a one-month lag.
(2) Adjustments related to MVC shortfall payments are recognized ratably over the term of the associated MVC.
(3) Adjustments related to capital reimbursement activity represent contributions in aid of construction revenue recognized in accordance with Accounting Standards Update No. 2014-09 Revenue from Contracts with Customers (“Topic 606”).
(4) Represents items of income or loss that we characterize as unrepresentative of our ongoing operations. For the three months ended September 30, 2020, the amount includes $0.1 million of restructuring expenses and $0.7 million of transaction costs associated with the GP Buy-In Transaction. For the nine months ended September 30, 2020, the amount includes $3.4 million of restructuring expenses and $2.1 million of transaction costs associated with the GP Buy-In Transaction. For the nine months ended September 30, 2019, the amount includes $3.4 million of severance expense associated with our former Chief Executive Officer and $0.9 million of transaction costs associated with the Equity Restructuring.
(5) Senior notes interest adjustment represents the net of interest expense accrued and paid during the period. Interest on the $300.0 million 5.5% senior notes is paid in cash semi-annually in arrears on February 15 and August 15 until maturity in August 2022. Interest on the $500.0 million 5.75% senior notes is paid in cash semi-annually in arrears on April 15 and October 15 until maturity in April 2025.
(6) Represents cash flow available for distribution to preferred and common unitholders. Common distributions cannot be paid unless all accrued preferred distributions are paid. Cash flow available for distributions is also referred to as Distributable Cash Flow, or DCF.
Contact: Ross Wong, Senior Director, Corporate Development & Finance, 832-930-7512, ir@summitmidstream.com
SOURCE: Summit Midstream Partners, LP
EX 99.1-15