Attached files
| file | filename |
|---|---|
| EX-32.2 - EXHIBIT 32.2 - Jones Lang LaSalle Income Property Trust, Inc. | exhibit322.htm |
| EX-32.1 - EXHIBIT 32.1 - Jones Lang LaSalle Income Property Trust, Inc. | exhibit321.htm |
| EX-31.2 - EXHIBIT 31.2 - Jones Lang LaSalle Income Property Trust, Inc. | exhibit312.htm |
| EX-31.1 - EXHIBIT 31.1 - Jones Lang LaSalle Income Property Trust, Inc. | exhibit311.htm |
UNITED STATES
SECURITIES AND EXCHANGE COMMISSION
Washington, D.C. 20549
_________________________________
FORM 10-Q
_________________________________
ý | QUARTERLY REPORT PURSUANT TO SECTION 13 OR 15(d) OF THE SECURITIES EXCHANGE ACT OF 1934 |
For the quarterly period ended September 30, 2020
OR
☐ | TRANSITION REPORT PURSUANT TO SECTION 13 OR 15(d) OF THE SECURITIES EXCHANGE ACT OF 1934 |
For the transition period from to
Commission file number: 000-51948
_________________________________

Jones Lang LaSalle Income Property Trust, Inc.
(Exact name of registrant as specified in its charter)
_________________________________
Maryland | 20-1432284 | |
(State or other jurisdiction of incorporation or organization) | (I.R.S. Employer Identification Number) | |
333 West Wacker Drive, Chicago IL, 60606
(Address of principal executive offices, including Zip Code)
(312) 897-4000
(Registrant’s telephone number, including area code)
N/A
(Former name or former address, if changed since last report)
_________________________________
Securities registered pursuant to Section 12(b) of the Act: None
Indicate by check mark whether the registrant (1) has filed all reports required to be filed by Section 13 or 15(d) of the Securities Exchange Act of 1934 during the preceding 12 months (or for such shorter period that the registrant was required to file such reports), and (2) has been subject to such filing requirements for the past 90 days. YES ☑ NO ☐
Indicate by check mark whether the registrant has submitted electronically every Interactive Data File required to be submitted pursuant to Rule 405 of Regulation S-T (§232.405 of this chapter) during the preceding 12 months (or for such shorter period that the registrant was required to submit such files). YES ☑ NO ☐
Indicate by check mark whether the registrant is a large accelerated filer, an accelerated filer, a non-accelerated filer, a smaller reporting company, or an emerging growth company. See definitions of "large accelerated filer," "accelerated filer," "smaller reporting company" and "emerging growth company" in Rule 12b-2 of the Exchange Act.
Large accelerated filer | ☐ | Accelerated filer | ☐ | |||
Non-accelerated filer | ☑ | Smaller reporting company | ☐ | |||
Emerging growth company | ☐ | |||||
If an emerging growth company, indicate by check mark if the registrant has elected not to use the extended transition period for complying with any new or revised financial accounting standards provided pursuant to Section 13(a) of the Exchange Act. ☐
Indicate by check mark whether the registrant is a shell company (as defined in Rule 12b-2 of the Exchange Act). YES ☐ NO ☑
The number of shares of the registrant’s Common Stock, $.01 par value, outstanding on November 6, 2020 were 89,759,154 shares of Class A Common Stock, 35,655,063 shares of Class M Common Stock, 9,558,034 shares of Class A-I Common Stock, 30,061,911 shares of Class M-I Common Stock and 4,957,915 shares of Class D Common Stock.
Jones Lang LaSalle Income Property Trust, Inc.
INDEX
PAGE NUMBER | |
2
Item 1. Financial Statements.
Jones Lang LaSalle Income Property Trust, Inc.
CONSOLIDATED BALANCE SHEETS
$ in thousands, except per share amounts
September 30, 2020 | December 31, 2019 | ||||||
(Unaudited) | |||||||
ASSETS | |||||||
Investments in real estate: | |||||||
Land (including from VIEs of $22,605 and $22,605, respectively) | $ | 436,249 | $ | 430,278 | |||
Buildings and equipment (including from VIEs of $142,908 and $142,599, respectively) | 1,839,314 | 1,770,236 | |||||
Less accumulated depreciation (including from VIEs of $(22,235) and $(19,646), respectively) | (211,270 | ) | (176,236 | ) | |||
Net property and equipment | 2,064,293 | 2,024,278 | |||||
Investment in unconsolidated real estate affiliates | 156,525 | 159,288 | |||||
Real estate fund investment | 80,323 | 93,400 | |||||
Net investments in real estate | 2,301,141 | 2,276,966 | |||||
Cash and cash equivalents (including from VIEs of $3,924 and $2,087, respectively) | 74,132 | 77,056 | |||||
Restricted cash (including from VIEs of $441 and $75, respectively) | 13,913 | 36,966 | |||||
Tenant accounts receivable, net (including from VIEs of $2,327 and $2,767, respectively) | 7,933 | 6,424 | |||||
Deferred expenses, net (including from VIEs of $520 and $558, respectively) | 9,246 | 9,351 | |||||
Acquired intangible assets, net (including from VIEs of $3,577 and $5,385, respectively) | 104,258 | 93,342 | |||||
Deferred rent receivable, net (including from VIEs of $1,100 and $1,079, respectively) | 21,136 | 20,407 | |||||
Prepaid expenses and other assets (including from VIEs of $308 and $180, respectively) | 6,221 | 10,997 | |||||
TOTAL ASSETS | $ | 2,537,980 | $ | 2,531,509 | |||
LIABILITIES AND EQUITY | |||||||
Mortgage notes and other debt payable, net (including from VIEs of $82,161 and $82,531, respectively) | $ | 887,703 | $ | 836,818 | |||
Accounts payable and other liabilities (including from VIEs of $1,055 and $1,500, respectively) | 34,918 | 55,092 | |||||
Financing obligation | 54,968 | — | |||||
Accrued offering costs | 104,047 | 95,225 | |||||
Distributions payable | — | 19,888 | |||||
Accrued interest (including from VIEs of $297 and $299, respectively) | 2,053 | 2,602 | |||||
Accrued real estate taxes (including from VIEs of $1,152 and $515, respectively) | 11,665 | 5,137 | |||||
Advisor fees payable | 2,016 | 2,169 | |||||
Acquired intangible liabilities, net | 15,877 | 15,821 | |||||
TOTAL LIABILITIES | 1,113,247 | 1,032,752 | |||||
Commitments and contingencies | — | — | |||||
Equity: | |||||||
Class A common stock: $0.01 par value; 200,000,000 shares authorized; 89,377,739 and 88,007,721 shares issued and outstanding at September 30, 2020 and December 31, 2019, respectively | 894 | 880 | |||||
Class M common stock: $0.01 par value; 200,000,000 shares authorized; 35,736,129 and 39,036,770 shares issued and outstanding at September 30, 2020 and December 31, 2019, respectively | 357 | 390 | |||||
Class A-I common stock: $0.01 par value; 200,000,000 shares authorized; 9,604,614 and 11,153,567 shares issued and outstanding at September 30, 2020 and December 31, 2019, respectively | 96 | 112 | |||||
Class M-I common stock: $0.01 par value; 200,000,000 shares authorized; 29,715,005 and 22,589,999 shares issued and outstanding at September 30, 2020 and December 31, 2019, respectively | 297 | 226 | |||||
Class D common stock: $0.01 par value; 200,000,000 shares authorized; 4,957,915 and 4,957,915 shares issued and outstanding at September 30, 2020 and December 31, 2019, respectively | 50 | 50 | |||||
Additional paid-in capital (net of offering costs of $209,612 and $187,131 as of September 30, 2020 and December 31, 2019, respectively) | 1,885,398 | 1,860,734 | |||||
Distributions to stockholders | (460,708 | ) | (398,939 | ) | |||
Retained earnings | (7,592 | ) | 29,283 | ||||
Total Jones Lang LaSalle Income Property Trust, Inc. stockholders’ equity | 1,418,792 | 1,492,736 | |||||
Noncontrolling interests | 5,941 | 6,021 | |||||
Total equity | 1,424,733 | 1,498,757 | |||||
TOTAL LIABILITIES AND EQUITY | $ | 2,537,980 | $ | 2,531,509 | |||
The abbreviation “VIEs” above means consolidated Variable Interest Entities.
See notes to consolidated financial statements.
3
Jones Lang LaSalle Income Property Trust, Inc.
CONSOLIDATED STATEMENTS OF OPERATIONS
$ in thousands, except share and per share amounts
(Unaudited)
Three Months Ended September 30, 2020 | Three Months Ended September 30, 2019 | Nine Months Ended September 30, 2020 | Nine Months Ended September 30, 2019 | ||||||||||||
Revenues: | |||||||||||||||
Rental revenue | $ | 46,970 | $ | 43,215 | $ | 139,370 | $ | 121,487 | |||||||
Other revenue | 2,067 | 1,570 | 5,243 | 5,303 | |||||||||||
Total revenues | 49,037 | 44,785 | 144,613 | 126,790 | |||||||||||
Operating expenses: | |||||||||||||||
Real estate taxes | 7,572 | 6,511 | 22,419 | 18,347 | |||||||||||
Property operating expenses | 9,975 | 8,466 | 27,554 | 22,892 | |||||||||||
Property general and administrative | 728 | 497 | 3,609 | 1,230 | |||||||||||
Advisor fees | 6,192 | 5,956 | 19,049 | 16,730 | |||||||||||
Company level expenses | 693 | 1,057 | 2,241 | 2,476 | |||||||||||
Depreciation and amortization | 18,830 | 18,232 | 56,450 | 48,025 | |||||||||||
Total operating expenses | 43,990 | 40,719 | 131,322 | 109,700 | |||||||||||
Other income (expenses): | |||||||||||||||
Interest expense | (8,391 | ) | (8,902 | ) | (32,191 | ) | (29,085 | ) | |||||||
(Loss) income from unconsolidated real estate affiliates and fund investments | (3,289 | ) | 221 | (16,186 | ) | 4,057 | |||||||||
(Loss) gain on disposition of property and extinguishment of debt, net | (3,480 | ) | (236 | ) | (1,772 | ) | 106,872 | ||||||||
Total other income and (expenses) | (15,160 | ) | (8,917 | ) | (50,149 | ) | 81,844 | ||||||||
Net (loss) income | (10,113 | ) | (4,851 | ) | (36,858 | ) | 98,934 | ||||||||
Less: Net loss (income) attributable to the noncontrolling interests | (9 | ) | (31 | ) | (17 | ) | (43 | ) | |||||||
Net (loss) income attributable to Jones Lang LaSalle Income Property Trust, Inc. | $ | (10,122 | ) | $ | (4,882 | ) | $ | (36,875 | ) | $ | 98,891 | ||||
Net (loss) income attributable to Jones Lang LaSalle Income Property Trust, Inc. per share-basic and diluted: | |||||||||||||||
Class A | (0.06 | ) | (0.03 | ) | (0.22 | ) | 0.67 | ||||||||
Class M | (0.06 | ) | (0.03 | ) | (0.22 | ) | 0.67 | ||||||||
Class A-I | (0.06 | ) | (0.03 | ) | (0.22 | ) | 0.67 | ||||||||
Class M-I | (0.06 | ) | (0.03 | ) | (0.22 | ) | 0.67 | ||||||||
Class D | (0.06 | ) | (0.03 | ) | (0.22 | ) | 0.67 | ||||||||
Weighted average common stock outstanding-basic and diluted | 169,289,415 | 154,940,895 | 170,707,171 | 146,953,945 | |||||||||||
See notes to consolidated financial statements.
4
Jones Lang LaSalle Income Property Trust, Inc.
CONSOLIDATED STATEMENTS OF EQUITY
$ in thousands, except share and per share amounts (Unaudited)
Common Stock | Additional Paid In Capital | Distributions to Stockholders | Retained Earnings / (Accumulated Deficit) | Noncontrolling Interests | Total Equity | |||||||||||||||||||||
Shares | Amount | |||||||||||||||||||||||||
Balance, July 1, 2019 | 149,134,574 | $ | 1,491 | $ | 1,685,234 | $ | (353,679 | ) | $ | 33,123 | $ | 6,723 | $ | 1,372,892 | ||||||||||||
Issuance of common stock | 11,253,893 | 113 | 137,786 | — | — | — | 137,899 | |||||||||||||||||||
Repurchase of shares | (2,079,742 | ) | (20 | ) | (25,034 | ) | — | — | — | (25,054 | ) | |||||||||||||||
Conversion of shares | (1,040 | ) | — | — | — | — | — | — | ||||||||||||||||||
Offering costs | — | — | (11,711 | ) | — | — | — | (11,711 | ) | |||||||||||||||||
Stock based compensation | 8,000 | — | 98 | — | — | — | 98 | |||||||||||||||||||
Net loss | — | — | — | — | (4,882 | ) | 31 | (4,851 | ) | |||||||||||||||||
Cash contributions from noncontrolling interests | — | — | — | — | — | 1,645 | 1,645 | |||||||||||||||||||
Cash distributed to noncontrolling interests | — | — | — | — | — | (93 | ) | (93 | ) | |||||||||||||||||
Distributions declared per share ($0.175) | — | — | — | (25,358 | ) | — | — | (25,358 | ) | |||||||||||||||||
Balance, September 30, 2019 | 158,315,685 | $ | 1,584 | $ | 1,786,373 | $ | (379,037 | ) | $ | 28,241 | $ | 8,306 | $ | 1,445,467 | ||||||||||||
Balance, January 1, 2019 | 138,148,451 | $ | 1,382 | $ | 1,568,474 | $ | (318,780 | ) | $ | (70,650 | ) | $ | 6,866 | $ | 1,187,292 | |||||||||||
Issuance of common stock | 26,276,577 | 263 | 321,729 | — | — | — | 321,992 | |||||||||||||||||||
Repurchase of shares | (6,119,193 | ) | (61 | ) | (74,144 | ) | — | — | — | (74,205 | ) | |||||||||||||||
Conversion of shares | (1,448 | ) | — | — | — | — | — | — | ||||||||||||||||||
Offering costs | — | — | (29,824 | ) | — | — | — | (29,824 | ) | |||||||||||||||||
Stock based compensation | 11,298 | — | 138 | — | — | — | 138 | |||||||||||||||||||
Net income | — | — | — | — | 98,891 | 43 | 98,934 | |||||||||||||||||||
Cash contributions from noncontrolling interests | — | — | — | — | — | 1,645 | 1,645 | |||||||||||||||||||
Cash distributed to noncontrolling interests | — | — | — | — | — | (248 | ) | (248 | ) | |||||||||||||||||
Distributions declared per share ($0.445) | — | — | — | (60,257 | ) | — | — | (60,257 | ) | |||||||||||||||||
Balance, September 30, 2019 | 158,315,685 | $ | 1,584 | $ | 1,786,373 | $ | (379,037 | ) | $ | 28,241 | $ | 8,306 | $ | 1,445,467 | ||||||||||||
Balance, July 1, 2020 | 169,930,376 | $ | 1,700 | $ | 1,894,870 | $ | (440,306 | ) | $ | 2,530 | $ | 5,974 | $ | 1,464,768 | ||||||||||||
Issuance of common stock | 3,343,225 | 33 | 38,996 | — | — | — | 39,029 | |||||||||||||||||||
Repurchase of shares | (3,882,050 | ) | (39 | ) | (45,153 | ) | — | — | — | (45,192 | ) | |||||||||||||||
Conversion of shares | (149 | ) | — | — | — | — | — | — | ||||||||||||||||||
Offering costs | — | — | (3,315 | ) | — | — | — | (3,315 | ) | |||||||||||||||||
Net loss | — | — | — | — | (10,122 | ) | 9 | (10,113 | ) | |||||||||||||||||
Cash contributions from noncontrolling interests | — | — | — | — | — | 2 | 2 | |||||||||||||||||||
Cash distributed to noncontrolling interests | — | — | — | — | — | (44 | ) | (44 | ) | |||||||||||||||||
Distributions declared per share ($0.135) | — | — | — | (20,402 | ) | — | — | (20,402 | ) | |||||||||||||||||
Balance, September 30, 2020 | 169,391,402 | $ | 1,694 | $ | 1,885,398 | $ | (460,708 | ) | $ | (7,592 | ) | $ | 5,941 | $ | 1,424,733 | |||||||||||
Balance, January 1, 2020 | 165,745,572 | $ | 1,658 | $ | 1,860,734 | $ | (398,939 | ) | $ | 29,283 | $ | 6,021 | $ | 1,498,757 | ||||||||||||
Issuance of common stock | 22,227,749 | 222 | 269,868 | — | — | — | 270,090 | |||||||||||||||||||
Repurchase of shares | (18,597,052 | ) | (186 | ) | (222,915 | ) | — | — | — | (223,101 | ) | |||||||||||||||
Conversion of shares | (867 | ) | — | — | — | — | — | — | ||||||||||||||||||
Offering costs | — | — | (22,481 | ) | — | — | — | (22,481 | ) | |||||||||||||||||
Stock based compensation | 16,000 | — | 192 | — | — | — | 192 | |||||||||||||||||||
Net income | — | — | — | — | (36,875 | ) | 17 | (36,858 | ) | |||||||||||||||||
Cash contributions from noncontrolling interests | — | — | — | — | — | 3 | 3 | |||||||||||||||||||
Cash distributed to noncontrolling interests | — | — | — | — | — | (100 | ) | (100 | ) | |||||||||||||||||
Distributions declared per share ($0.405) | — | — | — | (61,769 | ) | — | — | (61,769 | ) | |||||||||||||||||
Balance, September 30, 2020 | 169,391,402 | $ | 1,694 | $ | 1,885,398 | $ | (460,708 | ) | $ | (7,592 | ) | $ | 5,941 | $ | 1,424,733 | |||||||||||
See notes to consolidated financial statements.
5
Jones Lang LaSalle Income Property Trust, Inc.
CONSOLIDATED STATEMENTS OF CASH FLOWS
$ in thousands
(Unaudited)
See notes to consolidated financial statements.
Nine Months Ended September 30, 2020 | Nine Months Ended September 30, 2019 | ||||||
CASH FLOWS FROM OPERATING ACTIVITIES: | |||||||
Net (loss) income | $ | (36,858 | ) | $ | 98,934 | ||
Adjustments to reconcile net income to net cash provided by operating activities: | |||||||
Depreciation and amortization | 55,852 | 47,702 | |||||
Gain on disposition of property and extinguishment of debt | 1,772 | (106,872 | ) | ||||
Straight line rent | (740 | ) | (2,417 | ) | |||
Loss (income) from unconsolidated real estate affiliates and fund investment | 16,186 | (4,057 | ) | ||||
Distributions from unconsolidated real estate affiliates and fund investment | 3,443 | 7,325 | |||||
Net changes in assets, liabilities and other | 11,903 | 9,610 | |||||
Net cash provided by operating activities | 51,558 | 50,225 | |||||
CASH FLOWS FROM INVESTING ACTIVITIES: | |||||||
Purchase of real estate investments | (101,220 | ) | (384,146 | ) | |||
Proceeds from sale of real estate investments and fixed assets | 5,372 | 216,010 | |||||
Capital improvements and lease commissions | (8,056 | ) | (14,248 | ) | |||
Investment in unconsolidated real estate affiliates | (3,788 | ) | (1,013 | ) | |||
Distributions from unconsolidated real estate affiliates | — | 3,248 | |||||
Net cash used in investing activities | (107,692 | ) | (180,149 | ) | |||
CASH FLOWS FROM FINANCING ACTIVITIES: | |||||||
Issuance of common stock | 247,601 | 303,338 | |||||
Repurchase of shares | (221,662 | ) | (74,205 | ) | |||
Offering costs | (13,660 | ) | (13,851 | ) | |||
Distributions to stockholders | (27,988 | ) | (17,184 | ) | |||
Distributions paid to noncontrolling interests | (100 | ) | (248 | ) | |||
Contributions received from noncontrolling interests | 3 | 1,645 | |||||
Deposits for loan commitments | (405 | ) | (585 | ) | |||
Draws on credit facility | 200,000 | 57,000 | |||||
Payment on credit facility | (100,000 | ) | (101,000 | ) | |||
Proceeds from mortgage notes and other debt payable | 35,900 | 86,546 | |||||
Debt issuance costs | (52 | ) | (966 | ) | |||
Payment on early extinguishment of debt | (1,457 | ) | (207 | ) | |||
Principal payments on mortgage notes and other debt payable | (88,023 | ) | (87,282 | ) | |||
Net cash provided by financing activities | 30,157 | 153,001 | |||||
Net (decrease) increase in cash, cash equivalents and restricted cash | (25,977 | ) | 23,077 | ||||
Cash, cash equivalents and restricted cash at the beginning of the period | 114,022 | 45,269 | |||||
Cash, cash equivalents and restricted cash at the end of the period | $ | 88,045 | $ | 68,346 | |||
Reconciliation of cash, cash equivalents and restricted cash shown per Consolidated Balance Sheets to cash, cash equivalents and restricted per Consolidated Statements of Cash Flows | |||||||
Cash and cash equivalents | $ | 74,132 | $ | 42,793 | |||
Restricted cash | 13,913 | 25,553 | |||||
Cash, cash equivalents and restricted cash at the end of the period | $ | 88,045 | $ | 68,346 | |||
Supplemental disclosure of cash flow information: | |||||||
Interest paid | $ | 26,994 | $ | 21,677 | |||
Non-cash activities: | |||||||
Write-offs of receivables | $ | 53 | $ | 86 | |||
Write-offs of retired assets and liabilities | 9,341 | 11,839 | |||||
Change in liability for capital expenditures | 525 | (236 | ) | ||||
Net liabilities transferred at disposition of real estate investment | 63 | 2,100 | |||||
Net liabilities assumed at acquisition | 538 | (34 | ) | ||||
Change in issuance of common stock receivable and redemption of common stock payable | 2,938 | 86 | |||||
Change in accrued offering costs | 8,821 | 15,973 | |||||
6
Jones Lang LaSalle Income Property Trust, Inc.
NOTES TO CONSOLIDATED FINANCIAL STATEMENTS
$ in thousands, except per share amounts
NOTE 1—ORGANIZATION
General
Except where the context suggests otherwise, the terms “we,” “us,” “our” and the “Company” refer to Jones Lang LaSalle Income Property Trust, Inc. The terms “Advisor” and “LaSalle” refer to LaSalle Investment Management, Inc.
Jones Lang LaSalle Income Property Trust, Inc. is an externally advised, daily valued perpetual-life real estate investment trust ("REIT") that owns and manages a diversified portfolio of apartment, industrial, office, retail and other properties located in the United States. Over time our real estate portfolio may be further diversified on a global basis through the acquisition of properties outside of the United States and may be complemented by investments in real estate-related debt and equity securities. We were incorporated on May 28, 2004 under the laws of the State of Maryland. We believe that we have operated in such a manner to qualify to be taxed as a REIT for federal income tax purposes commencing with the taxable year ended December 31, 2004, when we first elected REIT status. As of September 30, 2020, we owned interests in a total of 78 properties, located in 20 states.
We own, and plan to continue to own, all or substantially all of our assets through JLLIPT Holdings, LP, a Delaware limited partnership (our “operating partnership”), of which we are the initial limited partner and JLLIPT Holdings GP, LLC, our wholly owned subsidiary, is the sole general partner. The use of our operating partnership to hold all or substantially all of our assets is referred to as an Umbrella Partnership Real Estate Investment Trust ("UPREIT"). This structure is intended to facilitate tax-deferred contributions of properties to our operating partnership in exchange for limited partnership interests in our operating partnership. A transfer of property directly to a REIT in exchange for shares of common stock of a REIT is generally a taxable transaction to the transferring property owner. In an UPREIT structure, a property owner who desires to defer taxable gain on the disposition of his property may transfer the property to our operating partnership in exchange for limited partnership interests in the operating partnership and defer taxation of gain until the limited partnership interests are disposed of in a taxable transaction.
From our inception to January 15, 2015, we raised equity proceeds through various public and private offerings of shares of our common stock. On January 16, 2015, our follow-on Registration Statement on Form S-11 was declared effective by the Securities and Exchange Commission (the "SEC") with respect to our continuous public offering of up to $2,700,000 in any combination of shares of our Class A, Class M, Class A-I and Class M-I common stock, consisting of up to $2,400,000 of shares offered in our primary offering and up to $300,000 in shares offered pursuant to our distribution reinvestment plan (the “First Extended Public Offering”). As of July 6, 2018, the date our First Extended Public Offering terminated, we had raised aggregate gross proceeds from the sale of shares of our common stock in our First Extended Public Offering of $1,138,053.
On July 6, 2018, the SEC declared our second follow-on Registration Statement on Form S-11 (the "Second Extended Public Offering") effective (Commission File No. 333-222533) to offer up to $3,000,000 in any combination of shares of our Class A, Class M, Class A-I and Class M-I common stock, consisting of up to $2,700,000 of shares offered in our primary offering and up to $300,000 in shares offered pursuant to our distribution reinvestment plan. In accordance with SEC rules, we extended our Second Extended Public Offering one additional year through July 6, 2021. We reserve the right to terminate the Second Extended Public Offering at any time and to further extend the Second Extended Public Offering term to the extent permissible under applicable law. As of September 30, 2020, we have raised aggregate gross proceeds from the sale of shares of our common stock in our Second Extended Public Offering of $809,463.
On March 3, 2015, we commenced a private offering (the "Follow-on Private Offering") of up to $350,000 in shares of our Class D common stock with an indefinite duration. As of September 30, 2020, we have raised aggregate gross proceeds from the sale of shares of our Class D common stock in our Follow-on Private Offering of $68,591.
On October 16, 2019, through our operating partnership, we initiated a program (the “DST Program”) to raise up to $500,000, which our board of directors may increase in its sole discretion, in private placements exempt from registration under the Securities Act of 1933, as amended, through the sale of beneficial interests to accredited investors in specific Delaware statutory trusts holding real properties ("DST Properties"), which may be sourced from our real properties or from third parties. As of September 30, 2020, we have raised $55,785 from our DST Program.
7
As of September 30, 2020, 89,377,739 shares of Class A common stock, 35,736,129 shares of Class M common stock, 9,604,614 shares of Class A-I common stock, 29,715,005 shares of Class M-I common stock, and 4,957,915 shares of Class D common stock were outstanding and held by a total of 17,450 stockholders.
LaSalle acts as our advisor pursuant to the advisory agreement among us, our operating partnership and LaSalle (the "Advisory Agreement"). The term of our Advisory Agreement expires June 5, 2021, subject to an unlimited number of successive one-year renewals. Our Advisor, a registered investment advisor with the SEC, has broad discretion with respect to our investment decisions and is responsible for selecting our investments and for managing our investment portfolio pursuant to the terms of the Advisory Agreement. Our executive officers are employees of and compensated by our Advisor. We have no employees, as all operations are managed by our Advisor.
LaSalle is a wholly-owned, but operationally independent subsidiary of Jones Lang LaSalle Incorporated ("JLL" or our "Sponsor"), a New York Stock Exchange-listed leading professional services firm that specializes in real estate and investment management. As of September 30, 2020, JLL and its affiliates owned an aggregate of 2,521,801 Class M shares, which were issued for cash at a price equal to the most recently reported net asset value ("NAV") per share as of the purchase date and have a current value of $29,253.
NOTE 2—SUMMARY OF SIGNIFICANT ACCOUNTING POLICIES
Basis of Presentation and Principles of Consolidation
The accompanying consolidated financial statements have been prepared in accordance with U.S. generally accepted accounting principles (“GAAP”), the instructions to Form 10-Q and Rule 10-01 of Regulation S-X and include the accounts of our wholly owned subsidiaries, consolidated variable interest entities ("VIE") and the unconsolidated investment in real estate affiliates accounted for under the equity method of accounting. We consider the authoritative guidance of accounting for investments in common stock, investments in real estate ventures, investors accounting for an investee when the investor has the majority of the voting interest but the minority partners have certain approval or veto rights, determining whether a general partner or general partners as a group controls a limited partnership or similar entity when the limited partners have certain rights and the consolidation of VIEs in which we own less than a 100% interest. All significant intercompany balances and transactions have been eliminated in consolidation.
Parenthetical disclosures are shown on our Consolidated Balance Sheets regarding the amounts of VIE assets and liabilities that are consolidated. As of September 30, 2020, our VIEs include The District at Howell Mill, Grand Lakes Marketplace, and Presley Uptown due to the joint venture structures and our partners having limited participation rights and no kick-out rights. The creditors of our VIEs do not have general recourse to us.
Noncontrolling interests represent the minority members’ proportionate share of the equity in our VIEs. At acquisition, the assets, liabilities and noncontrolling interests were measured and recorded at the estimated fair value. Noncontrolling interests will increase for the minority members’ share of net income of these entities and contributions and decrease for the minority members’ share of net loss and distributions. As of September 30, 2020, noncontrolling interests represented the minority members’ proportionate share of the equity of the entities listed above as VIEs.
Certain of our joint venture agreements include provisions whereby, at certain specified times, each party has the right to initiate a purchase or sale of its interest in the joint ventures at an agreed upon fair value. Under these provisions, we are not obligated to purchase the interest of our outside joint venture partners.
The accompanying unaudited interim consolidated financial statements have been prepared in accordance with the accounting policies described in the consolidated financial statements and related notes included in our Annual Report on Form 10-K filed with the SEC on March 10, 2020 (our “2019 Form 10-K”) and should be read in conjunction with such consolidated financial statements and related notes. The following notes to these interim consolidated financial statements highlight changes to the notes included in the December 31, 2019 audited consolidated financial statements included in our 2019 Form 10-K and present interim disclosures as required by the SEC.
The interim financial data as of September 30, 2020 and for the three and nine months ended September 30, 2020 and 2019 is unaudited. In our opinion, the interim data includes all adjustments, consisting only of normal recurring adjustments, necessary for a fair statement of the results for the interim periods.
8
Restricted Cash
Restricted cash includes amounts established pursuant to various agreements for loan escrow accounts, loan commitments and property sale proceeds. When we sell a property, we can elect to enter into a like-kind exchange pursuant to the applicable Internal Revenue Service guidance whereby the proceeds from the sale are placed in escrow with a qualified intermediary until a replacement property can be purchased. At September 30, 2020, our restricted cash balance on our Consolidated Balance Sheets was primarily related to common stock subscriptions received in advance of the issuance of the common stock and loan escrow amounts.
Deferred Expenses
Deferred expenses consist of lease commissions. Lease commissions are capitalized and amortized over the term of the related lease as a component of depreciation and amortization expense. Accumulated amortization of deferred expenses at September 30, 2020 and December 31, 2019 was $6,194 and $4,893, respectively.
Rental Revenue Recognition
We recognize rental revenue from tenants under operating leases on a straight-line basis over the non-cancelable term of the lease when collectibility of substantially all rents is reasonably assured. Recognition of rental revenue on a straight-line basis includes the effects of rental abatements, lease incentives and fixed and determinable increases in lease payments over the lease term. For leases where collection of substantially all rents is not deemed to be probable, revenue is recorded equal to cash that has been received from the tenant. We evaluate the collectibility of rents and other receivables at each reporting period based on factors including, among others, tenant's payment history, the financial condition of the tenant, business conditions and trends in the industry in which the tenant operates and economic conditions in the geographic area where the property is located. If evaluation of these factors or others indicates it is not probable we will collect substantially all rent we recognize an adjustment to rental revenue. If our judgment or estimation regarding probability of collection changes we may adjust or record additional rental revenue in the period such conclusion is reached.
The COVID-19 pandemic has had a negative impact on many of our tenant’s businesses. The duration and extent of the negative effects caused by the COVID-19 pandemic to the economy is uncertain, and as such collectibility of certain tenants rent receivable balances in the future is also uncertain. We have taken into account current tenant conditions, which include consideration of COVID-19 in our estimation of its uncollectible accounts and deferred rents receivable at September 30, 2020. We are closely monitoring the collectibility of such rents and will adjust future estimations as further information becomes known. During the three and nine months ending September 30, 2020, we recorded a reduction in rental revenue of $710 and $2,701, respectively, and a reduction in straight line revenue of $30 and $2,141, respectively, due to concern of collectibility. During the three and nine months ending September 30, 2020, we deferred $679 and $1,851, respectively, and abated $113 and $970, respectively, of rental revenue.
Acquisitions
We have allocated a portion of the purchase price of our acquisitions to acquired intangible assets, which include acquired in-place lease intangibles, acquired above-market in-place lease intangibles and acquired ground lease intangibles, which are reported net of accumulated amortization of $78,776 and $67,574 at September 30, 2020 and December 31, 2019, respectively, on the accompanying Consolidated Balance Sheets. The acquired intangible liabilities represent acquired below-market in-place leases, which are reported net of accumulated amortization of $12,186 and $10,372 at September 30, 2020 and December 31, 2019, respectively, on the accompanying Consolidated Balance Sheets.
9
Assets and Liabilities Measured at Fair Value
The Financial Accounting Standards Board’s (“FASB”) guidance for fair value measurement and disclosure states that fair value is an exit price, representing the amount that would be received to sell an asset or paid to transfer a liability in an orderly transaction between market participants. As such, fair value is a market-based measurement that should be determined based on assumptions that market participants would use in pricing an asset or liability. As a basis for considering assumptions, authoritative guidance establishes a three-tier fair value hierarchy, which prioritizes the inputs used in measuring fair value as follows:
• | Level 1—Inputs are quoted prices (unadjusted) in active markets for identical assets or liabilities that we have access to at the measurement date. |
• | Level 2—Observable inputs, other than quoted prices included in Level 1 that are observable for the asset or liability, either directly or indirectly. Level 2 inputs are those in markets for which there are few transactions, the prices are not current, little public information exists or instances where prices vary substantially over time or among brokered market makers. |
• | Level 3—Unobservable inputs for the asset or liability. Unobservable inputs are those inputs that reflect our own assumptions that market participants would use to price the asset or liability based on the best available information. |
The authoritative guidance requires the disclosure of the fair value of our financial instruments for which it is practicable to estimate that value. The guidance does not apply to all balance sheet items. Market information as available or present value techniques have been utilized to estimate the amounts required to be disclosed. Since such amounts are estimates, there can be no assurance that the disclosed value of any financial instrument could be realized by immediate settlement of the instrument.
Real estate fund investments accounted for under the fair value option fall within Level 3 of the hierarchy. The fair value is recorded based upon changes in the NAV of the limited partnership as determined from the financial statements of the real estate fund. During the nine months ended September 30, 2020 and 2019, we recorded a decrease and an increase in fair value classified within the Level 3 category of $14,737 and $1,845, respectively, in our investment in the NYC Retail Portfolio (see Note 4-Unconsolidated Real Estate Affiliates and Fund Investments).
We have estimated the fair value of our mortgage notes and other debt payable reflected on the Consolidated Balance Sheets at amounts that are based upon an interpretation of available market information and valuation methodologies (including discounted cash flow analysis with regard to fixed rate debt) for similar loans made to borrowers with similar credit ratings and for the same maturities. The fair value of our mortgage notes and other debt payable using Level 2 inputs was $33,303 higher and $21,360 higher than the aggregate carrying amounts at September 30, 2020 and December 31, 2019, respectively. Such fair value estimates are not necessarily indicative of the amounts that would be realized upon disposition of our mortgage notes payable.
Derivative Financial Instruments
We record all derivatives on the Consolidated Balance Sheets at fair value in prepaid expenses and other assets or accounts payable and other accrued expenses. Changes in the fair value of our derivatives are recorded as a component of interest expense on our Consolidated Statements of Operations as we have not designated our derivative instruments as hedges. Our objective in using interest rate derivatives is to manage our exposure to interest rate movements. To accomplish this objective, we use interest rate swaps.
As of September 30, 2020, we had the following outstanding interest rate derivatives related to managing our interest rate risk:
Interest Rate Derivative | Number of Instruments | Notional Amount | ||||
Interest Rate Swaps | 6 | $ | 212,800 | |||
The fair value of our interest rate swaps represent liabilities of $7,463 and $2,140 at September 30, 2020 and December 31, 2019, respectively.
Ground Lease
As of September 30, 2020, we have a single ground lease arrangement for which we are the lessee and recorded a right-of-use asset within prepaid expenses and other assets on our Consolidated Balance Sheets in the amount of $2,151 and a lease liability within accounts payable and other liabilities on our Consolidated Balance Sheets in the amount of $2,241.
10
Use of Estimates
The preparation of consolidated financial statements in conformity with GAAP requires us to make estimates and assumptions. These estimates and assumptions impact the reported amounts of assets and liabilities and the disclosure of contingent assets and liabilities at the date of the consolidated financial statements and the reported amounts of revenues and expenses during the reporting period. For example, significant estimates and assumptions have been made with respect to useful lives of assets, recoverable amounts of receivables, fair value of derivatives and real estate assets, initial valuations and related amortization periods of deferred costs and intangibles, particularly with respect to property acquisitions. Actual results could differ from those estimates.
Recent Issued Accounting Pronouncements
In April 2020, the FASB issued a question and answer document that focused on the application of lease guidance applicable on concessions related to the effects of the COVID-19 pandemic. Per the guidance, we made an election to account for lease concessions related to the effects of the COVID-19 pandemic consistent with how those concessions would be accounted for under Topic 842, Leases, as though enforceable rights and obligations for those concessions existed.
In March 2020, the FASB issued ASU No. 2020-04, Reference Rate Reform (Topic 848), which provides guidance containing practical expedients for reference rate reform related activities that impact debt, leases, derivatives and other contracts. The guidance in ASU 2020-04 is optional and may be elected over time as reference rate reform activities occur. We will evaluate the impact of the guidance.
In June 2016, the FASB issued ASU No. 2016-13, Financial Instruments Credit Losses (Topic 326), which changes how entities measure credit losses for most financial assets and certain other instruments that are not measured at fair value through net income. The guidance replaces the current incurred loss model with an expected loss approach, resulting in more timely recognition of such losses. In November 2018, the FASB released ASU 2018-19, Codification Improvements to Topic 326, Financial Instrument - Credit Losses, which clarifies that receivables arising from operating leases are not within the scope of Subtopic 326-20. The guidance was effective for us as of January 1, 2020 and did not have a material impact on our consolidated financial statements.
NOTE 3—PROPERTY
The primary reason we make acquisitions of real estate investments in the apartment, industrial, office, retail and other property sectors is to invest capital contributed by stockholders in a diversified portfolio of real estate assets. All references to square footage and units are unaudited.
Acquisitions
On January 29, 2020, we acquired Milford Crossing, a 159,000 square foot, grocery-anchored retail center located in Milford, Massachusetts, for approximately $42,000. The acquisition was funded with cash on hand.
On February 6, 2020, we acquired Fountainhead Corporate Park, a 295,000 square foot, two-building Class A office portfolio comprised of two six-story buildings located in the Phoenix, Arizona submarket of Tempe for approximately $61,500. The acquisition was funded with cash on hand.
We allocated the purchase price for our 2020 acquisitions in accordance with authoritative guidance as follows:
2020 Acquisitions | |||
Land | $ | 7,066 | |
Building and equipment | 67,224 | ||
In-place lease intangible (acquired intangible assets) | 29,712 | ||
Above-market lease intangible (acquired intangible assets) | 71 | ||
Below-market lease intangible (acquired intangible liabilities) | (2,318 | ) | |
$ | 101,755 | ||
Amortization period for intangible assets and liabilities | 5 - 154 months | ||
Disposition
On March 27, 2020, we sold 24823 Anza Drive, a 31,000 square foot industrial property located in Santa Clarita, CA for approximately $5,600 less closing costs. We recorded a gain on the sale of the property in the amount of $1,724.
11
NOTE 4—UNCONSOLIDATED REAL ESTATE AFFILIATES AND FUND INVESTMENTS
Unconsolidated Real Estate Affiliates
In addition to investments in consolidated properties, we may make investments in real estate which are classified as unconsolidated real estate affiliates under GAAP. The following represent our unconsolidated real estate affiliates as of September 30, 2020 and December 31, 2019.
Carrying Amount of Investment | ||||||||||||||
Property | Property Type | Location | Acquisition Date | September 30, 2020 | December 31, 2019 | |||||||||
Chicago Parking Garage | Other | Chicago, IL | December 23, 2014 | $ | 15,652 | $ | 15,741 | |||||||
Pioneer Tower | Office | Portland, OR | June 28, 2016 | 107,654 | 109,653 | |||||||||
The Tremont | Apartment | Burlington, MA | July 19, 2018 | 21,526 | 21,571 | |||||||||
The Huntington | Apartment | Burlington, MA | July 19, 2018 | 11,693 | 12,323 | |||||||||
Total | $ | 156,525 | $ | 159,288 | ||||||||||
Summarized Combined Statements of Operations—Unconsolidated Real Estate Affiliates—Equity Method Investments
Three Months Ended September 30, 2020 | Three Months Ended September 30, 2019 | Nine Months Ended September 30, 2020 | Nine Months Ended September 30, 2019 | ||||||||||||
Total revenues | $ | 3,920 | $ | 4,581 | $ | 12,188 | $ | 13,997 | |||||||
Total operating expenses | 4,030 | 3,749 | 12,038 | 11,658 | |||||||||||
Operating income | $ | (110 | ) | $ | 832 | $ | 150 | $ | 2,339 | ||||||
Interest expense | 531 | 532 | 1,599 | 1,606 | |||||||||||
Net (loss) income | $ | (641 | ) | $ | 300 | $ | (1,449 | ) | $ | 733 | |||||
Real Estate Fund Investment
NYC Retail Portfolio
On December 8, 2015, a wholly-owned subsidiary of the Company acquired an approximate 28% interest in a newly formed limited partnership, Madison NYC Core Retail Partners, L.P., which acquired an approximate 49% interest in entities that initially owned 15 retail properties located in the greater New York City area (the “NYC Retail Portfolio”), the result of which is that we own an approximate 14% interest in the NYC Retail Portfolio. The purchase price for such portion was approximately $85,600 including closing costs. As of September 30, 2020, the NYC Retail Portfolio owned 8 retail properties totaling approximately 1,938,000 square feet across urban infill locations in Manhattan, Brooklyn, Queens and New Jersey.
At acquisition we made the election to account for our interest in the NYC Retail Portfolio under the fair value option. This fair value election was made as the investment is in the form of a commingled fund with institutional partners where fair value accounting provides the most relevant information about the financial condition of the investment. We record increases and decreases in our investment each reporting period based on the change in the fair value of the investment as estimated by the general partner. Critical inputs to NAV estimates include valuations of the underlying real estate assets, which incorporate investment-specific assumptions such as discount rates, capitalization rates and rental growth rates. We did not consider adjustments to NAV estimates provided by the general partner, including adjustments for any restrictions to the transferability of ownership interests embedded within the investment agreement to which we are a party, to be necessary based upon (1) our understanding of the methodology utilized and inputs incorporated to estimate NAV at the investment level, (2) consideration of market demand for the retail assets held by the venture, and (3) contemplation of real estate and capital markets conditions in the localities in which the venture operates. We have no unfunded commitments. Our investment in the NYC Retail Portfolio is presented on our Consolidated Balance Sheets within real estate fund investment. Changes in the fair value of our investment as well as cash distributions received are recorded on our Consolidated Statements of Operations within income from unconsolidated real estate affiliates and fund investments. As of September 30, 2020 and December 31, 2019, the carrying amount of our investment in the NYC Retail Portfolio was $80,323 and $93,400, respectively. During the three and nine months ended September 30, 2020, we recorded a decrease in fair value of our investment in the NYC Retail Portfolio of $2,648 and $14,737, respectively, and received no cash distributions. During the three and nine months ended September 30, 2020, we made a $1,660 capital contribution to Madison NYC Core Retail Partners, L.P. On March 4, 2020, a retail property in the NYC Retail Portfolio with a square footage of 74,000 was sold and the mortgage loan was extinguished. During the three and nine months ended September 30, 2019, we recorded a decrease and an increase in fair value of our investment in the NYC Retail Portfolio of $510 and $1,845, respectively. During the three and nine months ended September 30, 2019, we received
12
distributions of income totaling $431 and $1,479, respectively. The cash distributions increased income from unconsolidated real estate affiliates and fund investments. During the three and nine months ended September 30, 2019, we received return of capital distributions of $1,034 and $3,248, respectively. On January 7, 2019, two retail properties in the NYC Retail Portfolio with a combined 148,000 square feet were sold and the mortgage loans were extinguished. On June 28, 2019, a 218,000 square foot property within the NYC Retail Portfolio was relinquished to the lender and its mortgage loan was extinguished.
Summarized Statement of Operations—NYC Retail Portfolio Investment—Fair Value Option Investment
Three Months Ended September 30, 2020 | Three Months Ended September 30, 2019 | Nine Months Ended September 30, 2020 | Nine Months Ended September 30, 2019 | ||||||||||||
Total revenue | $ | 313 | $ | 1,153 | $ | 2,247 | $ | 5,423 | |||||||
Net investment income | (174 | ) | 746 | 736 | 4,213 | ||||||||||
Net change in unrealized (loss) gain on investment in real estate venture | (9,570 | ) | (1,845 | ) | (53,243 | ) | 6,653 | ||||||||
Net (loss) income | $ | (9,744 | ) | $ | (1,099 | ) | $ | (52,507 | ) | $ | 10,866 | ||||
NOTE 5—MORTGAGE NOTES AND OTHER DEBT PAYABLE
Mortgage notes and other debt payable have various maturities through 2054 and consist of the following:
Mortgage notes and other debt payable | Maturity Date | Interest Rate | Amount payable as of | |||||||||
September 30, 2020 | December 31, 2019 | |||||||||||
Mortgage notes payable (1) (2) (3) | March 1, 2021- March 1, 2038 | 3.00% - 5.30% | $ | 691,012 | $ | 743,135 | ||||||
Credit facility | ||||||||||||
Revolving line of credit | May 25, 2021 | 1.55% - 3.99% | 100,000 | — | ||||||||
Term loans | May 25, 2023 | 3.10% | 100,000 | 100,000 | ||||||||
TOTAL | $ | 891,012 | $ | 843,135 | ||||||||
Net debt discount on assumed debt and debt issuance costs | (3,309 | ) | (6,317 | ) | ||||||||
Mortgage notes and other debt payable, net | $ | 887,703 | $ | 836,818 | ||||||||
________
(1) | On March 31, 2020, we entered into a $35,900 mortgage payable on Summit at San Marcos. The mortgage note is interest only at a rate of 3.28% and matures on April 1, 2030. |
(2) | On August 27, 2020, we repaid the mortgage note payable related to Suwanee Distribution Center in the amount of $19,135. |
(3) | On September 29, 2020, we repaid the mortgage note payable related to The Penfield in the amount of $37,957. |
Aggregate future principal payments of mortgage notes and other debt payable as of September 30, 2020 are as follows:
Year | Amount | |||
2020 | $ | 1,327 | ||
2021 | 128,837 | |||
2022 | 7,267 | |||
2023 | 229,326 | |||
2024 | 40,526 | |||
Thereafter | 483,729 | |||
Total | $ | 891,012 | ||
13
Credit Facility
On May 26, 2017, we entered into a credit agreement providing for a $250,000 revolving line of credit and unsecured term loan with a syndicate of six lenders led by JPMorgan Chase Bank, N.A., Bank of America, N.A., and PNC Bank, National Association. The $250,000 credit facility (the "Credit Facility") consists of a $200,000 revolving line of credit (the “Revolving Line of Credit”) and a $50,000 term loan. On August 4, 2017, we expanded our Credit Facility to $300,000. The additional $50,000 borrowing was in the form of a five-year term loan maturing on May 26, 2022. We collectively refer to the two term loans as the "Term Loans". On December 12, 2018, we expanded and extended our Credit Facility to provide for a borrowing capacity of $400,000, by increasing our Revolving Line of Credit to $300,000 with a new maturity date of May 25, 2021. We also extended our Term Loans by one year with new maturity dates of May 25, 2023. The primary interest rate is based on LIBOR, plus a margin ranging from 1.25% to 2.00% depending on our leverage ratio or alternatively, we can choose to borrow at a “base rate” equal to (i) the highest of (a) the Federal Funds Rate plus 0.5%, (b) the prime rate announced by JPMorgan Chase Bank, N.A., and (c) LIBOR plus 1.0%, plus (ii) a margin ranging from 0.25% to 1.00% for base rate loans. The maturity date of the Revolving Line of Credit is May 25, 2021 and contains two 12-month extension options that we may exercise upon (i) payment of an extension fee equal to 0.15% of the gross capacity under the Revolving Line of Credit at the time of the extension, and (ii) compliance with the other conditions set forth in the credit agreement. We intend to use the Revolving Line of Credit to cover short-term capital needs, for new property acquisitions and working capital. We may not draw funds on our Credit Facility if we (i) experience a material adverse effect, which is defined to include, among other things, (a) a material adverse effect on the business, assets, operations or financial condition of the Company taken as a whole; (b) the inability of any loan party to perform any of its obligations under any loan document; or (c) a material adverse effect upon the validity or enforceability of any loan document or (ii) are in default, as that term is defined in the agreement, including a default under certain other loan agreements and/or guarantees entered into by us or our subsidiaries. As of September 30, 2020, we believe no material adverse effects had occurred.
Borrowings under the Credit Facility are guaranteed by us and certain of our subsidiaries. The Credit Facility requires the maintenance of certain financial covenants, including: (i) unencumbered property pool leverage ratio; (ii) debt service coverage ratio; (iii) maximum total leverage ratio; (iv) fixed charges coverage ratio; (v) minimum NAV; (vi) maximum secured debt ratio; (vii) maximum secured recourse debt ratio; (viii) maximum permitted investments; and (ix) unencumbered property pool criteria. The Credit Facility provides the flexibility to move assets in and out of the unencumbered property pool during the term of the Credit Facility.
At September 30, 2020, we had $100,000 outstanding under the Revolving Line of Credit at LIBOR plus 1.35% and $100,000 outstanding under the Term Loans at LIBOR plus 1.30%. We swapped the LIBOR portion of our $100,000 in Term Loans to a blended fixed rate of 1.80% (all in rate of 3.10% at September 30, 2020) and swapped $50,000 of the Revolving Line of Credit to a fixed rate of 2.64% (all in rate of 3.99%) at September 30, 2020.
Covenants
At September 30, 2020, we were in compliance with all debt covenants.
Debt Issuance Costs
Debt issuance costs are capitalized, and presented net of mortgage notes and other debt payable, and amortized over the terms of the respective agreements as a component of interest expense. Accumulated amortization of debt issuance costs at September 30, 2020 and December 31, 2019 was $6,403 and $5,993, respectively.
14
NOTE 6—COMMON STOCK
We have five classes of common stock: Class A, Class M, Class A-I, Class M-I, and Class D. The fees payable to LaSalle Investment Management Distributors, LLC, an affiliate of our Advisor and the dealer manager for our offerings (the "Dealer Manager"), with respect to each outstanding share of each class, as a percentage of NAV, are as follows:
Selling Commission (1) | Dealer Manager Fee (2) | |||
Class A Shares | up to 3.0% | 0.85% | ||
Class M Shares | — | 0.30% | ||
Class A-I Shares | up to 1.5% | 0.30% | ||
Class M-I Shares | — | None | ||
Class D Shares (3) | up to 1.0% | None | ||
________
(1) | Selling commissions are paid on the date of sale of our common stock. |
(2) | We accrue all future dealer manager fees up to the ten percent regulatory limitation as accrued offering costs on our Consolidated Balance Sheets on the date of sale of our common stock. For NAV calculation purposes, dealer manager fees are accrued daily, on a continuous basis equal to 1/365th of the stated fee. Each Class A, Class M and Class A-I share sold in a public offering will automatically convert into the number of Class M-I shares based on the then-current applicable NAV of each class on the date following the termination of the primary portion of such public offering in which we, with the assistance of the Dealer Manager, determine that total underwriting compensation paid with respect to such public offering equals 10% of the gross proceeds from the primary portion of such public offering. |
(3) | Shares of Class D common stock are only being offered pursuant to a private offering. |
The selling commissions and dealer manager fees are offering costs and are recorded as a reduction of additional paid in capital.
Stock Transactions
The stock transactions for each of our classes of common stock for the nine months ended September 30, 2020 were as follows:
Shares of Class A Common Stock | Shares of Class M Common Stock | Shares of Class A-I Common Stock | Shares of Class M-I Common Stock | Shares of Class D Common Stock | ||||||||||
Balance, December 31, 2019 | 88,007,721 | 39,036,770 | 11,153,567 | 22,589,599 | 4,957,915 | |||||||||
Issuance of common stock | 11,288,342 | 1,835,412 | 255,885 | 8,864,110 | — | |||||||||
Repurchase of common stock | (9,801,926 | ) | (4,401,214 | ) | (1,832,057 | ) | (2,561,855 | ) | — | |||||
Share conversions | (116,398 | ) | (734,839 | ) | 27,219 | 823,151 | — | |||||||
Balance, September 30, 2020 | 89,377,739 | 35,736,129 | 9,604,614 | 29,715,005 | 4,957,915 | |||||||||
Stock Issuances
The stock issuances for our classes of common stock, including those issued through our distribution reinvestment plan, for the nine months ended September 30, 2020 were as follows:
Nine Months Ended September 30, 2020 | ||||||
# of shares | Amount | |||||
Class A Shares | 11,288,342 | $ | 137,720 | |||
Class M Shares | 1,835,412 | 22,075 | ||||
Class A-I Shares | 255,885 | 3,059 | ||||
Class M-I Shares | 8,864,110 | 107,428 | ||||
Total | $ | 270,282 | ||||
15
Share Repurchase Plan
Our share repurchase plan allows stockholders, subject to a one-year holding period, with certain exceptions, to request that we repurchase all or a portion of their shares of common stock on a daily basis at that day's NAV per share, limited to 5% of aggregate Company NAV per quarter. For the nine months ended September 30, 2020, we repurchased 18,597,052 shares of common stock in the amount of $223,101. During the nine months ended September 30, 2019, we repurchased 6,119,193 shares of common stock in the amount of $74,205.
Distribution Reinvestment Plan
Pursuant to our distribution reinvestment plan, holders of shares of any class of our common stock may elect to have their cash distributions reinvested in additional shares of our common stock at the NAV per share applicable to the class of shares being purchased on the distribution date. For the nine months ended September 30, 2020, we issued 4,505,845 shares of common stock for $53,669 under the distribution reinvestment plan. For the nine months ended September 30, 2019, we issued 2,758,804 shares of common stock for $33,574 under the distribution reinvestment plan.
Earnings Per Share
We compute net income per share for Class A, Class M, Class A-I, Class M-I and Class D common stock using the two-class method. Our Advisor may earn a performance fee (see Note 9-Related Party Transactions), which may impact the net income of each class of common stock differently. In periods where no performance fee is recognized in our Consolidated Statements of Operations and Comprehensive Income, the net income per share will be the same for each class of common stock.
Basic and diluted net income per share for each class of common stock is computed using the weighted-average number of common shares outstanding during the period for each class of common stock. We have not issued any dilutive or potentially dilutive securities, and thus the basic and diluted net income per share for a given class of common stock is the same for each period presented.
16
The following table sets forth the computation of basic and diluted net income per share for each of our Class A, Class M, Class A-I, Class M-I and Class D common stock:
Three Months Ended September 30, 2020 | |||||||||||||||||||
Class A | Class M | Class A-I | Class M-I | Class D | |||||||||||||||
Basic and diluted net loss per share: | |||||||||||||||||||
Allocation of net loss per share before performance fee | $ | (5,346 | ) | $ | (2,147 | ) | $ | (579 | ) | $ | (1,753 | ) | $ | (297 | ) | ||||
Weighted average number of common shares outstanding | 89,432,854 | 35,897,894 | 9,686,983 | 29,313,769 | 4,957,915 | ||||||||||||||
Basic and diluted net loss per share: | $ | (0.06 | ) | $ | (0.06 | ) | $ | (0.06 | ) | $ | (0.06 | ) | $ | (0.06 | ) | ||||
Nine Months Ended September 30, 2020 | |||||||||||||||||||
Class A | Class M | Class A-I | Class M-I | Class D | |||||||||||||||
Basic and diluted net income per share: | |||||||||||||||||||
Allocation of net income per share before performance fee | $ | (19,529 | ) | $ | (8,009 | ) | $ | (2,213 | ) | $ | (6,055 | ) | $ | (1,069 | ) | ||||
Weighted average number of common shares outstanding | 90,409,712 | 37,074,115 | 10,240,781 | 28,024,648 | 4,957,915 | ||||||||||||||
Basic and diluted net income per share: | $ | (0.22 | ) | $ | (0.22 | ) | $ | (0.22 | ) | $ | (0.22 | ) | $ | (0.22 | ) | ||||
Three Months Ended September 30, 2019 | |||||||||||||||||||
Class A | Class M | Class A-I | Class M-I | Class D | |||||||||||||||
Basic and diluted net loss per share: | |||||||||||||||||||
Allocation of net loss per share before performance fee | $ | (2,549 | ) | $ | (1,297 | ) | $ | (347 | ) | $ | (521 | ) | $ | (168 | ) | ||||
Weighted average number of common shares outstanding | 80,893,908 | 41,160,669 | 10,999,848 | 16,534,267 | 5,352,203 | ||||||||||||||
Basic and diluted net loss per share: | $ | (0.03 | ) | $ | (0.03 | ) | $ | (0.03 | ) | $ | (0.03 | ) | $ | (0.03 | ) | ||||
Nine Months ended September 30, 2019 | |||||||||||||||||||
Class A | Class M | Class A-I | Class M-I | Class D | |||||||||||||||
Basic and diluted net income per share: | |||||||||||||||||||
Allocation of net income per share before performance fee | $ | 51,422 | $ | 27,403 | $ | 7,417 | $ | 8,930 | $ | 3,718 | |||||||||
Weighted average number of common shares outstanding | 76,412,271 | 40,725,377 | 11,022,039 | 13,276,049 | 5,518,210 | ||||||||||||||
Basic and diluted net income per share: | $ | 0.67 | $ | 0.67 | $ | 0.67 | $ | 0.67 | $ | 0.67 | |||||||||
Organization and Offering Costs
Organization and offering costs include, but are not limited to, legal, accounting, printing fees and personnel costs of our Advisor attributable to our organization, preparation of the registration statement, registration and qualification of our common stock for sale with the SEC, or in a private placement, and in the various states and filing fees incurred by our Advisor. LaSalle agreed to fund our organization and offering expenses for the Second Extended Public Offering until July 6, 2018, the day the registration statement was declared effective by the SEC, following which time we commenced reimbursing LaSalle over 36 months. Following the Second Extended Public Offering commencement date, we began paying directly or reimbursing LaSalle if it pays on our behalf any organization and offering costs incurred during the Second Extended Public Offering period (other than selling commissions and dealer manager fees) as and when incurred. After the termination of the Second Extended Public Offering, LaSalle has agreed to reimburse us to the extent that the organization and offering costs that we incur exceed 15% of our gross proceeds from the Second Extended Public Offering. Organization costs are expensed, whereas offering costs are recorded as a reduction of capital in excess of par value. As of September 30, 2020 and December 31, 2019, LaSalle had paid $1,402 and $1,775, respectively, of organization and offering costs on our behalf which we had not yet reimbursed. These costs are included in accrued offering costs on the Consolidated Balance Sheets.
17
NOTE 7—DST PROGRAM
On October 16, 2019, we, through our operating partnership, initiated the DST Program to raise up to $500,000 in private placements through the sale of beneficial interests in specific Delaware statutory trusts (“DST”) holding DST Properties, which may be sourced from our existing portfolio or from newly acquired properties sourced from third parties. Each DST Property will be leased back by a wholly owned subsidiary of our operating partnership on a long-term basis of up to ten years pursuant to a master lease agreement. The master lease agreements are expected to be guaranteed by our operating partnership. As compensation for the master lease guarantee, our operating partnership will retain a fair market value purchase option giving it the right, but not the obligation, to acquire the beneficial interests in the DST from the investors at any time after two years from the closing of the applicable DST offering in exchange for operating partnership units or cash, at our discretion.
The sale of beneficial interests in the DST Property will be accounted for as a failed sale-leaseback transaction due to the fair market value purchase option retained by the operating partnership and as such, the property will remain on our books and records. The proceeds received from each DST offering will be accounted for as a financing obligation on the Consolidated Balance Sheets. Upfront costs incurred for services provided to the DST totaling $466 are accounted for as deferred loan costs and are netted against the financing obligation.
Under the master lease, we are responsible for subleasing the DST Property to tenants, for covering all costs associated with operating the underlying DST Property, and for paying base rent to the DST that owns such property. For financial reporting purposes (and not for income tax purposes), the DST Properties are included in our consolidated financial statements, with the master lease rent payments accounted for using the interest method whereby a portion is accounted for as interest expense and a portion is accounted for as a reduction of the outstanding principal balance of the financing obligation. For financial reporting purposes, the rental revenues and rental expenses associated with the underlying property of each master lease are included in the respective line items on our Consolidated Statements of Operations and Comprehensive Income. The net amount we receive from the underlying DST Properties may be more or less than the amount we pay to the investors in the specific DST and could fluctuate over time.
As of September 30, 2020, we have sold approximately $55,785 in interests related to the DST Program.
NOTE 8—RENTALS UNDER OPERATING LEASES
We receive rental income from operating leases. The minimum future rentals from consolidated properties based on operating leases in place at September 30, 2020 are as follows:
Year | Amount | |||
2020 | $ | 39,218 | ||
2021 | 123,025 | |||
2022 | 96,945 | |||
2023 | 83,981 | |||
2024 | 71,894 | |||
Thereafter | 238,834 | |||
Total | $ | 653,897 | ||
Minimum future rentals do not include amounts payable by certain tenants based upon a percentage of their gross sales or as reimbursement of property operating expenses. During the three and nine months ended September 30, 2020, no individual tenant accounted for greater than 10% of minimum base rents.
18
NOTE 9—RELATED PARTY TRANSACTIONS
Pursuant to our Advisory Agreement with LaSalle, we pay a fixed advisory fee of 1.25% of our NAV calculated daily. The Advisory Agreement allows for a performance fee to be earned for each share class based on the total return of that share class during the calendar year. The performance fee is calculated as 10% of the return in excess of 7% per annum. The term of our Advisory Agreement expires June 5, 2021, subject to an unlimited number of successive one year renewals.
Fixed advisory fees for the three and nine months ended September 30, 2020 were $6,192 and $19,049, respectively. The fixed advisory fees for the three and nine months ended September 30, 2019 were $5,956 and $16,730, respectively. There were no performance fees for the nine months ended September 30, 2020 and 2019. Included in Advisor fees payable at September 30, 2020 was $2,016 of fixed advisory fee expense. Included in Advisor fees payable for the year ended December 31, 2019 was $2,169 of fixed advisory fee expense.
We pay Jones Lang LaSalle Americas, Inc. (“JLL Americas”), an affiliate of our Advisor, for property management, construction management, leasing, mortgage brokerage and sales brokerage services performed at various properties we own. For the three and nine months ended September 30, 2020, JLL Americas was paid $163 and $565, respectively, for property management and leasing services. For the three and nine months ended September 30, 2019, JLL Americas was paid $201 and $1,015, respectively, for property management and leasing services. During the three and nine months ended September 30, 2020, we paid JLL Americas $0 and $75, respectively, in sales brokerage fees. During the three and nine months ended September 30, 2019, we paid JLL Americas $203 in debt brokerage fees related to the note payable for Stonemeadow Farms.
We pay the Dealer Manager selling commissions and dealer manager fees in connection with our offerings. For the three and nine months ended September 30, 2020, we paid the Dealer Manager selling commissions and dealer manager fees totaling $2,530 and $8,708, respectively. For the three and nine months ended September 30, 2019, we paid the Dealer Manager selling commissions and dealer manager fees totaling $3,280 and $8,842, respectively. A majority of the selling commissions and dealer manager fees are reallowed to participating broker-dealers. Included in accrued offering costs, at September 30, 2020 and December 31, 2019, were $102,645 and $93,450 of future dealer manager fees payable, respectively.
As of September 30, 2020 and December 31, 2019, we owed $1,402 and $1,775, respectively, for organization and offering costs paid by LaSalle (see Note 6-Common Stock). These costs are included in accrued offering costs.
LaSalle Investment Management Distributors, LLC also serves as the dealer manager for the DST Program on a “best efforts” basis. Our taxable REIT subsidiary, which is a wholly owned subsidiary of our operating partnership, will pay the Dealer Manager upfront selling commissions, upfront dealer manager fees and placement fees of up to 5.0%, 1.0% and 1.0%, respectively, of the gross purchase price per unit of beneficial interest sold in the DST Program. All upfront selling commissions and upfront dealer manager fees are reallowed to participating broker-dealers. For the three and nine months ended September 30, 2020, the taxable REIT subsidiary paid $662 and $1,574, respectively, to the Dealer Manager. In addition, the Dealer Manager may receive an ongoing investor servicing fee that is calculated daily on a continuous basis from year to year equal to 1/365th of (a) 0.25% of the total equity of each outstanding unit of beneficial interest for such day, payable by the Delaware statutory trusts; (b) 0.85% of the NAV of each outstanding Class A operating partnership unit, 0.30% of the NAV of each outstanding Class M operating partnership or 0.30% of the NAV of each outstanding Class A-I operating partnership unit for such day issued in connection with our operating partnership's fair market value purchase option, payable by our operating partnership; and (c) 0.85% of the NAV of each outstanding Class A share, 0.30% of the NAV of each outstanding Class M share or 0.30% of the NAV of each outstanding Class A-I share for such day issued in connection with the investors' redemption right, payable by us. The investor servicing fee may continue for so long as the investor in the DST Program holds beneficial interests, Class A, Class M and Class A-I operating partnership units or Class A, Class M and Class A-I shares that were issued in connection with the DST Program. No investor servicing fee will be paid on Class M-I operating partnership units or Class M-I shares. For the three and nine months ended September 30, 2020, the Delaware statutory trust paid $28 and $46, respectively, in investor servicing fees to the Dealer Manager in connection with the DST Program.
LaSalle also serves as the manager for the DST Program. Each Delaware statutory trust may pay the manager a management fee equal to a to-be-agreed upon percentage of the total equity of such Delaware statutory trust. For the three and nine months ended September 30, 2020, the Delaware statutory trusts paid $20 and $30, respectively, in management fees to our Advisor in connection with the DST Program.
19
NOTE 10—COMMITMENTS AND CONTINGENCIES
We are involved in various claims and litigation matters arising in the ordinary course of business, some of which involve claims for damages. Many of these matters are covered by insurance, although they may nevertheless be subject to deductibles or retentions. Although the ultimate liability for these matters cannot be determined, based upon information currently available, we believe the ultimate resolution of such claims and litigation will not have a material adverse effect on our financial position, results of operations or liquidity.
From time to time, we have entered into contingent agreements for the acquisition and financing of properties. Such acquisitions and financings are subject to satisfactory completion of due diligence or meeting certain leasing or occupancy thresholds.
We are subject to fixed ground lease payments on South Beach Parking Garage of $100 per year until September 30, 2021, which will increase every five years thereafter by the lesser of 12% or the cumulative CPI over the previous five year period. We are also subject to a variable ground lease payment calculated as 2.5% of revenue. The lease expires September 30, 2041 and has a ten-year renewal option.
The operating agreement for Presley Uptown allows the unrelated third party joint venture partner, owning a 2.5% interest, to put its interest to us at a market determined value starting September 30, 2022 until September 30, 2024.
NOTE 11—SEGMENT REPORTING
We have five reportable operating segments: apartment, industrial, office, retail and other properties. Consistent with how our chief operating decision makers evaluate performance and manage our properties, the financial information summarized below is presented by operating segment and reconciled to net income for the three and nine months ended September 30, 2020 and 2019.
20
Apartment | Industrial | Office | Retail | Other | Total | ||||||||||||||||||
Assets as of September 30, 2020 | $ | 790,631 | $ | 577,099 | $ | 282,262 | $ | 582,995 | $ | 22,075 | $ | 2,255,062 | |||||||||||
Assets as of December 31, 2019 | 797,923 | 587,321 | 225,352 | 549,918 | 22,350 | 2,182,864 | |||||||||||||||||
Three Months Ended September 30, 2020 | |||||||||||||||||||||||
Capital expenditures by segment | $ | 1,067 | $ | 837 | $ | 651 | $ | 123 | $ | — | $ | 2,678 | |||||||||||
Revenues: | |||||||||||||||||||||||
Rental revenue | $ | 15,594 | $ | 12,934 | $ | 6,931 | $ | 11,436 | $ | 75 | $ | 46,970 | |||||||||||
Other revenue | 1,030 | 134 | 326 | 278 | 299 | 2,067 | |||||||||||||||||
Total revenues | $ | 16,624 | $ | 13,068 | $ | 7,257 | $ | 11,714 | $ | 374 | $ | 49,037 | |||||||||||
Operating expenses: | |||||||||||||||||||||||
Real estate taxes | $ | 3,012 | $ | 2,067 | $ | 875 | $ | 1,525 | $ | 93 | $ | 7,572 | |||||||||||
Property operating expenses | 5,225 | 1,062 | 1,635 | 1,879 | 174 | 9,975 | |||||||||||||||||
Total segment operating expenses | $ | 8,237 | $ | 3,129 | $ | 2,510 | $ | 3,404 | $ | 267 | $ | 17,547 | |||||||||||
Reconciliation to net income | |||||||||||||||||||||||
Property general and administrative | $ | 728 | |||||||||||||||||||||
Advisor fees | 6,192 | ||||||||||||||||||||||
Company level expenses | 693 | ||||||||||||||||||||||
Depreciation and amortization | 18,830 | ||||||||||||||||||||||
Total operating expenses | $ | 43,990 | |||||||||||||||||||||
Other income and (expenses): | |||||||||||||||||||||||
Interest expense | $ | (8,391 | ) | ||||||||||||||||||||
Loss from unconsolidated real estate affiliates and fund investment | (3,289 | ) | |||||||||||||||||||||
Loss on disposition of property and extinguishment of debt, net | (3,480 | ) | |||||||||||||||||||||
Total other income and (expenses) | $ | (15,160 | ) | ||||||||||||||||||||
Net loss | $ | (10,113 | ) | ||||||||||||||||||||
Reconciliation to total consolidated assets as of September 30, 2020 | |||||||||||||||||||||||
Assets per reportable segments | $ | 2,255,062 | |||||||||||||||||||||
Investment in unconsolidated real estate affiliates, real estate fund investment and corporate level assets | 282,918 | ||||||||||||||||||||||
Total consolidated assets | $ | 2,537,980 | |||||||||||||||||||||
Reconciliation to total consolidated assets as of December 31, 2019 | |||||||||||||||||||||||
Assets per reportable segments | 2,182,864 | ||||||||||||||||||||||
Investment in unconsolidated real estate affiliates, real estate fund investment and corporate level assets | 348,645 | ||||||||||||||||||||||
Total consolidated assets | $ | 2,531,509 | |||||||||||||||||||||
21
Apartment | Industrial | Office | Retail | Other | Total | ||||||||||||||||||
Three Months Ended September 30, 2019 | |||||||||||||||||||||||
Capital expenditures by segment | $ | 2,333 | $ | 1,761 | $ | 231 | $ | 879 | $ | — | $ | 5,204 | |||||||||||
Revenues: | |||||||||||||||||||||||
Rental revenue | $ | 14,881 | $ | 11,779 | $ | 5,176 | $ | 11,308 | $ | 71 | $ | 43,215 | |||||||||||
Other revenue | 748 | 1 | 196 | 106 | 519 | 1,570 | |||||||||||||||||
Total revenues | $ | 15,629 | $ | 11,780 | $ | 5,372 | $ | 11,414 | $ | 590 | $ | 44,785 | |||||||||||
Operating expenses: | |||||||||||||||||||||||
Real estate taxes | $ | 2,715 | $ | 1,928 | $ | 586 | $ | 1,175 | $ | 107 | $ | 6,511 | |||||||||||
Property operating expenses | 4,535 | 894 | 1,047 | 1,811 | 179 | 8,466 | |||||||||||||||||
Total segment operating expenses | $ | 7,250 | $ | 2,822 | $ | 1,633 | $ | 2,986 | $ | 286 | $ | 14,977 | |||||||||||
Reconciliation to net income | |||||||||||||||||||||||
Property general and administrative | $ | 497 | |||||||||||||||||||||
Advisor fees | 5,956 | ||||||||||||||||||||||
Company level expenses | 1,057 | ||||||||||||||||||||||
Depreciation and amortization | 18,232 | ||||||||||||||||||||||
Total operating expenses | $ | 40,719 | |||||||||||||||||||||
Other income and (expenses): | |||||||||||||||||||||||
Interest expense | $ | (8,902 | ) | ||||||||||||||||||||
Income from unconsolidated real estate affiliates and fund investment | 221 | ||||||||||||||||||||||
Loss on disposition of property and extinguishment of debt, net | (236 | ) | |||||||||||||||||||||
Total other income and (expenses) | $ | (8,917 | ) | ||||||||||||||||||||
Net loss | $ | (4,851 | ) | ||||||||||||||||||||
22
Apartments | Industrial | Office | Retail | Other | Total | ||||||||||||||||||
Nine Months Ended September 30, 2020 | |||||||||||||||||||||||
Capital expenditures by segment | $ | 2,796 | $ | 1,652 | $ | 2,112 | $ | 972 | $ | — | $ | 7,532 | |||||||||||
Revenues: | |||||||||||||||||||||||
Rental revenue | $ | 47,874 | $ | 36,816 | $ | 20,244 | $ | 34,218 | $ | 218 | $ | 139,370 | |||||||||||
Other revenue | 2,543 | 323 | 983 | 490 | 904 | 5,243 | |||||||||||||||||
Total revenues | $ | 50,417 | $ | 37,139 | $ | 21,227 | $ | 34,708 | $ | 1,122 | $ | 144,613 | |||||||||||
Operating expenses: | |||||||||||||||||||||||
Real estate taxes | $ | 8,845 | $ | 6,193 | $ | 2,581 | $ | 4,535 | $ | 265 | $ | 22,419 | |||||||||||
Property operating expenses | 14,278 | 3,045 | 4,289 | 5,408 | 534 | 27,554 | |||||||||||||||||
Total segment operating expenses | $ | 23,123 | $ | 9,238 | $ | 6,870 | $ | 9,943 | $ | 799 | $ | 49,973 | |||||||||||
Reconciliation to net income | |||||||||||||||||||||||
Property general and administrative | $ | 3,609 | |||||||||||||||||||||
Advisor fees | 19,049 | ||||||||||||||||||||||
Company level expenses | 2,241 | ||||||||||||||||||||||
Depreciation and amortization | 56,450 | ||||||||||||||||||||||
Total operating expenses | $ | 131,322 | |||||||||||||||||||||
Other income and (expenses): | |||||||||||||||||||||||
Interest expense | $ | (32,191 | ) | ||||||||||||||||||||
Income from unconsolidated real estate affiliates and fund investments | (16,186 | ) | |||||||||||||||||||||
Loss on disposition of property and extinguishment of debt, net | (1,772 | ) | |||||||||||||||||||||
Total other income and (expenses) | $ | (50,149 | ) | ||||||||||||||||||||
Net loss | $ | (36,858 | ) | ||||||||||||||||||||
23
Apartments | Industrial | Office | Retail | Other | Total | ||||||||||||||||||
Nine Months Ended September 30, 2019 | |||||||||||||||||||||||
Capital expenditures by segment | $ | 5,253 | $ | 3,724 | $ | 238 | $ | 5,253 | $ | 16 | $ | 14,484 | |||||||||||
Revenues: | |||||||||||||||||||||||
Rental revenue | $ | 40,966 | $ | 32,686 | $ | 13,713 | $ | 33,883 | $ | 239 | $ | 121,487 | |||||||||||
Other revenue | 2,304 | 369 | 226 | 655 | 1,749 | 5,303 | |||||||||||||||||
Total revenues | $ | 43,270 | $ | 33,055 | $ | 13,939 | $ | 34,538 | $ | 1,988 | $ | 126,790 | |||||||||||
Operating expenses: | |||||||||||||||||||||||
Real estate taxes | $ | 7,493 | $ | 5,270 | $ | 1,411 | $ | 3,827 | $ | 346 | $ | 18,347 | |||||||||||
Property operating expenses | 11,890 | 2,538 | 2,613 | 5,301 | 550 | 22,892 | |||||||||||||||||
Total segment operating expenses | $ | 19,383 | $ | 7,808 | $ | 4,024 | $ | 9,128 | $ | 896 | $ | 41,239 | |||||||||||
Reconciliation to net income | |||||||||||||||||||||||
Property general and administrative | $ | 1,230 | |||||||||||||||||||||
Advisor fees | 16,730 | ||||||||||||||||||||||
Company level expenses | 2,476 | ||||||||||||||||||||||
Depreciation and amortization | 48,025 | ||||||||||||||||||||||
Total operating expenses | $ | 109,700 | |||||||||||||||||||||
Other income and (expenses): | |||||||||||||||||||||||
Interest expense | $ | (29,085 | ) | ||||||||||||||||||||
Income from unconsolidated real estate affiliates and fund investments | 4,057 | ||||||||||||||||||||||
Gain on disposition of property and extinguishment of debt, net | 106,872 | ||||||||||||||||||||||
Total other income and (expenses) | $ | 81,844 | |||||||||||||||||||||
Net income | $ | 98,934 | |||||||||||||||||||||
24
NOTE 12—SUBSEQUENT EVENTS
On October 2, 2020, we entered into a $17,500 mortgage note payable on Mason Mill Distribution Center. The interest-only mortgage note bears an interest rate of 3.25% and matures on October 10, 2030.
On October 13, 2020, we entered into a $16,730 mortgage note payable on San Juan Medical Center. The interest-only mortgage note bears an interest rate of 3.35% and matures on October 13, 2027.
On October 23, 2020, we acquired Fort Worth Distribution Center, a 351,000 square foot industrial property located in Fort Worth, Texas, for approximately $24,050. The acquisition was funded with cash on hand.
On October 30, 2020, we entered into a $35,500 mortgage note payable on The Penfield. The note is interest only for the first five years, bears an interest rate of 2.50% and matures on October 30, 2030.
On November 5, 2020, our board of directors approved a gross dividend for the fourth quarter of 2020 of $0.135 per share to stockholders of record as of December 23, 2020. The dividend will be paid on or around December 30, 2020. Class A, Class M, Class A-I, Class M-I and Class D stockholders will receive $0.135 per share, less applicable class-specific fees, if any.
Subsequent to September 30, 2020, the United States continues to be severely impacted by the COVID-19 pandemic and by the economic effects of government responses, various restrictions on certain business activities, which have materially disrupted the economy. We have entered into a number of rent relief requests from tenants at our properties, most often in the form of rent deferral requests, as a result of COVID-19. We are evaluating each tenant rent relief request on an individual basis, considering a number of factors. We are not able to estimate the total impact of the COVID-19 pandemic at this time.
* * * * * *
25
Item 2. | Management’s Discussion and Analysis of Financial Condition and Results of Operations. |
$ in thousands, except per share amounts
Cautionary Note Regarding Forward-Looking Statements
This Quarterly Report on Form 10-Q ("Form 10-Q") may contain forward-looking statements within the meaning of Section 21E of the Securities Exchange Act of 1934, as amended (the “Exchange Act”), and Section 27A of the Securities Act of 1933, as amended (the "Securities Act"), regarding, among other things, our plans, strategies and prospects, both business and financial. Forward-looking statements include, but are not limited to, statements that represent our beliefs concerning future operations, strategies, financial results or other developments. Forward-looking statements can be identified by the use of forward-looking terminology such as, but not limited to, “may,” “should,” “expect,” “anticipate,” “estimate,” “would be,” “believe,” or “continue” or the negative or other variations of comparable terminology. Because these forward-looking statements are based on estimates and assumptions that are subject to significant business, economic and competitive uncertainties, many of which are beyond our control or are subject to change, actual results could be materially different. Although we believe that our plans, intentions and expectations reflected in or suggested by these forward-looking statements are reasonable, we cannot assure you that we will achieve or realize these plans, intentions or expectations. Forward-looking statements are inherently subject to risks, uncertainties and assumptions. Readers are cautioned not to place undue reliance on these forward-looking statements, which speak only as of the date this Form 10-Q is filed with the SEC. Except as required by law, we do not undertake to update or revise any forward-looking statements contained in this Form 10-Q. Important factors that could cause actual results to differ materially from the forward-looking statements are disclosed in “Item 1A. Risk Factors,” “Item 1. Business” and “Item 7. Management’s Discussion and Analysis of Financial Condition and Results of Operations” contained in our 2019 Form 10-K and our periodic reports filed with the SEC.
Management Overview
The following Management’s Discussion and Analysis of Financial Condition and Results of Operations (“MD&A”) is intended to help the reader understand our results of operations and financial condition. This MD&A is provided as a supplement to, and should be read in conjunction with, our consolidated financial statements and the accompanying notes to the consolidated financial statements appearing elsewhere in this Form 10-Q. All references to numbered Notes are to specific notes to our consolidated financial statements beginning on page 7 of this Form 10-Q, and the descriptions referred to are incorporated into the applicable portion of this section by reference. References to “base rent” in this Form 10-Q refer to cash payments made under the relevant lease(s), excluding real estate taxes and certain property operating expenses that are paid by us and are recoverable under the relevant lease(s) and exclude adjustments for straight-line rent revenue and above- and below-market lease amortization.
The discussions surrounding our Consolidated Properties refer to our wholly or majority owned and controlled properties, which as of September 30, 2020, were comprised of:
Apartment
• | The Edge at Lafayette, |
• | Townlake of Coppell, |
• | AQ Rittenhouse, |
• | Lane Parke Apartments, |
• | Dylan Point Loma, |
• | The Penfield, |
• | 180 North Jefferson, |
• | Jory Trail at the Grove, |
• | The Reserve at Johns Creek, |
• | Villas at Legacy, |
• | Stonemeadow Farms (acquired 2019), |
• | Summit at San Marcos (acquired 2019), and |
• | Presley Uptown (acquired 2019). |
26
Industrial
• | Kendall Distribution Center, |
• | Norfleet Distribution Center, |
• | Suwanee Distribution Center, |
• | South Seattle Distribution Center, |
• | 3325 Trinity Boulevard, |
• | Charlotte Distribution Center, |
• | DFW Distribution Center, |
• | O'Hare Industrial Portfolio, |
• | Tampa Distribution Center, |
• | Aurora Distribution Center, |
• | Valencia Industrial Portfolio, |
• | Pinole Point Distribution Center, |
• | Mason Mill Distribution Center, |
• | Fremont Distribution Center (acquired 2019), |
• | 3324 Trinity Boulevard (acquired 2019), |
• | Taunton Distribution Center (acquired 2019), and |
• | Chandler Distribution Center (acquired in 2019). |
Office
• | Monument IV at Worldgate, |
• | 140 Park Avenue, |
• | San Juan Medical Center, |
• | Genesee Plaza (acquired 2019), and |
• | Fountainhead Corporate Park (acquired 2020). |
Retail
• | The District at Howell Mill, |
• | Grand Lakes Marketplace, |
• | Oak Grove Plaza, |
• | Rancho Temecula Town Center, |
• | Skokie Commons, |
• | Whitestone Market, |
• | Maui Mall, |
• | Silverstone Marketplace, |
• | Kierland Village Center, |
• | Timberland Town Center, |
• | Montecito Marketplace, and |
• | Millford Crossing (acquired 2020). |
Other
• | South Beach Parking Garage. |
Sold Properties
• | 111 Sutter Street (sold in 2019), and |
• | 24823 Anza Drive (sold in 2020). |
27
Discussions surrounding our Unconsolidated Properties refer to the following properties as of September 30, 2020:
Property | Property Type | |
Chicago Parking Garage | Parking | |
NYC Retail Portfolio | Retail | |
Pioneer Tower | Office | |
The Tremont | Apartment | |
The Huntington | Apartment | |
Our primary business is the ownership and management of a diversified portfolio of apartment, industrial, office, retail and other properties primarily located in the United States. It is expected that over time our real estate portfolio will be further diversified on a global basis and will be complemented by investments in real estate-related assets.
We are managed by our Advisor, LaSalle Investment Management, Inc., a subsidiary of our Sponsor, Jones Lang LaSalle Incorporated (NYSE: JLL), a leading global financial and professional services firm that specializes in commercial real estate and investment management. We hire property management and leasing companies to provide the on-site, day-to-day management and leasing services for our properties. When selecting a property management or leasing company for one of our properties, we look for service providers that have a strong local market or industry presence, create portfolio efficiencies, have the ability to develop new business for us and will provide a strong internal control environment that will comply with our Sarbanes-Oxley Act of 2002 internal control requirements. We currently use a mix of property management and leasing service providers that include large national real estate service firms, including an affiliate of our Advisor and smaller local firms.
We seek to minimize risk and maintain stability of income and principal value through broad diversification across property sectors and geographic markets and by balancing tenant lease expirations and debt maturities across the real estate portfolio. Our diversification goals also take into account investing in sectors or regions we believe will create returns consistent with our investment objectives. Under normal conditions, we intend to pursue investments principally in well-located, well-leased properties within the apartment, industrial, office, retail and other sectors. We expect to actively manage the mix of properties and markets over time in response to changing operating fundamentals within each property sector and to changing economies and real estate markets in the geographic areas considered for investment. When consistent with our investment objectives, we also seek to maximize the tax efficiency of our investments through like-kind exchanges and other tax planning strategies.
28
The following charts summarize our portfolio diversification by property sector and geographic region based upon the fair value of our properties. These tables provide examples of how our Advisor evaluates our real estate portfolio when making investment decisions.
Estimated Percent of Fair Value as of September 30, 2020:
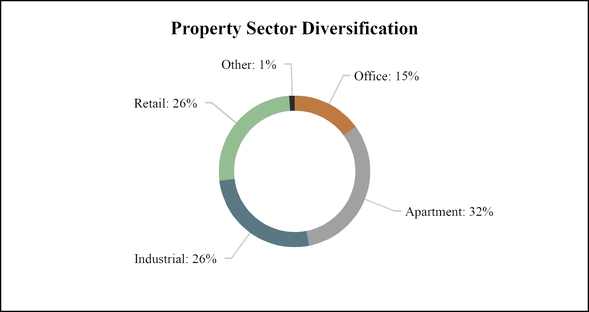
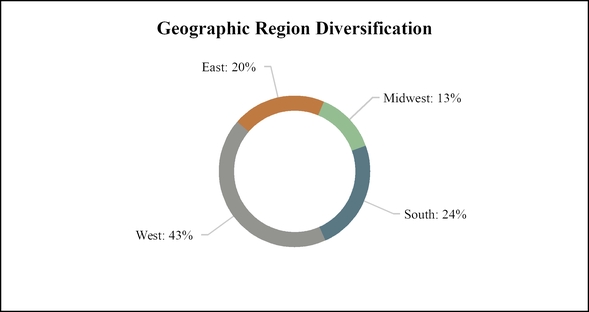
29
Our investments are not materially impacted by seasonality, despite certain of our retail tenants being impacted by seasonality. Percentage rents (rents computed as a percentage of tenant sales) that we earn from investments in retail properties may, in the future, be impacted by seasonality.
Use of Estimates
The preparation of financial statements in conformity with GAAP requires us to make estimates and assumptions. These estimates and assumptions impact the reported amounts of assets and liabilities and the disclosure of contingent assets and liabilities at the date of the financial statements and the reported amounts of revenues and expenses during the reporting period. For example, significant estimates and assumptions have been made with respect to the useful lives of assets, recoverable amounts of receivables, fair value of derivatives and real estate assets, initial valuations and related amortization periods of deferred costs and intangibles, particularly with respect to property acquisitions. Actual results could differ from those estimates.
Critical Accounting Policies
This MD&A is based upon our consolidated financial statements, which have been prepared in accordance with GAAP. The preparation of these consolidated financial statements requires management to make estimates and judgments that affect the reported amounts of assets, liabilities, revenues and expenses. Management bases its estimates on historical experience and assumptions that are believed to be reasonable under the circumstances, the results of which form the basis for making judgments about carrying value of assets and liabilities that are not readily apparent from other sources. Actual results may differ from these estimates under different assumptions or conditions. We believe there have been no significant changes during the nine months ended September 30, 2020 to the items that we disclosed as our critical accounting policies and estimates under “Item 7. Management’s Discussion and Analysis of Financial Condition and Results of Operations” in our 2019 Form 10-K.
Initial Valuations and Estimated Useful Lives or Amortization Periods for Real Estate Investments and Intangibles
These estimates are particularly important as they are used for the allocation of purchase price between building, land and other identifiable intangibles, including above, below and at-market leases. As a result, the impact of these estimates on our operations could be substantial. Significant differences in annual depreciation or amortization expense may result from the differing useful life or amortization periods related to such purchased assets and liabilities.
Impairment of Long-Lived Assets
Our estimate of the expected future cash flows used in testing for impairment is subjective and based on, among other things, our estimates regarding future market conditions, rental rates, occupancy levels, costs of tenant improvements, leasing commissions and other tenant concessions, assumptions regarding the residual value of our properties at the end of our anticipated holding period, discount rates and the length of our anticipated holding period. These assumptions could differ materially from actual results. If changes in our strategy or the market conditions result in a reduction in the holding period and an earlier sale date, an impairment loss could be recognized and such loss could be material. No such strategy changes or market conditions have been identified as of September 30, 2020.
Collectibility of Rental Revenue
Individual leases are evaluated for collectibility at each reporting period. We evaluate the collectibility of rents and other receivables at each reporting period based on factors including, among others, tenant's payment history, the financial condition of the tenant, business conditions and trends in the industry in which the tenant operates and economic conditions in the geographic area where the property is located. If evaluation of these factors or others indicates it is not probable we will collect substantially all rent we recognize an adjustment to rental revenue. If our judgment or estimation regarding probability of collection changes we may adjust or record additional rental revenue in the period such conclusion is reached.
30
Properties
Properties owned at September 30, 2020 are as follows:
Percentage Leased as of September 30, 2020 | |||||||||||
Property Name | Location | Acquisition Date | Ownership % | Net Rentable Square Feet | |||||||
Consolidated Properties: | |||||||||||
Apartment Segment: | |||||||||||
The Edge at Lafayette | Lafayette, LA | January 15, 2008 | 100% | 207,000 | 75% | ||||||
Townlake of Coppell | Coppell, TX | May 22, 2015 | 100 | 351,000 | 97 | ||||||
AQ Rittenhouse | Philadelphia, PA | July 30, 2015 | 100 | 92,000 | 92 | ||||||
Lane Parke Apartments | Mountain Brook, AL | May 26, 2016 | 100 | 263,000 | 91 | ||||||
Dylan Point Loma | San Diego, CA | August 9, 2016 | 100 | 204,000 | 99 | ||||||
The Penfield | St. Paul, MN | September 22, 2016 | 100 | 245,000 | 95 | ||||||
180 North Jefferson | Chicago, IL | December 1, 2016 | 100 | 217,000 | 95 | ||||||
Jory Trail at the Grove | Wilsonville, OR | July 14, 2017 | 100 | 315,000 | 99 | ||||||
The Reserve at Johns Creek | Johns Creek, GA | July 28, 2017 | 100 | 244,000 | 98 | ||||||
Villas at Legacy | Plano, TX | June 6, 2018 | 100 | 340,000 | 96 | ||||||
Stonemeadow Farms | Bothell, WA | May 13, 2019 | 100 | 228,000 | 96 | ||||||
Summit at San Marcos | Chandler, AZ | July 31, 2019 | 100 | 257,000 | 96 | ||||||
Presley Uptown (1) | Charlotte, NC | September 30, 2019 | 98 | 190,000 | 93 | ||||||
Industrial Segment: | |||||||||||
Kendall Distribution Center | Atlanta, GA | June 30, 2005 | 100% | 409,000 | 100% | ||||||
Norfleet Distribution Center | Kansas City, MO | February 27, 2007 | 100 | 702,000 | 100 | ||||||
Suwanee Distribution Center | Suwanee, GA | June 28, 2013 | 100 | 559,000 | 100 | ||||||
South Seattle Distribution Center | |||||||||||
3800 1st Avenue South | Seattle, WA | December 18, 2013 | 100 | 162,000 | 50 | ||||||
3844 1st Avenue South | Seattle, WA | December 18, 2013 | 100 | 101,000 | 100 | ||||||
3601 2nd Avenue South | Seattle, WA | December 18, 2013 | 100 | 60,000 | 100 | ||||||
Grand Prairie Distribution Center | |||||||||||
3325 West Trinity Boulevard | Grand Prairie, TX | January 22, 2014 | 100 | 277,000 | 100 | ||||||
3324 West Trinity Boulevard | Grand Prairie, TX | May 31, 2019 | 100 | 145,000 | 100 | ||||||
Charlotte Distribution Center | Charlotte, NC | June 27, 2014 | 100 | 347,000 | 100 | ||||||
DFW Distribution Center | |||||||||||
4050 Corporate Drive | Grapevine, TX | April 15, 2015 | 100 | 441,000 | 100 | ||||||
4055 Corporate Drive | Grapevine, TX | April 15, 2015 | 100 | 202,000 | 100 | ||||||
O'Hare Industrial Portfolio | |||||||||||
200 Lewis | Wood Dale, IL | September 30, 2015 | 100 | 31,000 | 100 | ||||||
1225 Michael Drive | Wood Dale, IL | September 30, 2015 | 100 | 109,000 | 100 | ||||||
1300 Michael Drive | Wood Dale, IL | September 30, 2015 | 100 | 71,000 | 100 | ||||||
1301 Mittel Drive | Wood Dale, IL | September 30, 2015 | 100 | 53,000 | 100 | ||||||
1350 Michael Drive | Wood Dale, IL | September 30, 2015 | 100 | 56,000 | 100 | ||||||
2501 Allan Drive | Elk Grove, IL | September 30, 2015 | 100 | 198,000 | 89 | ||||||
2601 Allan Drive | Elk Grove, IL | September 30, 2015 | 100 | 124,000 | 100 | ||||||
Tampa Distribution Center | Tampa, FL | April 11, 2016 | 100 | 386,000 | 100 | ||||||
Aurora Distribution Center | Aurora, IL | May 19, 2016 | 100 | 305,000 | 100 | ||||||
Valencia Industrial Portfolio: | |||||||||||
28150 West Harrison Parkway | Valencia, CA | June 29, 2016 | 100 | 87,000 | 100 | ||||||
28145 West Harrison Parkway | Valencia, CA | June 29, 2016 | 100 | 114,000 | 100 | ||||||
28904 Paine Avenue | Valencia, CA | June 29, 2016 | 100 | 117,000 | 100 | ||||||
25045 Tibbitts Avenue | Santa Clarita, CA | June 29, 2016 | 100 | 142,000 | 100 | ||||||
31
Percentage Leased as of September 30, 2020 | |||||||||||
Property Name | Location | Acquisition Date | Ownership % | Net Rentable Square Feet | |||||||
Pinole Point Distribution Center: | |||||||||||
6000 Giant Road | Richmond, CA | September 8, 2016 | 100 | 225,000 | 100 | ||||||
6015 Giant Road | Richmond, CA | September 8, 2016 | 100 | 252,000 | 100 | ||||||
6025 Giant Road | Richmond, CA | December 29, 2016 | 100 | 41,000 | 100 | ||||||
Mason Mill Distribution Center | Buford, GA | December 20, 2017 | 100 | 340,000 | 100 | ||||||
Fremont Distribution Center | |||||||||||
45275 Northport Court | Fremont, CA | March 29, 2019 | 100 | 117,000 | 100 | ||||||
45630 Northport Loop East | Fremont, CA | March 29, 2019 | 100 | 120,000 | 100 | ||||||
Taunton Distribution Center | Taunton, MA | August 23, 2019 | 100 | 200,000 | 100 | ||||||
Chandler Distribution Center | |||||||||||
1725 East Germann Road | Chandler, AZ | December 5, 2019 | 100 | 122,000 | 100 | ||||||
1825 East Germann Road | Chandler, AZ | December 5, 2019 | 100 | 89,000 | 100 | ||||||
Office Segment: | |||||||||||
Monument IV at Worldgate | Herndon, VA | August 27, 2004 | 100% | 228,000 | 100% | ||||||
140 Park Avenue | Florham Park, NJ | December 21, 2015 | 100 | 100,000 | 100 | ||||||
San Juan Medical Center | San Juan Capistrano, CA | April 1, 2016 | 100 | 40,000 | 97 | ||||||
Genesee Plaza | |||||||||||
9333 Genesee Ave | San Diego, CA | July 2, 2019 | 100 | 80,000 | 89 | ||||||
9339 Genesee Ave | San Diego, CA | July 2, 2019 | 100 | 81,000 | 75 | ||||||
Fountainhead Corporate Park | |||||||||||
Fountainhead Corporate Park I | Tempe, AZ | February 6, 2020 | 100 | 167,000 | 93 | ||||||
Fountainhead Corporate Park II | Tempe, AZ | February 6, 2020 | 100 | 128,000 | 86 | ||||||
Retail Segment: | |||||||||||
The District at Howell Mill (1) | Atlanta, GA | June 15, 2007 | 88% | 306,000 | 96% | ||||||
Grand Lakes Marketplace (1) | Katy, TX | September 17, 2013 | 90 | 131,000 | 98 | ||||||
Oak Grove Plaza | Sachse, TX | January 17, 2014 | 100 | 120,000 | 96 | ||||||
Rancho Temecula Town Center | Temecula, CA | June 16, 2014 | 100 | 165,000 | 99 | ||||||
Skokie Commons | Skokie, IL | May 15, 2015 | 100 | 97,000 | 98 | ||||||
Whitestone Market | Austin, TX | September 30, 2015 | 100 | 145,000 | 97 | ||||||
Maui Mall | Kahului, HI | December 22, 2015 | 100 | 235,000 | 84 | ||||||
Silverstone Marketplace | Scottsdale, AZ | July 27, 2016 | 100 | 78,000 | 88 | ||||||
Kierland Village Center | Scottsdale, AZ | September 30, 2016 | 100 | 118,000 | 93 | ||||||
Timberland Town Center | Beaverton, OR | September 30, 2016 | 100 | 92,000 | 96 | ||||||
Montecito Marketplace | Las Vegas, NV | August 8, 2017 | 100 | 190,000 | 97 | ||||||
Milford Crossing | Milford, MA | January 29, 2020 | 100 | 159,000 | 98 | ||||||
Other Segment: | |||||||||||
South Beach Parking Garage (2) | Miami Beach, FL | January 28, 2014 | 100% | 130,000 | N/A | ||||||
Unconsolidated Properties: | |||||||||||
Chicago Parking Garage (3) | Chicago, IL | December 23, 2014 | 100% | 167,000 | N/A | ||||||
NYC Retail Portfolio (4) | NY/NJ | December 8, 2015 | 14 | 1,938,000 | 91% | ||||||
Pioneer Tower (5) | Portland, OR | June 28, 2016 | 100 | 296,000 | 69 | ||||||
The Tremont (1) | Burlington, MA | July 19, 2018 | 75 | 175,000 | 93 | ||||||
The Huntington (1) | Burlington, MA | July 19, 2018 | 75 | 115,000 | 94 | ||||||
________
(1) | We own a majority interest in the joint venture that owns a fee simple interest in this property. |
32
(2) | The parking garage contains 343 stalls. This property is owned leasehold. |
(3) | We own a condominium interest in the building that contains a 366 stall parking garage. |
(4) | We own an approximate 14% interest in a portfolio of eight urban infill retail properties located in the greater New York City area. |
(5) | We own a condominium interest in the building that contains a 17 story multi-tenant office property. |
Operating Statistics
We generally hold investments in properties with high occupancy rates leased to quality tenants under long-term, non-cancelable leases. We believe these leases are beneficial to achieving our investment objectives. The following table shows our operating statistics by property type for our consolidated properties as of September 30, 2020:
Number of Properties | Total Area (Sq Ft) | % of Total Area | Occupancy % | Average Minimum Base Rent per Occupied Sq Ft (1) | |||||||||||
Apartment | 13 | 3,154,000 | 25 | % | 95 | % | $ | 21.72 | |||||||
Industrial | 33 | 6,705,000 | 53 | 98 | 5.92 | ||||||||||
Office | 7 | 829,000 | 7 | 93 | 34.28 | ||||||||||
Retail | 12 | 1,834,000 | 14 | 95 | 20.41 | ||||||||||
Other | 1 | 130,000 | 1 | N/A | N/A | ||||||||||
Total | 66 | 12,652,000 | 100 | % | 97 | % | $ | 13.80 | |||||||
________
(1) | Amount calculated as in-place minimum base rent for all occupied space at September 30, 2020 and excludes any straight line rents, tenant recoveries and percentage rent revenues. |
As of September 30, 2020, our average effective annual rent per square foot, calculated as average minimum base rent per occupied square foot less tenant concessions and allowances, was $11.55 for our consolidated properties.
Recent Events and Outlook
COVID-19 Business Outlook
The outbreak of COVID-19 was declared by the World Health Organization as a global health emergency on January 30, 2020 and then as a pandemic in March 2020. COVID-19 has impacted global financial markets, severely restricted international trade and travel, disrupted business operations (in part or in their entirety) and negatively impacted many investment asset classes including real estate. The ongoing outbreak and corollary response could have a material adverse impact on our financial condition and results of operations. The severity of the impact brought on by these disruptions will be different across property types and markets but could have serious negative impacts on all real estate depending on the longer-term economic effects of COVID-19.
Rent Collections
As of the date of this filing, we collected approximately 95%, 94%, 93% and 92% of our July, August, September and October billed rents, respectively, after taking into account effects of lease amendments entered into with tenants. We have collected 93%, 94%, 93% and 92% of our originally budgeted July, August, September and October rents, respectively, which exclude executed lease amendments. We have received requests for rent relief from 243 commercial tenants. To date, we have granted rent relief for 81 tenants representing approximately $3,700 of revenue, made up of approximately $2,600 of rent deferrals and approximately $1,100 of rent abatements for the full year of 2020. We expect to recover the rent deferrals over a longer period of time (generally three to twelve months) or to extend their leases to cover the lost rent revenue. We also expect our credit losses to be higher when compared to our operating history. We seek to balance the immediate financial interest of our stockholders against being a responsible corporate citizen and the interests of our tenants. We believe that this strategy will also allow us to protect the long-term value of our portfolio, which is in the best interests of our stockholders.
33
Apartment Segment
Our apartment segment is 32% of our portfolio, made up of 15 investments representing a fair market value of approximately $948,000 as of September 30, 2020. Our apartment occupancy increased from 94% at June 30, 2020 to 95% at September 30, 2020. In previous downturns the apartment segment has proven to be one of the more resilient segments of the real estate market. Our primary strategy has been investing in garden-style, suburban apartments in highly-rated school districts, which we believe will perform relatively well versus high-end, urban centric apartments and other property sectors. In addition, our apartments are typically geared toward a more affluent and salaried tenant base, as opposed to hourly, service sector workers who have experienced a disproportionate share of the recent job losses. To date, within our apartment segment cash flow disruption from the pandemic has been only modestly impacted. However, as the pandemic continues future rent growth may be negatively impacted over the near-term. Our one student-oriented apartment property has been negatively impacted due to lower 2020 enrollment, although it represents only 0.6% of our portfolio.
Industrial Segment
Our industrial segment is 26% of our portfolio, made up of 33 buildings representing a fair market value of approximately $751,000 as of September 30, 2020. The industrial segment is expected to be a long-term beneficiary from the pandemic as the secular shift toward e-commerce is spurring increased demand and companies will have a desire to maintain more inventory in the future than they did pre-COVID-19. Our industrial segment occupancy remained high at 99% at June 30, 2020 and 98% at September 30, 2020. Our industrial segment has seen significant leasing activity in 2020 with rents increasing from the previous leases. We have signed leases for approximately 600,000 square feet with a weighted average increase in rental rates of 6.7%. However, as the pandemic continues future rent growth may be negatively impacted. To date, we have granted rent relief to 10 tenants for approximately $1,700 of rent.
Office Segment
Our office segment is 15% of our portfolio, made up of eight properties representing a fair market value of approximately $449,000 as of September 30, 2020. Our office segment occupancy was 85% at June 30, 2020 and 85% at September 30, 2020. Our office segment is made up of four traditional office properties and four medical office properties. We have chosen to underweight the traditional office segment due to its cash flow volatility. We are focused more on the medical office segment, which often provides stability during economic downturns due to its occupancy by necessary medical professionals. With many traditional office closures around the country, and closure of some non-essential medical providers, we have received rent relief requests from a few of our tenants and have granted rent relief to four tenants for approximately $500 of rent. Future rent growth and lease-up time for vacancies may be negatively impacted.
Grocery-Anchored Retail Segment
Our grocery-anchored retail segment is 26% of our portfolio, made up of 20 properties representing a fair market value of approximately $767,000 as of September 30, 2020. Our retail occupancy remained constant at 93% at June 30, 2020 and September 30, 2020. Shortly after the end of the quarter, we renewed two of our large grocer tenants for new ten-year lease terms. Grocers, pharmacies and take-out/delivery restaurants are open and showing increased sales activity in the current environment. Service-oriented operations such as gyms, theaters, and full-service restaurants are operating at reduced capacity or in limited instances remain closed in many markets due to government orders. A number of our smaller non-grocer retail tenants have requested rent relief for some period of time, and a percentage of tenants who were struggling before the shutdown, may never reopen for business. To date, we have granted rent relief to 67 tenants for approximately $1,600 of rent. Rent growth and lease-up time for vacancies are expected to be negatively impacted.
Other Segment
Our other segment is made up of two parking garages, which is 1% of our portfolio, representing a fair market value of approximately $32,000 as of September 30, 2020. Parking garage utilization has been negatively impacted by the shutdown as office workers, shopper and tourist traffic has been significantly reduced due to the shutdown resulting in significantly less transient and monthly parkers, although we experienced a pick-up in volume in the third quarter. As the economy begins to open up, fears of contracting COVID-19 from public transportation or ride sharing may drive additional traffic to parking garages.
34
Property Valuations
Since February 29, 2020, just prior to COVID-19 being declared a global pandemic, every property in our 78-property portfolio has been independently reappraised twice and 60% of those properties have now been reappraised three times by our independent valuation advisor. Valuation changes in the first and second quarter across our approximate $3 billion portfolio totaled $86 million reflecting an aggregate 2.8% decline in gross value across all property types. Third quarter property values were relatively flat across the portfolio. For the nine months ended September 30, 2020, decreases in property valuations resulted in a NAV decline of approximately $0.40 per share, an approximate 2.9% decline in net asset value.
Approximately 50% of the aggregate valuation declines for 2020 were due to write downs in the appraisals of our 20-property grocery-anchored retail portfolio resulting from increased credit loss reserves, reduced market rental growth rates, elimination of year one percentage rent revenues and slower projected lease up of vacancies all due to anticipated COVID-19 impacts.
Approximately 29% of the aggregate valuation declines for 2020 were due to write downs in the appraisals of our 15-property apartment portfolio resulting from increases in credit loss reserves, increased future vacancy, and reduced future market rental growth rates all due to anticipated COVID-19 impacts.
Approximately 12% of the aggregate valuation declines for 2020 were due to write downs in the appraisals of our two smallest portfolio allocations, which include one student-oriented apartment property, and two parking garages, which combined represent less than 2% of our overall portfolio.
The remaining 9% of the aggregate valuation declines for 2020 were due to minimal appraisal adjustments across our industrial and office portfolios reflecting similar changes in appraisals as noted above.
Capital Markets
We suspended all acquisition activity underway before the shut down and through the end of the third quarter to preserve capital, maintain our strong liquidity position and to take advantage of more attractive investment opportunities that may evolve post-COVID-19. Industry wide, transaction activity has picked up and we have begun bidding on a number of quality acquisition opportunities. Debt markets are open and operating efficiently. Lower interest rates are being partially offset by higher credit spreads, and loan proceeds are lower than pre-COVID financings as lenders have revised certain underwriting requirements. We have negligible near-term mortgage debt maturities with only one mortgage loan maturing in 2021 for $22,800, which we expect to repay from cash on hand or borrowings on our Credit Facility.
Credit Facility
Our $400,000 Credit Facility, made up of a $300,000 Revolving Line of Credit maturing in 2021 and $100,000 Term Loan maturing in 2023, has two, 12-month extension options at our discretion. We are in compliance with our debt covenants as of September 30, 2020. We expect to maintain compliance with our debt covenants. However, further shutdowns driven by future increases in COVID-19 cases could have a negative impact on our compliance with debt covenants.
Distribution of Common Stock
We have retained LaSalle Investment Management Distributors, LLC (the “Dealer Manager”) to distribute shares of our common stock in our Second Extended Public Offering on a best efforts basis. Proceeds from the sales of our common stock are one of the sources of cash used for our short and longer-term liquidity and capital needs. The Dealer Manager, has established a network of broker-dealers and registered investment advisors (the “Distribution Partners”) to offer our common stock to their clients. Five of these Distribution Partners informed us and the Dealer Manager that they are temporarily suspending sales of public non-traded REITs to their clients, including our common stock, as a result of the impact that COVID-19 is having on the economy and real estate markets. As of this filing, only two smaller Distribution Partners have not lifted their suspension of sales of our common stock. We are not able to anticipate whether other Distribution Partners may suspend sales of non-traded REITs, including our common stock, or for how long such restrictions may remain in effect.
Liquidity
At September 30, 2020, we had in excess of $74,000 in total cash on hand and $200,000 of capacity under our Revolving Credit Facility. For the remainder of the year, we expect to utilize our cash on hand to acquire new properties, fund repurchases of our shares and fund quarterly distributions.
35
Share Repurchase Plan
During the third quarter of 2020, we repurchased $45,192 of our common stock pursuant to our Share Repurchase Plan, which had a quarterly limit of $98,692. The quarterly limit on repurchases is calculated as 5% of our NAV as of the last day of the previous quarter. The limit for the fourth quarter of 2020 is $97,987. We believe the volume of share repurchase requests for the quarter was larger than our historical experience given the significant volatility across all asset classes in the quarter coupled with the growing concerns regarding COVID-19 and its near- and longer-term impacts on the U.S economy. We are not obligated to repurchase any shares of our common stock and may choose to only repurchase some, or even none, of the shares requested to be repurchased. Our board of directors has the right to modify or suspend the share repurchase plan if it deems such action to be in the best interest of our stockholders. Should repurchase requests, in the business judgment of our board of directors, place an undue burden on our liquidity, adversely affect our operations or risk having an adverse impact on stockholders whose shares are not repurchased or should we otherwise determine that investing our liquid assets in real properties or other illiquid investments rather than repurchasing our shares is in the best interests of our company as a whole, then we may choose to repurchase fewer shares than have been requested to be repurchased or none at all.
Impairments
At September 30, 2020, we had no impairments on any of our properties. It is possible that within the next twelve months, we could recognize impairment charges if we experience adverse changes in our investments and properties and their results of operations and financial conditions deteriorate, including due to further impacts of the COVID-19 pandemic.
Fair Value of Assets and Liabilities
We account for our approximate 14% investment in the NYC Retail Portfolio using the fair value option. The eight properties we own interests in were closed for a substantial amount of time during the third quarter and a few continue to be closed due to the partial shutdowns or tenants deciding to stay closed for business reasons. During the three months ended September 30, 2020, we recorded an unrealized fair value loss of $2,648 related to this investment. Our interest rate swaps resulted in an unrealized fair value gain of $226 as interest rates rose slightly during the quarter. We utilize our interest rate swaps to fix interest rates on variable rate debt we plan to hold to maturity.
General Company and Market Commentary
On July 6, 2018, the SEC declared our Second Extended Public Offering effective registering up to $3,000,000 in any combination of shares of our Class A, Class M, Class A-I and Class M-I common stock, consisting of up to $2,700,000 of shares offered in our primary offering and up to $300,000 in shares offered pursuant to our distribution reinvestment plan. We intend to offer shares of our common stock on a continuous basis for an indefinite period of time by filing a new registration statement before the end of each offering period, subject to regulatory approval. The per share purchase price varies from day to day and, on each day, equals our NAV per share for each class of common stock, plus, for Class A and Class A-I shares, applicable selling commissions. The Dealer Manager is distributing shares of our common stock in our Second Extended Public Offering. We intend to primarily use the net proceeds from the offering, after we pay the fees and expenses attributable to the offerings and our operations, to (1) grow and further diversify our portfolio by making investments in accordance with our investment strategy and policies, (2) reduce borrowings and repay indebtedness incurred under various financing instruments and (3) fund repurchases of our shares under our share repurchase plan.
On March 3, 2015, we commenced a private offering of up to $350,000 in shares of our Class D common stock with an indefinite duration. Proceeds from our private offering will be used for the same corporate purposes as the proceeds from the First Extended Public Offering.
On October 16, 2019, through our operating partnership, we initiated the DST Program to raise up to $500,000, which our
board of directors may increase in its sole discretion, in private placements exempt from registration under the Securities Act
through the sale of beneficial interests to accredited investors in specific Delaware statutory trusts holding DST Properties, which may be sourced from our real properties or from third parties.
Over the past six years we have acquired 81 properties (all of these consistent with our investment strategy), sold 37 non-strategic properties, reduced our Company leverage ratio, decreased our average interest rate on debt, and increased cash reserves and Company-wide liquidity, while also providing cash flow to our stockholders through our regular quarterly dividend payments.
36
Capital Raised and Use of Proceeds
As of September 30, 2020, we raised gross proceeds of over $2,378,000 from our offerings and private share sales since 2012. We used these proceeds along with proceeds from mortgage debt to acquire approximately $2,636,000 of real estate investments, deleverage the Company by repaying mortgage loans of approximately $584,000 and repurchase shares of our common stock for approximately $736,000.
Property Acquisitions
On January 29, 2020, we acquired Milford Crossing, a 159,000 square foot, grocery-anchored retail center located in Milford, Massachusetts, for approximately $42,000. The acquisition was funded with cash on hand.
On February 6, 2020, we acquired Fountainhead Corporate Park, a 295,000 square foot, two-building Class A office portfolio comprised of two six-story buildings located in the Phoenix, Arizona submarket of Tempe for approximately $61,500. The acquisition was funded with cash on hand.
Property Dispositions
On March 27, 2020, we sold 24823 Anza Drive, a 31,000 square foot industrial property located within the Valencia Distribution Portfolio in Santa Clarita, CA, for approximately $5,600 less selling costs. We recorded a gain on the sale of the property in the amount of $1,724.
Stock Repurchases
For the nine months ended September 30, 2020, we repurchased $223,101 of shares of our common stock through the share repurchase plan.
Financing
On March 10, 2020, we repaid the mortgage note payable related to Townlake of Coppell in the amount of $28,418.
On March 31, 2020, we entered into a $35,900 mortgage payable on Summit at San Marcos. The interest-only mortgage note bears an interest rate of 3.28% and matures on April 1, 2030.
On August 27, 2020, we repaid the mortgage note payable related to Suwanee Distribution Center in the amount of $19,135.
On September 29, 2020, we repaid the mortgage note payable related to The Penfield in the amount of $37,957.
Subsequent Events
On October 2, 2020, we entered into a $17,500 mortgage note payable on Mason Mill Distribution Center. The interest-only mortgage note bears an interest rate of 3.25% and matures on October 10, 2030.
On October 13, 2020, we entered into a $16,730 mortgage note payable on San Juan Medical Center. The interest-only mortgage note bears an interest rate of 3.35% and matures on October 13, 2027.
On October 23, 2020, we acquired Fort Worth Distribution Center, a 351,000 square foot industrial property located in Fort Worth, Texas, for approximately $24,050. The acquisition was funded with cash on hand.
On October 30, 2020, we entered into a $35,500 mortgage note payable on The Penfield. The note is interest only for the first five years, bears an interest rate of 2.50% and matures on October 30, 2030.
On November 5, 2020, our board of directors approved a gross dividend for the fourth quarter of 2020 of $0.135 per share to stockholders of record as of December 23, 2020. The dividend will be paid on or around December 30, 2020. Class A, Class M, Class A-I, Class M-I and Class D stockholders will receive $0.135 per share, less applicable class-specific fees, if any.
37
Investment Objectives and Strategy
Our primary investment objectives are:
• | to generate an attractive level of current income for distribution to our stockholders; |
• | to preserve and protect our stockholders' capital investments; |
• | to achieve appreciation of our NAV over time; and |
• | to enable stockholders to utilize real estate as an asset class in diversified, long-term investment portfolios. |
We cannot ensure that we will achieve our investment objectives. Our charter places numerous limitations on us with respect to the manner in which we may invest our funds. In most cases, these limitations cannot be changed unless our charter is amended, which may require the approval of our stockholders.
The cornerstone of our investment strategy is to acquire and manage income-producing commercial real estate properties and real estate-related assets around the world. We believe this strategy enables us to provide our stockholders with a portfolio that is well-diversified across property type, geographic region and industry, both in the United States and internationally. It is our belief that adding international investments to our portfolio over time will serve as an effective tool to construct a well-diversified portfolio designed to provide our stockholders with stable distributions and attractive long-term risk-adjusted returns.
We believe that our broadly diversified portfolio benefits our stockholders by providing:
• | diversification of sources of income; |
• | access to attractive real estate opportunities currently in the United States and, over time, around the world; and |
• | exposure to a return profile that should have lower correlations with other investments. |
Since real estate markets are often cyclical in nature, our strategy allows us to more effectively deploy capital into property types and geographic regions where the underlying investment fundamentals are relatively strong or strengthening and away from those property types and geographic regions where such fundamentals are relatively weak or weakening. We intend to meet our investment objectives by selecting investments across multiple property types and geographic regions to achieve portfolio stability, diversification, current income and favorable risk-adjusted returns. To a lesser degree, we also intend to invest in debt and equity interests backed principally by real estate, which we refer to collectively as “real estate-related assets.”
We will leverage LaSalle's broad commercial real estate research and strategy platform and resources to employ a research-based investment philosophy focused on building a portfolio of commercial properties and real estate-related assets that we believe has the potential to provide stable income streams and outperform market averages over an extended holding period. Furthermore, we believe that having access to LaSalle and JLL's international organization and platform, with real estate professionals living and working full time throughout our global target markets, will be a valuable resource to us when considering and executing upon international investment opportunities.
Our board of directors has adopted investment guidelines for our Advisor to implement and actively monitor in order to allow us to achieve and maintain diversification in our overall investment portfolio. Our board of directors formally reviews our investment guidelines on an annual basis and our investment portfolio on a quarterly basis or, in each case, more often as they deem appropriate. Our board of directors reviews the investment guidelines to ensure that the guidelines are being followed and are in the best interests of our stockholders. Each such determination and the basis therefor shall be set forth in the minutes of the meetings of our board of directors. Changes to our investment guidelines must be approved by our board of directors but do not require notice to or the vote of stockholders.
We seek to invest:
• | up to 95% of our assets in properties; |
• | up to 25% of our assets in real estate-related assets; and |
• | up to 15% of our assets in cash, cash equivalents and other short-term investments. |
Notwithstanding the above, the actual percentage of our portfolio that is invested in each investment type may from time to time be outside these target levels due to numerous factors including, but not limited to, large inflows of capital over a short period of time, lack of attractive investment opportunities or increases in anticipated cash requirements for repurchase requests.
38
We expect to maintain a targeted Company leverage ratio (calculated as our share of total liabilities divided by our share of the fair value of total assets) of between 30% and 50%. We intend to use low leverage, or in some cases possibly no leverage, to finance new acquisitions in order to maintain our targeted Company leverage ratio. Our Company leverage ratio was 36% as of September 30, 2020.
2020 Key Initiatives
Our short-term initiatives for 2020 are to address the challenges being presented by COVID-19. During the remainder of 2020, we intend to use capital raised from our public and private offerings and the DST Program to acquire new investment opportunities, repurchasing stock under our share repurchase plan, and fund quarterly distributions. Likely acquisition candidates may include well-located, well-leased apartment properties, industrial properties and medical office properties. We will also attempt to further our geographic diversification. We will use debt financing to take advantage of the current favorable interest rate environment, while looking to keep the Company leverage ratio in the 30% to 50% range in the near term. We also intend to use our Revolving Line of Credit to allow us to efficiently manage our cash flows.
39
Results of Operations
General
Our revenues are primarily received from tenants in the form of fixed minimum base rents and recoveries of operating expenses. Our expenses primarily relate to the costs of operating and financing the properties. Our share of the net income or net loss from our unconsolidated real estate affiliates is included in income from unconsolidated affiliates and fund investments. We believe the following analysis of reportable segments provides important information about the operating results of our real estate investments, such as trends in total revenues or operating expenses that may not be as apparent in a period-over-period comparison of the entire Company. We group our investments in real estate assets from continuing operations into five reportable operating segments based on the type of property, which are apartment, industrial, office, retail and other. Operations from corporate level items and real estate assets sold are excluded from reportable segments.
Properties acquired or sold during any of the periods presented are presented within the recent acquisitions and sold properties line. The properties currently presented within the recent acquisitions and sold properties line include the properties listed as either acquired or sold in the Management Overview section above. Properties owned for the nine months ended September 30, 2020 and 2019 are referred to as our comparable properties.
Results of Operations for the Three Months Ended September 30, 2020 and 2019
Revenues
The following chart sets forth revenues by reportable segment for the three months ended September 30, 2020 and 2019:
Three Months Ended September 30, 2020 | Three Months Ended September 30, 2019 | $ Change | % Change | |||||||||||
Revenues: | ||||||||||||||
Rental revenue | ||||||||||||||
Apartment | $ | 12,305 | $ | 12,834 | $ | (529 | ) | (4.1 | )% | |||||
Industrial | 10,711 | 10,325 | 386 | 3.7 | ||||||||||
Office | 3,487 | 3,431 | 56 | 1.6 | ||||||||||
Retail | 10,614 | 11,308 | (694 | ) | (6.1 | ) | ||||||||
Other | 75 | 71 | 4 | 5.6 | ||||||||||
Comparable properties total | $ | 37,192 | $ | 37,969 | $ | (777 | ) | (2.0 | )% | |||||
Recent acquisitions and sold properties | 9,778 | 5,246 | 4,532 | 86.4 | ||||||||||
Total rental revenue | $ | 46,970 | $ | 43,215 | $ | 3,755 | 8.7 | % | ||||||
Other revenue | ||||||||||||||
Apartment | $ | 855 | $ | 667 | $ | 188 | 28.2 | % | ||||||
Industrial | 81 | 1 | 80 | 8,000 | ||||||||||
Office | 22 | 22 | — | — | ||||||||||
Retail | 278 | 106 | 172 | 162.3 | ||||||||||
Other | 299 | 519 | (220 | ) | (42.4 | ) | ||||||||
Comparable properties total | $ | 1,535 | $ | 1,315 | $ | 220 | 16.7 | % | ||||||
Recent acquisitions and sold properties | 532 | 255 | 277 | 109 | ||||||||||
Total other revenue | $ | 2,067 | $ | 1,570 | $ | 497 | 31.7 | % | ||||||
Total revenues | $ | 49,037 | $ | 44,785 | $ | 4,252 | 9.5 | % | ||||||
Rental revenues at comparable properties decreased $777 for the three months ended September 30, 2020 as compared to the same period in 2019. The decrease of $694 within our retail segment was primarily related to a reduction in rental revenue due to uncertainty of collectibility from tenants experiencing a decrease in operations from COVID-19. The decrease of $529 within the apartment segment was primarily related to a reduction in rental rates as well as lower rental revenue due to uncertainty of collectibility from tenants. The increase in rental revenue from our industrial properties is primarily related to new leases signed at Pinole Point Industrial Portfolio and DFW Industrial Portfolio as well as from collections of past due rents previously deemed uncollectible at Norfleet Distribution Center and Valencia Industrial Portfolio.
40
Other revenues relate mainly to parking and nonrecurring revenue such as lease termination fees. Other revenue at comparable properties increased by $220 for the three months ended September 30, 2020 as compared to the same period in 2019. The increase is primarily related to a $168 termination fee received at Whitestone Marketplace as well as approximately $180 of termination fees across our apartment properties. These increases were offset by approximately $220 of lower parking revenue at our parking garages in Miami as a result of reduced travel and shelter in place orders placed on the city of Miami.
Operating Expenses
The following chart sets forth real estate taxes and property operating expenses by reportable segment, for the three months ended September 30, 2020 and 2019:
Three Months Ended September 30, 2020 | Three Months Ended September 30, 2019 | $ Change | % Change | |||||||||||
Operating expenses: | ||||||||||||||
Real estate taxes | ||||||||||||||
Apartment | $ | 2,574 | $ | 2,543 | $ | 31 | 1.2 | % | ||||||
Industrial | 1,664 | 1,692 | (28 | ) | (1.7 | ) | ||||||||
Office | 333 | 347 | (14 | ) | (4.0 | ) | ||||||||
Retail | 1,427 | 1,175 | 252 | 21.4 | ||||||||||
Other | 93 | 107 | (14 | ) | (13.1 | ) | ||||||||
Comparable properties total | $ | 6,091 | $ | 5,864 | $ | 227 | 3.9 | % | ||||||
Recent acquisitions and sold properties | 1,481 | 647 | 834 | 129 | ||||||||||
Total real estate taxes | $ | 7,572 | $ | 6,511 | $ | 1,061 | 16.3 | % | ||||||
Property operating expenses | ||||||||||||||
Apartment | $ | 4,226 | $ | 3,983 | $ | 243 | 6.1 | % | ||||||
Industrial | 807 | 799 | 8 | 1.0 | ||||||||||
Office | 511 | 532 | (21 | ) | (3.9 | ) | ||||||||
Retail | 1,800 | 1,811 | (11 | ) | (0.6 | ) | ||||||||
Other | 174 | 179 | (5 | ) | (2.8 | ) | ||||||||
Comparable properties total | $ | 7,518 | $ | 7,304 | $ | 214 | 2.9 | % | ||||||
Recent acquisitions and sold properties | 2,457 | 1,162 | 1,295 | 111.4 | ||||||||||
Total property operating expenses | $ | 9,975 | $ | 8,466 | $ | 1,509 | 17.8 | % | ||||||
Total operating expenses | $ | 17,547 | $ | 14,977 | $ | 2,570 | 17.2 | % | ||||||
Real estate taxes at comparable properties increased by $227 for the three months ended September 30, 2020 as compared to the same period in 2019. Our properties are reassessed periodically by the taxing authorities, which may result in increases or decreases in the real estates taxes that we owe. Overall, we expect real estate taxes to increase over time; however, we utilize real estate tax consultants to attempt to control assessment increases. The overall increase is primarily related to a reassessment at The District at Howell Mill resulting in higher real estate tax expense of $255, during the three months ended September 30, 2020.
Property operating expenses consist of the costs of ownership and operation of the real estate investments, many of which are recoverable under net leases. Examples of property operating expenses include insurance, utilities and repair and maintenance expenses. Property operating expenses at comparable properties increased $214 for the three months ended September 30, 2020 as compared to the same period in 2019. The primary increase occurred within our apartment segment where turnover costs and various other costs related to COVID-19 increased during the three months ended September 30, 2020 as compared to the same period in 2019.
41
The following chart sets forth expenses not directly related to the operations of the reportable segments for the three months ended September 30, 2020 and 2019:
Three Months Ended September 30, 2020 | Three Months Ended September 30, 2019 | $ Change | % Change | |||||||||||
Property general and administrative | $ | 728 | $ | 497 | $ | 231 | 46.5 | % | ||||||
Advisor fees | 6,192 | 5,956 | 236 | 4.0 | ||||||||||
Company level expenses | 693 | 1,057 | (364 | ) | (34.4 | ) | ||||||||
Depreciation and amortization | 18,830 | 18,232 | 598 | 3.3 | ||||||||||
Interest expense | 8,391 | 8,902 | (511 | ) | (5.7 | ) | ||||||||
Loss (income) from unconsolidated affiliates and fund investments | 3,289 | (221 | ) | 3,510 | (1,588.2 | ) | ||||||||
Loss on disposition of property and extinguishment of debt, net | 3,480 | 236 | 3,244 | 1,374.6 | ||||||||||
Total expenses | $ | 41,603 | $ | 34,659 | $ | 6,944 | 20.0 | % | ||||||
Property general and administrative expenses relate mainly to property expenses unrelated to the operations of the property. Property general and administrative expenses increased during the three months ended September 30, 2020 as compared to the same period in 2019 primarily due to timing and increase in professional services, banking fees and state taxes.
Advisor fees relate to the fixed advisory and performance fees earned by the Advisor. Fixed fees increase or decrease based on changes in our NAV, which is primarily impacted by changes in capital raised and the value of our properties. The performance fee is accrued when the total return per share for a share class exceeds 7% for that calendar year, and in such years our Advisor will receive 10% of the excess total return above the 7% threshold. The increase in advisor fees of $236 for the three months ended September 30, 2020 as compared to the same period of 2019 is related to the increase in our NAV attributable to capital raised over the past year.
Company level expenses relate mainly to our compliance and administration related costs. The decrease of $364 in company level expenses for the three months ended September 30, 2020 is primarily related to decrease in legal fees and timing of stock compensation.
Depreciation and amortization expense is impacted by the values assigned to buildings, personal property and in-place lease assets as part of the initial purchase price allocation. The increase of $598 in depreciation and amortization expense for the three months ended September 30, 2020 as compared to the same period in 2019 was primarily related to the acquisition of new properties.
Interest expense decreased by $511 for the three months ended September 30, 2020 as compared to the same period in 2019 primarily as a result of a $1,263 decrease in the fair value of our interest rate swaps during the three months ended September 30, 2020 as compared to the same period of 2019. This decrease was offset by approximately $828 of increased interest expense from increased borrowings on our Credit Facility.
Loss (income) from unconsolidated affiliates and fund investments relates to the income from Chicago Parking Garage, Pioneer Tower, The Tremont and The Huntington as well as changes in fair value and operating distributions received from our investment in the NYC Retail Portfolio. During the three months ended September 30, 2020, we recorded a $2,648 decrease in the fair value of our investment in the NYC Retail Portfolio related to the impact COVID-19 had on the investment as compared to an $510 increase in the fair value during the same period of 2019.
Loss on disposition of property and extinguishment of debt, net increased due to a $3,480 loss on early payoff of the mortgage notes payable related to The Penfield, of which $2,022 related to the write-off of assumed debt discount value, which occurred during the three months ended September 30, 2020.
42
Results of Operations for the Nine Months Ended September 30, 2020 and 2019
Revenues
The following chart sets forth revenues by reportable segment, for the nine months ended September 30, 2020 and 2019:
Nine Months Ended September 30, 2020 | Nine Months Ended September 30, 2019 | $ Change | % Change | |||||||||||
Revenues: | ||||||||||||||
Rental revenue | ||||||||||||||
Apartment | $ | 37,881 | $ | 38,200 | $ | (319 | ) | (0.8 | )% | |||||
Industrial | 30,108 | 30,052 | 56 | 0.2 | ||||||||||
Office | 10,517 | 10,350 | 167 | 1.6 | ||||||||||
Retail | 31,965 | 33,883 | (1,918 | ) | (5.7 | ) | ||||||||
Other | 218 | 239 | (21 | ) | (8.8 | ) | ||||||||
Comparable properties total | $ | 110,689 | $ | 112,724 | $ | (2,035 | ) | (1.8 | )% | |||||
Recent acquisitions and sold properties | 28,681 | 8,763 | 19,918 | 227.3 | ||||||||||
Total rental revenue | $ | 139,370 | $ | 121,487 | $ | 17,883 | 14.7 | % | ||||||
Other revenue | ||||||||||||||
Apartment | $ | 2,090 | $ | 2,206 | $ | (116 | ) | (5.3 | )% | |||||
Industrial | 215 | 369 | (154 | ) | (41.7 | ) | ||||||||
Office | 68 | 48 | 20 | 41.7 | ||||||||||
Retail | 449 | 650 | (201 | ) | (30.9 | ) | ||||||||
Other | 904 | 1,749 | (845 | ) | (48.3 | ) | ||||||||
Comparable properties total | $ | 3,726 | $ | 5,022 | $ | (1,296 | ) | (25.8 | )% | |||||
Recent acquisitions and sold properties | 1,517 | 281 | 1,236 | 439.9 | ||||||||||
Total other revenue | $ | 5,243 | $ | 5,303 | $ | (60 | ) | (1.1 | )% | |||||
Total revenues | $ | 144,613 | $ | 126,790 | $ | 17,823 | 14.1 | % | ||||||
Rental revenue at comparable properties decreased by $2,035 for the nine months ended September 30, 2020 as compared to the same period in 2019. The decrease of $1,918 within our retail segment was primarily related to a reduction in rental revenue due to uncertainty of collectibility from tenants experiencing a decrease in operations from COVID-19. The decrease of $319 within the apartment segment was primarily related to a reduction in rental rates as well as lower rental revenue due to uncertainty of collectibility from tenants during the nine months ended September 30, 2020 as compared to the same period of 2019.
Other revenues relate mainly to parking and nonrecurring revenue such as lease termination fees. Other revenue at comparable properties decreased by $1,296 for the nine months ended September 30, 2020 as compared to the same period in 2019. The decrease is primarily related to approximately $845 of lower parking revenue at our parking garage in Miami as a result of reduced travel and shelter in place orders within the city of Miami. The decreases in industrial and retail are primarily related to lease termination fees received at Pinole Point Distribution Center in the amount of $350, Skokie Commons of $282 and Silverstone Marketplace of $105 during the nine months ended September 30, 2019, which did not occur during the same period of 2020.
43
Operating Expenses
The following chart sets forth real estate taxes, property operating expenses and provisions for doubtful accounts by reportable segment, for the nine months ended September 30, 2020 and 2019:
Nine Months Ended September 30, 2020 | Nine Months Ended September 30, 2019 | $ Change | % Change | |||||||||||
Operating expenses: | ||||||||||||||
Real estate taxes | ||||||||||||||
Apartment | $ | 7,523 | $ | 7,234 | $ | 289 | 4.0 | % | ||||||
Industrial | 5,034 | 4,895 | 139 | 2.8 | ||||||||||
Office | 1,047 | 994 | 53 | 5.3 | ||||||||||
Retail | 4,272 | 3,827 | 445 | 11.6 | ||||||||||
Other | 265 | 346 | (81 | ) | (23.4 | ) | ||||||||
Comparable properties total | $ | 18,141 | $ | 17,296 | $ | 845 | 4.9 | % | ||||||
Recent acquisitions and sold properties | 4,278 | 1,051 | 3,227 | 307.0 | ||||||||||
Total real estate taxes | $ | 22,419 | $ | 18,347 | $ | 4,072 | 22.2 | % | ||||||
Property operating expenses | ||||||||||||||
Apartment | $ | 11,438 | $ | 11,199 | $ | 239 | 2.1 | % | ||||||
Industrial | 2,356 | 2,302 | 54 | 2.3 | ||||||||||
Office | 1,485 | 1,508 | (23 | ) | (1.5 | ) | ||||||||
Retail | 5,210 | 5,301 | (91 | ) | (1.7 | ) | ||||||||
Other | 534 | 550 | (16 | ) | (2.9 | ) | ||||||||
Comparable properties total | $ | 21,023 | $ | 20,860 | $ | 163 | 0.8 | % | ||||||
Recent acquisitions and sold properties | 6,531 | 2,032 | 4,499 | 221.4 | ||||||||||
Total property operating expenses | $ | 27,554 | $ | 22,892 | $ | 4,662 | 20.4 | % | ||||||
Total operating expenses | $ | 49,973 | $ | 41,239 | $ | 8,734 | 21.2 | % | ||||||
Real estate taxes at comparable properties increased by $845 for the nine months ended September 30, 2020 as compared to the same period in 2019. Our properties are reassessed periodically by the taxing authorities, which may result in increases or decreases in the real estates taxes that we owe. Overall, we expect real estate taxes to increase over time; however, we utilize real estate tax consultants to attempt to control assessment increases.
Property operating expenses consist of the costs of ownership and operation of the real estate investments, many of which are recoverable under net leases. Examples of property operating expenses include insurance, utilities and repair and maintenance expenses. Property operating expenses at comparable properties were in line with the prior year.
44
The following chart sets forth expenses not directly related to the operations of the reportable segments for the nine months ended September 30, 2020 and 2019:
Nine Months Ended September 30, 2020 | Nine Months Ended September 30, 2019 | $ Change | % Change | |||||||||||
Property general and administrative | $ | 3,609 | $ | 1,230 | $ | 2,379 | 193.4 | % | ||||||
Advisor fees | 19,049 | 16,730 | 2,319 | 13.9 | ||||||||||
Company level expenses | 2,241 | 2,476 | (235 | ) | (9.5 | ) | ||||||||
Depreciation and amortization | 56,450 | 48,025 | 8,425 | 17.5 | ||||||||||
Interest expense | 32,191 | 29,085 | 3,106 | 10.7 | ||||||||||
Income from unconsolidated affiliates and fund investments | 16,186 | (4,057 | ) | 20,243 | (499.0 | ) | ||||||||
Loss (gain) on disposition of property and extinguishment of debt, net | 1,772 | (106,872 | ) | 108,644 | (101.7 | ) | ||||||||
Total expenses (income) | $ | 131,498 | $ | (13,383 | ) | $ | 144,881 | (1,083 | )% | |||||
Property general and administrative expenses relate mainly to property expenses unrelated to the operations of the property. Property general and administrative expenses increased for the nine months ended September 30, 2020 as compared to the same period in 2019 due to expenses incurred for unsuccessful acquisitions.
Advisor fees relate to the fixed advisory and performance fees earned by the Advisor. Fixed fees increase or decrease based on changes in our NAV, which will be primarily impacted by changes in capital raised and the value of our properties. The performance fee is accrued when the total return per share for a share class exceeds 7% for that calendar year, where in our Advisor will receive 10% of the excess total return above the 7% threshold. The increase in advisor fees of $2,319 for the nine months ended September 30, 2020 as compared to the same period of 2019 is related to the increase in our NAV attributable to capital raised over the past year.
Company level expenses relate mainly to our compliance and administration related costs. Company level expenses decreased $235 for the nine months ended September 30, 2020 as compared to the same period in 2019 primarily related to timing of professional service fees.
Depreciation and amortization expense is impacted by the values assigned to buildings, personal property and in-place lease assets as part of the initial purchase price allocation. Depreciation and amortization expense for the nine months ended September 30, 2020 as compared to the same period in 2019 increased as additional expense from acquisitions offset lower expenses from property dispositions.
Interest expense increased by $3,106 for the nine months ended September 30, 2020 as compared to the same period in 2019 as a result of unrealized losses on our interest rate swaps in addition to an increase in interest expense from increased borrowings on our Credit Facility and mortgage notes obtained on our recent acquisitions.
Income from unconsolidated affiliates and fund investments relates to the income from Chicago Parking Garage, Pioneer Tower, The Tremont and The Huntington as well as changes in fair value and operating distributions received from our investment in the NYC Retail Portfolio. During the nine months ended September 30, 2020, we recorded a $14,737 decrease in the fair value in the NYC Retail Portfolio as compared to a $1,845 increase in the fair value and no distributions of income during the same period of 2019. Also contributing was a decrease in income from Pioneer Tower and Chicago Parking Garage of approximately $1,825 and $571, due to lower revenue recognized due to uncertainty of collectibility from tenants as well as decreased parking revenue resulting from reduced travel and shelter in place orders in the cities of Portland and Chicago.
Loss (gain) on disposition of property and extinguishment of debt, net of $1,772 relates to the sale of 24823 Anza Drive and early payoff of the mortgage notes payable on Townlake of Coppell and The Penfield. The gain on disposition of property and extinguishment of debt in 2019 related to the property sale and payoff the mortgage note for 111 Sutter Street.
45
Funds From Operations
Consistent with real estate industry and investment community preferences, we consider funds from operations ("FFO") as a supplemental measure of the operating performance for a real estate investment trust and a complement to GAAP measures because it facilitates an understanding of the operating performance of our properties. The National Association of Real Estate Investment Trusts ("NAREIT") defines FFO as net income (loss) attributable to the Company (computed in accordance with GAAP), excluding gains or losses from cumulative effects of accounting changes, extraordinary items, impairment write-downs of depreciable real estate and sales of properties, plus real estate related depreciation and amortization and after adjustments for these items related to noncontrolling interests and unconsolidated affiliates.
FFO does not give effect to real estate depreciation and amortization because these amounts are computed to allocate the cost of a property over its useful life. We also use Adjusted FFO ("AFFO") as a supplemental measure of operating performance. We define AFFO as FFO adjusted for straight-line rental income, amortization of above- and below-market leases, amortization of net discount on assumed debt, gains or losses on the extinguishment and modification of debt, performance fees based on the investment returns on shares of our common stock and acquisition expenses. Because values for well-maintained real estate assets have historically increased or decreased based upon prevailing market conditions, we believe that FFO and AFFO provide investors with an additional view of our operating performance.
In order to provide a better understanding of the relationship between FFO, AFFO and GAAP net income, the most directly comparable GAAP financial reporting measure, we have provided reconciliations of GAAP net income attributable to Jones Lang LaSalle Income Property Trust, Inc. to FFO, and FFO to AFFO. FFO and AFFO do not represent cash flow from operating activities in accordance with GAAP, should not be considered alternatives to GAAP net income and are not measures of liquidity or indicators of the Company's ability to make cash distributions. We believe that to more comprehensively understand our operating performance, FFO and AFFO should be considered along with the reported net income attributable to Jones Lang LaSalle Income Property Trust, Inc. and our cash flows in accordance with GAAP, as presented in our consolidated financial statements. Our presentations of FFO and AFFO are not necessarily comparable to the similarly titled measures of other REITs due to the fact that not all REITs use the same definitions.
The following table presents a reconciliation of the most comparable GAAP amount of net income attributable to Jones Lang LaSalle Income Property Trust, Inc. to NAREIT FFO for the periods presented:
Reconciliation of GAAP net (loss) income to NAREIT FFO | Three Months Ended September 30, 2020 | Three Months Ended September 30, 2019 | Nine Months Ended September 30, 2020 | Nine Months Ended September 30, 2019 | |||||||||||
Net (loss) income attributable to Jones Lang LaSalle Income Property Trust, Inc. Common Stockholders (1) | $ | (10,122 | ) | $ | (4,882 | ) | $ | (36,875 | ) | $ | 98,891 | ||||
Real estate depreciation and amortization (1) | 21,122 | 20,322 | 63,211 | 54,471 | |||||||||||
Gain on disposition of property and unrealized loss (gain) on investment in unconsolidated real estate affiliate (1) | 2,648 | 510 | 13,090 | (108,949 | ) | ||||||||||
NAREIT FFO attributable to Jones Lang LaSalle Income Property Trust, Inc. Common Stockholders | $ | 13,648 | $ | 15,950 | $ | 39,426 | $ | 44,413 | |||||||
Weighted average shares outstanding, basic and diluted | 169,289,415 | 154,940,895 | 170,707,171 | 146,953,945 | |||||||||||
NAREIT FFO per share, basic and diluted | $ | 0.08 | $ | 0.10 | $ | 0.23 | $ | 0.30 | |||||||
________
(1) | Excludes amounts attributable to noncontrolling interests and includes our ownership share of both consolidated properties and unconsolidated real estate affiliates. |
46
We believe AFFO is useful to investors because it provides supplemental information regarding the performance of our portfolio over time.
The following table presents a reconciliation of NAREIT FFO to AFFO for the periods presented:
Reconciliation of NAREIT FFO to AFFO | Three Months Ended September 30, 2020 | Three Months Ended September 30, 2019 | Nine Months Ended September 30, 2020 | Nine Months Ended September 30, 2019 | |||||||||||
NAREIT FFO attributable to Jones Lang LaSalle Income Property Trust, Inc. Common Stockholders | $ | 13,648 | $ | 15,950 | $ | 39,426 | $ | 44,413 | |||||||
Straight-line rental income (1) | (748 | ) | (1,080 | ) | (919 | ) | (2,387 | ) | |||||||
Amortization of above- and below-market leases (1) | (674 | ) | (802 | ) | (2,032 | ) | (2,192 | ) | |||||||
Amortization of net discount on assumed debt (1) | (27 | ) | (14 | ) | (81 | ) | 118 | ||||||||
Loss (gain) on derivative instruments and extinguishment or modification of debt (1) | 2,516 | 1,354 | 8,820 | 7,265 | |||||||||||
Adjustment for investment accounted for under the fair value option (2) | 153 | 17 | 1,528 | 695 | |||||||||||
Acquisition expenses | 33 | — | 2,114 | — | |||||||||||
AFFO attributable to Jones Lang LaSalle Income Property Trust, Inc. Common Stockholders | $ | 14,901 | $ | 15,425 | $ | 48,856 | $ | 47,912 | |||||||
Weighted average shares outstanding, basic and diluted | 169,289,415 | 154,940,895 | 170,707,171 | 146,953,945 | |||||||||||
AFFO per share, basic and diluted | $ | 0.09 | $ | 0.10 | $ | 0.29 | $ | 0.33 | |||||||
________
(1) | Excludes amounts attributable to noncontrolling interests and includes our ownership share of both consolidated properties and unconsolidated real estate affiliates. |
(2) | Represents the normal and recurring AFFO reconciling adjustments for the NYC Retail Portfolio. |
47
NAV as of September 30, 2020
The following table provides a breakdown of the major components of our NAV as of September 30, 2020:
September 30, 2020 | |||||||||||||||||||||||
Component of NAV | Class A Shares | Class M Shares | Class A-I Shares | Class M-I Shares | Class D Shares | Total | |||||||||||||||||
Real estate investments (1) | $ | 1,493,506 | $ | 598,255 | $ | 160,927 | $ | 497,681 | $ | 82,911 | $ | 2,833,280 | |||||||||||
Debt | (498,533 | ) | (199,698 | ) | (53,717 | ) | (166,126 | ) | (27,676 | ) | (945,750 | ) | |||||||||||
Other assets and liabilities, net | 38,063 | 15,247 | 4,101 | 12,684 | 2,113 | 72,208 | |||||||||||||||||
Estimated enterprise value premium | None assumed | None assumed | None assumed | None assumed | None assumed | None assumed | |||||||||||||||||
NAV | $ | 1,033,036 | $ | 413,804 | $ | 111,311 | $ | 344,239 | $ | 57,348 | $ | 1,959,738 | |||||||||||
Number of outstanding shares | 89,377,739 | 35,736,129 | 9,604,614 | 29,715,005 | 4,957,915 | ||||||||||||||||||
NAV per share | $ | 11.56 | $ | 11.58 | $ | 11.59 | $ | 11.58 | $ | 11.57 | |||||||||||||
________
(1) | The value of our real estate investments was greater than the historical cost by 3.3% as of September 30, 2020. |
The following table provides a breakdown of the major components of our NAV as of December 31, 2019:
December 31, 2019 | |||||||||||||||||||||||
Component of NAV | Class A Shares | Class M Shares | Class A-I Shares | Class M-I Shares | Class D Shares | Total | |||||||||||||||||
Real estate investments (1) | $ | 1,552,723 | $ | 689,964 | $ | 197,282 | $ | 399,430 | $ | 87,543 | $ | 2,926,942 | |||||||||||
Debt | (509,806 | ) | (226,536 | ) | (64,774 | ) | (131,145 | ) | (28,743 | ) | (961,004 | ) | |||||||||||
Other assets and liabilities, net | 32,375 | 14,386 | 4,114 | 8,328 | 1,825 | 61,028 | |||||||||||||||||
Estimated enterprise value premium | None assumed | None assumed | None assumed | None assumed | None assumed | None assumed | |||||||||||||||||
NAV | $ | 1,075,292 | $ | 477,814 | $ | 136,622 | $ | 276,613 | $ | 60,625 | $ | 2,026,966 | |||||||||||
Number of outstanding shares | 88,007,721 | 39,036,770 | 11,153,567 | 22,589,599 | 4,957,915 | ||||||||||||||||||
NAV per share | $ | 12.22 | $ | 12.24 | $ | 12.25 | $ | 12.25 | $ | 12.23 | |||||||||||||
________
(1) | The value of our real estate investments was greater than the historical cost by 5.9% as of December 31, 2019. |
The decrease in NAV per share from December 31, 2019 to September 30, 2020, was related to a net decrease of 2.6% in the value of our portfolio. Property operations for the nine months ended September 30, 2020 had an insignificant impact on NAV as dividends declared offset property operations for the period. Our NAV for the different share classes is reduced by normal and recurring class-specific fees and offering and organization costs.
The following are key assumptions (shown on a weighted-average basis) that are used in the discounted cash flow models to estimate the value of our real estate investments as of September 30, 2020:
Apartment | Industrial | Office | Retail | Other (1) | Total Company | ||||||||||||
Exit capitalization rate | 5.18 | % | 5.53 | % | 5.72 | % | 5.58 | % | 6.25 | % | 5.48 | % | |||||
Discount rate/internal rate of return (IRR) | 6.44 | 6.13 | 6.50 | 6.37 | 7.89 | 6.36 | |||||||||||
Annual market rent growth rate | 2.99 | 2.89 | 2.83 | 2.50 | 3.13 | 2.81 | |||||||||||
Holding period (years) | 10.00 | 10.00 | 10.00 | 10.00 | 22.60 | 10.14 | |||||||||||
________
(1) | Other includes two standalone parking garages. South Beach Parking Garage is subject to a ground lease and the appraisal incorporates discounted cash flows over its remaining lease term and therefore does not utilize an exit capitalization rate. |
48
The following are key assumptions (shown on a weighted-average basis) that are used in the discounted cash flow models to estimate the value of our real estate investments as of December 31, 2019:
Apartment | Industrial | Office | Retail | Other (1) | Total Company | ||||||||||||
Exit capitalization rate | 5.21 | % | 5.53 | % | 5.56 | % | 5.56 | % | 6.25 | % | 5.45 | % | |||||
Discount rate/internal rate of return (IRR) | 6.46 | 6.14 | 6.31 | 6.30 | 7.89 | 6.33 | |||||||||||
Annual market rent growth rate | 3.10 | 3.02 | 2.93 | 3.02 | 3.30 | 3.03 | |||||||||||
Holding period (years) | 10.00 | 10.00 | 10.00 | 10.00 | 21.95 | 10.16 | |||||||||||
________
(1) | Other includes Chicago and South Beach parking garages. South Beach Parking Garage is subject to a ground lease, the appraisal incorporates discounted cash flows over its remaining lease term and therefore does not utilize an exit capitalization rate. |
While we believe our assumptions are reasonable, a change in these assumptions would impact the calculation of the value of our real estate investments. For example, assuming all other factors remain unchanged, the changes listed below would result in the following effects on our real estate investment value:
Input | September 30, 2020 | December 31, 2019 | ||||||
Discount Rate - weighted average | 0.25% increase | (1.9 | )% | (2.0 | )% | |||
Exit Capitalization Rate - weighted average | 0.25% increase | (2.8 | ) | (2.8 | ) | |||
Annual market rent growth rate - weighted average | 0.25% decrease | (1.4 | ) | (1.5 | ) | |||
The fair value of our mortgage notes and other debt payable was estimated to be approximately $45,162 and $21,360 higher than the carrying values at September 30, 2020 and December 31, 2019, respectively. The NAV per share would have decreased by $0.26 and $0.19 per share at September 30, 2020 and December 31, 2019, respectively, if we were to have included the fair value of our mortgage notes and other debt payable in our methodology to determine NAV.
The selling commission and dealer manager fee are offering costs and will be recorded as a reduction of capital in excess of par value. Selling commissions are paid on the date of sale of our common stock. We accrue all future dealer manager fees up to the ten percent regulatory limit on the date of sale of our common stock. For NAV calculation purposes, dealer manger fees are accrued daily, on a continuous basis equal to 1/365th of the stated fee. Dealer manager fees payable are included in accrued offering costs on our Consolidated Balance Sheets. Dealer manager fees payable as of September 30, 2020 and December 31, 2019 were $102,645 and $93,450, respectively.
49
The following table reconciles stockholders' equity per our Consolidated Balance Sheet to our NAV:
September 30, 2020 | |||
Stockholders' equity under GAAP | $ | 1,418,792 | |
Adjustments: | |||
Accrued dealer manager fees (1) | 100,076 | ||
Organization and offering costs (2) | 222 | ||
Unrealized real estate appreciation (3) | 82,699 | ||
Accumulated depreciation, amortization and other (4) | 357,949 | ||
NAV | $ | 1,959,738 | |
________
(1) | Accrued dealer manager fees represents the accrual for future dealer manager fees for Class A, Class M and Class A-I shares. We accrue all future dealer manager fees up to the ten percent regulatory limit on the date of sale of our common stock as an offering cost. For NAV calculation purposes, dealer manger fees are accrued daily, on a continuous basis equal to 1/365th of the stated fee. |
(2) | The Advisor advanced organization and offering costs on our behalf through July 6, 2018. Such costs are reimbursed to the Advisor ratably over 36 months through July 5, 2021. Under GAAP, organization costs are expensed as incurred and offering costs are charged to equity as such amounts are incurred. For NAV, such costs are recognized as a reduction to NAV ratably over 36 months. |
(3) | Our investments in real estate are presented under historical cost in our GAAP Consolidated Financial Statements. As such, any increases in the fair market value of our investments in real estate are not included in our GAAP results. For purposes of determining our NAV, our investments in real estate are recorded at fair value. |
(4) | We depreciate our investments in real estate and amortize certain other assets and liabilities in accordance with GAAP. Such depreciation and amortization is not recorded for purposes of determining our NAV. Additionally, we make other fair value adjustments to our NAV to account for differences with historical cost GAAP; an example would be straight-line rent revenue. |
Limitations and Risks
As with any valuation methodology, our methodology is based upon a number of estimates and assumptions that may not be accurate or complete. Our valuation methodology may not result in the determination of the fair value of our net assets as our mortgage notes and other debt payable are valued at cost. Different parties with different assumptions and estimates could derive a different NAV per share. Accordingly, with respect to our NAV per share, we can provide no assurance that:
• | a stockholder would be able to realize this NAV per share upon attempting to resell his or her shares; |
• | we would be able to achieve for our stockholders the NAV per share upon a listing of our shares of common stock on a national securities exchange, selling our real estate portfolio or merging with another company; or |
• | the NAV per share, or the methodologies relied upon to estimate the NAV per share, will be found by any regulatory authority to comply with any regulatory requirements. |
Furthermore, the NAV per share was calculated as of a particular point in time. The NAV per share will fluctuate over time in response to, among other things, changes in real estate market fundamentals, capital markets activities and attributes specific to the properties and leases within our portfolio.
50
Liquidity and Capital Resources
Our primary uses and sources of cash are as follows:
Uses | Sources | |||
Short-term liquidity and capital needs such as: | • | Operating cash flow, including the receipt of distributions of our share of cash flow produced by our unconsolidated real estate affiliates and fund investment | ||
• | Interest payments on debt | |||
• | Distributions to stockholders | • | Proceeds from secured loans collateralized by individual properties | |
• | Fees payable to our Advisor | |||
• | Minor improvements made to individual properties that are not recoverable through expense recoveries or common area maintenance charges to tenants | • | Proceeds from our Revolving Line of Credit | |
• | Sales of our shares | |||
• | General and administrative costs | • | Sales of real estate investments | |
• | Costs associated with capital raising in our continuous public offering, private offering and DST Program | • | Proceeds from our private offering | |
• | Other Company level expenses | • | Draws from lender escrow accounts | |
• | Lender escrow accounts for real estate taxes, insurance, and capital expenditures | • | Sales of beneficial interests in the DST Program | |
• | Fees payable to our Dealer Manager | |||
Longer-term liquidity and capital needs such as: | ||||
• | Acquisitions of new real estate investments | |||
• | Expansion of existing properties | |||
• | Tenant improvements and leasing commissions | |||
• | Debt repayment requirements, including both principal and interest | |||
• | Repurchases of our shares pursuant to our share repurchase plan | |||
• | Fees payable to our Advisor | |||
• | Fees payable to our Dealer Manager | |||
The sources and uses of cash for the nine months ended September 30, 2020 and 2019 were as follows:
Nine Months Ended September 30, 2020 | Nine Months Ended September 30, 2019 | $ Change | |||||||||
Net cash provided by operating activities | $ | 51,558 | $ | 50,225 | $ | 1,333 | |||||
Net cash used in investing activities | (107,692 | ) | (180,149 | ) | 72,457 | ||||||
Net cash provided by financing activities | 30,157 | 153,001 | (122,844 | ) | |||||||
Net cash provided by operating activities increased by $1,333 for the nine months ended September 30, 2020 as compared to the same period in 2019. The increase in cash from operating activities is primarily due to cash provided from recent acquired properties and is partially offset by decreases in the operating distributions received from our unconsolidated joint ventures as well as lower cash receipts from our retail segment.
Net cash used in investing activities decreased by $72,457 for the nine months ended September 30, 2020 as compared to the same period in 2019. The decrease was primarily related to fewer acquisitions made during the nine months ended September 30, 2020 as compared to the same period in 2019, offset partially by the cash received from the sale of 111 Sutter Street in the first quarter of 2019.
Net cash provided by financing activities decreased by $122,844 for the nine months ended September 30, 2020 as compared to the same period in 2019. The change is primarily related to an increase in stock repurchases of $147,457 and a decrease in cash received from stock issuance of $55,737 during the nine months ended September 30, 2020 as compared to the same period in 2019. This is offset by an increase in net debt proceeds totaling $92,457 during the nine months ended September 30, 2020 as compared to the same period in 2019 resulting from draws on our Credit Facility in 2020.
51
Financing
We have relied primarily on fixed-rate financing, locking in what were favorable spreads between real estate income yields and mortgage interest rates and have tried to maintain a balanced schedule of debt maturities. We also use interest rate derivatives to manage our exposure to interest rate movements on our variable rate debt. The following consolidated debt table provides information on the outstanding principal balances and the weighted average interest rates at September 30, 2020 and December 31, 2019:
Consolidated Debt | |||||||||||||
September 30, 2020 | December 31, 2019 | ||||||||||||
Principal Balance | Weighted Average Interest Rate | Principal Balance | Weighted Average Interest Rate | ||||||||||
Fixed | $ | 841,012 | 3.66 | % | $ | 843,135 | 3.64 | % | |||||
Variable | 50,000 | 1.55 | — | — | |||||||||
Total | $ | 891,012 | 3.54 | % | $ | 843,135 | 3.64 | % | |||||
Covenants
At September 30, 2020, we were in compliance with all debt covenants.
Other Sources
On July 6, 2018, our Second Extended Public Offering registration statement was declared effective with the SEC (Commission File No. 333-222533) to register up to $3,000,000 in any combination of shares of our Class A, Class M, Class A-I and Class M-I common stock, consisting of up to $2,700,000 of shares offered in our primary offering and up to $300,000 in shares offered pursuant to our distribution reinvestment plan. We intend to offer shares of our common stock on a continuous basis for an indefinite period of time by filing a new registration statement before the end of each three-year offering period, subject to regulatory approval. We intend to use the net proceeds from the Second Extended Public Offering, which are not used to pay the fees and other expenses attributable to our operations, to (1) grow and further diversify our portfolio by making investments in accordance with our investment strategy and policies, (2) repay indebtedness incurred under various financing instruments and (3) fund repurchases under our share repurchase plan.
On March 3, 2015, we commenced the Follow-on Private Offering of up to $350,000 in shares of our Class D common stock with an indefinite duration. Proceeds from our Follow-on Private Offering will be used for the same corporate purposes as the proceeds of our First Extended Public Offering. We will reserve the right to terminate the Follow-on Private Offering at any time and to extend the Follow-on Private Offering term to the extent permissible under applicable law.
On October 16, 2019, through our operating partnership, we initiated the DST Program to raise up to $500,000, which our board of directors may increase in its sole discretion, in private placements exempt from registration under the Securities Act, as amended, through the sale of beneficial interests to accredited investors in specific Delaware statutory trusts holding real properties, which may be sourced from our real properties or from third parties.
Contractual Cash Obligations and Commitments
From time to time, we enter into contingent agreements for the acquisition and financing of properties. Such acquisitions and financings are subject to satisfactory completion of due diligence or meeting certain leasing or occupancy thresholds.
We are subject to fixed ground lease payments on South Beach Parking Garage of $100 per year until September 30, 2021 and these payments will increase every five years thereafter by the lesser of 12% or the cumulative CPI over the previous five year period. We are also subject to a variable ground lease payment calculated as 2.5% of revenue. The lease expires September 30, 2041 and has a ten-year renewal option.
The operating agreement for Presley Uptown allows the unrelated third party joint venture partner, owning a 2.5% interest, to put its interest to us at a market determined value starting September 30, 2022 until September 30, 2024.
52
Off Balance Sheet Arrangements
At September 30, 2020, we had approximately $110 in an outstanding letter of credit that is not reflected on our balance sheet. We have no other off balance sheet arrangements.
Distributions to Stockholders
To remain qualified as a REIT for federal income tax purposes, we must distribute or pay tax on 100% of our capital gains and distribute at least 90% of ordinary taxable income to stockholders.
The following factors, among others, will affect operating cash flow and, accordingly, influence the decisions of our board of directors regarding distributions:
• | scheduled increases in base rents of existing leases; |
• | changes in minimum base rents and/or overage rents attributable to replacement of existing leases with new or renewal leases; |
• | changes in occupancy rates at existing properties and procurement of leases for newly acquired or developed properties; |
• | necessary capital improvement expenditures or debt repayments at existing properties; |
• | ability of our tenants to pay rent as a result of the impact of COVID-19 on their financial condition; and |
• | our share of distributions of operating cash flow generated by the unconsolidated real estate affiliates, less management costs and debt service on additional loans that have been or will be incurred. |
We anticipate that operating cash flow, cash on hand, proceeds from dispositions of real estate investments or refinancings will provide adequate liquidity to conduct our operations, fund general and administrative expenses, fund operating costs and interest payments and allow distributions to our stockholders in accordance with the REIT qualification requirements of the Internal Revenue Code of 1986, as amended.
Item 3. | Quantitative and Qualitative Disclosures About Market Risk. |
We are subject to market risk associated with changes in interest rates in terms of our variable-rate debt and the price of new fixed-rate debt for refinancing of existing debt. We manage our interest rate risk exposure by obtaining fixed-rate loans where possible as well as by entering into interest rate cap and swap agreements. As of September 30, 2020, we had consolidated debt of $891,012. Including the $3,309 net debt discount on assumed debt and debt issuance costs, we have consolidated debt of $887,703 at September 30, 2020. We also entered into interest rate swap agreements on $212,800 of debt, which cap the LIBOR rate at between 1.0% and 2.6%.
We are subject to interest rate risk with respect to our fixed-rate financing in that changes in interest rates will impact the fair value of our fixed-rate financing. To determine fair market value, the fixed-rate debt is discounted at a rate based on an estimate of current lending rates, assuming the debt is outstanding through maturity and considering the collateral. At September 30, 2020, the fair value of our consolidated debt was estimated to be $33,303 higher than the carrying value of $891,012. If treasury rates were 0.25% higher at September 30, 2020, the fair value of our consolidated debt would have been $24,013 higher than the carrying value. A 0.25% movement in the interest rate on the $50,000 of variable-rate debt would have resulted in a $125 annualized increase or decrease in consolidated interest expense and cash flow from operating activities.
53
Item 4. | Controls and Procedures. |
Evaluation of Disclosure Controls and Procedures
Under the supervision and with the participation of our management, including our chief executive officer and chief financial officer, we conducted an evaluation of the effectiveness of the design and operation of our disclosure controls and procedures (as defined in Rules 13a-15(e) and 15d-15(e) under the Exchange Act), as of the end of the period covered by this report. Based on management’s evaluation as of September 30, 2020, our chief executive officer and chief financial officer concluded that our disclosure controls and procedures were effective to provide reasonable assurance that the information required to be disclosed by us in our reports that we file or submit under the Exchange Act is recorded, processed, summarized and reported within the time periods specified in the SEC’s rules and forms and such information is accumulated and communicated to management, including our chief executive officer and chief financial officer, as appropriate, to allow timely decisions regarding required disclosure.
Changes in Internal Control Over Financial Reporting
There have not been any changes in our internal control over financial reporting (as such term is defined in Rule 13a-15(f) under the Securities and Exchange Act of 1934, as amended) during the quarter ended September 30, 2020 that have materially affected, or are reasonably likely to materially affect, our internal control over financial reporting. We have not experienced any material impact to our internal control over financial reporting to date as a result of most of the employees of our Advisor and its affiliates working remotely due to the COVID-19 pandemic. We are continually monitoring and assessing the COVID-19 pandemic on our internal controls to minimize the impact to their design and operating effectiveness.
PART II
OTHER INFORMATION
Item 1. | Legal Proceedings. |
We are involved in various claims and litigation matters arising in the ordinary course of business, some of which involve claims for damages. Many of these matters are covered by insurance, although they may nevertheless be subject to deductibles or retentions. Although the ultimate liability for these matters cannot be determined, based upon information currently available, we believe the ultimate resolution of such claims and litigation will not have a material adverse effect on our financial position, results of operations or liquidity.
Item 1A. | Risk Factors. |
The most significant risk factors applicable to the Company are described in Item 1A to our 2019 Form 10-K. The following risk factors supplement the risk factors contained in our 2019 Form 10-K:
The continuing spread of a new strain of coronavirus, which causes the viral disease known as COVID-19, may adversely affect our investments and operations.
The World Health Organization has declared COVID-19 a pandemic, the Health and Human Services Secretary has declared a public health emergency in the United States in response to the outbreak and the President of the United States has declared the COVID-19 outbreak a national emergency. Considerable uncertainty still surrounds COVID-19 and its potential effects, and the extent of and effectiveness of any responses taken on a national and local level. COVID-19 is expected to result in a world-wide economic downturn that will lead to corporate bankruptcies in the most affected industries and has already led to a substantial increase in unemployment.
As a result of our property investments being located in the United States, COVID-19 will impact our properties and operating results to the extent that its continued spread within the United States reduces occupancy, increases the cost of operation or results in limited hours of operation or necessitates the closure of such properties. In addition, quarantines, states of emergencies and other measures taken to curb the spread of COVID-19 may negatively impact the ability of such properties to continue to obtain necessary goods and services or provide adequate staffing, which may also adversely affect our properties and operating results. With respect to our retail properties, individual stores and shopping centers have been, and may continue to be, closed for an extended period of time or only open certain hours of the day. Our retail, office and industrial properties may be negatively impacted by tenant bankruptcies and defaults. Our multifamily properties may be impacted by declining household incomes and wealth and resulting delinquencies or vacancies.
54
The economic downturn resulting from COVID-19 could negatively impact our investments and operations, as well as our ability to make distributions to stockholders. The extent to which COVID-19 impacts our investments and operations will depend on future developments, which are highly uncertain and cannot be predicted with confidence, including the duration of the outbreak, new information that may emerge concerning the severity of COVID-19 and the actions taken to contain COVID-19 or treat it, among others.
Our NAV per share may suddenly change if the appraised values of our properties materially change from prior appraisals or the actual operating results for a particular month differ from what we originally budgeted for that month.
Each of our properties will be appraised at least once per quarter and, under normal circumstances, will not be appraised more frequently than once per quarter. Properties may be valued more frequently than quarterly if our advisor or independent valuation advisor believes that the value of such property has changed materially since the most recent quarterly valuation. As such, when these appraisals are reflected in our NAV calculation, there may be a sudden change in our NAV per share for each class of our common stock. These changes in a property’s value may be as a result of property-specific events or as a result of more general changes to real estate values resulting from local, national or global economic changes, including as a result of the COVID-19 pandemic. We accrue estimated income and expenses on a daily basis based on our budgets. On an ongoing basis, we adjust the income and expenses we accrued to reflect the income and expenses actually earned and incurred. As a result, actual operating results may differ from what we originally budgeted, which may cause a sudden increase or decrease in the NAV per share amounts. We do not retroactively adjust the NAV per share of each class for each day. Therefore, because the actual results from operations may be better or worse than what we previously budgeted, the adjustment to reflect actual operating results may cause the NAV per share for each class of our common stock to increase or decrease, and such increase or decrease will occur on the day the adjustment is made.
The NAV per share that we publish may not necessarily reflect changes in our NAV that are not immediately quantifiable.
From time to time, we may experience events with respect to our investments that may have a material impact on our NAV. For example, an unexpected termination or renewal of a material lease, a material change in vacancies or an unanticipated structural or environmental event at a property may cause the value of a property to change materially. The NAV per share of each class of our common stock as published on any given day may not reflect such extraordinary events to the extent that their financial impact is not immediately quantifiable, including as a result of economic fallout from the COVID-19 pandemic. As a result, the NAV per share of each class published after the announcement of a material event may differ significantly from our actual NAV per share for such class until such time as the financial impact is quantified and our NAV is appropriately adjusted in accordance with our valuation guidelines. The resulting potential disparity in our NAV may inure to the benefit of stockholders whose shares are repurchased or new stockholders, depending on whether our published NAV per share for such class is overstated or understated.
In addition, our independent valuation advisor has informed us that its appraisals will now contain a disclosure that because the impact of COVID-19 on the commercial real estate market is rapidly evolving, the future impacts of COVID-19 are not known at this time and will depend on many factors. Although the independent valuation advisor has adjusted the appraisal conclusions to the extent the independent valuation advisor believes to be appropriate in light of material events such as the COVID-19 outbreak, the independent valuation advisor’s assumptions may differ from other parties’. As a result, the property appraisals we receive from our independent valuation advisor may not fully take into account the rapid changes to the value of properties resulting from COVID-19 and the price per share paid by new investors may be higher than the actual value of our common stock.
Changes in economic and capital markets conditions, including periods of generally deteriorating real estate industry fundamentals, may significantly affect our results of operations and returns to our stockholders.
We are subject to risks generally incident to the ownership of real estate investments, including changes in global, national, regional or local economic, demographic and real estate market conditions, as well as other factors particular to the locations of our investments. The recent COVID-19 pandemic is expected to continue to have a significant impact on local, national and global economies and has resulted in a world-wide economic slowdown. A recession could adversely impact our investments as a result of, among other items, increased tenant defaults under our leases, lower demand for rentable space, as well as potential oversupply of rentable space, each of which could lead to increased concessions, tenant improvement expenditures or reduced rental rates to maintain occupancies. These conditions could also adversely impact the financial condition of the tenants that occupy our real properties and, as a result, their ability to pay us rents.
To the extent that a general economic slowdown is prolonged or becomes more severe or real estate fundamentals deteriorate, it may have a significant and adverse impact on the values of our assets, revenues, results from operations, financial condition, liquidity, overall business prospects and ultimately our ability to pay distributions to our stockholders.
55
Any market deterioration may cause the future value of our real estate investments to decline.
If the current economic or real estate environment were to worsen in the markets where our properties are located, our NAV per share of our common stock may experience more volatility or decline as a result. The fallout from the ongoing COVID-19 pandemic is uncertain and is expected to have a significant negative impact on the real estate market. Volatility in the fair value and operating performance of commercial real estate has made estimating cash flows from our real estate investments difficult, since such estimates are dependent upon our judgment regarding numerous factors, including, but not limited to, current and potential future refinancing availability, fluctuations in regional or local real estate values and fluctuations in regional or local rental or occupancy rates, real estate tax rates and other operating expenses.
We cannot assure our stockholders that we will not have to realize or record impairment charges, or experience disruptions in cash flows and/or permanent losses related to our real estate investments or decreases in our NAV per share of our common stock in future periods. In addition, to the extent that volatile markets persist, these conditions could adversely impact our ability to potentially sell our real estate investments at a price and with terms acceptable to us or at all.
Shares of our common stock are offered on a “best efforts” basis, and if we are unable to raise substantial funds, we will be limited in the number and type of investments we may make with the offering proceeds, which could negatively impact a stockholders’ investment.
Shares of our common stock are offered on a “best efforts” basis, whereby the broker-dealers and registered investment advisors participating in the offering are only required to use their best efforts to sell shares of our common stock, have no firm commitment or obligation to purchase any of the shares of our common stock available in the offering, and may at any time suspend or restrict the purchase of the shares of our common stock for any or no reason. If we are unable to raise substantial funds, our fixed operating expenses as a percentage of gross income could increase, and our financial condition and ability to pay distributions could be adversely affected.
Economic events that may cause our stockholders to request that we repurchase their shares may materially adversely affect our cash flow and our ability to achieve our investment objectives.
Economic events affecting the U.S. and global economies, such as the general negative performance of the real estate sector, and the turbulence in the stock market related to the COVID-19 pandemic, could cause our stockholders to seek to have us repurchase their shares pursuant to our share repurchase plan. Our share repurchase plan limits the amount of funds we may use for repurchases during each calendar quarter to 5% of the combined NAV of all classes of shares as of the last day of the previous calendar quarter. Even if we are able to satisfy all resulting repurchase requests, our cash flow could be materially adversely affected. In addition, if we determine to sell assets to satisfy repurchase requests, our ability to achieve our investment objectives, including, without limitation, diversification of our portfolio by property type and location, moderate financial leverage, conservative operating risk and an attractive level of current income, could be adversely affected.
Economic events that may cause the broker-dealers participating in the offering of shares of our common stock to suspend or restrict the purchase of our shares of common stock may materially adversely affect our cash flow and our ability to achieve our investment objectives.
Economic events affecting the U.S. and global economies, such as the general negative performance of the real estate sector, and the turbulence in the stock market related to the COVID-19 pandemic, could cause the broker-dealers participating in the offering of shares of our common stock to suspend or restrict the purchase of our shares of common stock. Depending on the number or size of the participating broker-dealers taking this action, our cash flow could be materially adversely affected. In addition, our ability to achieve our investment objectives, including, without limitation, diversification of our portfolio by property type and location, moderate financial leverage, conservative operating risk and an attractive level of current income, could be adversely affected.
56
We rely on information technology in our operations, and any material failure, inadequacy, interruption or security failure of that technology or other business interruption could harm our business.
We rely on information technology networks and systems, including the Internet, to process, transmit and store electronic information and to manage or support a variety of our business processes, including financial transactions and maintenance of records, which may include confidential information of tenants and lease data. We rely on commercially available systems, software, tools and monitoring to provide security for processing, transmitting and storing confidential tenant information, such as individually identifiable information relating to financial accounts. Although we have taken steps to protect the security of the data maintained in our information systems, there is no guarantee that our security measures will be able to prevent the systems’ improper functioning, or the improper disclosure of personally identifiable information such as in the event of cyber attacks. Security breaches include physical or electronic break-ins, computer viruses, attacks by hackers and similar breaches. To date, we have seen no material impact on our business or operations from these attacks or events. Any future significant compromise or breach on our data security could create system disruptions, shutdowns or unauthorized disclosure of confidential information. Any failure to maintain proper function, security and availability of our information systems could interrupt our operations, damage our reputation, subject us to liability claims or regulatory penalties and could materially and adversely affect us. In addition, as the regulatory environment related to information security, data collection and use, and privacy becomes increasingly rigorous, with new and constantly changing requirements applicable to our business, compliance with those requirements could also result in additional costs.
Other disruptive events, including, but not limited to, natural disasters and public health or pandemic crises (such as COVID-19), may adversely affect our ability to conduct business. Such adverse effects may include the inability of our advisor’s employees, or the employees of its affiliates and other service providers, to perform their responsibilities as a result of any such event. Such disruptions to our business operations can result in significant operational issues.
We depend on tenants for our revenue, and accordingly, lease terminations and/or tenant defaults, particularly by one of our significant tenants, could adversely affect the income produced by our properties, which may harm our operating performance, thereby limiting our ability to pay distributions to our stockholders.
The success of our investments depends on the financial stability of our tenants, any of whom may experience a change in their business at any time, including as a result of global economic events, natural disasters and public health or pandemic crises. Our tenants may delay lease commencements, decline to extend or renew their leases upon expiration, fail to make rental payments when due, or declare bankruptcy. Any of these actions could result in the termination of the tenants’ leases, or expiration of existing leases without renewal, and the loss of rental income attributable to the terminated or expired leases. In the event of a tenant default or bankruptcy, we may experience delays in enforcing our rights as a landlord and may incur substantial costs in protecting our investment and re-letting our property. If significant leases are terminated or defaulted upon, we may be unable to lease the property for the rent previously received or sell the property without incurring a loss. In addition, significant expenditures, such as mortgage payments, real estate taxes and insurance and maintenance costs, are generally fixed and do not decrease when revenues at the related property decrease.
The occurrence of any of the situations described above, particularly if it involves one of our significant tenants, could seriously harm our operating performance. If any of these significant tenants were to default on its lease obligation(s) to us or not extend current leases as they mature, our results of operations and ability to pay distributions to our stockholders could be adversely affected. The revenues generated by the properties these tenants occupy are substantially dependent upon the financial condition of these tenants and, accordingly, any event of bankruptcy, insolvency, or a general downturn in the business of any of these tenants may result in the failure or delay of such tenant’s rental payments, which may have a substantial adverse effect on our operating performance.
57
Our operating results are affected by economic and regulatory changes that impact the real estate market in general.
Real estate historically has experienced significant fluctuations and cycles in value that have resulted in changes in the value of properties. Real estate will continue to be subject to such fluctuations and cycles in value in the future that may negatively impact the value of our properties. The value of our properties will depend on many factors beyond our control. The value of our properties depends upon our ability to operate our properties in a manner sufficient to maintain or increase revenues in excess of operating expenses and debt service. The values of our properties may be adversely affected by:
• | changes in national or international economic conditions; |
• | the cyclicality of real estate; |
• | changes in local market conditions due to changes in general or local economic conditions and neighborhood characteristics; |
• | the financial condition of tenants, buyers and sellers of properties; |
• | acts of God, earthquakes, hurricanes, climate change and other natural disasters, acts of war, acts of terrorism (any of which may result in uninsured losses), epidemics and pandemics such as the COVID-19 pandemic; |
• | competition from other properties offering the same or similar services; |
• | changes in interest rates and in the availability, cost and terms of mortgage debt; |
• | access to capital; |
• | the impact of present or future environmental legislation and compliance with environmental laws; |
• | the ongoing need for capital improvements (particularly in older structures); |
• | changes in real estate tax rates and other operating expenses; |
• | adverse changes in governmental rules and fiscal policies; |
• | civil unrest; |
• | adverse changes in zoning laws; and |
• | other factors that are beyond our control. |
All of these factors are beyond our control. Any negative changes in these factors could affect our ability to meet our obligations and pay distributions to stockholders.
Renewed uncertainty and volatility in the credit markets could affect our ability to obtain debt financing on reasonable terms, or at all, which could reduce the number of properties we may be able to acquire and the amount of cash distributions we can make to our stockholders.
The U.S. and global credit markets have historically experienced severe dislocations and liquidity disruptions, which caused volatility in the credit spreads on prospective debt financings and constrained the availability of debt financing due to the reluctance of lenders to offer financing at high leverage ratios. Renewed uncertainty in the credit markets, including as a result of global economic events, natural disasters and public health or pandemic crises, may adversely impact our ability to access additional debt financing on reasonable terms or at all, which may adversely affect investment returns on future acquisitions or our ability to make acquisitions.
If mortgage debt is unavailable on reasonable terms as a result of increased interest rates, increased credit spreads, decreased liquidity or other factors, we may not be able to finance the initial purchase of properties. In addition, when we incur mortgage debt on properties, we run the risk of being unable to refinance such debt upon maturity, or of being unable to refinance on favorable terms. As of December 31, 2019, we had approximately $743,000 in aggregate outstanding mortgage notes payable, which had maturity dates through March 1, 2054.
If interest rates are higher or other financing terms, such as principal amortization, the need for a corporate guaranty, or other terms are not as favorable when we refinance debt or issue new debt, our income could be reduced. To the extent we are unable to refinance debt on reasonable terms, or at appropriate times or at all, we may be required to sell properties on terms that are not advantageous to us, or could result in the foreclosure of such properties. If any of these events occur, our cash flow would be reduced. This, in turn, would reduce cash available for distribution to our stockholders and may hinder our ability to raise more capital by borrowing more money.
58
Item 2. | Unregistered Sales of Equity Securities and Use of Proceeds. |
Issuer Purchases of Equity Securities
Our share repurchase plan limits repurchases during any calendar quarter to shares with an aggregate value (based on the repurchase price per share on the day the repurchase is effected) of 5% of the combined NAV of all classes of shares as of the last day of the previous calendar quarter, which means that in any 12-month period, we limit repurchases to approximately 20% of our total NAV. If the quarterly volume limitation is reached on or before the third business day of a calendar quarter, repurchase requests during the next quarter will be satisfied on a stockholder by stockholder basis, which we refer to as a “per stockholder allocation,” instead of a first-come, first-served basis. Pursuant to the per stockholder allocation, each of our stockholders would be allowed to request repurchase at any time during such quarter of a total number of shares not to exceed 5% of the shares of common stock the stockholder held as of the end of the prior quarter. The per stockholder allocation requirement will remain in effect for each succeeding quarter for which the total repurchases for the immediately preceding quarter exceeded four percent of our NAV on the last business day of such preceding quarter. If total repurchases during a quarter for which the per stockholder allocation applies are equal to or less than four percent of our NAV on the last business day of such preceding quarter, then repurchases will again be first-come, first-served for the next succeeding quarter and each quarter thereafter.
During the three months ended September 30, 2020, we repurchased 3,882,050 shares of common stock under the share repurchase plan.
Period | Total Number of Shares Repurchased | Average Price Paid per Share | Total Number of Shares Purchased as Part of Publicly Announced Plans or Programs | Maximum Number of Shares that May Yet Be Purchased Pursuant to the Program (1) | |||||||||
July 1 - July 31, 2020 | 1,291,135 | $ | 11.64 | 1,291,135 | — | ||||||||
August 1 - August 31, 2020 | 1,391,033 | 11.64 | 1,391,033 | — | |||||||||
September 1 - September 30, 2020 | 1,199,882 | 11.65 | 1,199,882 | — | |||||||||
Total | 3,882,050 | $ | 11.64 | 3,882,050 | — | ||||||||
________
(1) Repurchases are limited as described above.
Unregistered Sales of Equity Securities
On March 3, 2015, we commenced the Follow-on Private Offering of up to $350,000 in shares of our Class D common stock with an indefinite duration. No Class D shares were issued during the three months ended September 30, 2020.
Item 3. | Defaults Upon Senior Securities. |
Not applicable.
Item 4. | Mine Safety Disclosures. |
Not applicable.
Item 5. | Other Information. |
None.
59
Item 6. | Exhibits. |
Exhibit No. | Description | |
31.1* | Certification of Chief Executive Officer Pursuant to Section 302 of the Sarbanes-Oxley Act of 2002. | |
31.2* | Certification of Chief Financial Officer Pursuant to Section 302 of the Sarbanes-Oxley Act of 2002. | |
32.1* | Certification of Chief Executive Officer Pursuant to Section 906 of the Sarbanes-Oxley Act of 2002. | |
32.2* | Certification of Chief Financial Officer Pursuant to Section 906 of the Sarbanes-Oxley Act of 2002. | |
101.INS* | XBRL Instance Document | |
101.SCH* | XBRL Schema Document | |
101.CAL* | XBRL Calculation Linkbase Document | |
101.DEF* | Definition Linkbase Document | |
101.LAB* | XBRL Labels Linkbase Document | |
101.PRE* | XBRL Presentation Linkbase Document | |
__________
* Filed herewith.
60
SIGNATURES
Pursuant to the requirements of Section 13 or 15(d) of the Securities Exchange Act of 1934, the Registrant, Jones Lang LaSalle Income Property Trust, Inc., has duly caused this report to be signed on its behalf by the undersigned, thereunto duly authorized.
JONES LANG LASALLE INCOME PROPERTY TRUST, INC. | |||
Date: | November 6, 2020 | By: | /s/ C. Allan Swaringen |
C. Allan Swaringen | |||
President, Chief Executive Officer | |||
JONES LANG LASALLE INCOME PROPERTY TRUST, INC. | |||
Date: | November 6, 2020 | By: | /s/ Gregory A. Falk |
Gregory A. Falk | |||
Chief Financial Officer and Treasurer | |||
61