Attached files
| file | filename |
|---|---|
| EX-99.1 - PRESS RELEASE OF GOLDMAN SACHS BDC, INC., DATED NOVEMBER 5, 2020. - Goldman Sachs BDC, Inc. | d56280dex991.htm |
| 8-K - GOLDMAN SACHS BDC, INC. - Goldman Sachs BDC, Inc. | d56280d8k.htm |
Exhibit 99.2
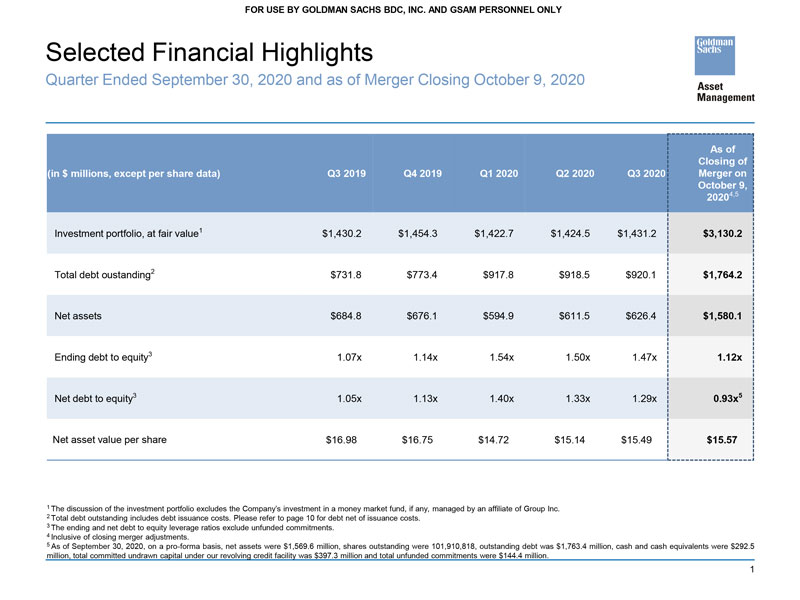
FOR USE BY GOLDMAN SACHS BDC, INC. AND GSAM PERSONNEL ONLY Selected Financial Highlights Quarter Ended September 30, 2020 and as of Merger Closing October 9, 2020 As of Closing of (in $ millions, except per share data) Q3 2019 Q4 2019 Q1 2020 Q2 2020 Q3 2020 Merger on October 9, 20204,5 Investment portfolio, at fair value1 $1,430.2 $1,454.3 $1,422.7 $1,424.5 $1,431.2 $3,130.2 Total debt oustanding2 $731.8 $773.4 $917.8 $918.5 $920.1 $1,764.2 Net assets $684.8 $676.1 $594.9 $611.5 $626.4 $1,580.1 Ending debt to equity3 1.07x 1.14x 1.54x 1.50x 1.47x 1.12x Net debt to equity3 1.05x 1.13x 1.40x 1.33x 1.29x 0.93x5 Net asset value per share $16.98 $16.75 $14.72 $15.14 $15.49 $15.57 1 The discussion of the investment portfolio excludes the Company’s investment in a money market fund, if any, managed by an affiliate of Group Inc. 2 Total debt outstanding includes debt issuance costs. Please refer to page 10 for debt net of issuance costs. 3 The ending and net debt to equity leverage ratios exclude unfunded commitments. 4 Inclusive of closing merger adjustments. 5 As of September 30, 2020, on a pro-forma basis, net assets were $1,569.6 million, shares outstanding were 101,910,818, outstanding debt was $1,763.4 million, cash and cash equivalents were $292.5 million, total committed undrawn capital under our revolving credit facility was $397.3 million and total unfunded commitments were $144.4 million. 1
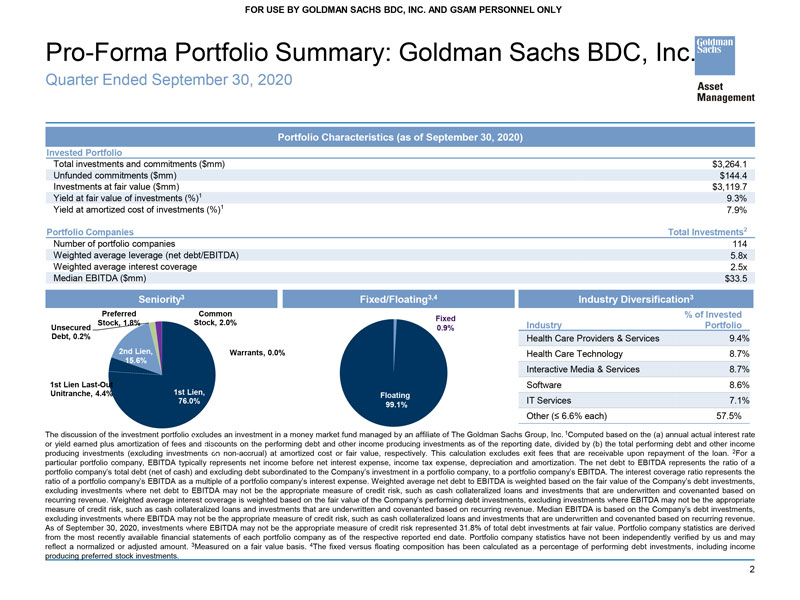
FOR USE BY GOLDMAN SACHS BDC, INC. AND GSAM PERSONNEL ONLY Pro-Forma Portfolio Summary: Goldman Sachs BDC, Inc. Quarter Ended September 30, 2020 Portfolio Characteristics (as of September 30, 2020) Invested Portfolio Total investments and commitments ($mm) $3,264.1 Unfunded commitments ($mm) $144.4 Investments at fair value ($mm) $3,119.7 Yield at fair value of investments (%)1 9.3% Yield at amortized cost of investments (%)1 7.9% Portfolio Companies Total Investments2 Number of portfolio companies 114 Weighted average leverage (net debt/EBITDA) 5.8x Weighted average interest coverage 2.5x Median EBITDA ($mm) $33.5 Seniority3 Fixed/Floating3,4 Industry Diversification3 Preferred Common % of Invested Fixed Stock, 1.8% Stock, 2.0% Industry Portfolio Unsecured 0.9% Debt, 0.2% Health Care Providers & Services 9.4% 2nd Lien, Warrants, 0.0% Health Care Technology 8.7% 15.6% Interactive Media & Services 8.7% 1st Lien Last-Out Software 8.6% Unitranche, 4.4% 1st Lien, Floating 76.0% IT Services 7.1% 99.1% Other (6.6% each) 57.5% The discussion of the investment portfolio excludes an investment in a money market fund managed by an affiliate of The Goldman Sachs Group, Inc. 1Computed based on the (a) annual actual interest rate or yield earned plus amortization of fees and discounts on the performing debt and other income producing investments as of the reporting date, divided by (b) the total performing debt and other income producing investments (excluding investments on non-accrual) at amortized cost or fair value, respectively. This calculation excludes exit fees that are receivable upon repayment of the loan. 2For a particular portfolio company, EBITDA typically represents net income before net interest expense, income tax expense, depreciation and amortization. The net debt to EBITDA represents the ratio of a portfolio company’s total debt (net of cash) and excluding debt subordinated to the Company’s investment in a portfolio company, to a portfolio company’s EBITDA. The interest coverage ratio represents the ratio of a portfolio company’s EBITDA as a multiple of a portfolio company’s interest expense. Weighted average net debt to EBITDA is weighted based on the fair value of the Company’s debt investments, excluding investments where net debt to EBITDA may not be the appropriate measure of credit risk, such as cash collateralized loans and investments that are underwritten and covenanted based on recurring revenue. Weighted average interest coverage is weighted based on the fair value of the Company’s performing debt investments, excluding investments where EBITDA may not be the appropriate measure of credit risk, such as cash collateralized loans and investments that are underwritten and covenanted based on recurring revenue. Median EBITDA is based on the Company’s debt investments, excluding investments where EBITDA may not be the appropriate measure of credit risk, such as cash collateralized loans and investments that are underwritten and covenanted based on recurring revenue. As of September 30, 2020, investments where EBITDA may not be the appropriate measure of credit risk represented 31.8% of total debt investments at fair value. Portfolio company statistics are derived from the most recently available financial statements of each portfolio company as of the respective reported end date. Portfolio company statistics have not been independently verified by us and may reflect a normalized or adjusted amount. 3Measured on a fair value basis. 4The fixed versus floating composition has been calculated as a percentage of performing debt investments, including income producing preferred stock investments. 2