Attached files
| file | filename |
|---|---|
| 8-K - 8-K - 1ST CONSTITUTION BANCORP | fccy-20201106.htm |

Bancorp
This presentation contains forward-looking statements within the meaning of Section 27A of the Securities Act of 1933, as amended, and Section 21E of the Securities Exchange Act of 1934, as amended (the “Exchange Act”). The Private Securities Litigation Reform Act of 1995 provides a “safe harbor” for forward-lookingstatements. When used in this and in future filings by 1st Constitution Bancorp (“1st Constitution” or the “Company”) with the Securities and Exchange Commission (“SEC”), and in the Company’s written and oral statements made with the approval of an authorized executive officer of the Company, the words or phrases “will,” “will likely result,” “could,” “anticipates,” “believes,” “continues,” “expects,” “plans,” “will continue,” “is anticipated,” “estimated,” “project” or “outlook” or similar expressions (including confirmations by an authorized executive officer of theCompany of any such expressions made by a third party with respect to the Company) are intended to identify forward-looking statements. The Company cautions readers not to place undue reliance on any such forward-looking statements, each of which speaks only as of the date made. Such statements are subject to certain risks and uncertainties that could cause actual results to differ materially from historical earnings and those presently anticipated or projected. These forward-looking statements are based upon our opinions and estimates as of the date they are made and are not guarantees of future performance. Although we believe that the expectations reflected in these forward-looking statements are reasonable, such forward-looking statements are subject to known and unknown risks and uncertainties that may be beyond our control, which could cause actual results, performance and achievements to differ materially from results, performance and achievements projected, expected, expressed or implied by the forward-looking statements. Factors or events that could cause actual results to differ materially from historical results or those anticipated, expressed or implied include, without limitation, those listed under “Business”, “Risk Factors” and “Management’s Discussion and Analysis of Financial Condition and Results of Operations” in the Company’s Annual Report on Form 10-K for the year ended, December 31, 2019 filed with the SEC on March 16, 2020, Quarterly Report on Form 10-Q for the period ended March 31, 2020 filed with the SEC on May 11, 2020, Quarterly Report on Form 10-Q for the period ended June 30, 2020 filed with the SEC on August 7, 2020, Quarterly Report on Form 10-Q for the period ended September 30, 2020 filed with the SEC on November 6, 2020 and in other filings made by the Company with the SEC, such as changes in the overall economy and interest rate changes; inflation, market and monetary fluctuations; the ability of our customers to repay their obligations; the accuracy of our financial statement estimates and assumptions, including the adequacy of the estimate made in connection with determining the adequacy of the allowance for loan losses; increased competition and its effect on the availability and pricing of deposits and loans; significant changes in accounting, tax or regulatory practices and requirements; changes in deposit flows, loan demand or real estate values; the enactment of legislation or regulatory changes; changes in monetary and fiscal policies of the U.S. government; changes to the method that LIBOR rates are determined and to the phasing out of LIBOR after 2021; changes in loan delinquency rates or in our levels of non-performing assets; our ability to declare andpay dividends; changes in the economic climate in the market areas in which we operate; the frequency and magnitude of foreclosure of our loans; changes inconsumer spending and saving habits; the effects of the health and soundness of other financial institutions, including the need of the FDIC to increase the Deposit Insurance Fund assessments; technological changes; the effects of climate change and harsh weather conditions, including hurricanes and man-made disasters; the economic impact of any future terrorist threats and attacks, acts of war or threats thereof and the response of the United States to any such threats and attacks; our ability to integrate acquisitions and achieve cost savings; other risks describedfrom time to time in our filings with the SEC; and our ability to manage the risks involved in the foregoing. Further, the foregoing factors may be exacerbated by the ultimate impact of the COVID-19 pandemic, which is unknown at this time. In addition, statements about the COVID-19 pandemic and the potential effects and impacts of the COVID-19 pandemic on the Company’s business, financial condition, liquidity and results of operations may constitute forward-looking statements and are subject to the risk that actual results may differ, possibly materially, from what is reflected in such forward-looking statements due to factors and future developments that are uncertain, unpredictable and, in many cases, beyond our control, including the scope, duration and extent of the pandemic, actions taken by governmental authorities in response to the pandemic and the direct and indirect impact of the pandemic on our employees, customers, businessand third-parties with which we conduct business. Although management has taken certain steps to mitigate any negative effect of the aforementioned factors and the COVID-19 pandemic, significant unfavorable changes could severely impact the assumptions used and have an adverse effect on profitability. Any forward-looking statements made by us or on our behalf speak only as of the date they are made, and we do not undertake any obligation to update any forward-looking statement to reflect the impact of subsequent events or circumstances, except as required by law. Bancorp

Bancorp 3 3
• • • • • • • • • Bancorp
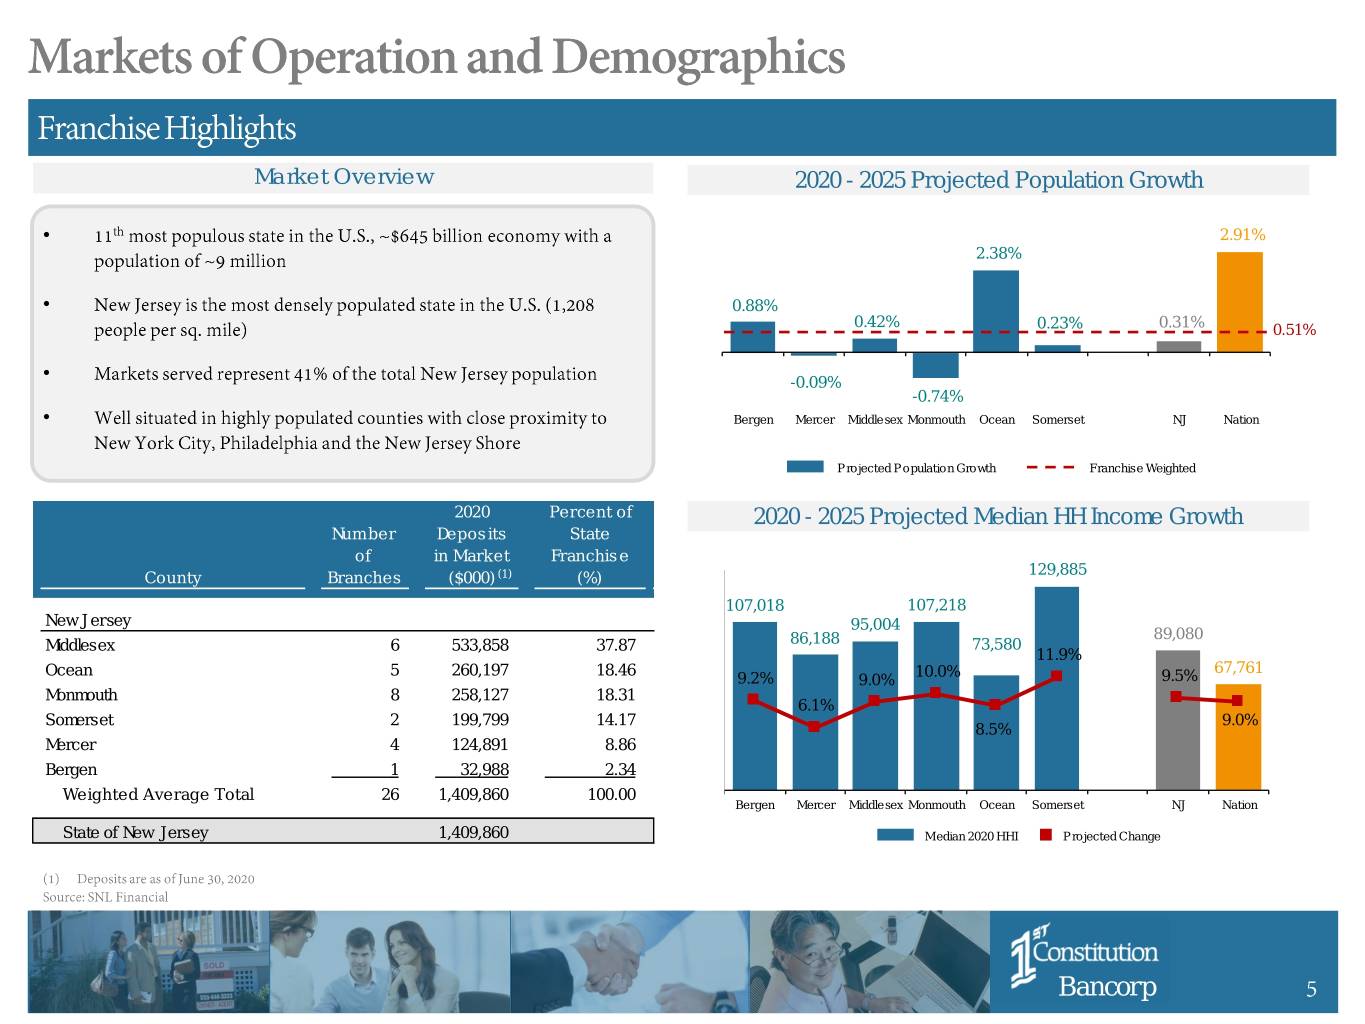
Market Overview 2020 - 2025 Projected Population Growth • 2.91% 2.38% • 0.88% 0.42% 0.23% 0.31% 0.51% • -0.09% -0.74% • Bergen Mercer Middlesex Monmouth Ocean Somerset NJ Nation P ro jected P o pulatio n Gro wth Franchise Weighted 2020 Percent of 2020 - 2025 Projected Median HH Income Growth Number Deposits State of in Market Franchise 129,885 County Branches ($000) (1) (%) 107,018 107,218 New Jersey 95,004 89,080 Middlesex 6 533,858 37.87 86,188 73,580 11.9% Ocean 5 260,197 18.46 10.0% 67,761 9.2% 9.0% 9.5% Monmouth 8 258,127 18.31 6.1% Somerset 2 199,799 14.17 9.0% 8.5% Mercer 4 124,891 8.86 Bergen 1 32,988 2.34 Weighted Average Total 26 1,409,860 100.00 Bergen Mercer Middlesex Monmouth Ocean Somerset NJ Nation State of New Jersey 1,409,860 M edian 2020 HHI Projected Change Bancorp 5
Bancorp 6
Bancorp 7
Bancorp 8 8
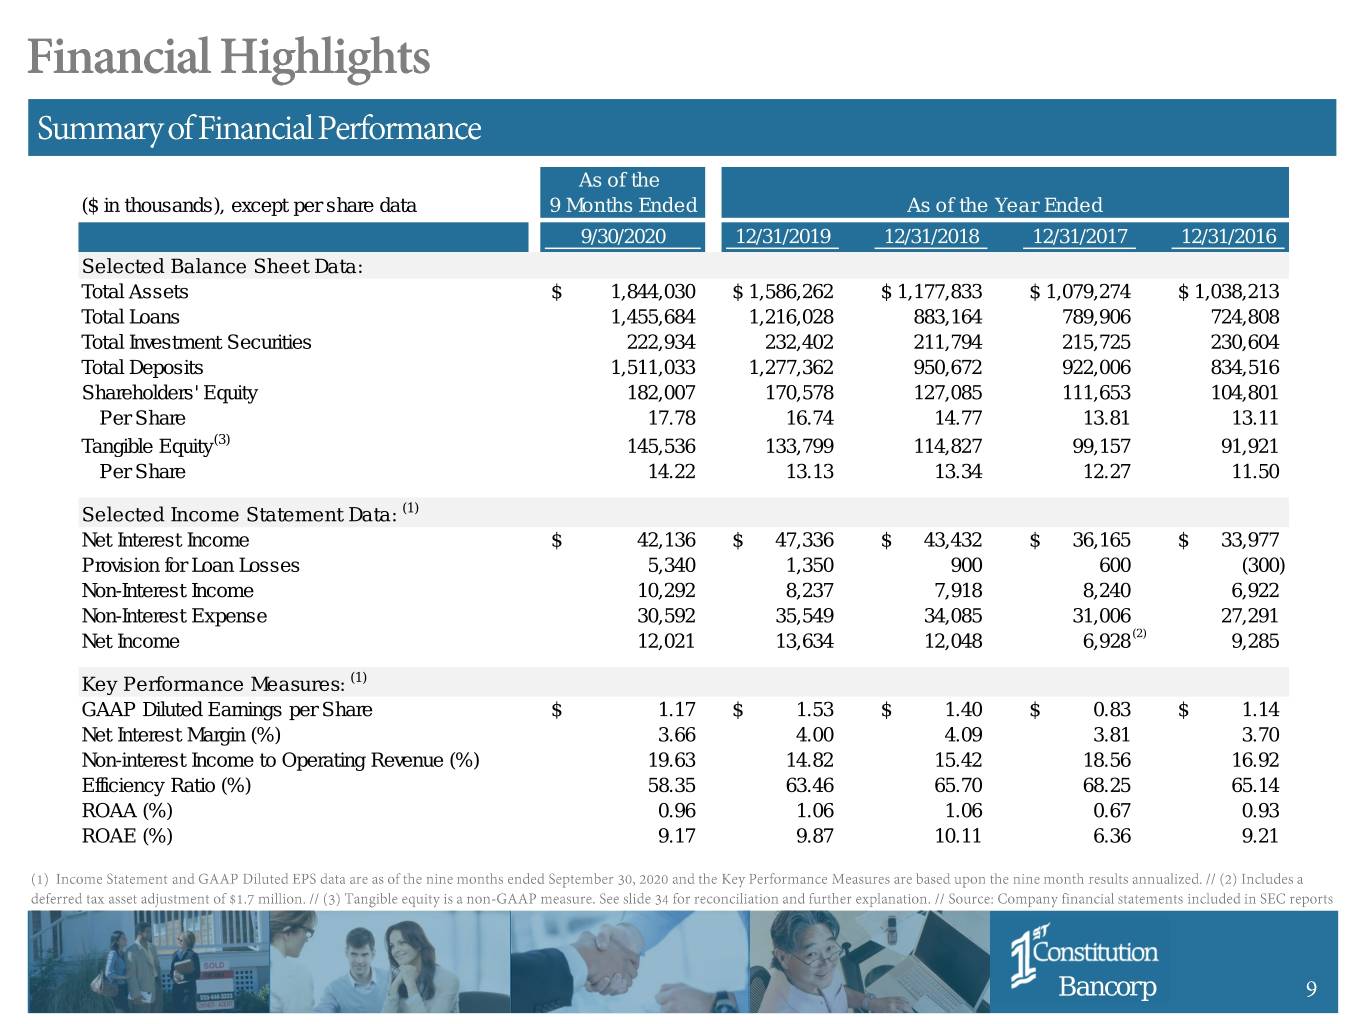
As of the ($ in thousands), except per share data 9 Months Ended As of the Year Ended 9/30/2020 12/31/2019 12/31/2018 12/31/2017 12/31/2016 Selected Balance Sheet Data: Total Assets $ 1,844,030 $ 1,586,262 $ 1,177,833 $ 1,079,274 $ 1,038,213 Total Loans 1,455,684 1,216,028 883,164 789,906 724,808 Total Investment Securities 222,934 232,402 211,794 215,725 230,604 Total Deposits 1,511,033 1,277,362 950,672 922,006 834,516 Shareholders' Equity 182,007 170,578 127,085 111,653 104,801 Per Share 17.78 16.74 14.77 13.81 13.11 Tangible Equity(3) 145,536 133,799 114,827 99,157 91,921 Per Share 14.22 13.13 13.34 12.27 11.50 Selected Income Statement Data: (1) Net Interest Income $ 42,136 $ 47,336 $ 43,432 $ 36,165 $ 33,977 Provision for Loan Losses 5,340 1,350 900 600 (300) Non-Interest Income 10,292 8,237 7,918 8,240 6,922 Non-Interest Expense 30,592 35,549 34,085 31,006 27,291 Net Income 12,021 13,634 12,048 6,928 (2) 9,285 Key Performance Measures: (1) GAAP Diluted Earnings per Share $ 1.17 $ 1.53 $ 1.40 $ 0.83 $ 1.14 Net Interest Margin (%) 3.66 4.00 4.09 3.81 3.70 Non-interest Income to Operating Revenue (%) 19.63 14.82 15.42 18.56 16.92 Efficiency Ratio (%) 58.35 63.46 65.70 68.25 65.14 ROAA (%) 0.96 1.06 1.06 0.67 0.93 ROAE (%) 9.17 9.87 10.11 6.36 9.21 Bancorp 9
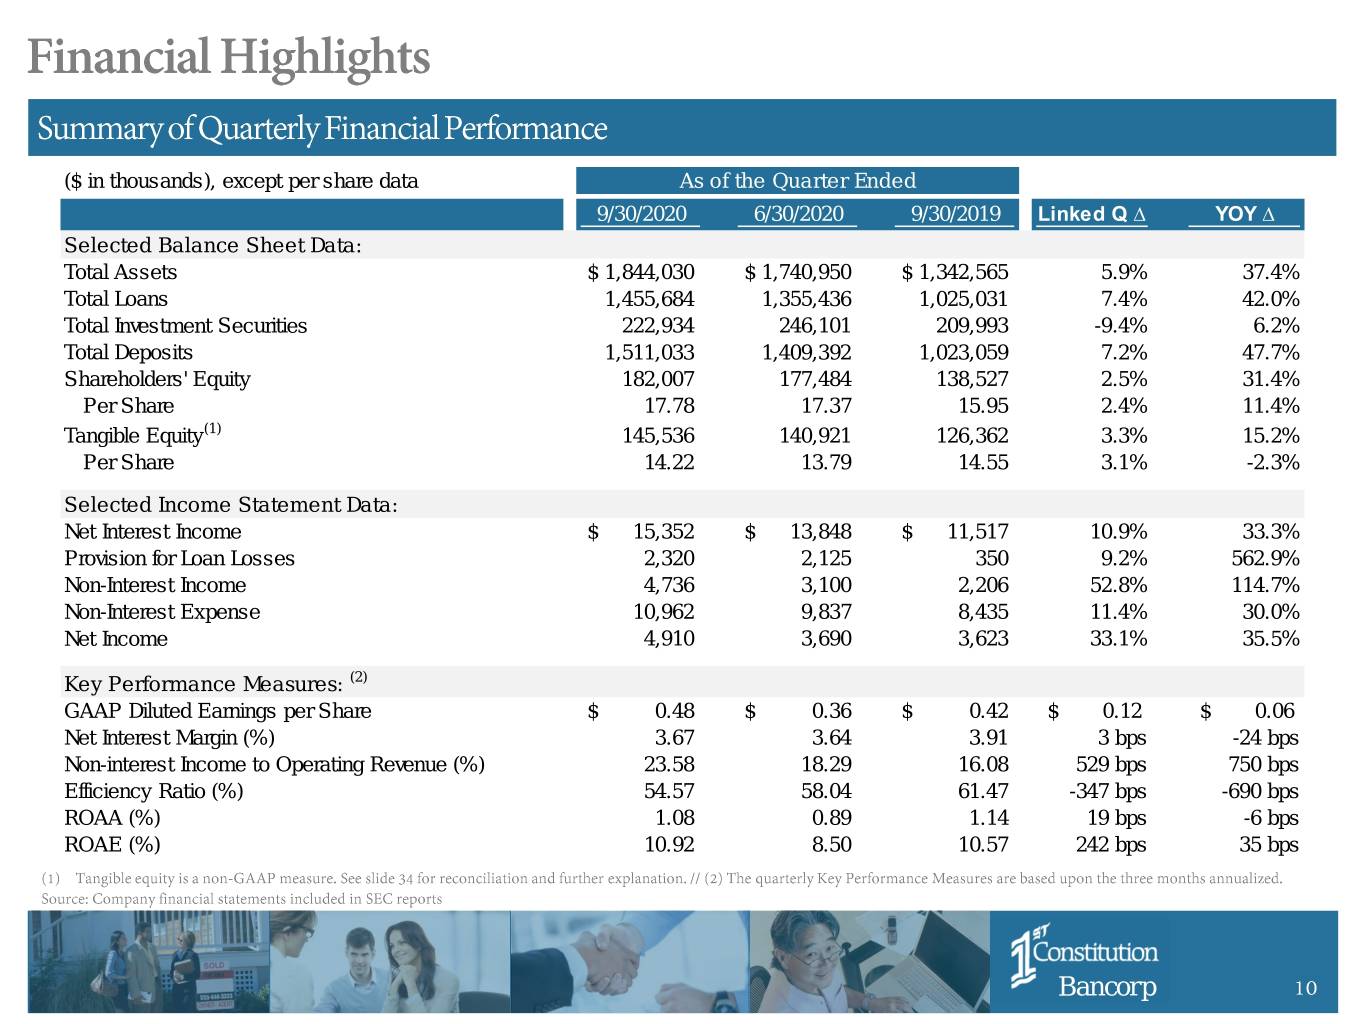
($ in thousands), except per share data As of the Quarter Ended 9/30/2020 6/30/2020 9/30/2019 Linked Q ∆ YOY ∆ Selected Balance Sheet Data: Total Assets $ 1,844,030 $ 1,740,950 $ 1,342,565 5.9% 37.4% Total Loans 1,455,684 1,355,436 1,025,031 7.4% 42.0% Total Investment Securities 222,934 246,101 209,993 -9.4% 6.2% Total Deposits 1,511,033 1,409,392 1,023,059 7.2% 47.7% Shareholders' Equity 182,007 177,484 138,527 2.5% 31.4% Per Share 17.78 17.37 15.95 2.4% 11.4% Tangible Equity(1) 145,536 140,921 126,362 3.3% 15.2% Per Share 14.22 13.79 14.55 3.1% -2.3% Selected Income Statement Data: Net Interest Income $ 15,352 $ 13,848 $ 11,517 10.9% 33.3% Provision for Loan Losses 2,320 2,125 350 9.2% 562.9% Non-Interest Income 4,736 3,100 2,206 52.8% 114.7% Non-Interest Expense 10,962 9,837 8,435 11.4% 30.0% Net Income 4,910 3,690 3,623 33.1% 35.5% Key Performance Measures: (2) GAAP Diluted Earnings per Share $ 0.48 $ 0.36 $ 0.42 $ 0.12 $ 0.06 Net Interest Margin (%) 3.67 3.64 3.91 3 bps -24 bps Non-interest Income to Operating Revenue (%) 23.58 18.29 16.08 529 bps 750 bps Efficiency Ratio (%) 54.57 58.04 61.47 -347 bps -690 bps ROAA (%) 1.08 0.89 1.14 19 bps -6 bps ROAE (%) 10.92 8.50 10.57 242 bps 35 bps Bancorp 10
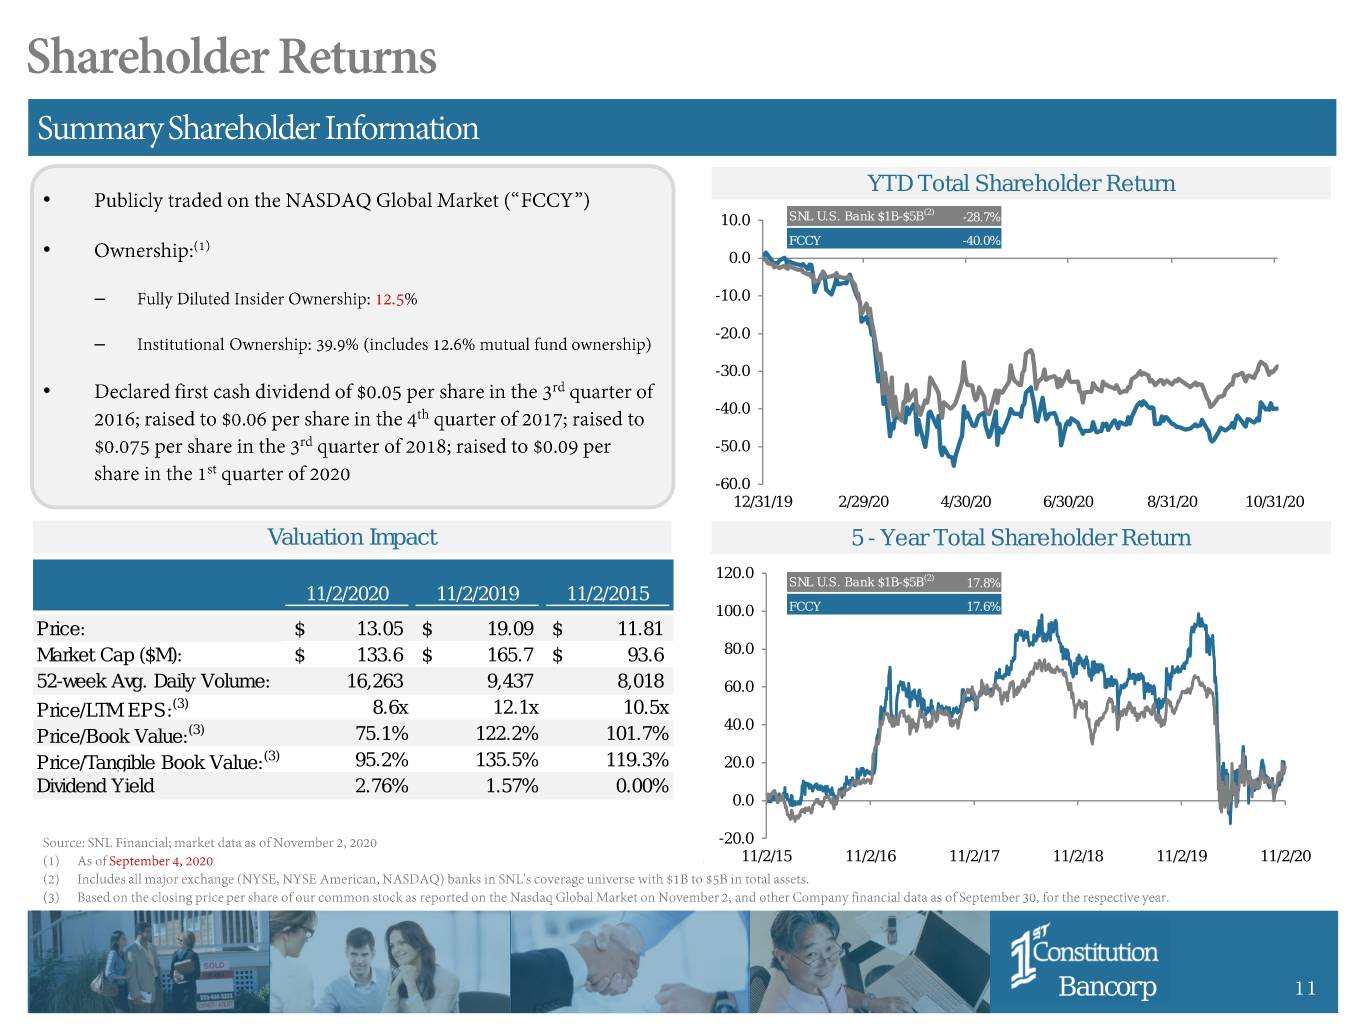
YTD Total Shareholder Return • (2) 10.0 SNL U.S. Bank $1B-$5B -28.7% FCCY -40.0% • 0.0 – -10.0 -20.0 – -30.0 • -40.0 -50.0 -60.0 12/31/19 2/29/20 4/30/20 6/30/20 8/31/20 10/31/20 Valuation Impact 5 - Year Total Shareholder Return 120.0 SNL U.S. Bank $1B-$5B(2) 17.8% 11/2/2020 11/2/2019 11/2/2015 100.0 FCCY 17.6% Price: $ 13.05 $ 19.09 $ 11.81 Market Cap ($M): $ 133.6 $ 165.7 $ 93.6 80.0 52-week Avg. Daily Volume: 16,263 9,437 8,018 60.0 Price/LTM EPS:(3) 8.6x 12.1x 10.5x 40.0 Price/Book Value:(3) 75.1% 122.2% 101.7% Price/Tangible Book Value:(3) 95.2% 135.5% 119.3% 20.0 Dividend Yield 2.76% 1.57% 0.00% 0.0 -20.0 11/2/15 11/2/16 11/2/17 11/2/18 11/2/19 11/2/20 Bancorp 11
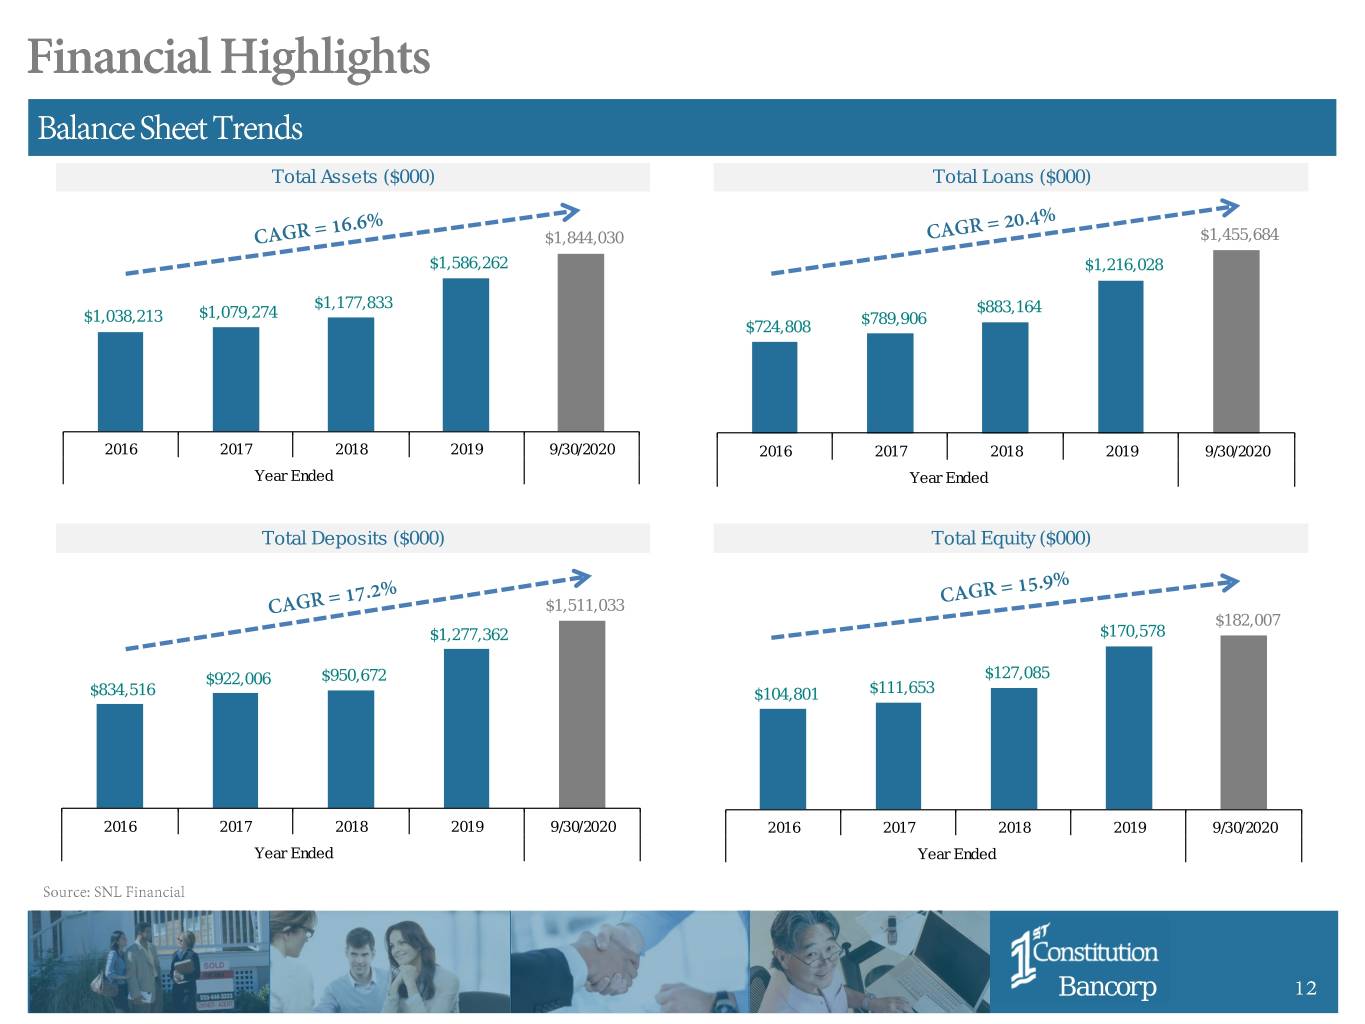
Total Assets ($000) Total Loans ($000) Loan Portfolio Growth ($000) $1,844,030 $1,455,684 $1,586,262 $1,216,028 $1,177,833 $883,164 $1,038,213 $1,079,274 $789,906 $724,808 2016 2017 2018 2019 9/30/2020 2016 2017 2018 2019 9/30/2020 Year Ended Year Ended Total Deposits ($000) Total Equity ($000) $1,511,033 $182,007 $1,277,362 $170,578 $922,006 $950,672 $127,085 $834,516 $104,801 $111,653 2016 2017 2018 2019 9/30/2020 2016 2017 2018 2019 9/30/2020 Year Ended Year Ended Bancorp 12
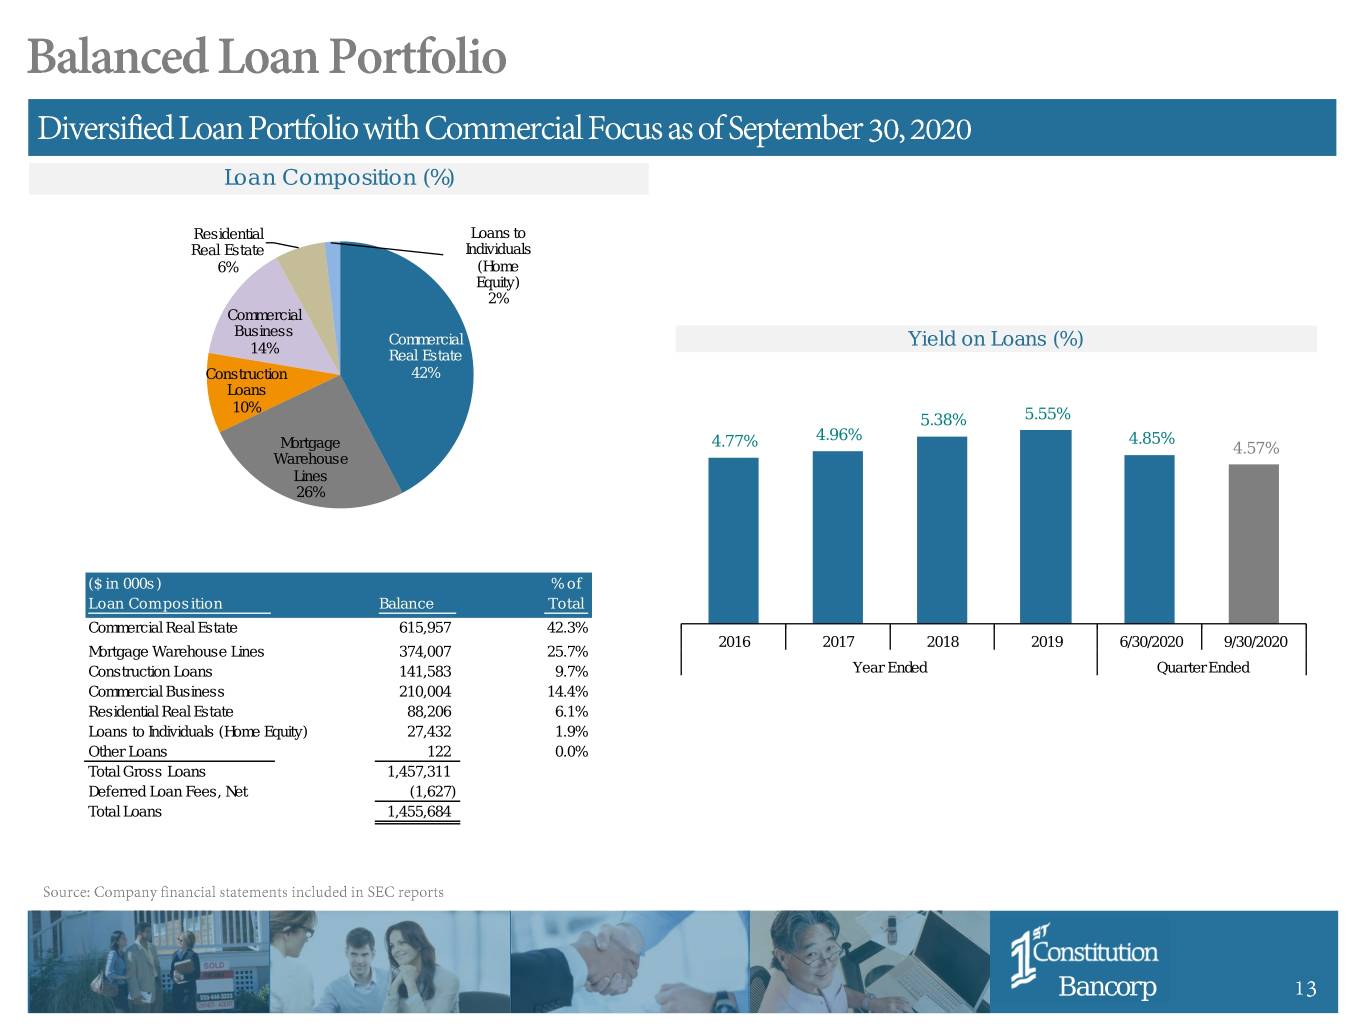
Loan Composition (%) Residential Loans to Real Estate Individuals 6% (Home Equity) 2% Commercial Business Commercial Yield on Loans (%) Noninterest-bearing Deposits / Deposits (%) 14% Real Estate Construction 42% Loans 10% 5.38% 5.55% 4.96% 4.85% Mortgage 4.77% 4.57% Warehouse Lines 26% ($ in 000s) % of Loan Composition Balance Total Commercial Real Estate 615,957 42.3% 2016 2017 2018 2019 6/30/2020 9/30/2020 Mortgage Warehouse Lines 374,007 25.7% Construction Loans 141,583 9.7% Year Ended Quarter Ended Commercial Business 210,004 14.4% Residential Real Estate 88,206 6.1% Loans to Individuals (Home Equity) 27,432 1.9% Other Loans 122 0.0% Total Gross Loans 1,457,311 Deferred Loan Fees, Net (1,627) Total Loans 1,455,684 Bancorp 13
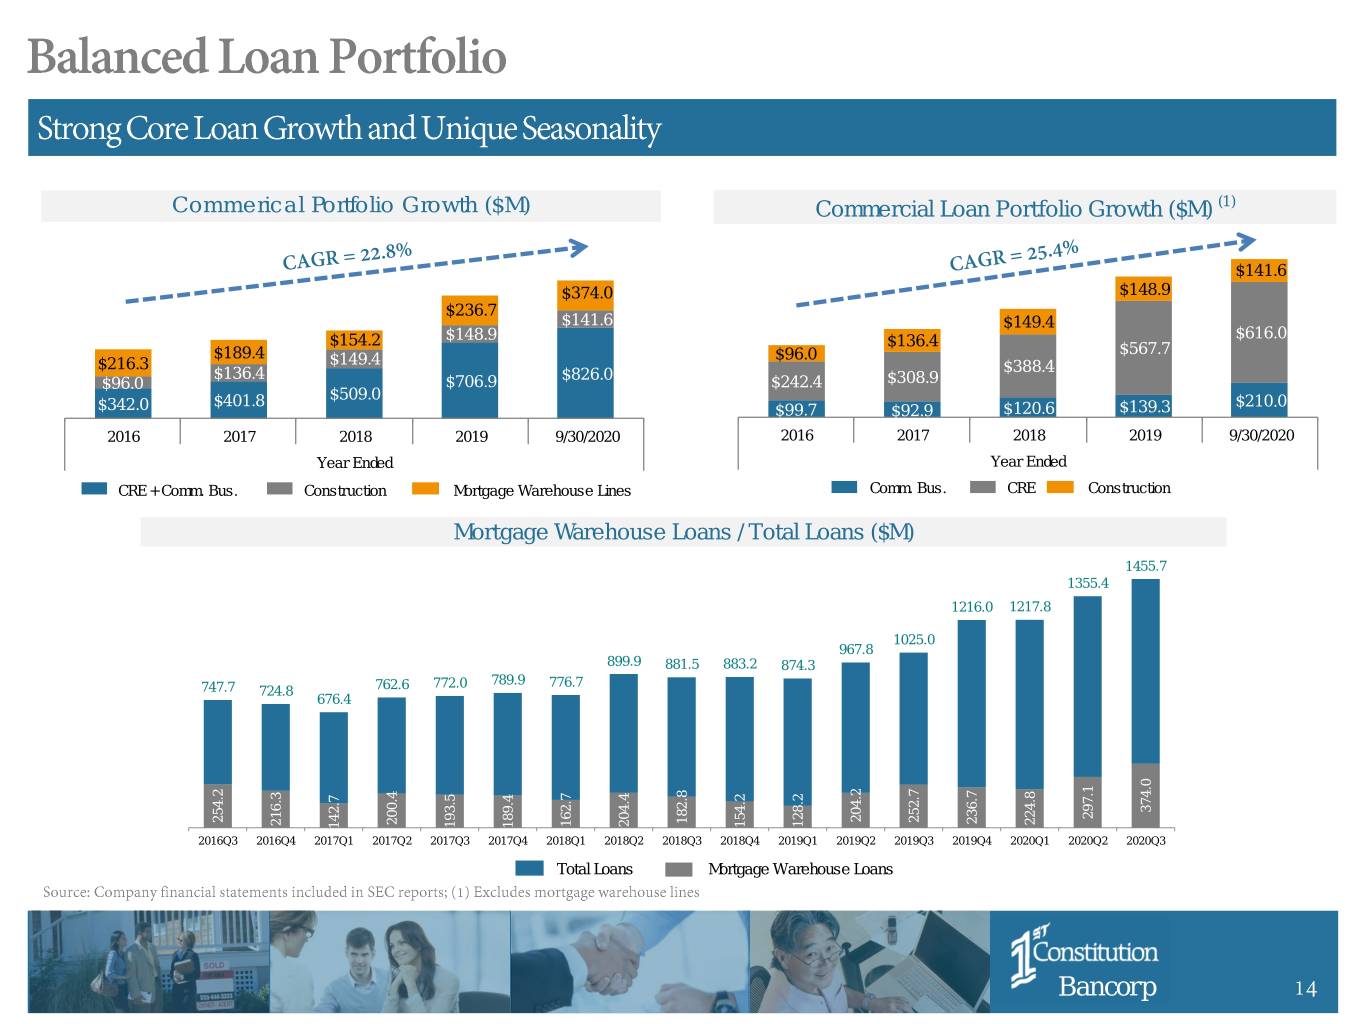
Commerical Portfolio Growth ($M) Commercial Loan Portfolio Growth ($M) (1) $141.6 $374.0 $148.9 $236.7 $141.6 $149.4 $154.2 $148.9 $136.4 $616.0 $189.4 $96.0 $567.7 $216.3 $149.4 $136.4 $826.0 $388.4 $96.0 $706.9 $242.4 $308.9 $401.8 $509.0 $210.0 $342.0 $99.7 $92.9 $120.6 $139.3 2016 2017 2018 2019 9/30/2020 2016 2017 2018 2019 9/30/2020 Year Ended Year Ended CRE + Comm. Bus. Construction Mortgage Warehouse Lines Comm. Bus. CRE Construction Mortgage Warehouse Loans / Total Loans ($M) 1455.7 1355.4 1216.0 1217.8 1025.0 967.8 899.9 881.5 883.2 874.3 772.0 789.9 776.7 747.7 724.8 762.6 676.4 374.0 297.1 204.2 254.2 252.7 182.8 236.7 200.4 224.8 216.3 162.7 204.4 128.2 154.2 193.5 189.4 142.7 2016Q3 2016Q4 2017Q1 2017Q2 2017Q32016Q22017Q42016Q32018Q12016Q4 2018Q22017Q1 2018Q32017Q2 2018Q42017Q3 2019Q12017Q4 2019Q22018Q1 2019Q32018Q2 2019Q4 2020Q1 2020Q2 2020Q3 Total Loans Mortgage Warehouse Loans Bancorp 14
• – • – – – • – • – – – • – Bancorp 15
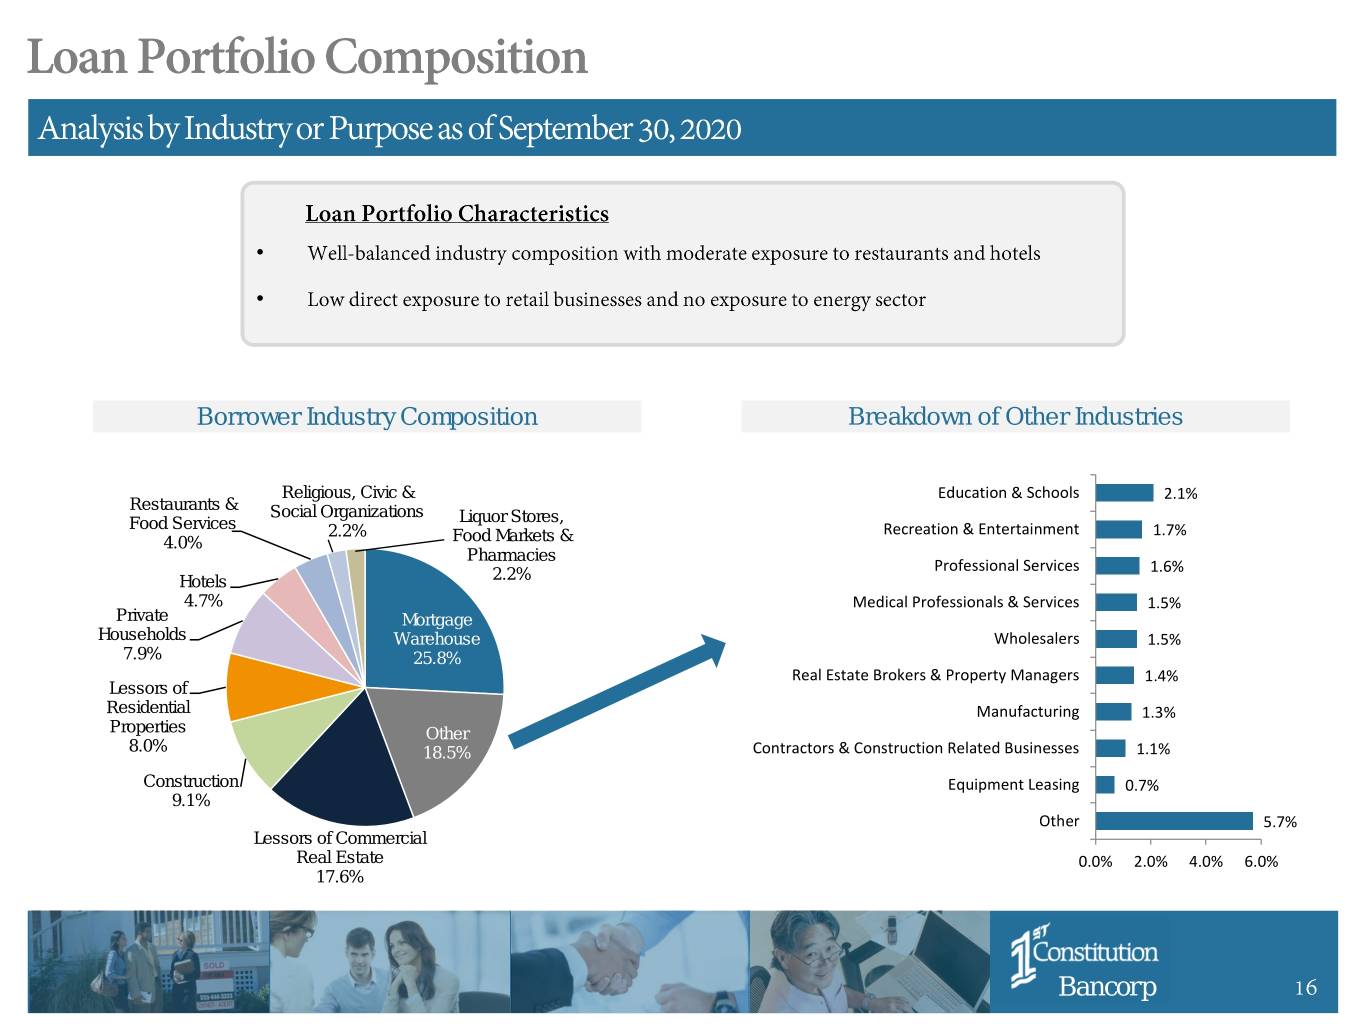
• • Borrower Industry Composition Breakdown of Other Industries Religious, Civic & Education & Schools 2.1% Restaurants & Social Organizations Liquor Stores, Food Services 2.2% Recreation & Entertainment 1.7% 4.0% Food Markets & Pharmacies Professional Services 1.6% Hotels 2.2% 4.7% Medical Professionals & Services 1.5% Private Mortgage Households Warehouse Wholesalers 1.5% 7.9% 25.8% Real Estate Brokers & Property Managers 1.4% Lessors of Residential Manufacturing 1.3% Properties Other 8.0% 18.5% Contractors & Construction Related Businesses 1.1% Construction Equipment Leasing 0.7% 9.1% Other 5.7% Lessors of Commercial Real Estate 0.0% 2.0% 4.0% 6.0% 17.6% Bancorp 16
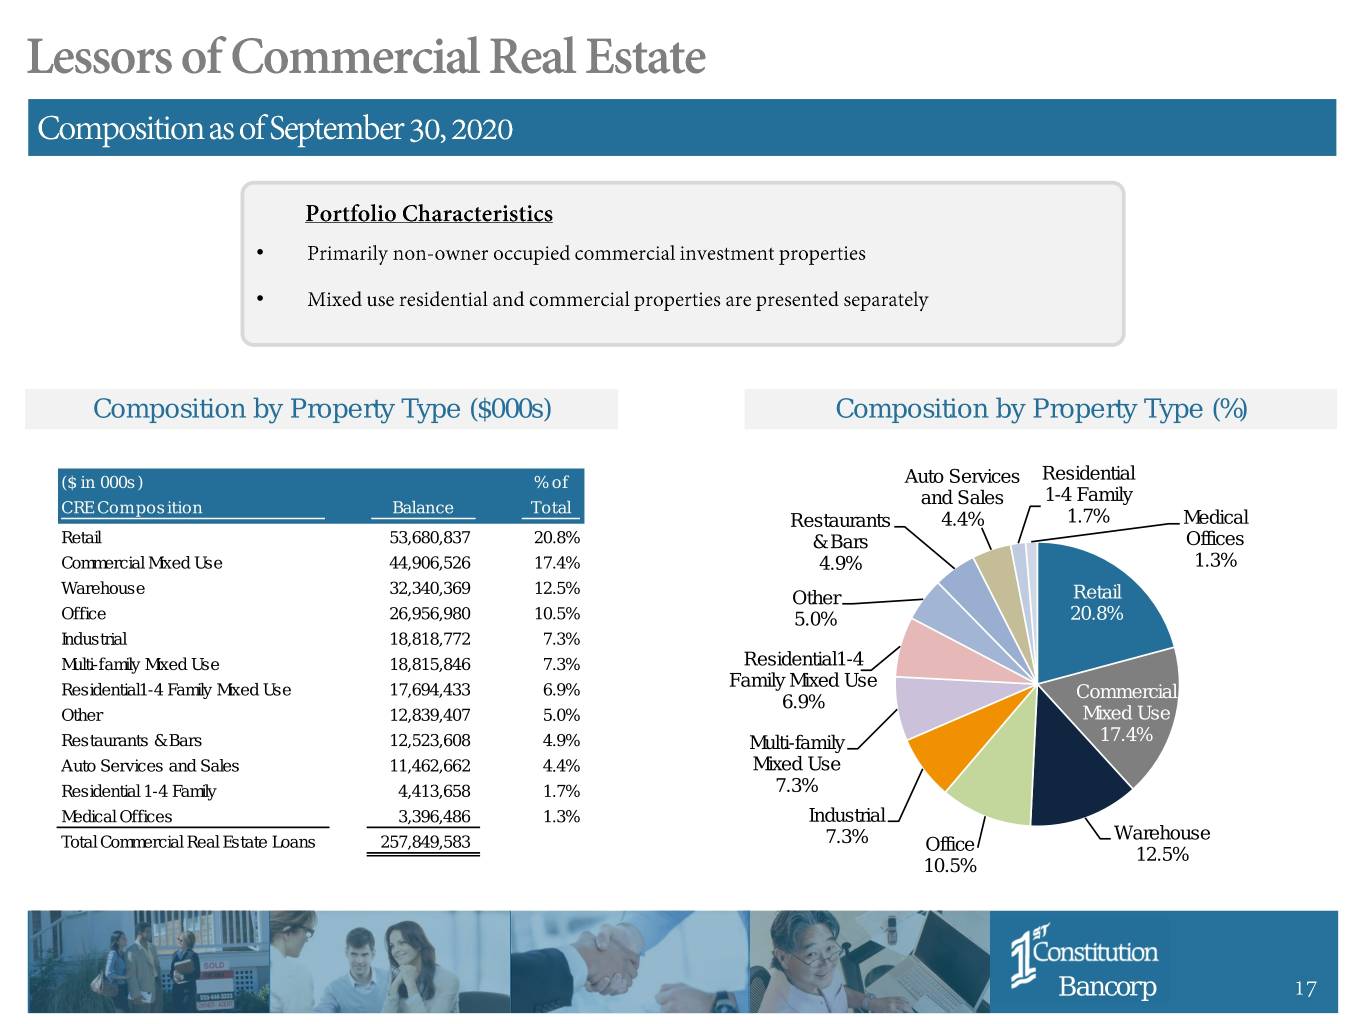
• • Composition by Property Type ($000s) Composition by Property Type (%) ($ in 000s) % of Auto Services Residential and Sales 1-4 Family CRE Composition Balance Total Restaurants 4.4% 1.7% Medical Retail 53,680,837 20.8% & Bars Offices Commercial Mixed Use 44,906,526 17.4% 4.9% 1.3% Warehouse 32,340,369 12.5% Other Retail Office 26,956,980 10.5% 5.0% 20.8% Industrial 18,818,772 7.3% Multi-family Mixed Use 18,815,846 7.3% Residential1-4 Family Mixed Use Residential1-4 Family Mixed Use 17,694,433 6.9% Commercial 6.9% Other 12,839,407 5.0% Mixed Use Restaurants & Bars 12,523,608 4.9% Multi-family 17.4% Auto Services and Sales 11,462,662 4.4% Mixed Use Residential 1-4 Family 4,413,658 1.7% 7.3% Medical Offices 3,396,486 1.3% Industrial Warehouse Total Commercial Real Estate Loans 257,849,583 7.3% Office 12.5% 10.5% Bancorp 17
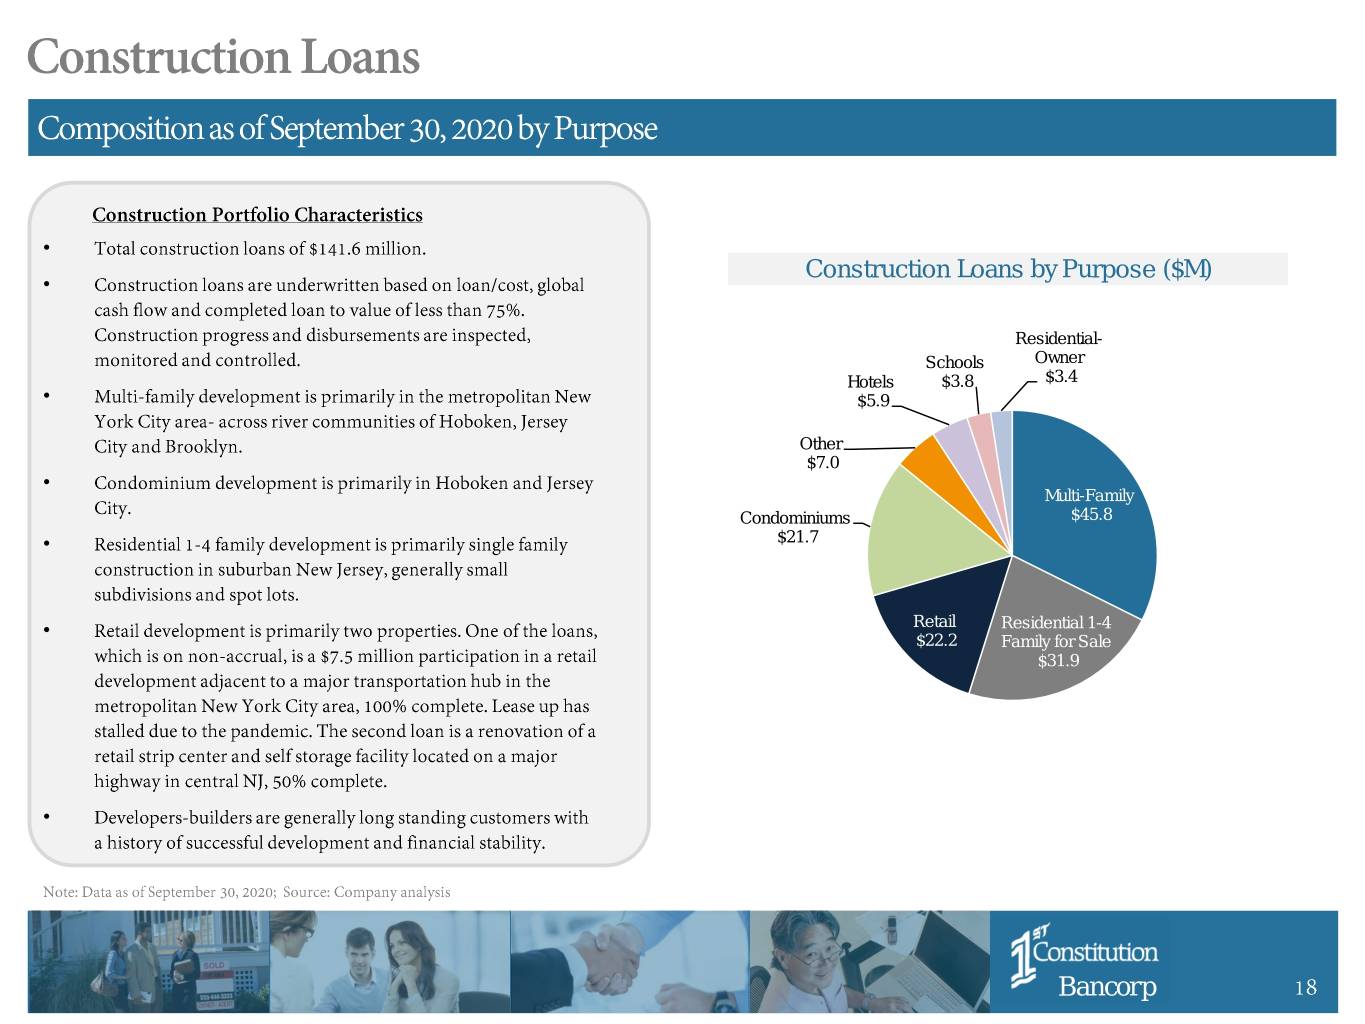
• Construction Loans by Purpose ($M) • Residential- Schools Owner Hotels $3.8 $3.4 • $5.9 (1) Other $7.0 • Multi-Family Condominiums $45.8 • $21.7 • Retail Residential 1-4 $22.2 Family for Sale $31.9 • Bancorp 18
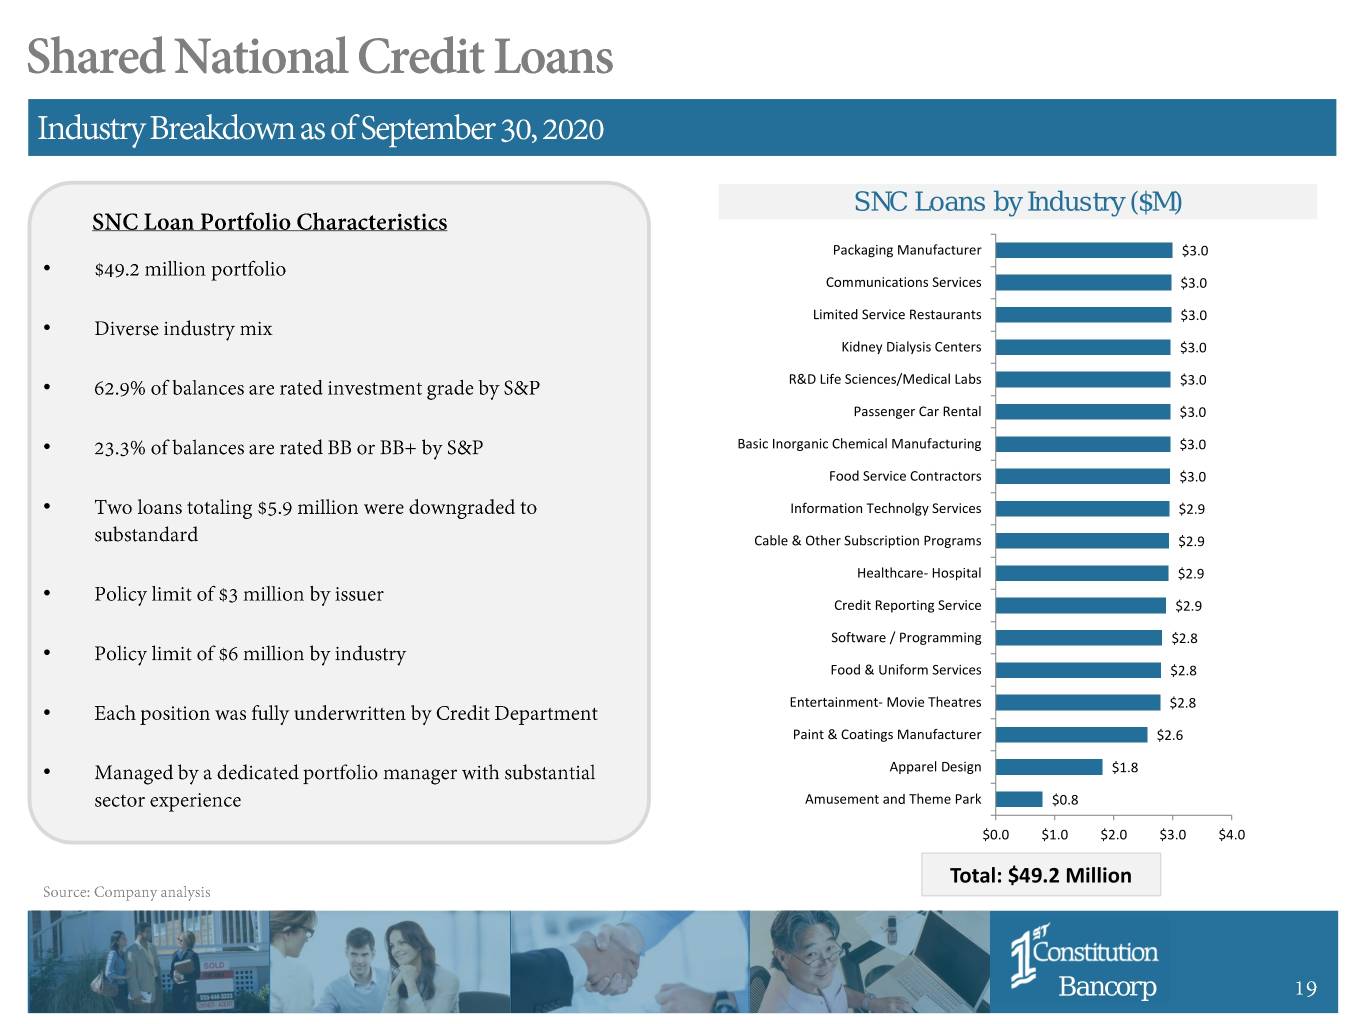
SNC Loans by Industry ($M) Packaging Manufacturer $3.0 • Communications Services $3.0 Limited Service Restaurants $3.0 • Kidney Dialysis Centers $3.0 • R&D Life Sciences/Medical Labs $3.0 Passenger Car Rental $3.0 (1) • Basic Inorganic Chemical Manufacturing $3.0 Food Service Contractors $3.0 • Information Technolgy Services $2.9 Cable & Other Subscription Programs $2.9 Healthcare- Hospital $2.9 • Credit Reporting Service $2.9 Software / Programming $2.8 • Food & Uniform Services $2.8 • Entertainment- Movie Theatres $2.8 Paint & Coatings Manufacturer $2.6 • Apparel Design $1.8 Amusement and Theme Park $0.8 $0.0 $1.0 $2.0 $3.0 $4.0 Total: $49.2 Million Bancorp 19
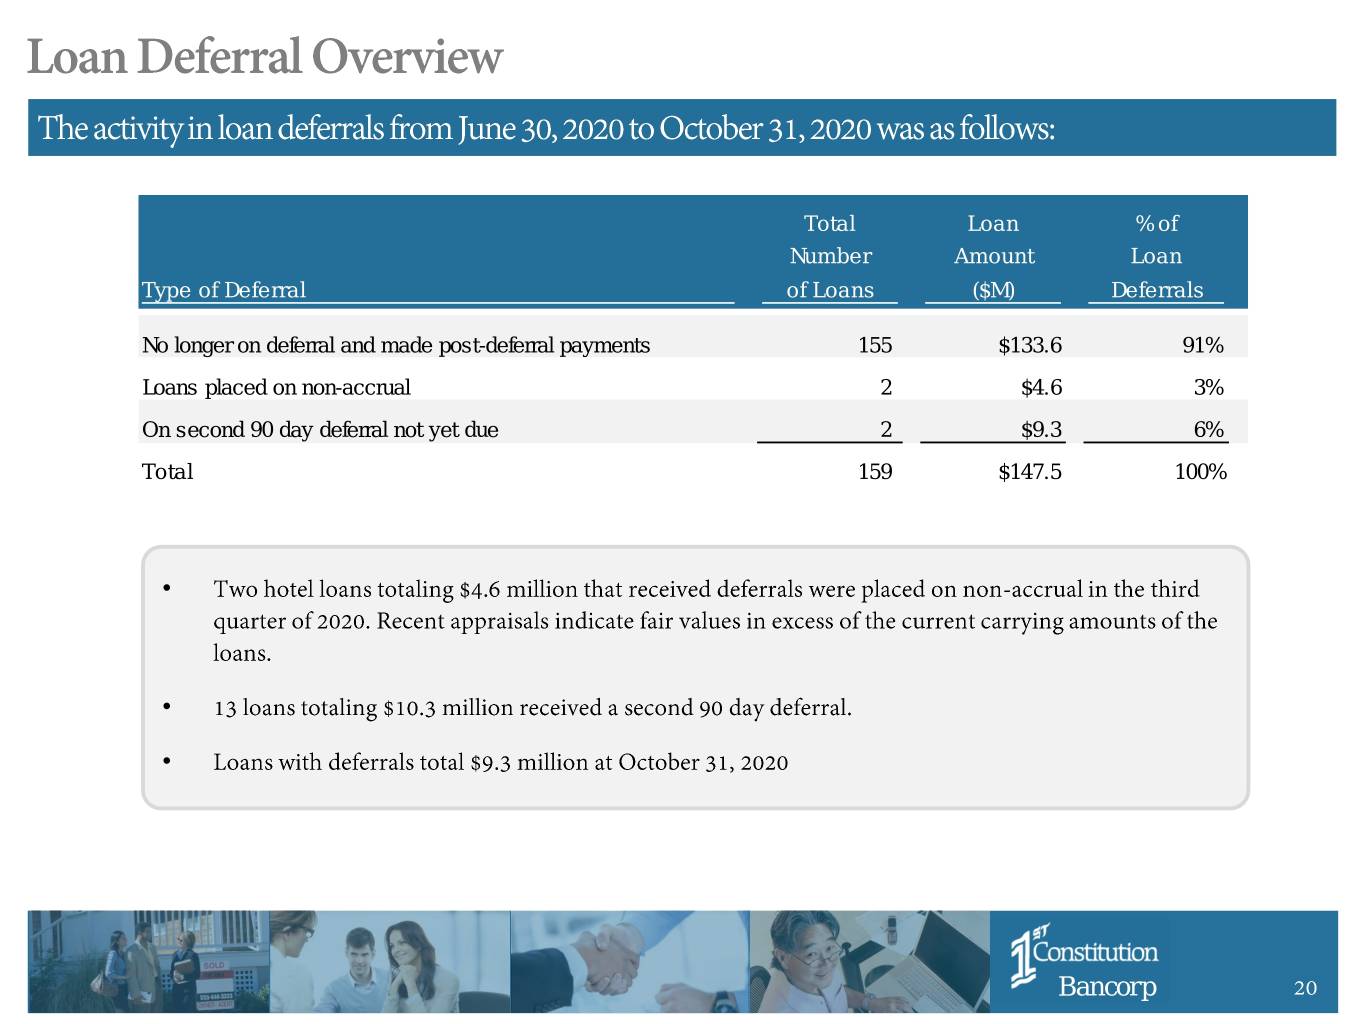
Total Loan % of Number Amount Loan Type of Deferral of Loans ($M) Deferrals No longer on deferral and made post-deferral payments 155 $133.6 91% Loans placed on non-accrual 2 $4.6 3% On second 90 day deferral not yet due 2 $9.3 6% Total 159 $147.5 100% • • • Bancorp 20
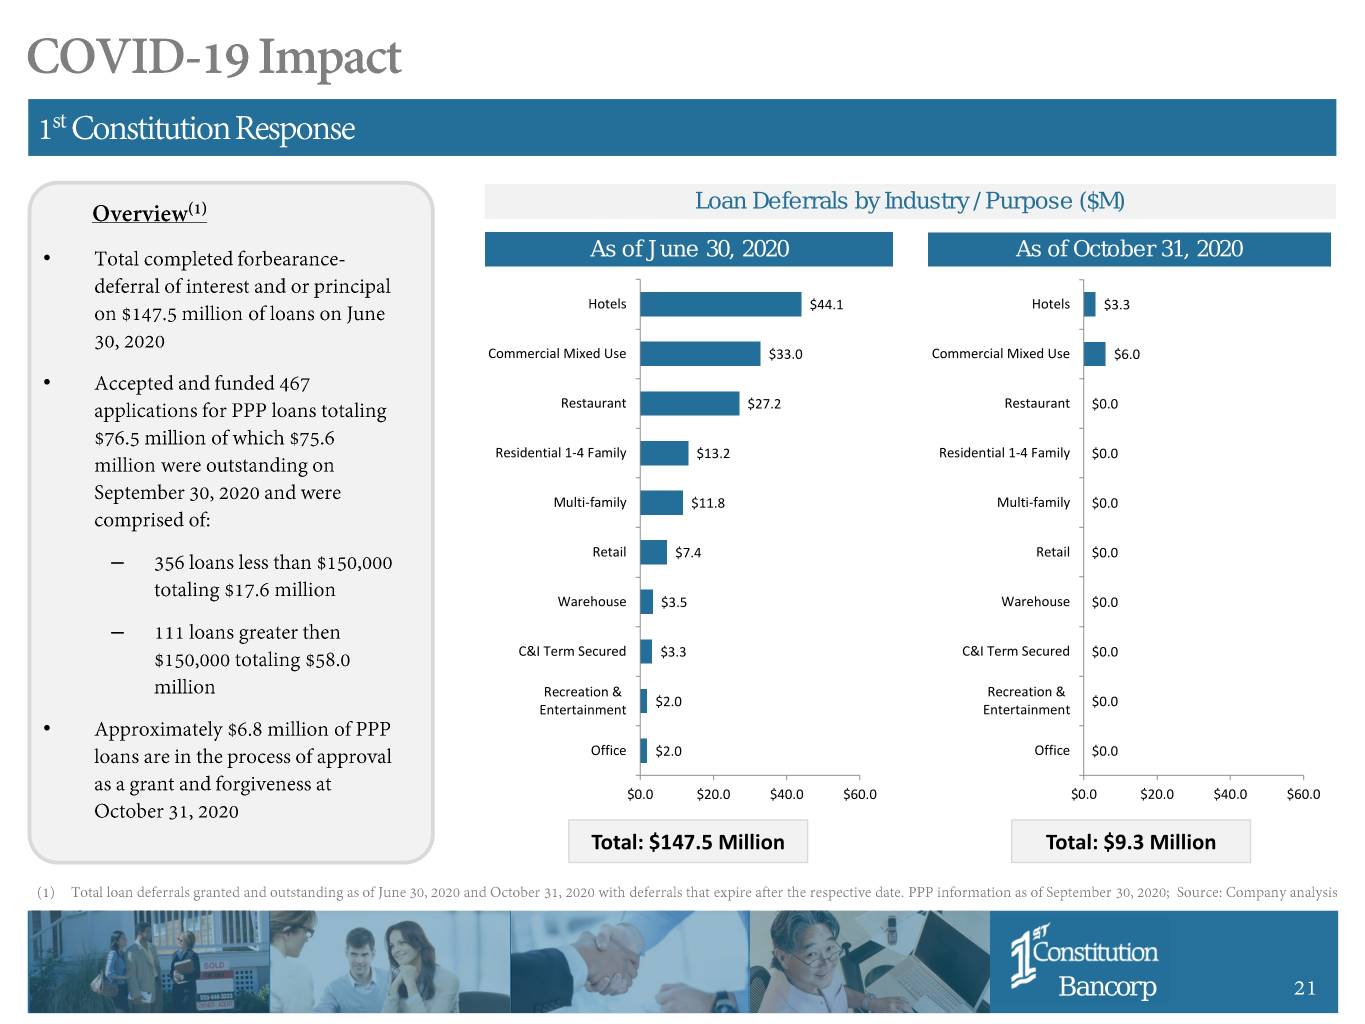
Loan Deferrals by Industry / Purpose ($M) Loan Deferrals by Industry / Purpose ($M) (1) • As of June 30, 2020 As ofAs October of August 31, 31, 2020 2020 Hotels $44.1 Hotels $3.3 Commercial Mixed Use $33.0 Commercial Mixed Use $6.0 • Restaurant $27.2 Restaurant $0.0 Residential 1-4 Family $13.2 Residential 1-4 Family $0.0 Multi-family $11.8 Multi-family $0.0 – Retail $7.4 Retail $0.0 Warehouse $3.5 Warehouse $0.0 – C&I Term Secured $3.3 C&I Term Secured $0.0 Recreation & Recreation & $2.0 $0.0 Entertainment Entertainment • Office $2.0 Office $0.0 $0.0 $20.0 $40.0 $60.0 $0.0 $20.0 $40.0 $60.0 Total: $147.5 Million Total: $9.3 Million Bancorp 21
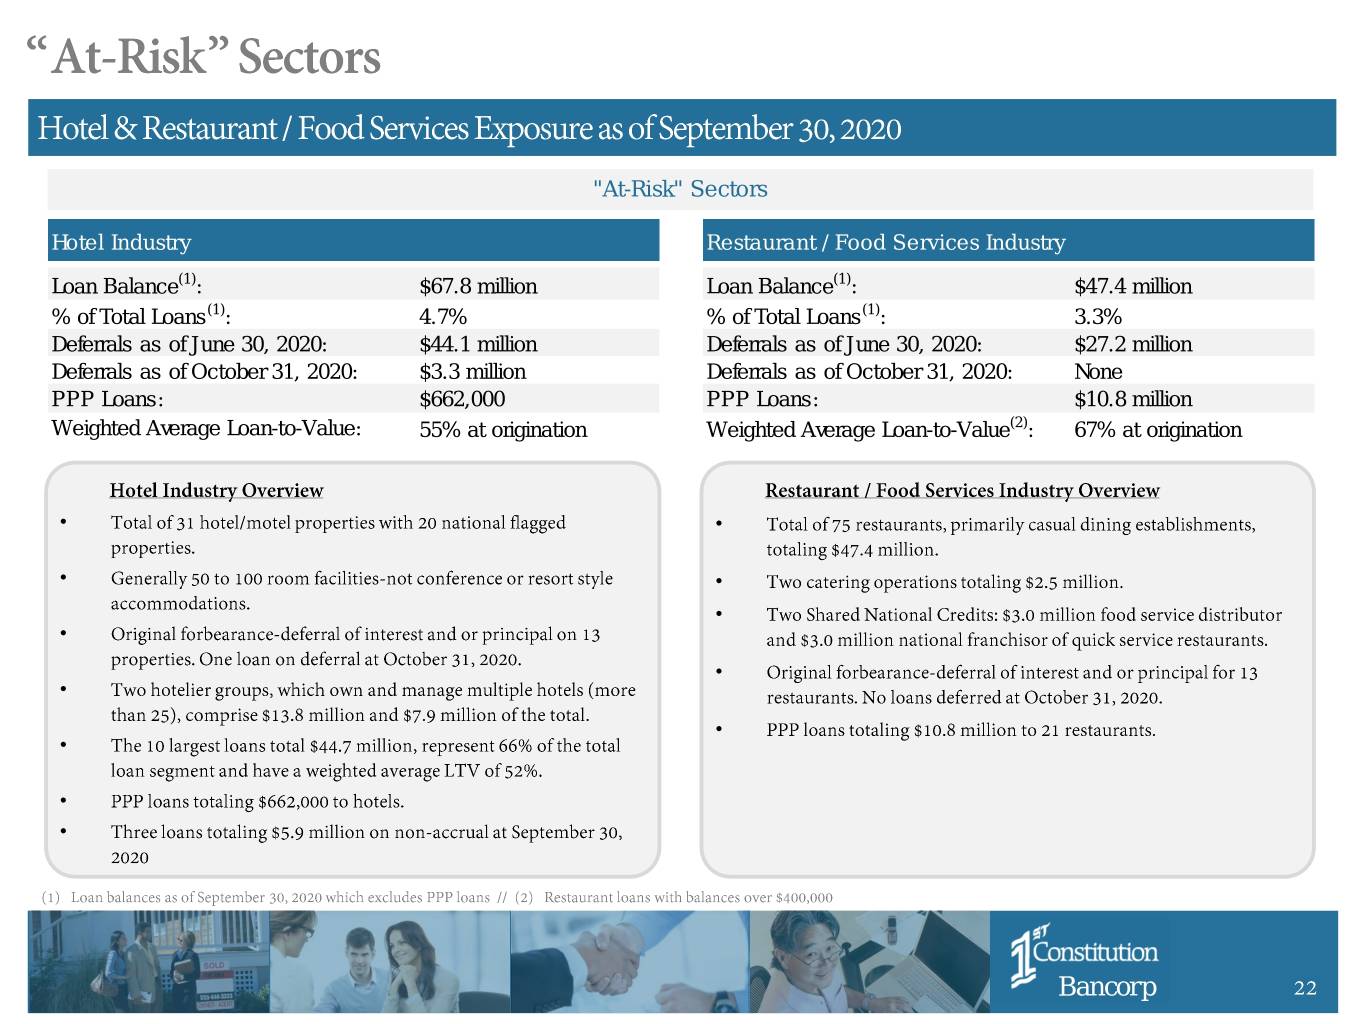
"At-Risk" Sectors Hotel Industry Restaurant / Food Services Industry Loan Balance(1): $67.8 million Loan Balance(1): $47.4 million % of Total Loans(1): 4.7% % of Total Loans(1): 3.3% Deferrals as of June 30, 2020: $44.1 million Deferrals as of June 30, 2020: $27.2 million Deferrals as of October 31, 2020: $3.3 million Deferrals as of October 31, 2020: None PPP Loans: $662,000 PPP Loans: $10.8 million Weighted Average Loan-to-Value: 55% at origination Weighted Average Loan-to-Value(2): 67% at origination • • • • • • • • • • • • Bancorp 22
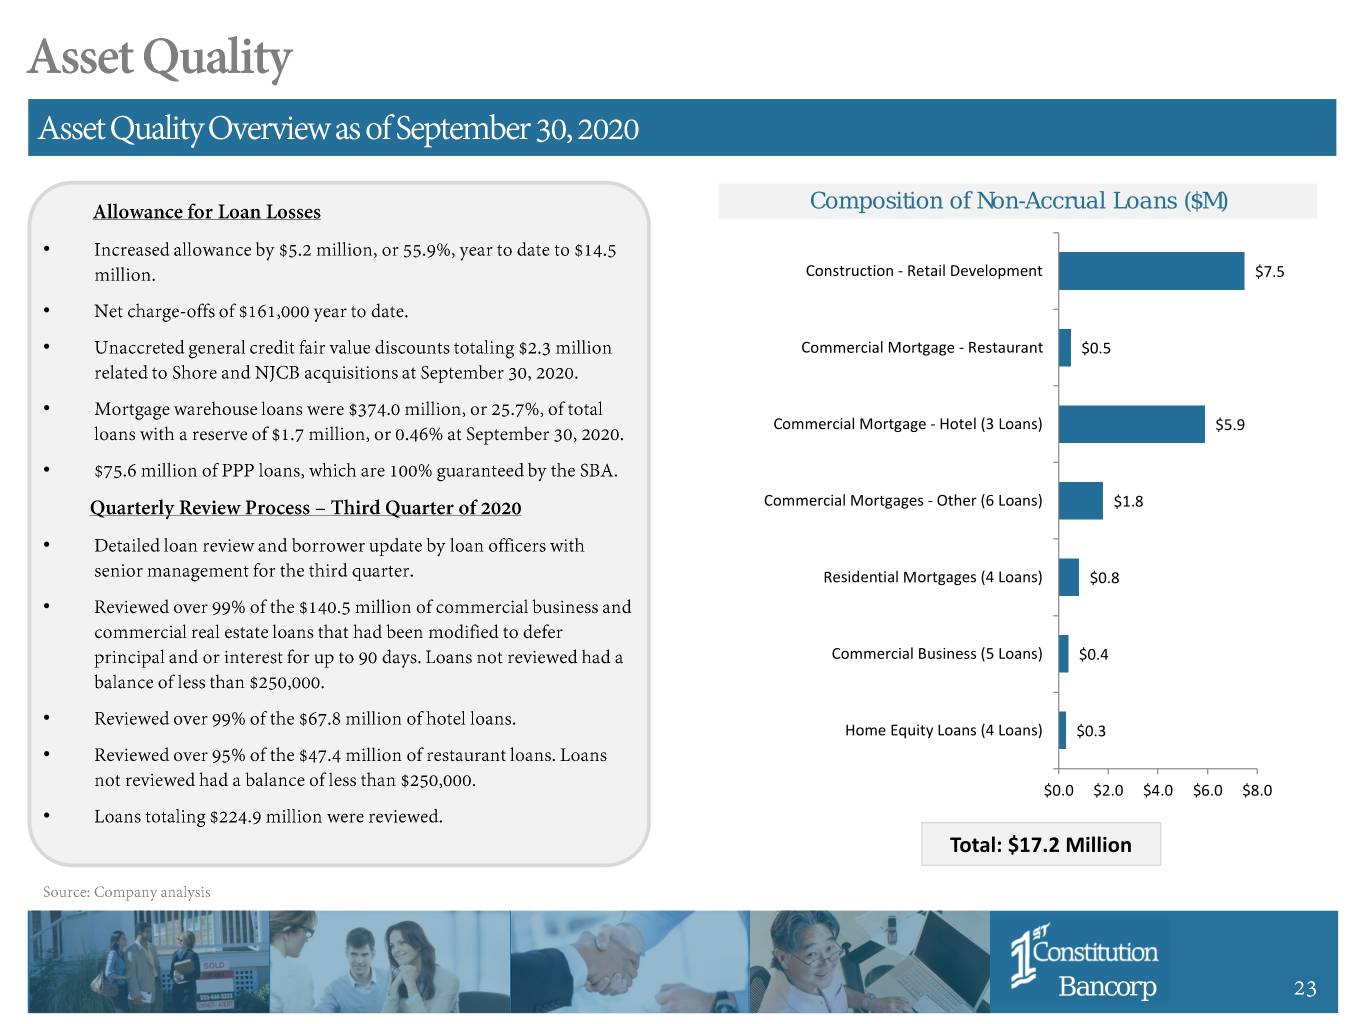
Composition of Non-Accrual Loans ($M) • Construction - Retail Development $7.5 • • Commercial Mortgage - Restaurant $0.5 • Commercial Mortgage - Hotel (3 Loans) $5.9 • Commercial Mortgages - Other (6 Loans) $1.8 • Residential Mortgages (4 Loans) $0.8 • Commercial Business (5 Loans) $0.4 • Home Equity Loans (4 Loans) $0.3 • $0.0 $2.0 $4.0 $6.0 $8.0 • Total: $17.2 Million Bancorp 23
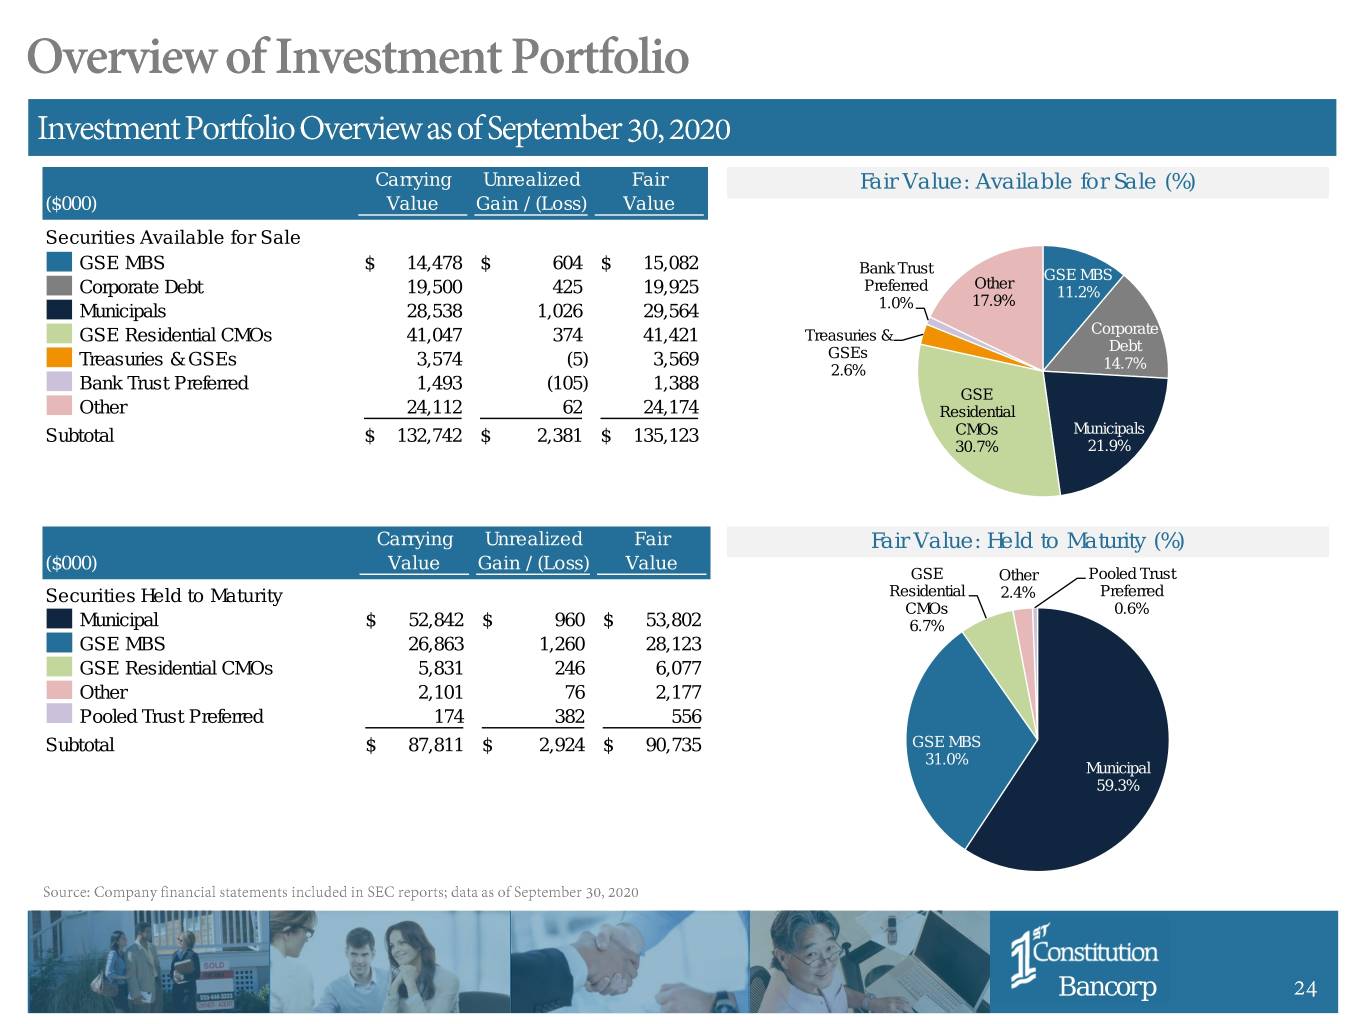
Carrying Unrealized Fair Fair Value: Available for Sale (%) ($000) Value Gain / (Loss) Value Securities Available for Sale GSE MBS $ 14,478 $ 604 $ 15,082 Bank Trust GSE MBS Other Corporate Debt 19,500 425 19,925 Preferred 11.2% 17.9% Municipals 28,538 1,026 29,564 1.0% GSE Residential CMOs 41,047 374 41,421 Treasuries & Corporate Debt Treasuries & GSEs 3,574 (5) 3,569 GSEs 2.6% 14.7% Bank Trust Preferred 1,493 (105) 1,388 GSE Other 24,112 62 24,174 Residential Subtotal $ 132,742 $ 2,381 $ 135,123 CMOs Municipals 30.7% 21.9% Carrying Unrealized Fair Fair Value: Held to Maturity (%) ($000) Value Gain / (Loss) Value GSE Other Pooled Trust Securities Held to Maturity Residential 2.4% Preferred CMOs 0.6% Municipal $ 52,842 $ 960 $ 53,802 6.7% GSE MBS 26,863 1,260 28,123 GSE Residential CMOs 5,831 246 6,077 Other 2,101 76 2,177 Pooled Trust Preferred 174 382 556 Subtotal $ 87,811 $ 2,924 $ 90,735 GSE MBS 31.0% Municipal 59.3% Bancorp 24
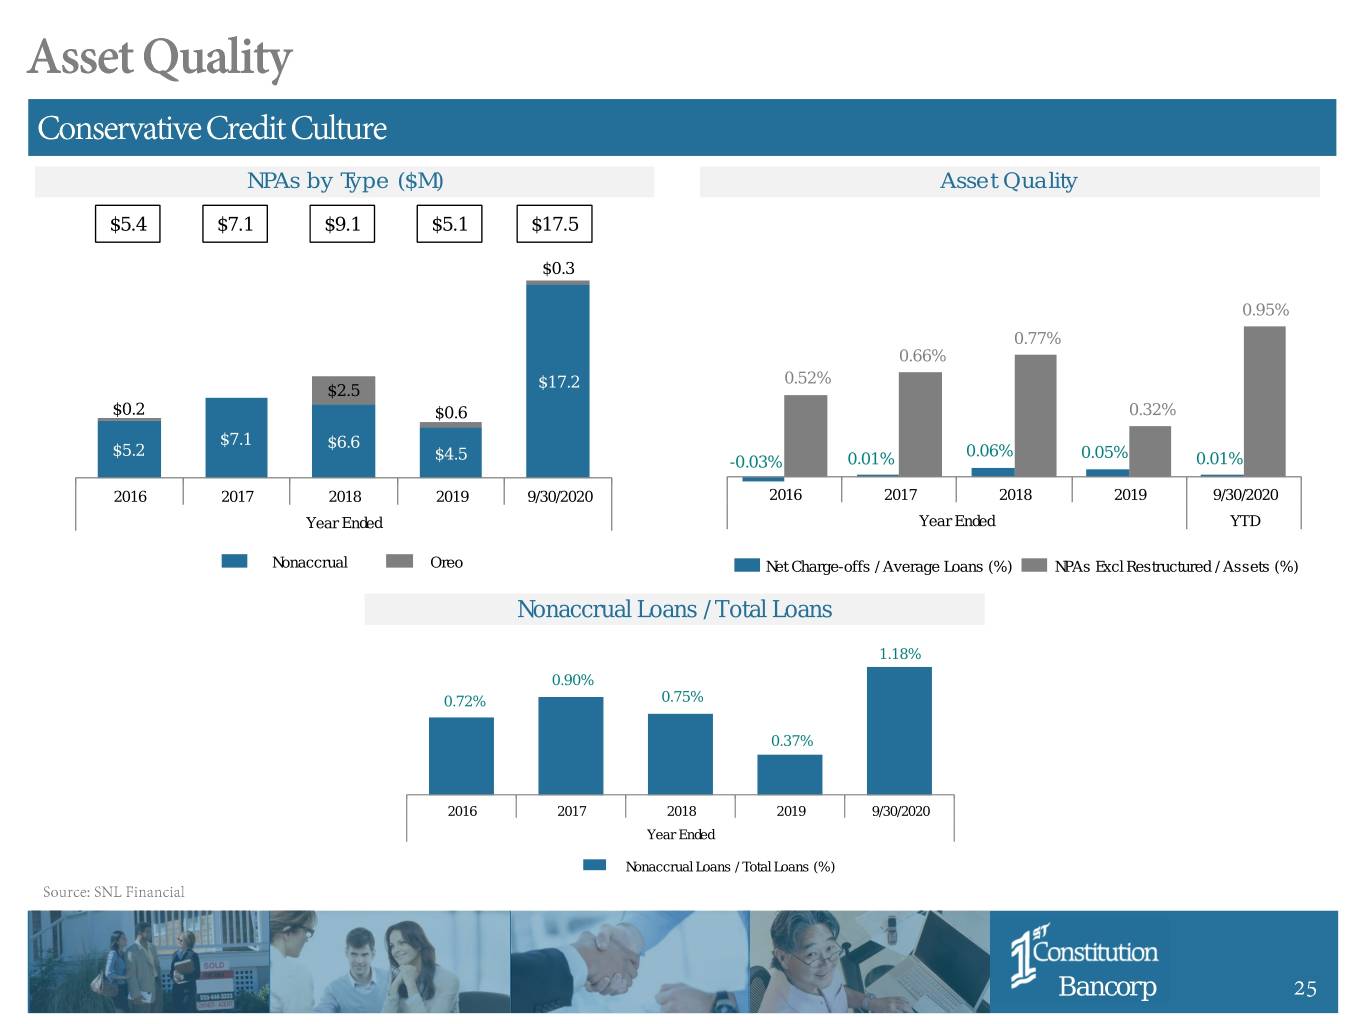
NPAs by Type ($M) Asset Quality $5.4 $7.1 $9.1 $5.1 $17.5 $0.3 Valuation Impact 0.95% 0.77% Commerical Portfolio Growth ($M) 0.66% $17.2 0.52% Loan Composition (%) $2.5 $0.2 $0.6 0.32% Market Overview $7.1 $6.6 $5.2 0.06% 0.05% $4.5 -0.03% 0.01% 0.01% 2019 - 2024 Projected Population Growth 2016 2017 2018 2019 9/30/2020 2016 2017 2018 2019 9/30/2020 Year Ended Year Ended YTD 2019 - 2024 Projected Median HH Income Growth Nonaccrual Oreo Net Charge-offs / Average Loans (%) NPAs Excl Restructured / Assets (%) Asset Quality Nonaccrual Loans / Total Loans 1.18% 0.90% 0.72% 0.75% 0.37% 2016 2017 2018 2019 9/30/2020 Year Ended Nonaccrual Loans / Total Loans (%) Bancorp 25
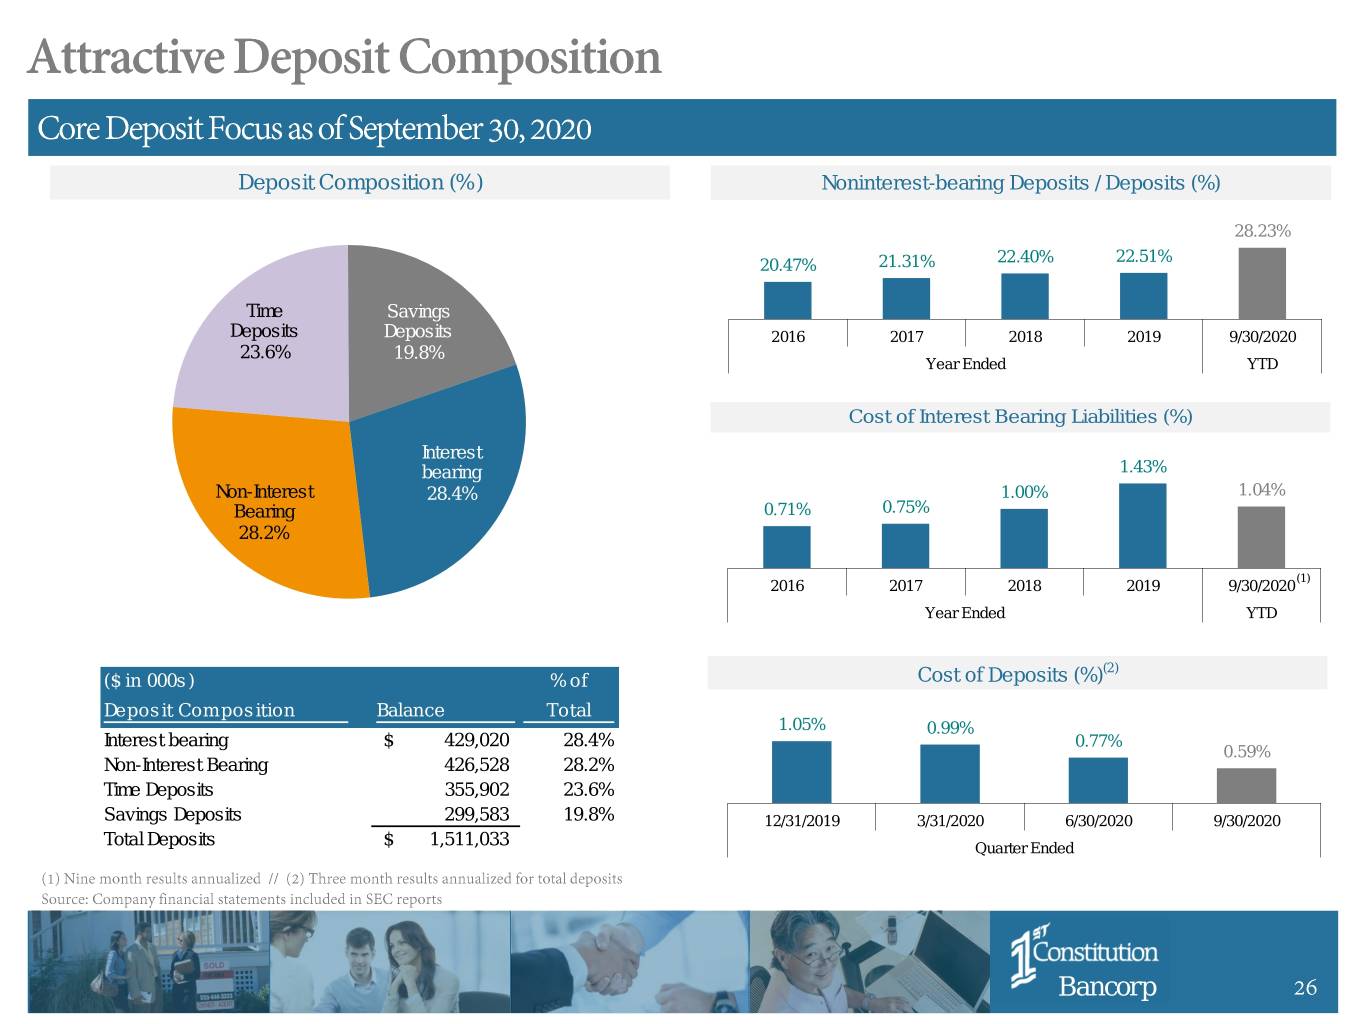
Deposit Composition (%) Noninterest-bearing Deposits / Deposits (%) 28.23% 22.40% 22.51% 20.47% 21.31% Time Savings Deposits Deposits 2016 2017 2018 2019 9/30/2020 23.6% 19.8% Year Ended YTD Cost of Interest Bearing Liabilities (%) Interest bearing 1.43% Non-Interest 28.4% 1.00% 1.04% Bearing 0.71% 0.75% 28.2% (1) 2016 2017 2018 2019 9/30/2020 Year Ended YTD (2) ($ in 000s) % of Cost of Deposits (%) Deposit Composition Balance Total 1.05% 0.99% Interest bearing $ 429,020 28.4% 0.77% 0.59% Non-Interest Bearing 426,528 28.2% Time Deposits 355,902 23.6% Savings Deposits 299,583 19.8% 12/31/2019 3/31/2020 6/30/2020 9/30/2020 Total Deposits $ 1,511,033 Quarter Ended Bancorp 26
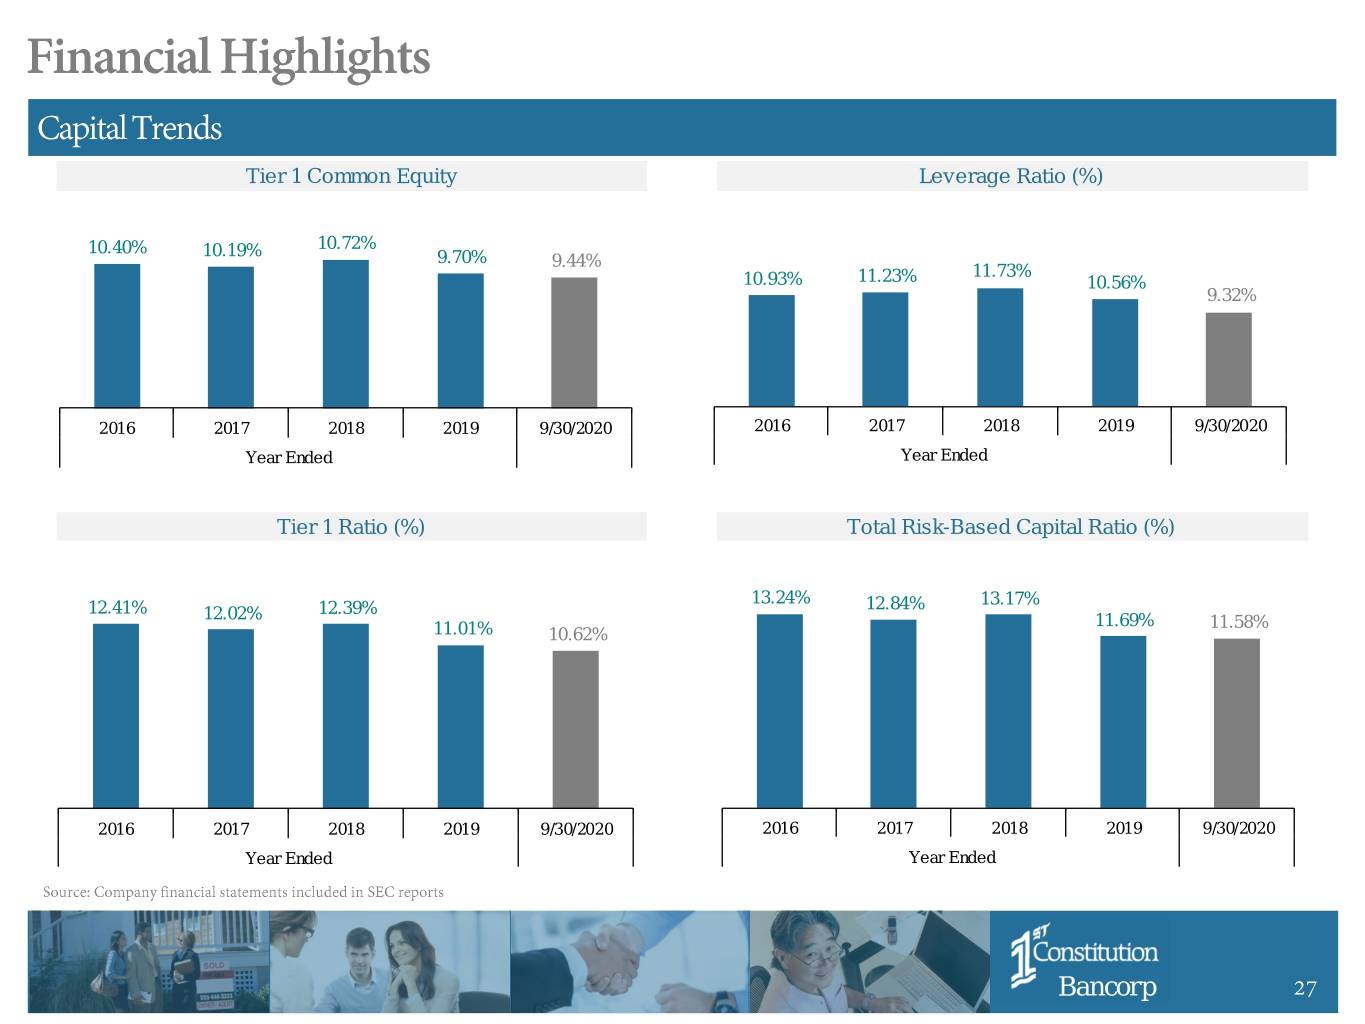
Tier 1 Common Equity Leverage Ratio (%) 10.40% 10.19% 10.72% 9.70% 9.44% 11.73% 10.93% 11.23% 10.56% 9.32% 2016 2017 2018 2019 9/30/2020 2016 2017 2018 2019 9/30/2020 Year Ended Year Ended Tier 1 Ratio (%) Total Risk-Based Capital Ratio (%) 13.24% 13.17% 12.41% 12.39% 12.84% 12.02% 11.69% 11.58% 11.01% 10.62% 2016 2017 2018 2019 9/30/2020 2016 2017 2018 2019 9/30/2020 Year Ended Year Ended Bancorp 27
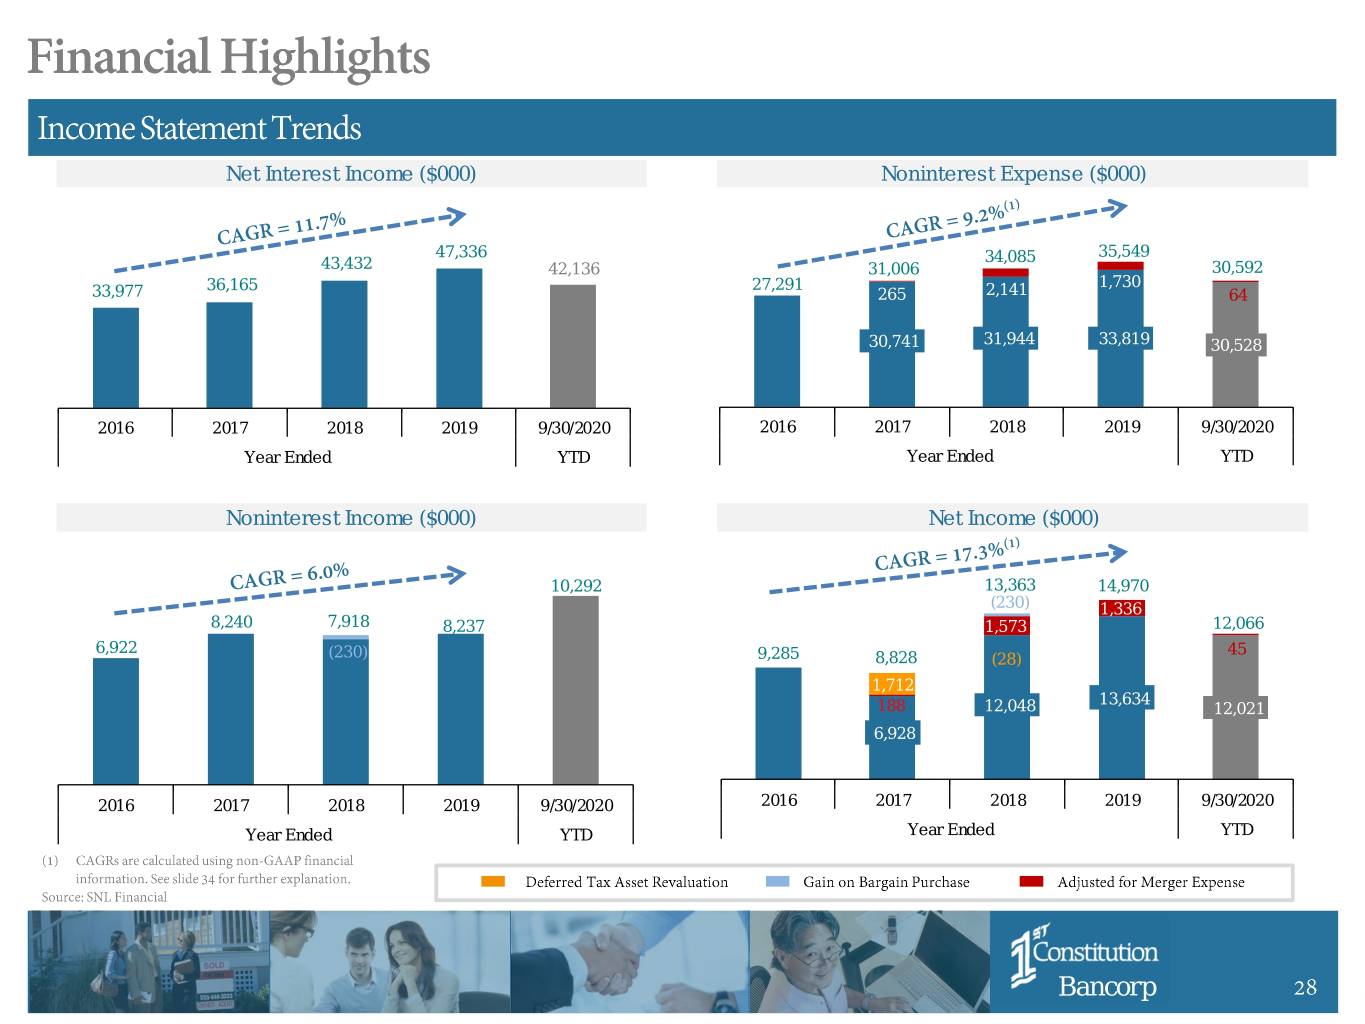
Net Interest Income ($000) Noninterest Expense ($000) 47,336 34,085 35,549 43,432 42,136 31,006 30,592 36,165 27,291 1,730 33,977 265 2,141 64 30,741 31,944 33,819 30,528 2016 2017 2018 2019 9/30/2020 2016 2017 2018 2019 9/30/2020 Year Ended YTD Year Ended YTD Noninterest Income ($000) Net Income ($000) 10,292 13,363 14,970 (230) 1,336 8,240 7,918 8,237 1,573 12,066 6,922 45 (230) 9,285 8,828 (28) 1,712 13,634 188 12,048 12,021 6,928 2016 2017 2018 2019 9/30/2020 2016 2017 2018 2019 9/30/2020 Year Ended YTD Year Ended YTD Bancorp 28
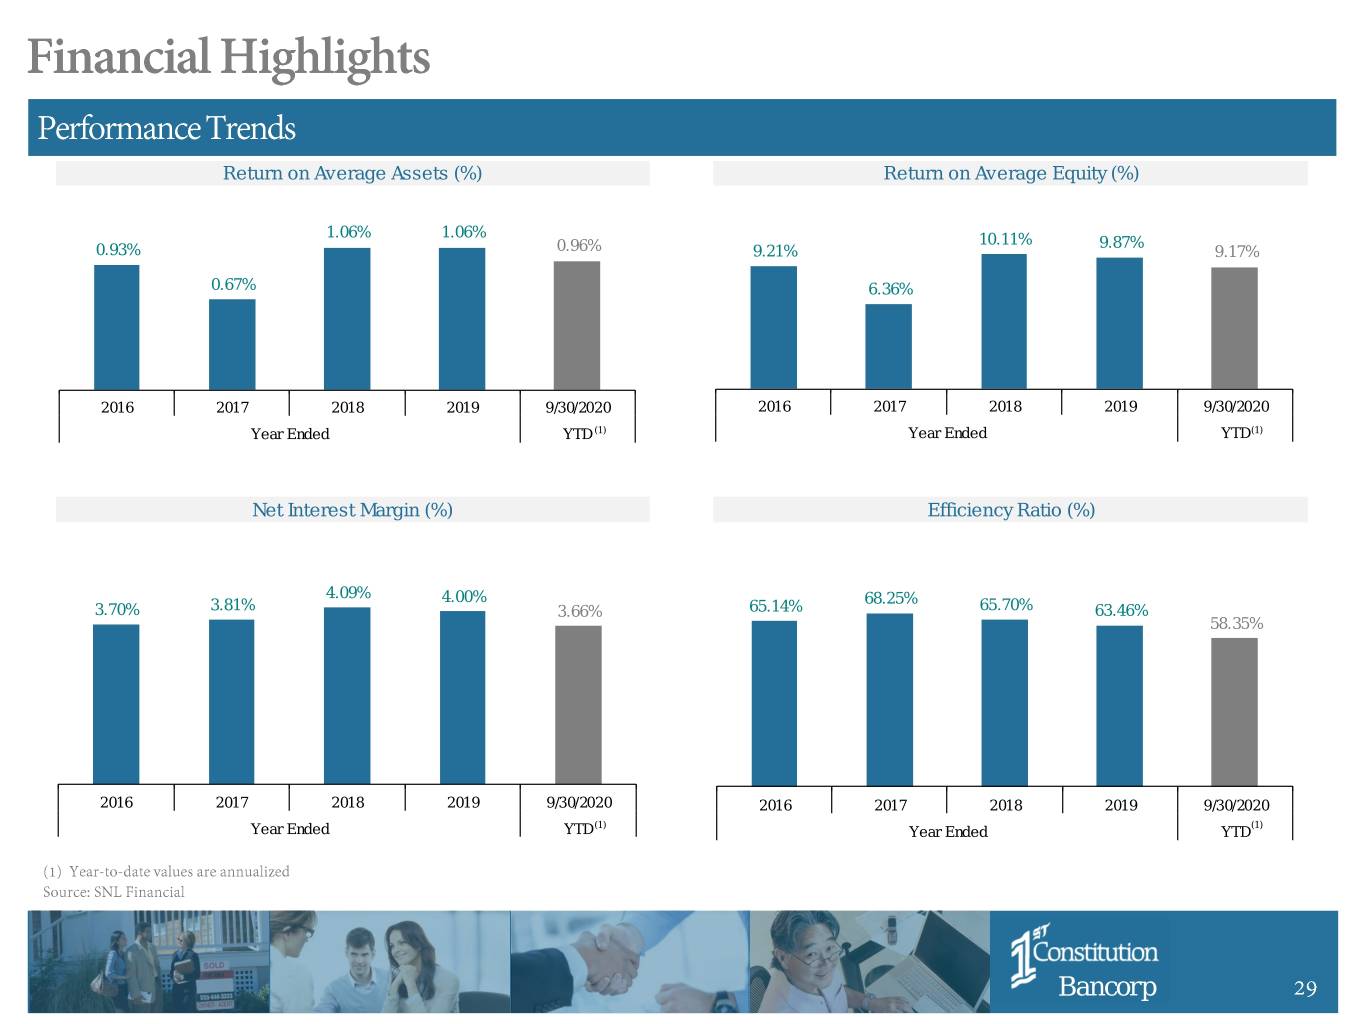
Return on Average Assets (%) Return on Average Equity (%) 1.06% 1.06% 10.11% 9.87% 0.93% 0.96% 9.21% 9.17% 0.67% 6.36% 2016 2017 2018 2019 9/30/2020 2016 2017 2018 2019 9/30/2020 Year Ended YTD (1) Year Ended YTD(1) Net Interest Margin (%) Efficiency Ratio (%) 4.09% 4.00% 68.25% 3.70% 3.81% 3.66% 65.14% 65.70% 63.46% 58.35% 2016 2017 2018 2019 9/30/2020 2016 2017 2018 2019 9/30/2020 (1) (1) Year Ended YTD Year Ended YTD Bancorp 29
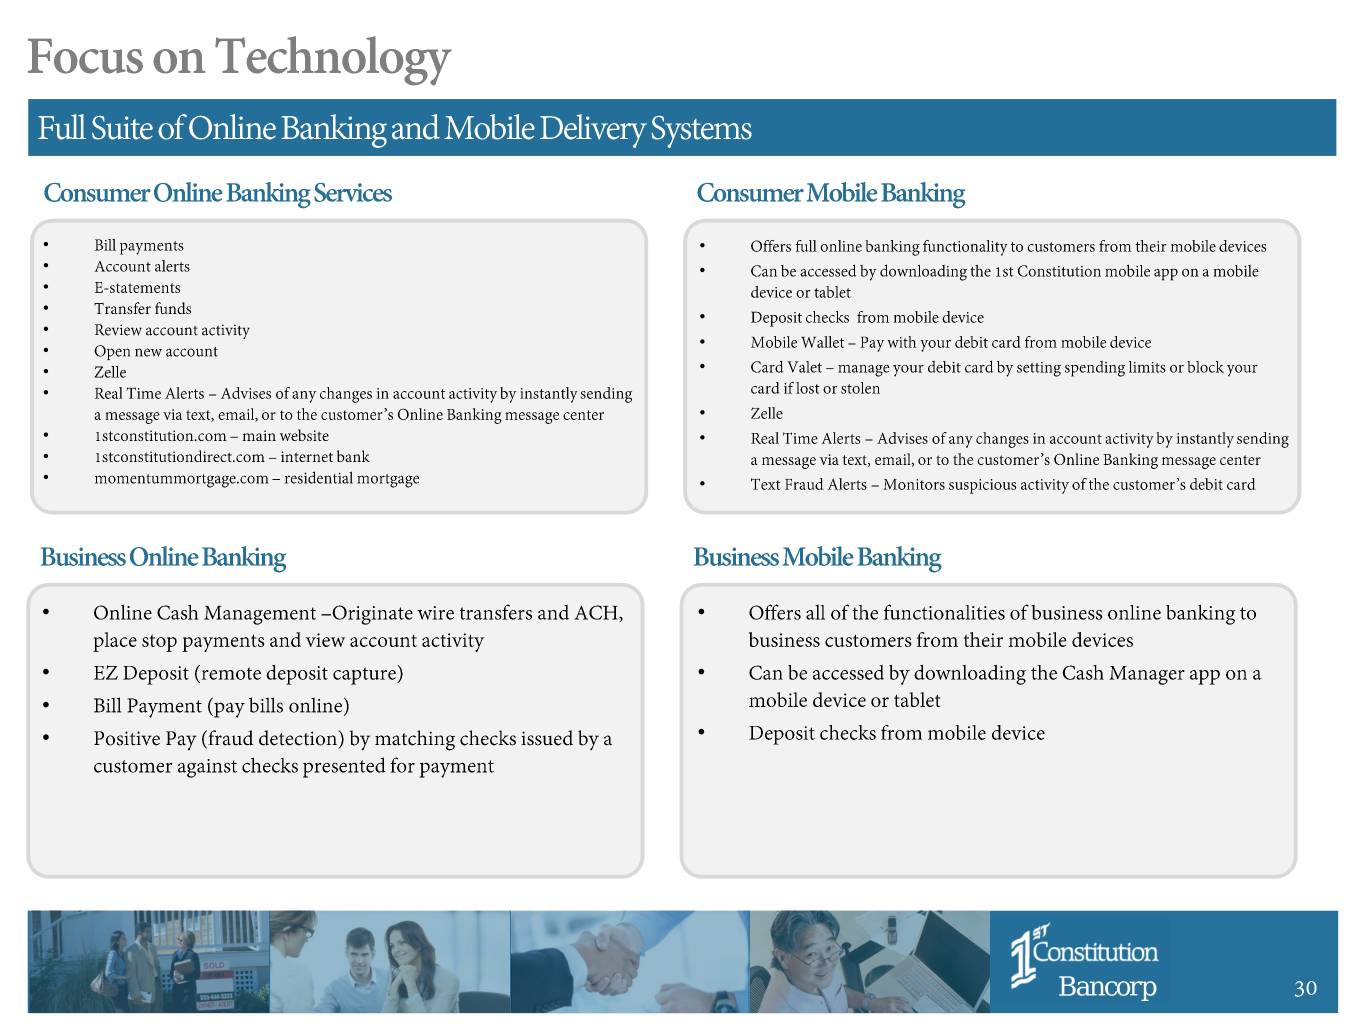
• • • • • • • • • • • • • • • • • • • • • • • • • • Bancorp 30

Bancorp
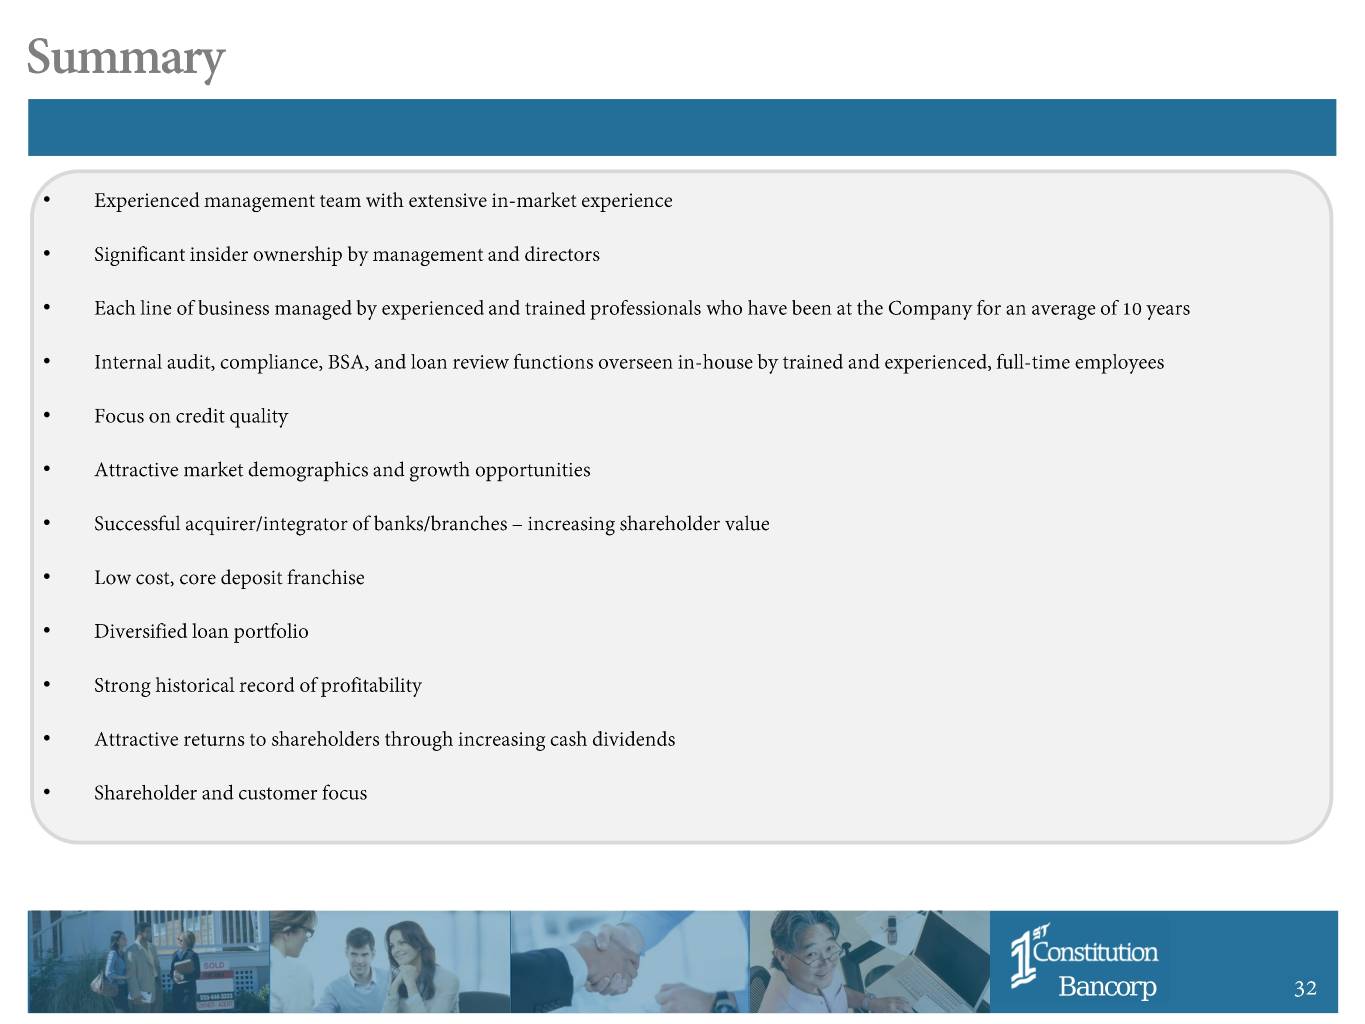
• • • • • • • • • • • • Bancorp 32
Bancorp 33 33
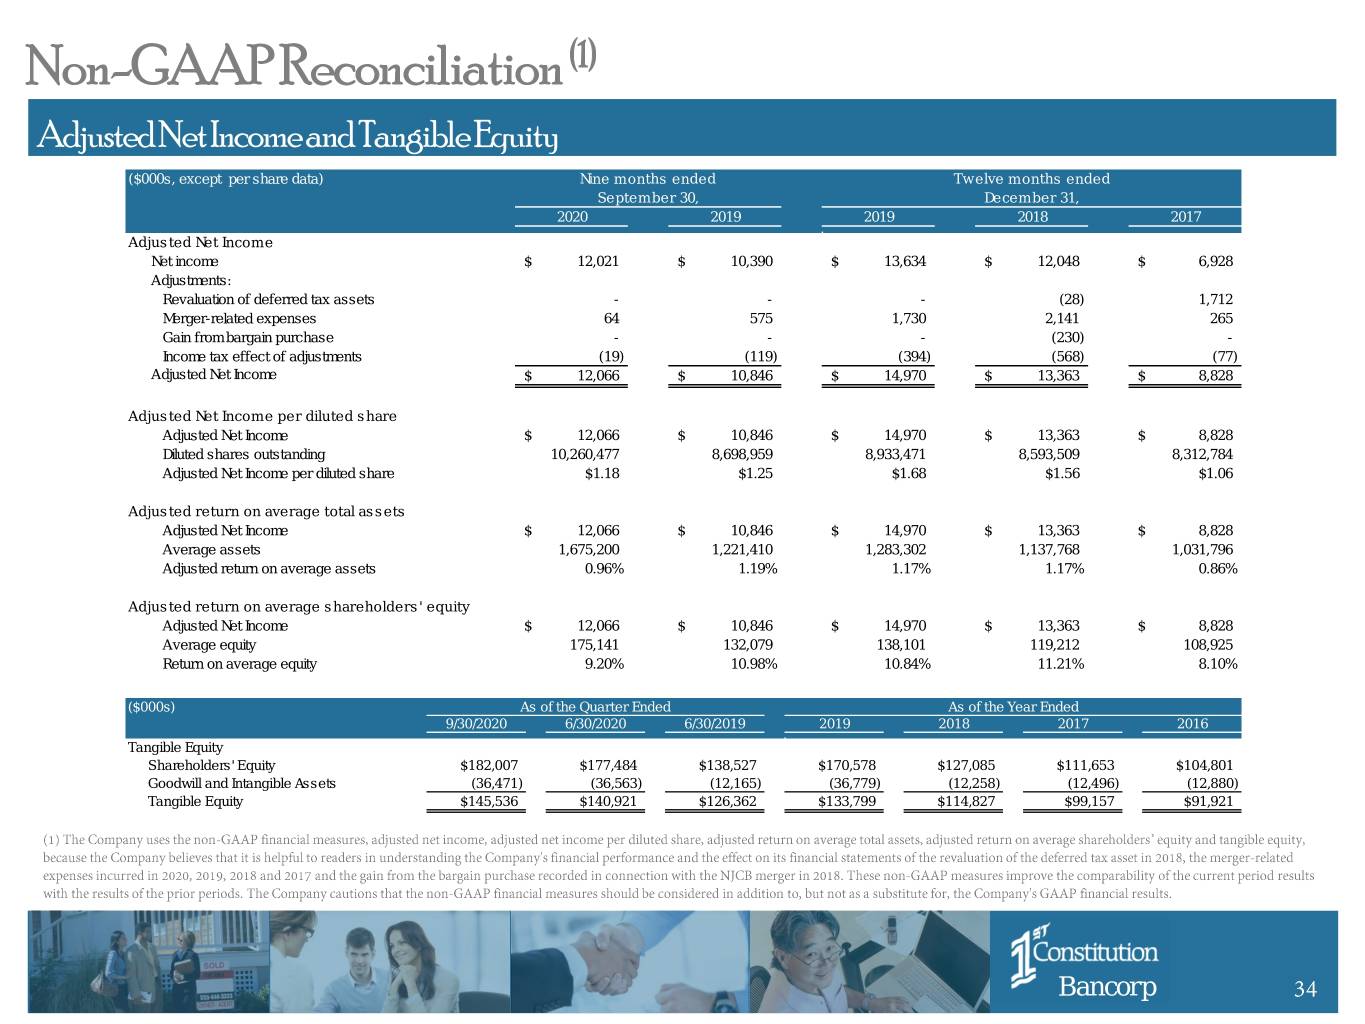
Non-GAAP Reconciliation (1) Adjusted Net Income and Tangible Equity ($000s, except per share data) Nine months ended Twelve months ended September 30, December 31, 2020 2019 2019 2018 2017 Adjusted Net Income Net income $ 12,021 $ 10,390 $ 13,634 $ 12,048 $ 6,928 Adjustments: Revaluation of deferred tax assets - - - (28) 1,712 Merger-related expenses 64 575 1,730 2,141 265 Gain from bargain purchase - - - (230) - Income tax effect of adjustments (19) (119) (394) (568) (77) Adjusted Net Income $ 12,066 $ 10,846 $ 14,970 $ 13,363 $ 8,828 Adjusted Net Income per diluted share Adjusted Net Income $ 12,066 $ 10,846 $ 14,970 $ 13,363 $ 8,828 Diluted shares outstanding 10,260,477 8,698,959 8,933,471 8,593,509 8,312,784 Adjusted Net Income per diluted share $1.18 $1.25 $1.68 $1.56 $1.06 Adjusted return on average total assets Adjusted Net Income $ 12,066 $ 10,846 $ 14,970 $ 13,363 $ 8,828 Average assets 1,675,200 1,221,410 1,283,302 1,137,768 1,031,796 Adjusted return on average assets 0.96% 1.19% 1.17% 1.17% 0.86% Adjusted return on average shareholders' equity Adjusted Net Income $ 12,066 $ 10,846 $ 14,970 $ 13,363 $ 8,828 Average equity 175,141 132,079 138,101 119,212 108,925 Return on average equity 9.20% 10.98% 10.84% 11.21% 8.10% ($000s) As of the Quarter Ended As of the Year Ended 9/30/2020 6/30/2020 6/30/2019 2019 2018 2017 2016 Tangible Equity Shareholders' Equity $182,007 $177,484 $138,527 $170,578 $127,085 $111,653 $104,801 Goodwill and Intangible Assets (36,471) (36,563) (12,165) (36,779) (12,258) (12,496) (12,880) Tangible Equity $145,536 $140,921 $126,362 $133,799 $114,827 $99,157 $91,921 Bancorp 34
