Attached files
| file | filename |
|---|---|
| EX-99.1 - EXHIBIT 99.1 - WestRock Co | a52320201ex991.htm |
| 8-K - WESTROCK COMPANY 8-K - WestRock Co | a52320201.htm |
|
Exhibit 99.2
|
Westrock | Q4 fy2020 resultsNovember 5, 2020
Forward Looking Statements:This presentation contains forward-looking statements within the meaning of
the Private Securities Litigation Reform Act of 1995, including but not limited to the statements on the slides entitled “Executing Well With Strong Operating Performance In A Rapidly Changing Economic Environment”, “Productivity
Improvements”, “Q4 FY20 Consumer Packaging Results”, “Consumer Packaging Segment Goodwill Impairment”, “Capital Allocation Priorities”, “Financial Strength Supported by Strong Cash Flow Generation”, “Q1 FY21 Sequential Guidance”, “Mill
Maintenance Schedule”, “Key Commodity Annual Consumption Volumes” and “Anticipated Cash Impact of Pandemic Action Plan” that give guidance or estimates for future periods as well as statements regarding, among other things, (1) that our
market leading capabilities position us for sustainable growth in packaging, (ii) our expectation that (A) the Florence, SC mill capital project will generate $30 million in EBITDA improvement in FY21 with a run rate of $55 million at full
ramp up, (B) the Tres Barras mill upgrade will result in a production increase to approximately 750,000 tons per year, an annual EBITDA benefit of $70 million when fully ramped up in FY22 and an improved fiber mix of 100% virgin fiber from
approximately 80% virgin and 20% recycled, (C) the Porto Feliz project will result in $20 million in EBITDA improvement in FY21 with a run rate of $30 million at full ramp up, (D) the KapStone synergies will increase to more than $200 million
by the end of FY21 and (E) the North Charleston, SC mill reconfiguration will increase annual EBITDA by $40 million, (iii) that we expect to add $125 million of EBITDA in FY21 as a result of the productivity improvement projects listed on
slide 8, (iv), that we will restart an idled machine at the Covington mill (v), that we expect to continue to generate attractive cash flows as we increase our participation in packaging markets (vi) the near term and medium term priorities
listed on slide 11, (vii) that the Pandemic Action Plan is expected to provide approximately $1 billion of cash available for debt reduction through the end of FY21, (viii) the sequential guidance and FY21 outlook addressed on slide 13, (ix)
the mill maintenance schedule on slide 20, (x) the key commodity annual consumption volumes on slide 21 and (xi) that we expect to generate $1 billion of additional cash through the Pandemic Action Plan that will be available for debt
reduction through the end of FY21 and the estimated components on slide 17.Forward-looking statements are based on our current expectations, beliefs, plans or forecasts and are typically identified by words or phrases such as “may,” “will,”
“could,” “should,” “would,” “anticipate,” “estimate,” “expect,” “project,” “intend,” “plan,” “believe,” “target,” “prospects,” “potential” and “forecast,” and other words, terms and phrases of similar meaning. Forward-looking statements
involve estimates, expectations, projections, goals, forecasts, assumptions, risks and uncertainties. WestRock cautions readers that a forward-looking statement is not a guarantee of future performance and that actual results could differ
materially from those contained in the forward-looking statement. WestRock’s businesses are subject to a number of general risks that would affect any such forward-looking statements, including, among others, developments related to the
COVID-19 pandemic, including the severity, magnitude and duration of the pandemic, negative global economic conditions arising from the pandemic, impacts of governments’ responses to the pandemic on our operations, impacts of the pandemic on
commercial activity, our customers and consumer preferences and demand, supply chain disruptions, and disruptions in the credit or financial markets; decreases in demand for their products; increases in energy, raw materials, shipping and
capital equipment costs; reduced supply of raw materials; fluctuations in selling prices and volumes; intense competition; the potential loss of certain customers; the scope, costs, timing and impact of any restructuring of our operations and
corporate and tax structure; the occurrence of a natural disaster, such as hurricanes or other unanticipated problems, such as labor difficulties, equipment failure or unscheduled maintenance and repair; risks associated with integrating
KapStone’s operations into our operations and our ability to realize anticipated synergies and productivity improvements; risks associated with completing our strategic capital projects on the anticipated timelines and realizing our
anticipated EBITDA improvements; benefits that we expect to realize from actions that we are taking and plan to take in response to COVID-19; and adverse changes in general market and industry conditions. Such risks and other factors that may
impact management’s assumptions are more particularly described in our filings with the Securities and Exchange Commission, including in Item 1A under the caption “Risk Factors” in our Annual Report on Form 10-K for the year ended September
30, 2019 and Form 10-Q for the quarter ended June 30, 2020. The information contained herein speaks as of the date hereof and WestRock does not have or undertake any obligation to update or revise its forward-looking statements, whether as a
result of new information, future events or otherwise.Non-GAAP Financial Measures:We may from time to time be in possession of certain information regarding WestRock that applicable law would not require us to disclose to the public in the
ordinary course of business, but would require us to disclose if we were engaged in the purchase or sale of our securities. This presentation shall not be considered to be part of any solicitation of an offer to buy or sell WestRock
securities. This presentation also may not include all of the information regarding WestRock that you may need to make an investment decision regarding WestRock securities. Any investment decision should be made on the basis of the total mix
of information regarding WestRock that is publicly available as of the date of the investment decision.We report our financial results in accordance with accounting principles generally accepted in the United States (“GAAP”). However,
management believes certain non-GAAP financial measures provide users with additional meaningful financial information that should be considered when assessing our ongoing performance. Management also uses these non-GAAP financial measures in
making financial, operating and planning decisions and in evaluating our performance. Non-GAAP financial measures should be viewed in addition to, and not as an alternative for, our GAAP results. The non-GAAP financial measures we present may
differ from similarly captioned measures presented by other companies. Machine Forward Looking Statements; Non-GAAP Financial Measures 2
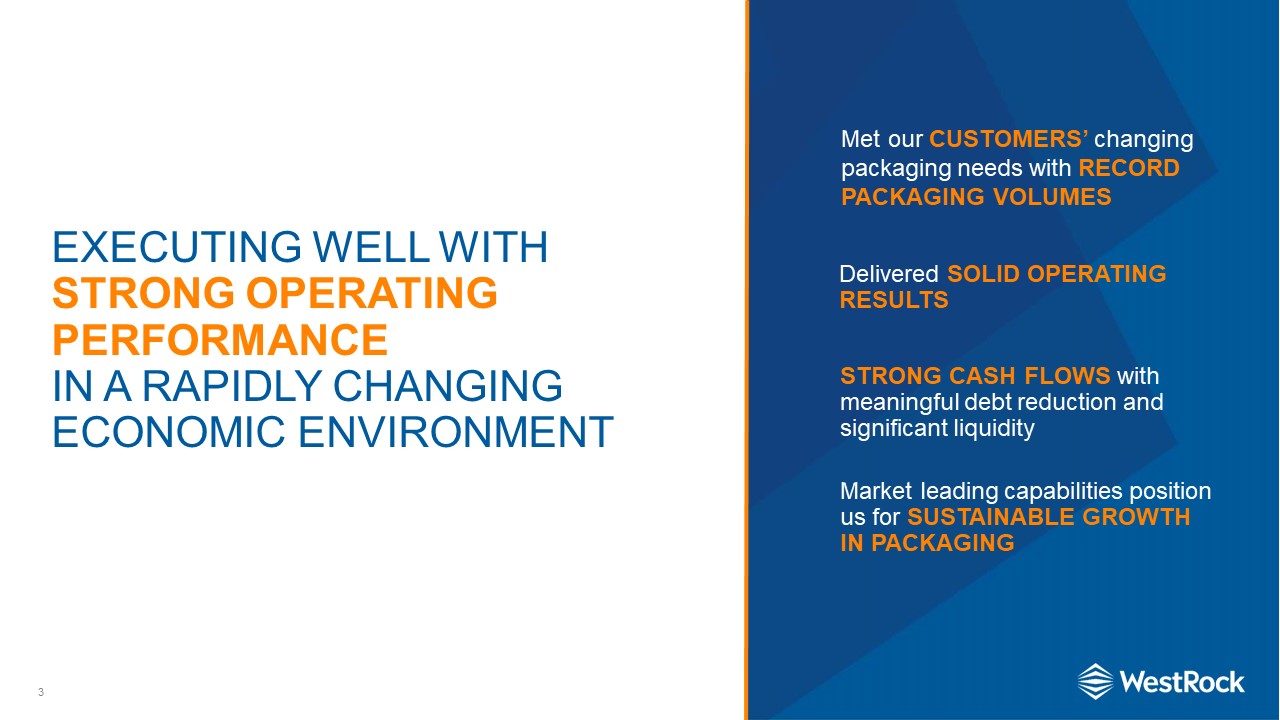
3 Executing well with strong operating performance in a rapidly changing economic environment
Delivered solid operating results Market leading capabilities position us for sustainable growth in packaging Strong Cash Flows with meaningful debt reduction and significant liquidity Met our customers’ changing packaging needs
with RECORD PACKAGING VOLUMES
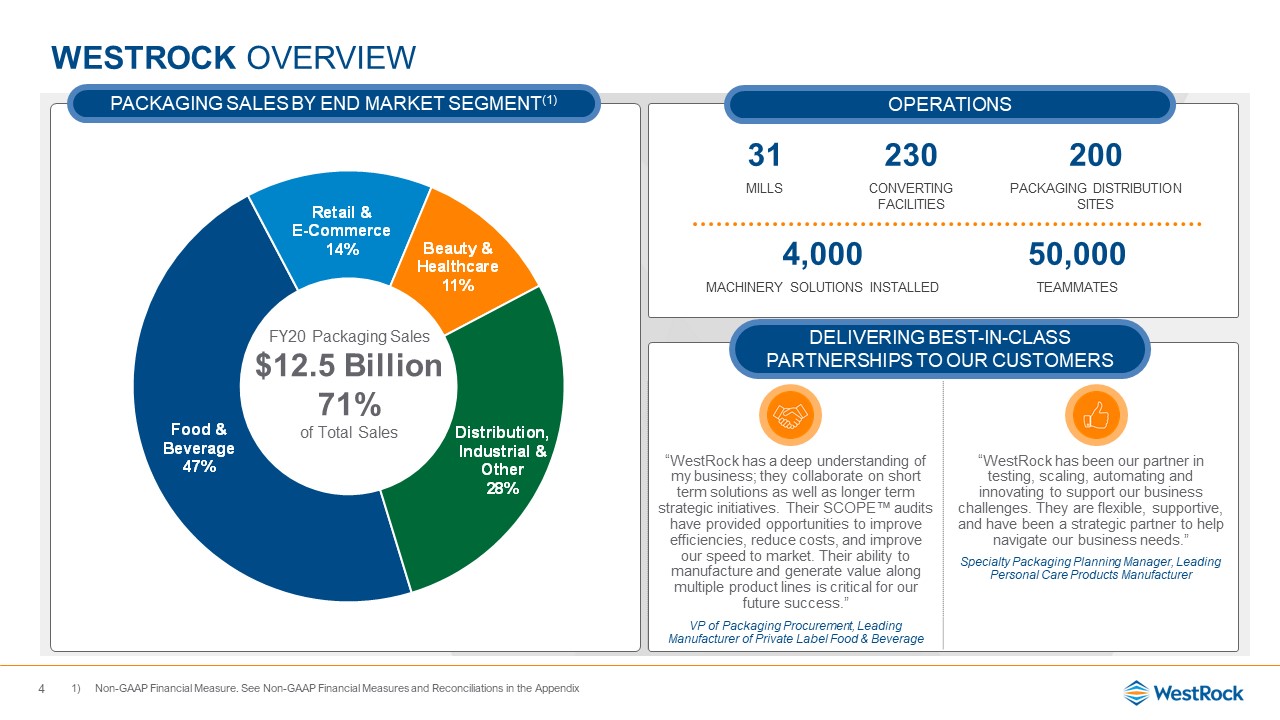
Westrock Overview 4 Non-GAAP Financial Measure. See Non-GAAP Financial Measures and
Reconciliations in the Appendix 31 230 200 MILLS CONVERTING FACILITIES PACKAGING DISTRIBUTION SITES Operations “WestRock has a deep understanding of my business; they collaborate on short term solutions as well as longer term
strategic initiatives. Their SCOPE™ audits have provided opportunities to improve efficiencies, reduce costs, and improve our speed to market. Their ability to manufacture and generate value along multiple product lines is critical for our
future success.”VP of Packaging Procurement, Leading Manufacturer of Private Label Food & Beverage “WestRock has been our partner in testing, scaling, automating and innovating to support our business challenges. They are flexible,
supportive, and have been a strategic partner to help navigate our business needs.”Specialty Packaging Planning Manager, Leading Personal Care Products Manufacturer Delivering Best-in-Class Partnerships to our
Customers 4,000 50,000 MACHINERY SOLUTIONS INSTALLED TEAMMATES Packaging Sales by End Market Segment(1) FY20 Packaging Sales $12.5 Billion71% of Total Sales
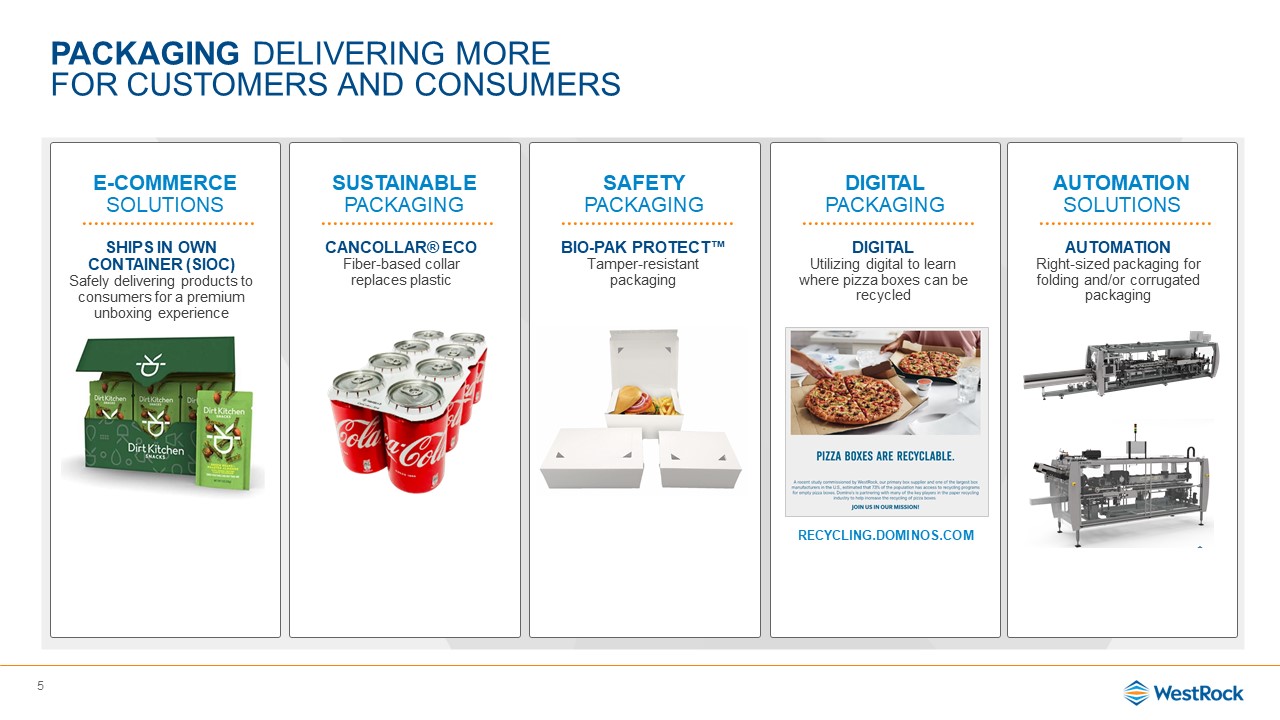
packaging Delivering more for customers and consumers 5 E-commerce Solutions Sustainable
Packaging SafetyPackaging cancollar® ECOFiber-based collar replaces plastic SHIPs IN OWN CONTAINER (SIOC)Safely delivering products to consumers for a premium unboxing experience digital Packaging BIO-PAK PROTECT™Tamper-resistant
packaging automation solutions automationRight-sized packaging for folding and/or corrugated packaging DIGITAL Utilizing digital to learn where pizza boxes can be recycled recycling.dominos.com
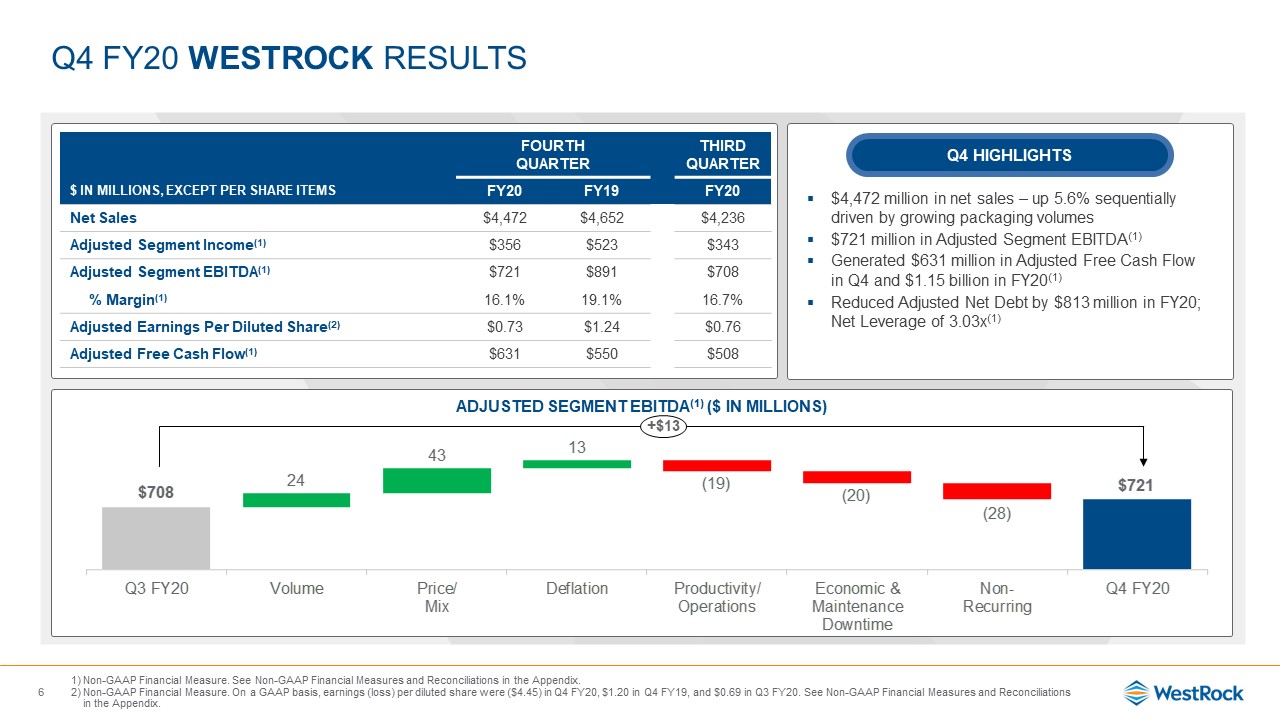
Q4 FY20 WestRock Results 6 Non-GAAP Financial Measure. See Non-GAAP Financial Measures and
Reconciliations in the Appendix.Non-GAAP Financial Measure. On a GAAP basis, earnings (loss) per diluted share were ($4.45) in Q4 FY20, $1.20 in Q4 FY19, and $0.69 in Q3 FY20. See Non-GAAP Financial Measures and Reconciliations in the
Appendix. $4,472 million in net sales – up 5.6% sequentially driven by growing packaging volumes$721 million in Adjusted Segment EBITDA(1)Generated $631 million in Adjusted Free Cash Flow in Q4 and $1.15 billion in FY20(1)Reduced Adjusted
Net Debt by $813 million in FY20; Net Leverage of 3.03x(1) Adjusted Segment EBITDA(1) ($ in millions) Q4 Highlights FOURTH QUARTER THIRD QUARTER $ in millions, EXCEPT PER SHARE ITEMS FY20 FY19 FY20 Net
Sales $4,472 $4,652 $4,236 Adjusted Segment Income(1) $356 $523 $343 Adjusted Segment EBITDA(1) $721 $891 $708 % Margin(1) 16.1% 19.1% 16.7% Adjusted Earnings Per Diluted Share(2) $0.73 $1.24 $0.76 Adjusted Free
Cash Flow(1) $631 $550 $508 +$13
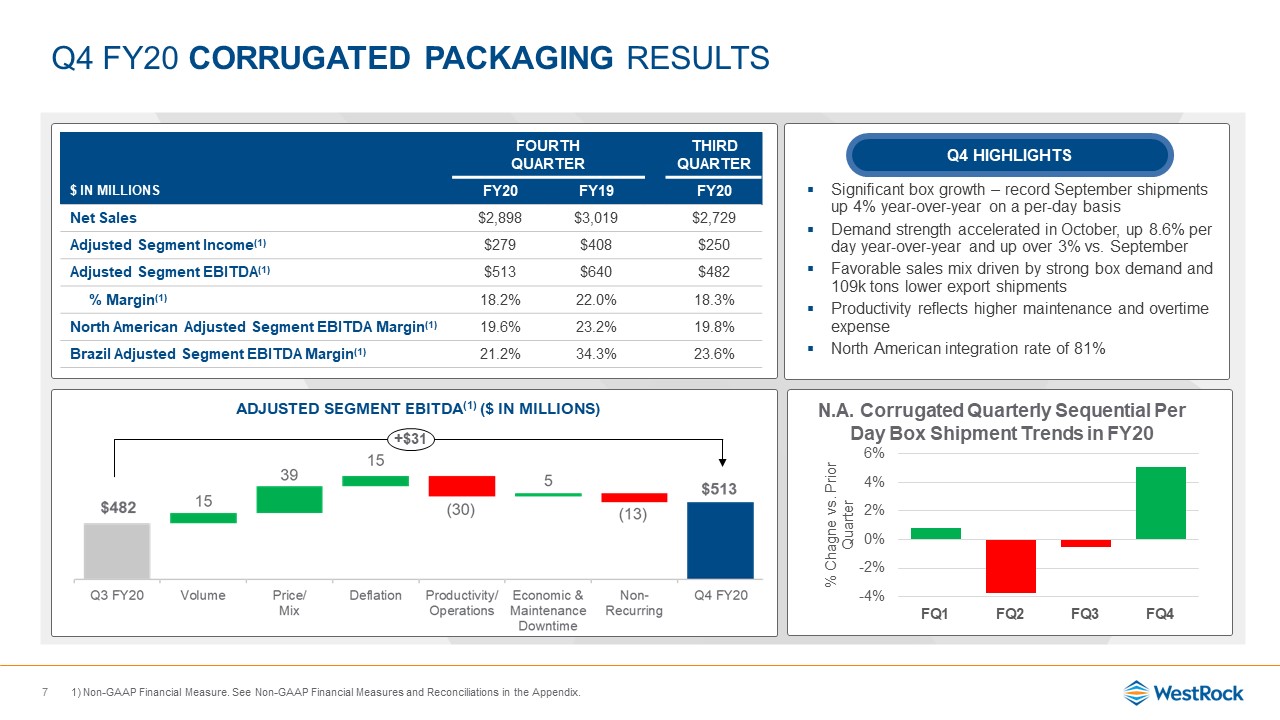
Q4 FY20 CORRUGATED PACKAGING Results 7 Adjusted Segment EBITDA(1) ($ in
millions) Significant box growth – record September shipments up 4% year-over-year on a per-day basisDemand strength accelerated in October, up 8.6% per day year-over-year and up over 3% vs. SeptemberFavorable sales mix driven by strong box
demand and 109k tons lower export shipmentsProductivity reflects higher maintenance and overtime expenseNorth American integration rate of 81% FOURTH QUARTER THIRD QUARTER $ in millions FY20 FY19 FY20 Net
Sales $2,898 $3,019 $2,729 Adjusted Segment Income(1) $279 $408 $250 Adjusted Segment EBITDA(1) $513 $640 $482 % Margin(1) 18.2% 22.0% 18.3% North American Adjusted Segment EBITDA
Margin(1) 19.6% 23.2% 19.8% Brazil Adjusted Segment EBITDA Margin(1) 21.2% 34.3% 23.6% +$31 Non-GAAP Financial Measure. See Non-GAAP Financial Measures and Reconciliations in the Appendix. Q4 Highlights N.A. Corrugated
Quarterly Sequential Per Day Box Shipment Trends in FY20
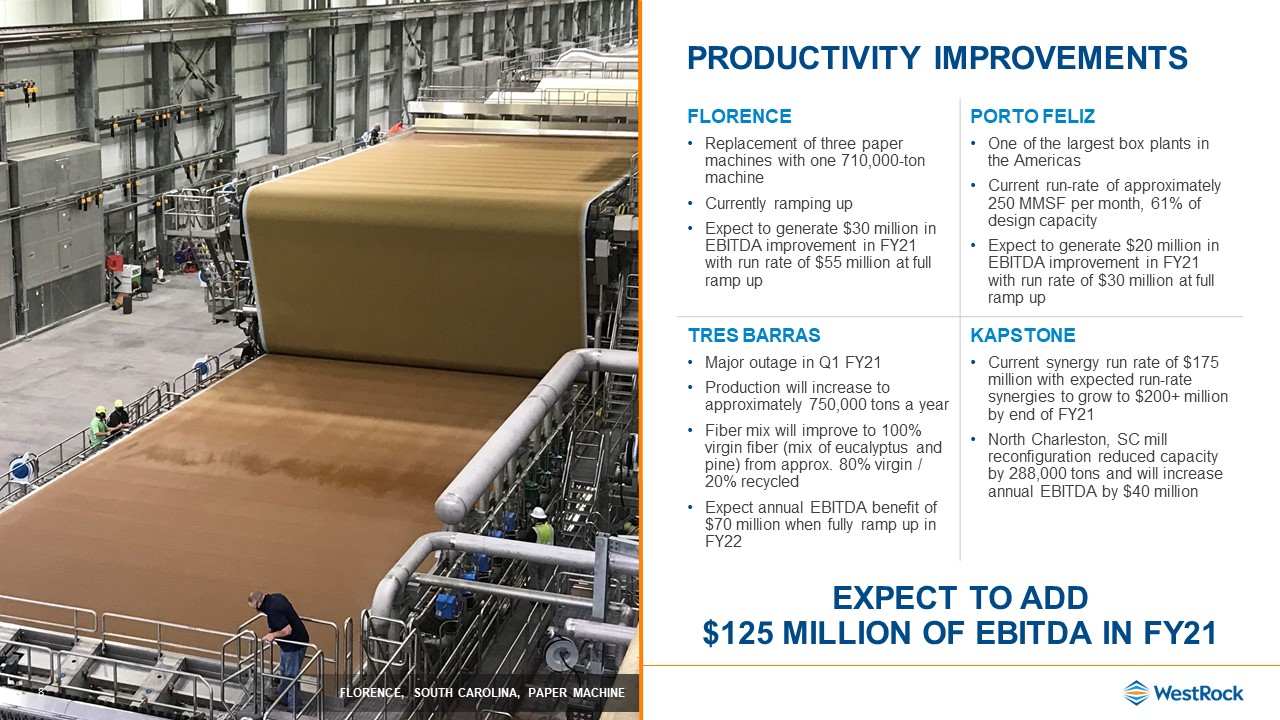
8 Productivity Improvements EXPECT TO ADD$125 MILLION OF EBITDA IN FY21 FLORENCEReplacement of
three paper machines with one 710,000-ton machineCurrently ramping up Expect to generate $30 million in EBITDA improvement in FY21 with run rate of $55 million at full ramp up PORTO FELIZOne of the largest box plants in the AmericasCurrent
run-rate of approximately 250 MMSF per month, 61% of design capacityExpect to generate $20 million in EBITDA improvement in FY21 with run rate of $30 million at full ramp up TRES BARRASMajor outage in Q1 FY21Production will increase to
approximately 750,000 tons a yearFiber mix will improve to 100% virgin fiber (mix of eucalyptus and pine) from approx. 80% virgin / 20% recycled Expect annual EBITDA benefit of $70 million when fully ramp up in FY22 KAPSTONECurrent synergy
run rate of $175 million with expected run-rate synergies to grow to $200+ million by end of FY21North Charleston, SC mill reconfiguration reduced capacity by 288,000 tons and will increase annual EBITDA by $40 million FLORENCE, SOUTH
CAROLINA, PAPER MACHINE
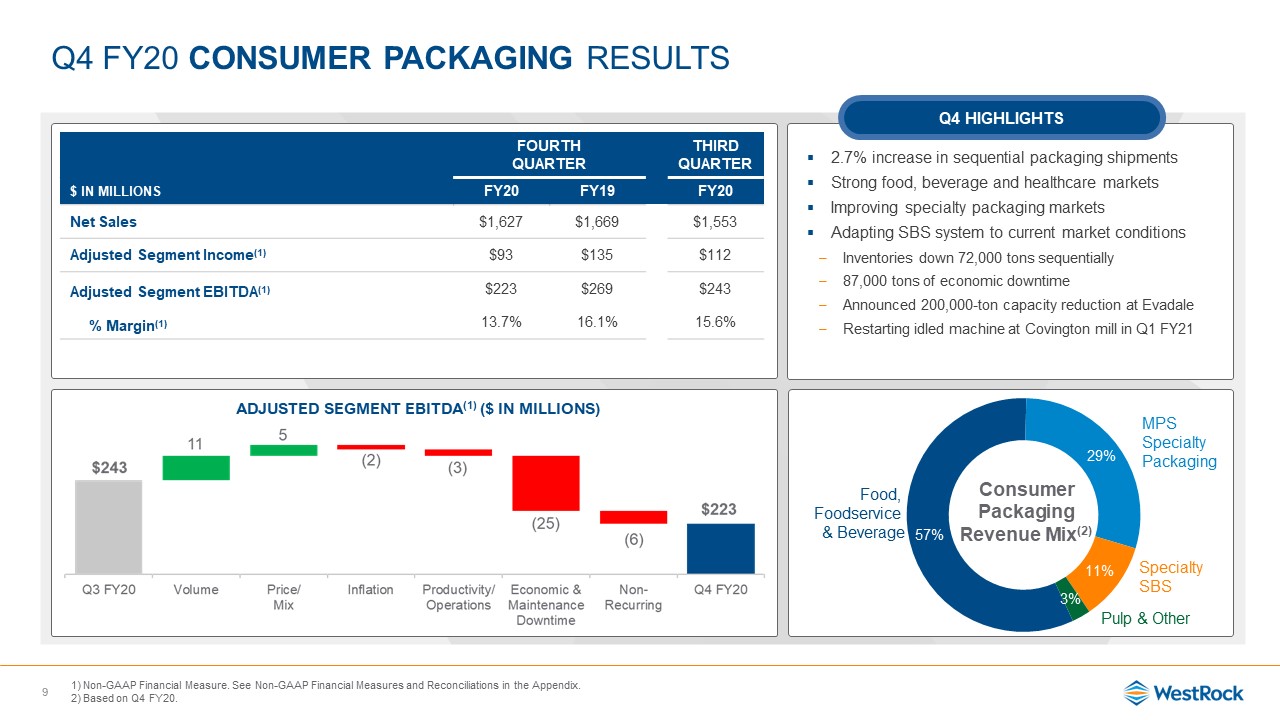
Q4 FY20 CONSUMER PACKAGING Results Adjusted Segment EBITDA(1) ($ in millions) 9 FOURTH
QUARTER THIRD QUARTER $ in millions FY20 FY19 FY20 Net Sales $1,627 $1,669 $1,553 Adjusted Segment Income(1) $93 $135 $112 Adjusted Segment EBITDA(1) $223 $269 $243 % Margin(1) 13.7% 16.1% 15.6% Non-GAAP
Financial Measure. See Non-GAAP Financial Measures and Reconciliations in the Appendix.Based on Q4 FY20. Q4 Highlights SpecialtySBS Food, Foodservice & Beverage MPSSpecialtyPackaging Pulp & Other Consumer Packaging Revenue
Mix(2) 2.7% increase in sequential packaging shipmentsStrong food, beverage and healthcare marketsImproving specialty packaging marketsAdapting SBS system to current market conditionsInventories down 72,000 tons sequentially87,000 tons of
economic downtimeAnnounced 200,000-ton capacity reduction at EvadaleRestarting idled machine at Covington mill in Q1 FY21
Consumer Packaging segment Goodwill Impairment 10 Recorded a non-cash charge in Q4 FY20 of $1.3
billion to adjust the fair value of the Consumer Packaging segmentNon-cash charge to EPS of $5.06 in Q4 FY20Decreases Consumer Packaging segment goodwill to $2.3 billionDriven by the impact of expected lower volumes and cash flows related to
certain SBS end markets, including tobacco, commercial print and plate & cup stock Secular declines, accelerated by COVID-19, led to the permanent SBS capacity reduction at Evadale of 200,000 tonsSince the creation of WestRock, the
Consumer Packaging segment has generated $3.4 billion in cash flow(1)Approximately 80% of segment sales serve packaging and paper markets that generate attractive marginsCritical component of our enterprise offering, allowing us to provide
customers with the broadest portfolio of fiber-based packaging solutionsWe expect to continue to generate attractive cash flows as we increase our participation in packaging markets Non-GAAP Financial Measure. Cash flow defined as Adjusted
Segment EBITDA - CAPEX
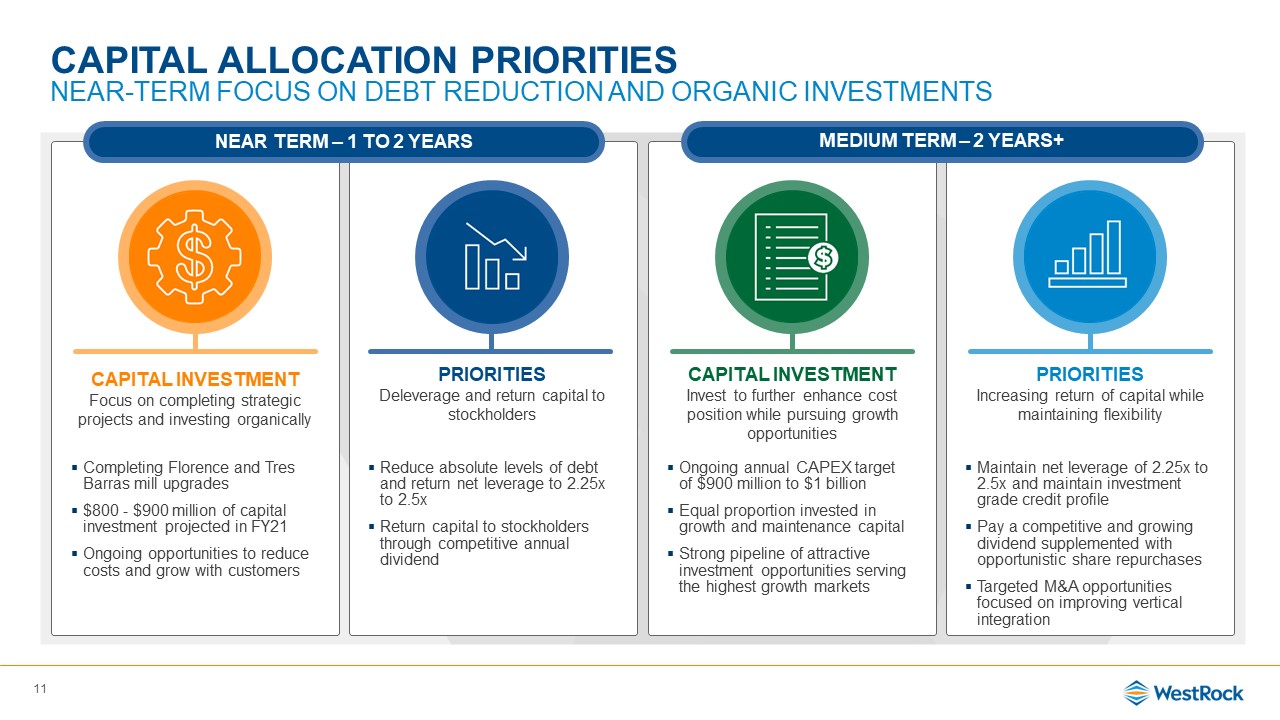
11 Capital InvestmentFocus on completing strategic projects and investing
organically xxx PRIORITIESDeleverage and return capital to stockholders xxx xxx CAPITAL INVESTMENTInvest to further enhance cost position while pursuing growth opportunities xxx PRIORITIESIncreasing return of capital while
maintaining flexibility Medium Term – 2 years+ Capital Allocation PrioritiesNear-Term Focus on Debt Reduction and Organic Investments Near Term – 1 to 2 years Completing Florence and Tres Barras mill upgrades$800 - $900 million of capital
investment projected in FY21Ongoing opportunities to reduce costs and grow with customers Reduce absolute levels of debt and return net leverage to 2.25x to 2.5x Return capital to stockholders through competitive annual dividend Ongoing
annual CAPEX target of $900 million to $1 billionEqual proportion invested in growth and maintenance capitalStrong pipeline of attractive investment opportunities serving the highest growth markets Maintain net leverage of 2.25x to 2.5x and
maintain investment grade credit profilePay a competitive and growing dividend supplemented with opportunistic share repurchasesTargeted M&A opportunities focused on improving vertical integration
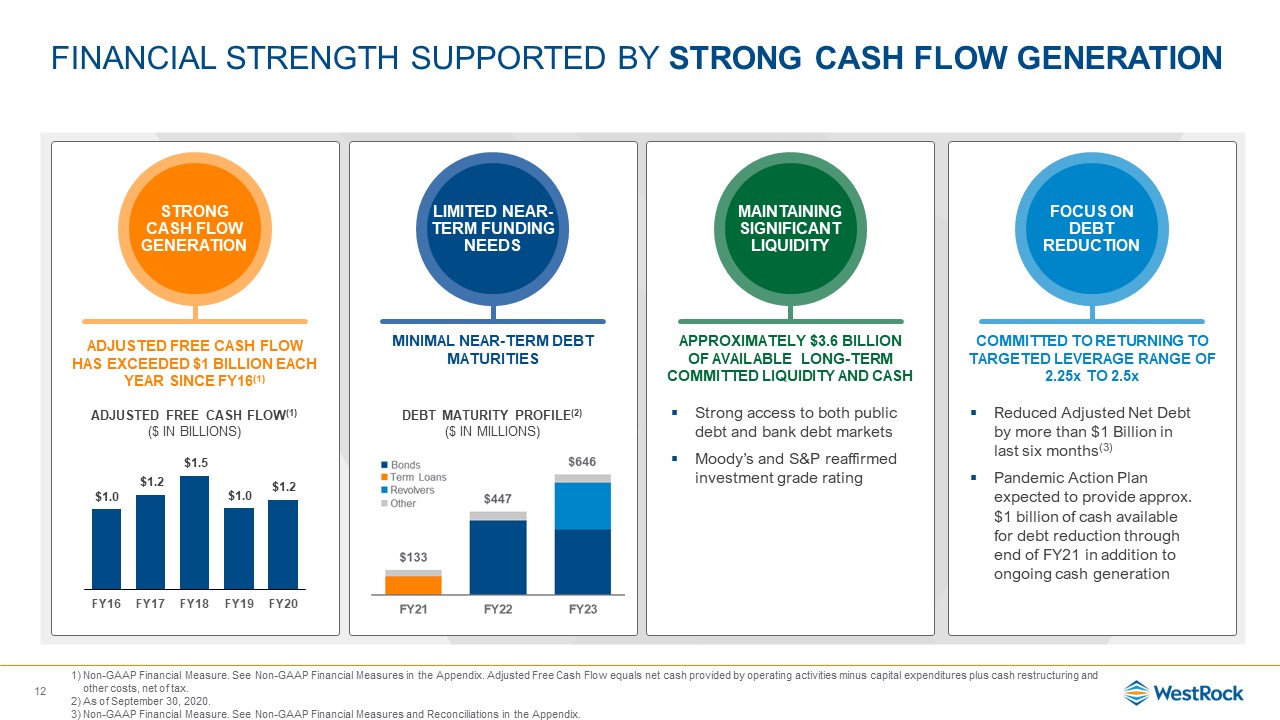
12 Adjusted Free Cash Flow Has Exceeded $1 billion each Year since FY16(1) Minimal
Near-term debt maturities Approximately $3.6 billionof Available Long-term Committed liquidity and Cash Committed to returning to targeted leverage range of 2.25x to 2.5x Financial Strength Supported by Strong Cash Flow
Generation Strong Cash Flow Generation Limited Near-Term Funding Needs Maintaining Significant Liquidity Focus on Debt Reduction Strong access to both public debt and bank debt marketsMoody’s and S&P reaffirmed
investment grade rating Reduced Adjusted Net Debt by more than $1 Billion in last six months(3)Pandemic Action Plan expected to provide approx. $1 billion of cash available for debt reduction through end of FY21 in addition to ongoing cash
generation Adjusted Free Cash Flow(1)($ in Billions) Debt Maturity Profile(2)($ in Millions) Non-GAAP Financial Measure. See Non-GAAP Financial Measures in the Appendix. Adjusted Free Cash Flow equals net cash provided by operating
activities minus capital expenditures plus cash restructuring and other costs, net of tax.As of September 30, 2020.Non-GAAP Financial Measure. See Non-GAAP Financial Measures and Reconciliations in the Appendix.
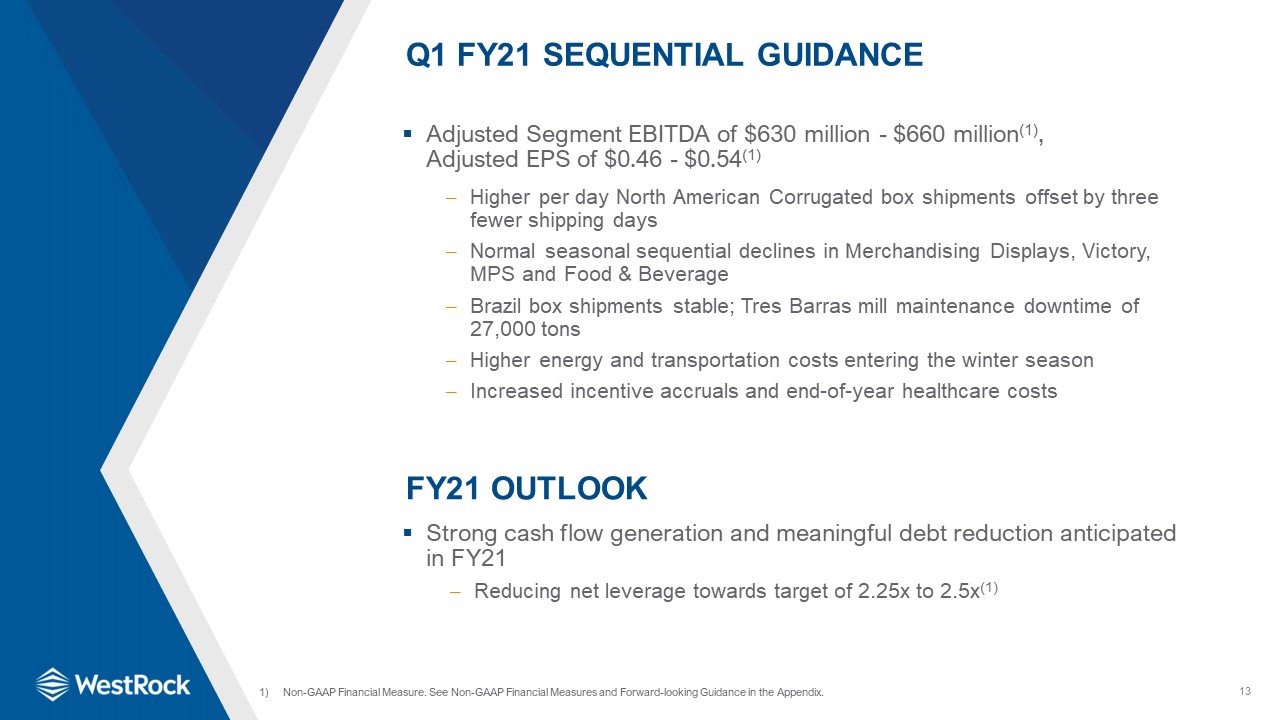
13 Q1 FY21 Sequential Guidance Higher per day North American Corrugated box shipments offset by three
fewer shipping daysNormal seasonal sequential declines in Merchandising Displays, Victory, MPS and Food & BeverageBrazil box shipments stable; Tres Barras mill maintenance downtime of 27,000 tonsHigher energy and transportation costs
entering the winter seasonIncreased incentive accruals and end-of-year healthcare costs Adjusted Segment EBITDA of $630 million - $660 million(1), Adjusted EPS of $0.46 - $0.54(1) Non-GAAP Financial Measure. See Non-GAAP Financial Measures
and Forward-looking Guidance in the Appendix. FY21 Outlook Strong cash flow generation and meaningful debt reduction anticipated in FY21Reducing net leverage towards target of 2.25x to 2.5x(1)
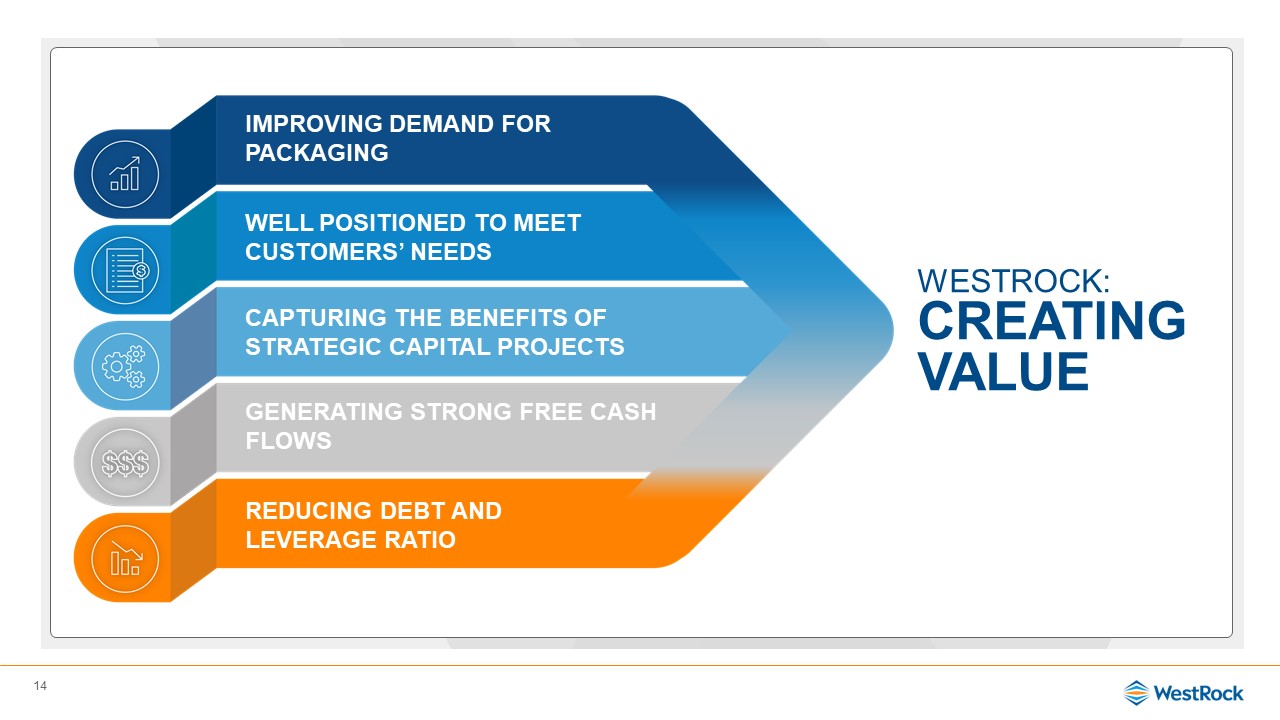
WestRock:Creating Value 14 Reducing Debt And Leverage ratio Generating Strong Free Cash
Flows Capturing the benefits of Strategic capital projects Well positioned to meet customers’ needs Improving Demand for packaging
15 Appendix
Non-GAAP Financial Measures Adjusted Earnings Per Diluted ShareWe use the non-GAAP financial measure
“adjusted earnings per diluted share,” also referred to as “adjusted earnings per share” or “Adjusted EPS”, because we believe this measure provides our board of directors, investors, potential investors, securities analysts and others with
useful information to evaluate our performance since it excludes restructuring and other costs, net, and other specific items that we believe are not indicative of our ongoing operating results. Our management and board of directors use this
information to evaluate our performance relative to other periods. We believe the most directly comparable GAAP measure is Earnings per diluted share.Adjusted Operating Cash Flow and Adjusted Free Cash FlowWe use the non-GAAP financial
measures “adjusted operating cash flow” and “adjusted free cash flow” because we believe these measures provide our board of directors, investors, potential investors, securities analysts and others with useful information to evaluate our
performance relative to other periods because they exclude restructuring and other costs, net of tax, that we believe are not indicative of our ongoing operating results. While these measures are similar to adjusted free cash flow, we believe
they provide greater comparability across periods when capital expenditures are changing since they exclude an adjustment for capital expenditures. We believe adjusted free cash flow is also a useful measure as it reflects our cash flow
inclusive of capital expenditures. We believe the most directly comparable GAAP measure is net cash provided by operating activities. Adjusted Segment EBITDA and Adjusted Segment EBITDA MarginsWe use the non-GAAP financial measures “adjusted
segment EBITDA” and “adjusted segment EBITDA margins”, along with other factors, to evaluate our segment performance against our peers. We believe that investors use these measures to evaluate our performance relative to our peers. We
calculate adjusted segment EBITDA for each segment by adding that segment’s adjusted segment income to its depreciation, depletion and amortization. We calculate adjusted segment EBITDA margin for each segment by dividing that segment’s
adjusted segment EBITDA by its adjusted segment sales. Leverage Ratio, Net Leverage Ratio, Total Funded Debt and Adjusted Total Funded DebtWe use the non-GAAP financial measures “leverage ratio” and “net leverage ratio” as measurements of our
operating performance and to compare to our publicly disclosed target leverage ratio. We believe investors use each measure to evaluate our available borrowing capacity – in the case of “net leverage ratio”, adjusted for cash and cash
equivalents. We define leverage ratio as our Total Funded Debt divided by our Credit Agreement EBITDA, each of which term is defined in our credit agreement, dated July 1, 2015. Borrowing capacity under our credit agreement depends on, in
addition to other measures, the Credit Agreement Debt/EBITDA ratio or the leverage ratio. As of September 30, 2020, our leverage ratio was 3.12 times. While the leverage ratio under our credit agreement determines the credit spread on our
debt, we are not subject to a leverage ratio cap. Our credit agreement is subject to a Debt to Capitalization and Consolidated Interest Coverage Ratio, as defined therein. We define “Adjusted Total Funded Debt” as our Total Funded Debt less
cash and cash equivalents. Net Leverage Ratio is the product of Adjusted Total Funded Debt divided by our Credit Agreement EBITDA. As of September 30, 2020, our net leverage ratio was 3.03 times. Forward-looking GuidanceWe are not providing a
reconciliation of forward-looking non-GAAP financial measures to the most directly comparable U.S. GAAP measure because we are unable to predict with reasonable certainty the ultimate outcome of certain significant items without unreasonable
effort. These items include, but are not limited to, merger and acquisition-related expenses, restructuring expenses, asset impairments, litigation settlements, changes to contingent consideration and certain other gains or losses. These
items are uncertain, depend on various factors, and could have a material impact on U.S. GAAP reported results for the guidance period 16
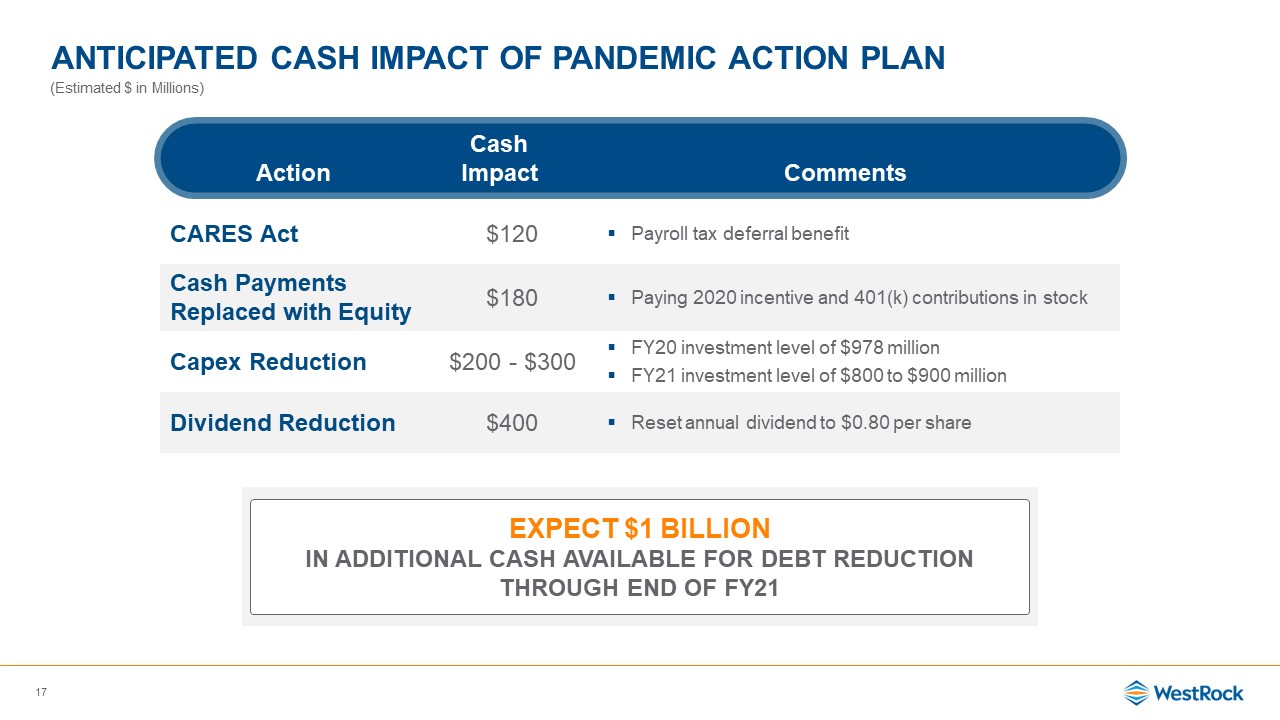
Anticipated Cash Impact of pandemic Action plan 17 CARES Act $120 Payroll tax deferral
benefit Cash Payments Replaced with Equity $180 Paying 2020 incentive and 401(k) contributions in stock Capex Reduction $200 - $300 FY20 investment level of $978 millionFY21 investment level of $800 to $900 million Dividend
Reduction $400 Reset annual dividend to $0.80 per share Action CashImpact Comments Expect $1 billionin additional cash available for debt reduction through end of FY21 (Estimated $ in Millions)
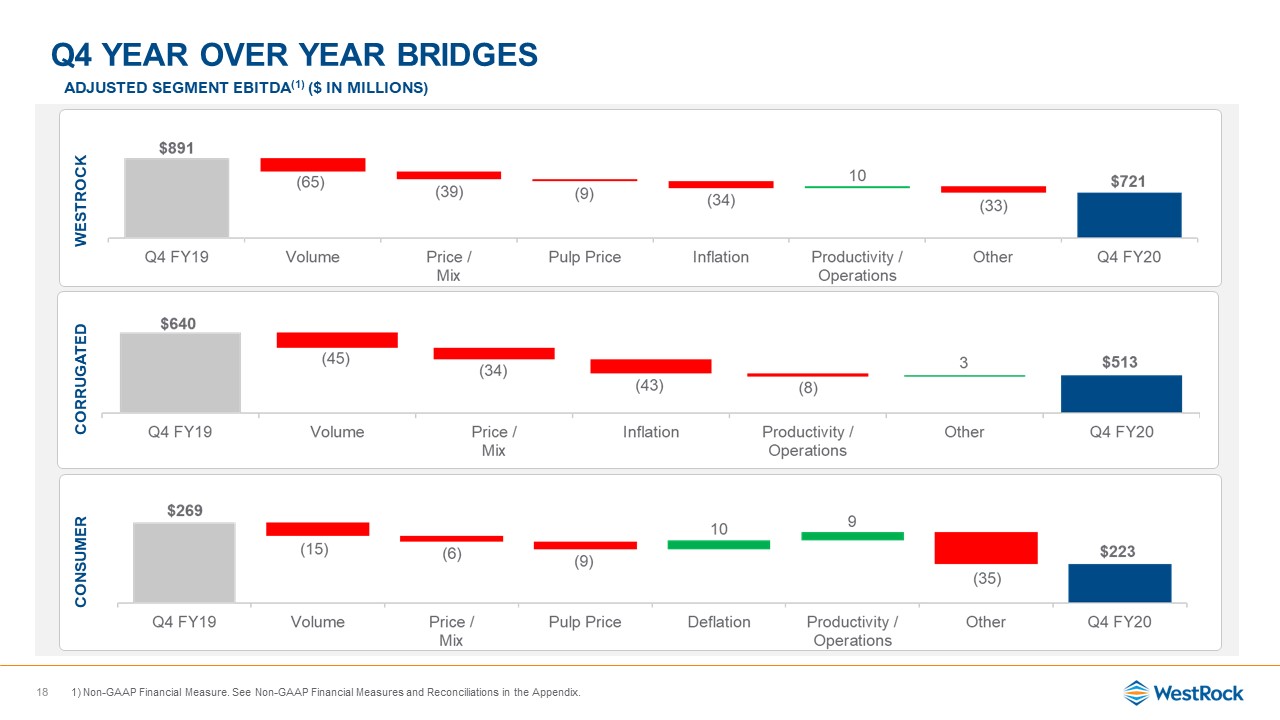
Q4 Year OVER YEAR BRIDGES 18 Adjusted Segment EBITDA(1) ($ in
millions) WESTROCK CORRUGATED CONSUMER Non-GAAP Financial Measure. See Non-GAAP Financial Measures and Reconciliations in the Appendix.
Westrock Serves Diverse End Market segments 19 N.A. Corrugated Packaging Consumer
Packaging Segment 2) Represents WestRock trailing twelve-month Q4 FY20 sales of converted shipments and paperboard shipped to end markets.
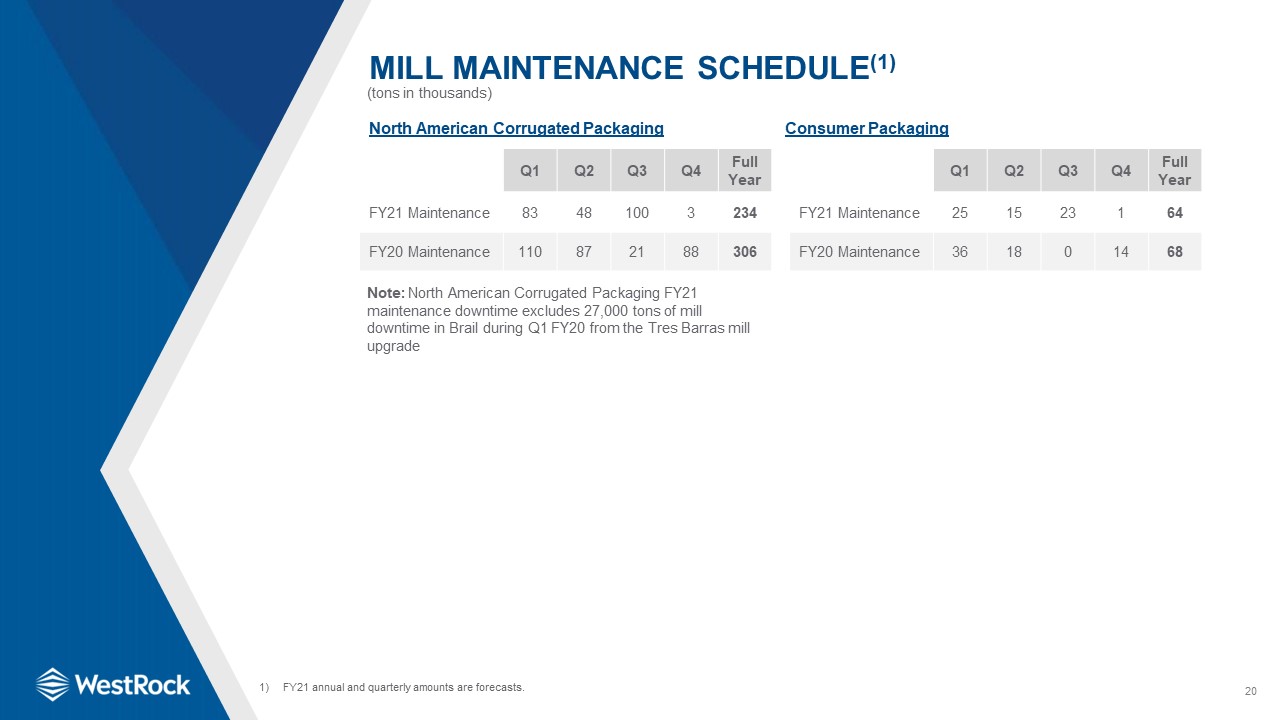
20 Mill Maintenance Schedule(1) (tons in thousands) Q1 Q2 Q3 Q4 Full Year FY21
Maintenance 83 48 100 3 234 FY20 Maintenance 110 87 21 88 306 North American Corrugated Packaging Q1 Q2 Q3 Q4 Full Year FY21 Maintenance 25 15 23 1 64 FY20 Maintenance 36 18 0 14 68 Consumer Packaging FY21
annual and quarterly amounts are forecasts. Note: North American Corrugated Packaging FY21 maintenance downtime excludes 27,000 tons of mill downtime in Brail during Q1 FY20 from the Tres Barras mill upgrade
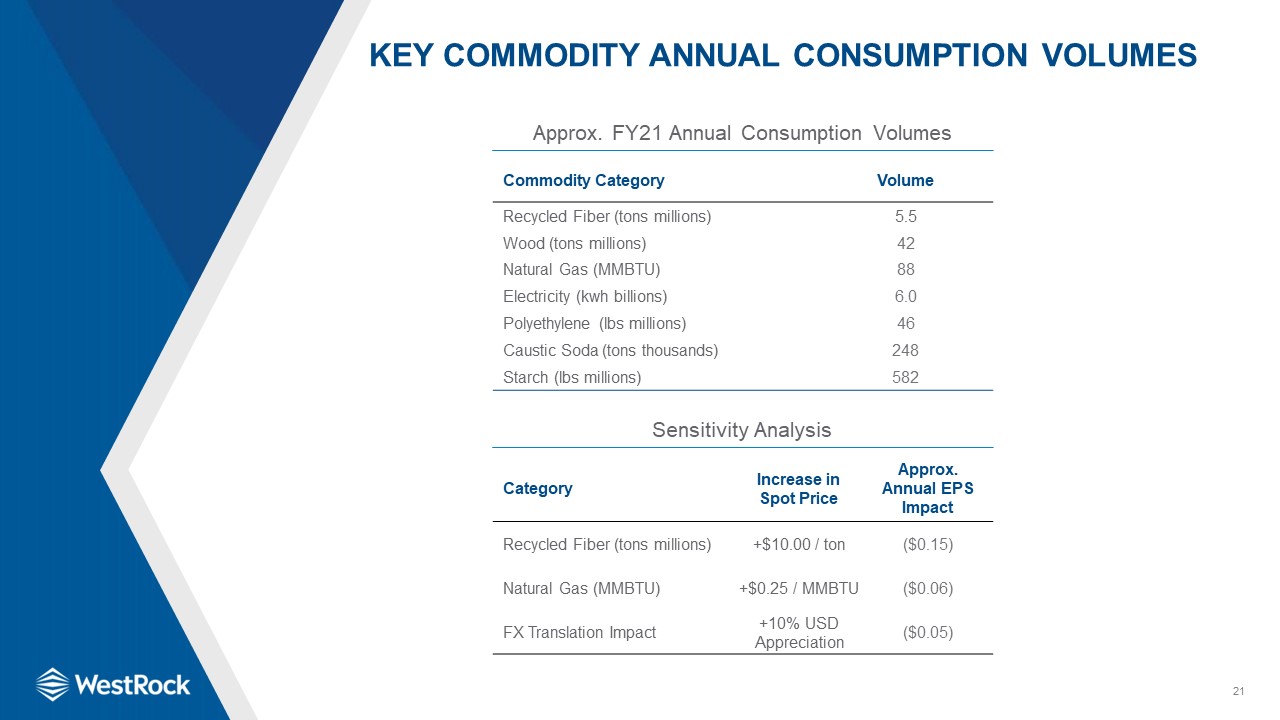
21 Key Commodity Annual Consumption Volumes Commodity Category Volume Recycled Fiber (tons
millions) 5.5 Wood (tons millions) 42 Natural Gas (MMBTU) 88 Electricity (kwh billions) 6.0 Polyethylene (lbs millions) 46 Caustic Soda (tons thousands) 248 Starch (lbs millions) 582 Approx. FY21 Annual Consumption
Volumes Sensitivity Analysis Category Increase in Spot Price Approx. Annual EPS Impact Recycled Fiber (tons millions) +$10.00 / ton ($0.15) Natural Gas (MMBTU) +$0.25 / MMBTU ($0.06) FX Translation Impact +10% USD
Appreciation ($0.05)
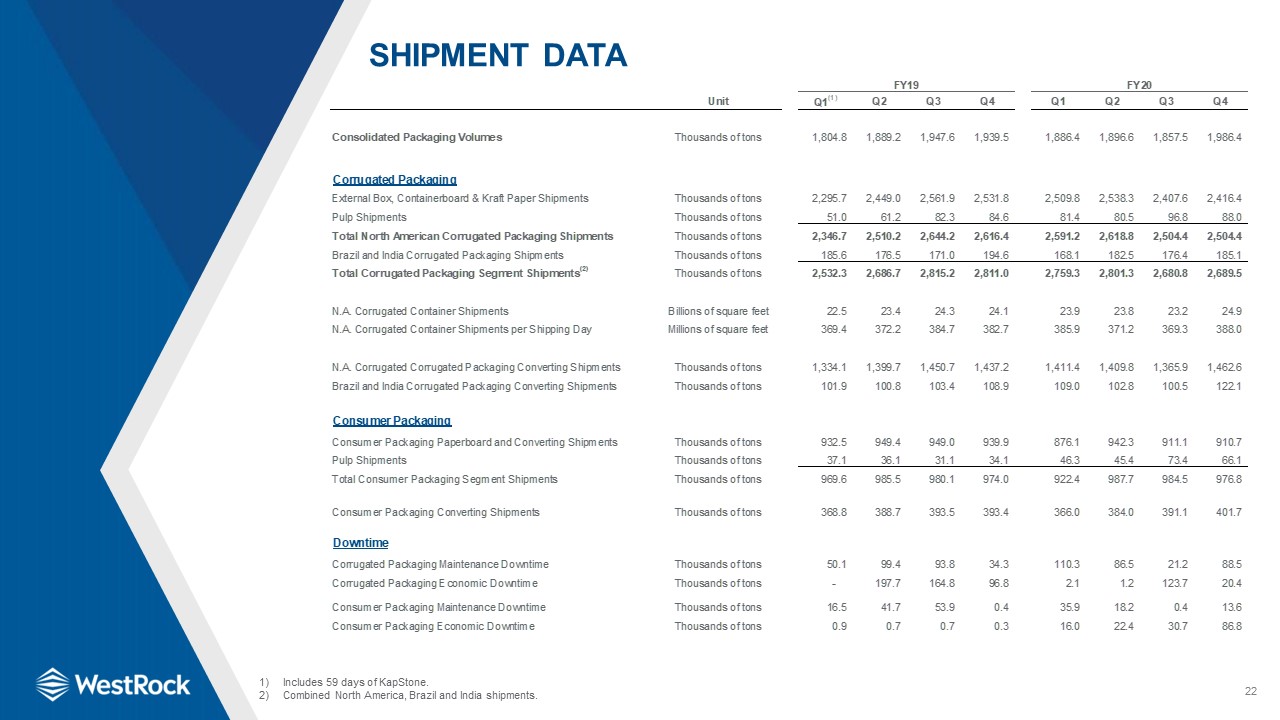
22 Shipment Data Includes 59 days of KapStone.Combined North America, Brazil and India shipments.
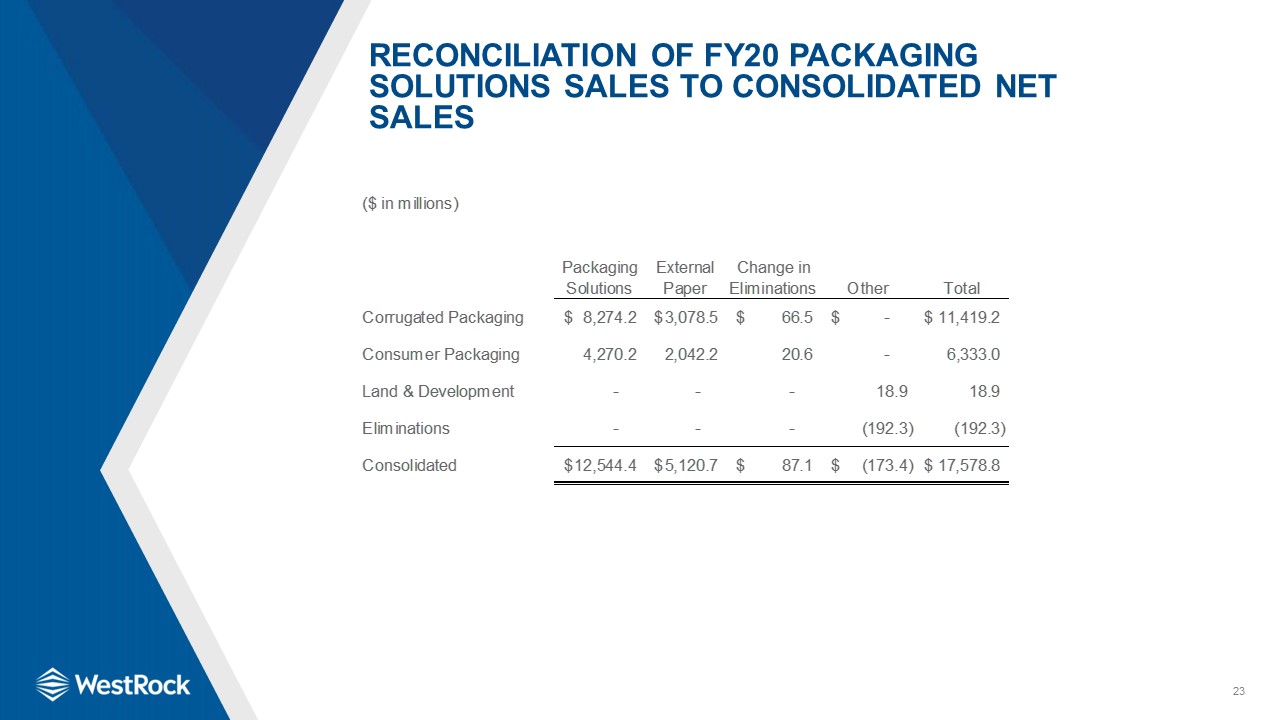
23 Reconciliation of FY20 Packaging Solutions Sales to Consolidated Net Sales
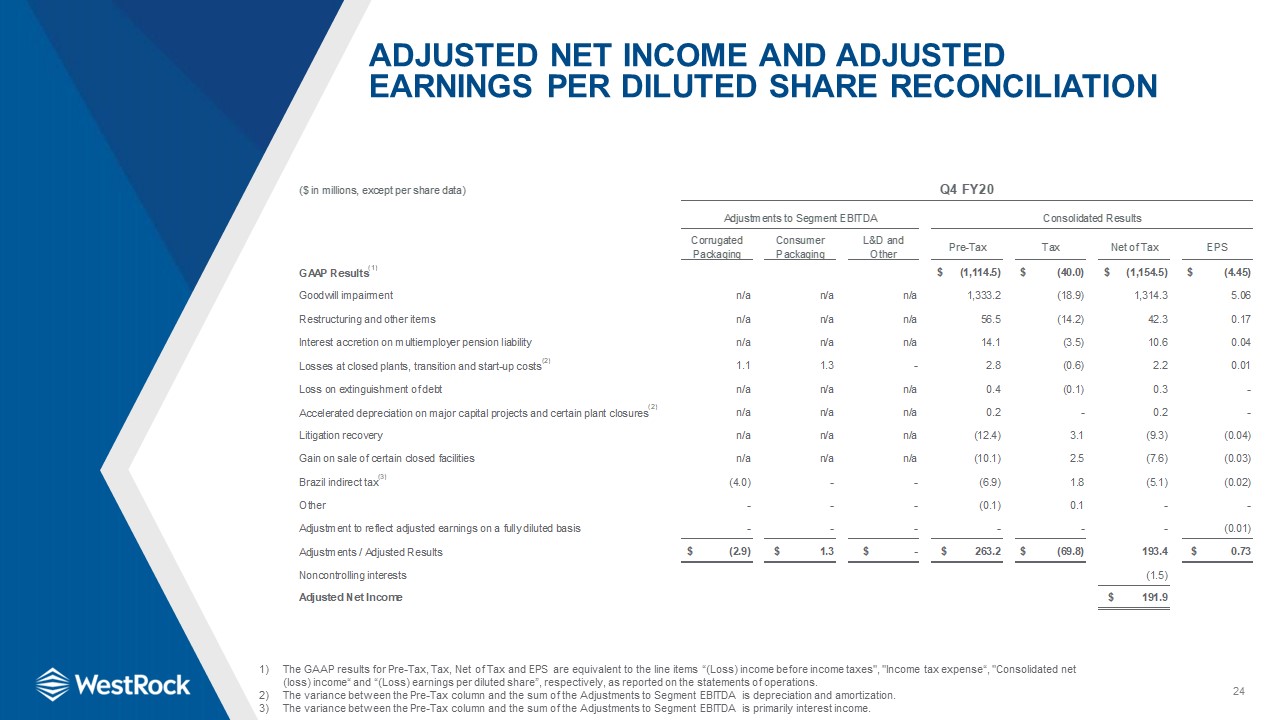
24 Adjusted Net Income and Adjusted Earnings Per Diluted Share Reconciliation The GAAP results for
Pre-Tax, Tax, Net of Tax and EPS are equivalent to the line items “(Loss) income before income taxes", "Income tax expense“, "Consolidated net (loss) income“ and “(Loss) earnings per diluted share”, respectively, as reported on the statements
of operations.The variance between the Pre-Tax column and the sum of the Adjustments to Segment EBITDA is depreciation and amortization.The variance between the Pre-Tax column and the sum of the Adjustments to Segment EBITDA is primarily
interest income.
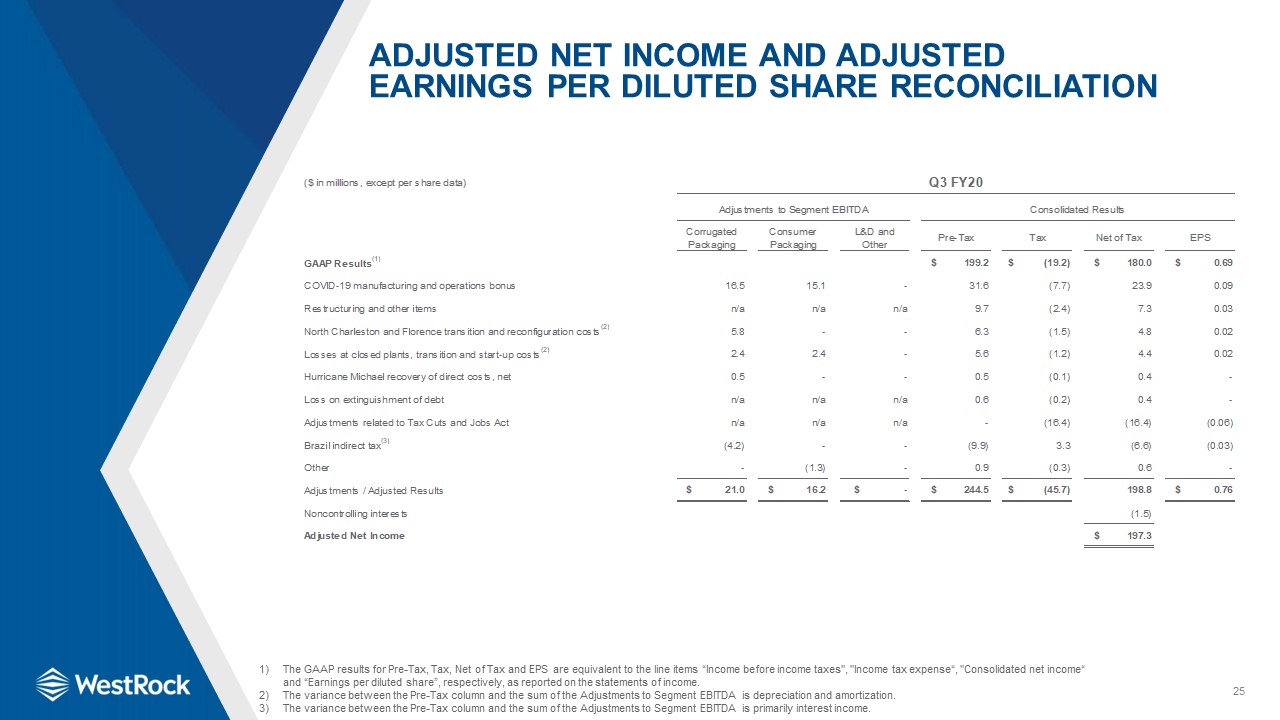
25 Adjusted Net Income and Adjusted Earnings Per Diluted Share Reconciliation The GAAP results for
Pre-Tax, Tax, Net of Tax and EPS are equivalent to the line items “Income before income taxes", "Income tax expense“, "Consolidated net income“ and “Earnings per diluted share”, respectively, as reported on the statements of income.The
variance between the Pre-Tax column and the sum of the Adjustments to Segment EBITDA is depreciation and amortization.The variance between the Pre-Tax column and the sum of the Adjustments to Segment EBITDA is primarily interest income.
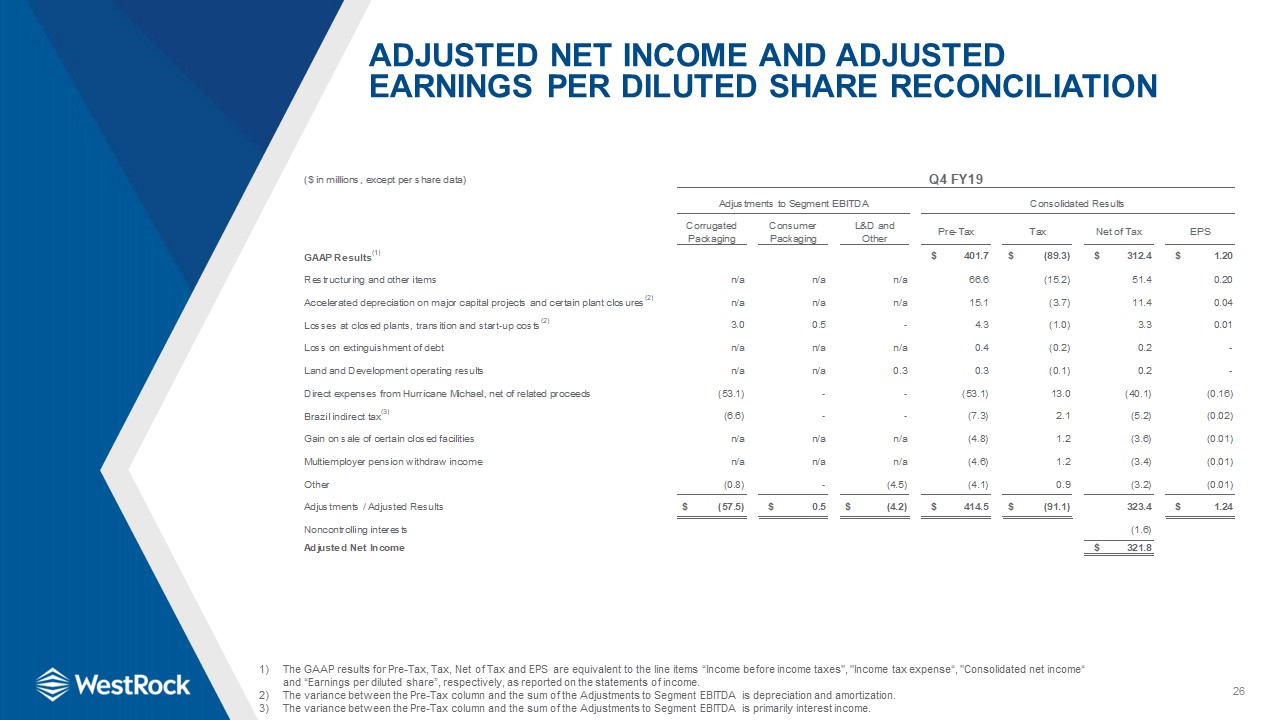
26 Adjusted Net Income and Adjusted Earnings Per Diluted Share Reconciliation The GAAP results for
Pre-Tax, Tax, Net of Tax and EPS are equivalent to the line items “Income before income taxes", "Income tax expense“, "Consolidated net income“ and “Earnings per diluted share”, respectively, as reported on the statements of income.The
variance between the Pre-Tax column and the sum of the Adjustments to Segment EBITDA is depreciation and amortization.The variance between the Pre-Tax column and the sum of the Adjustments to Segment EBITDA is primarily interest income.
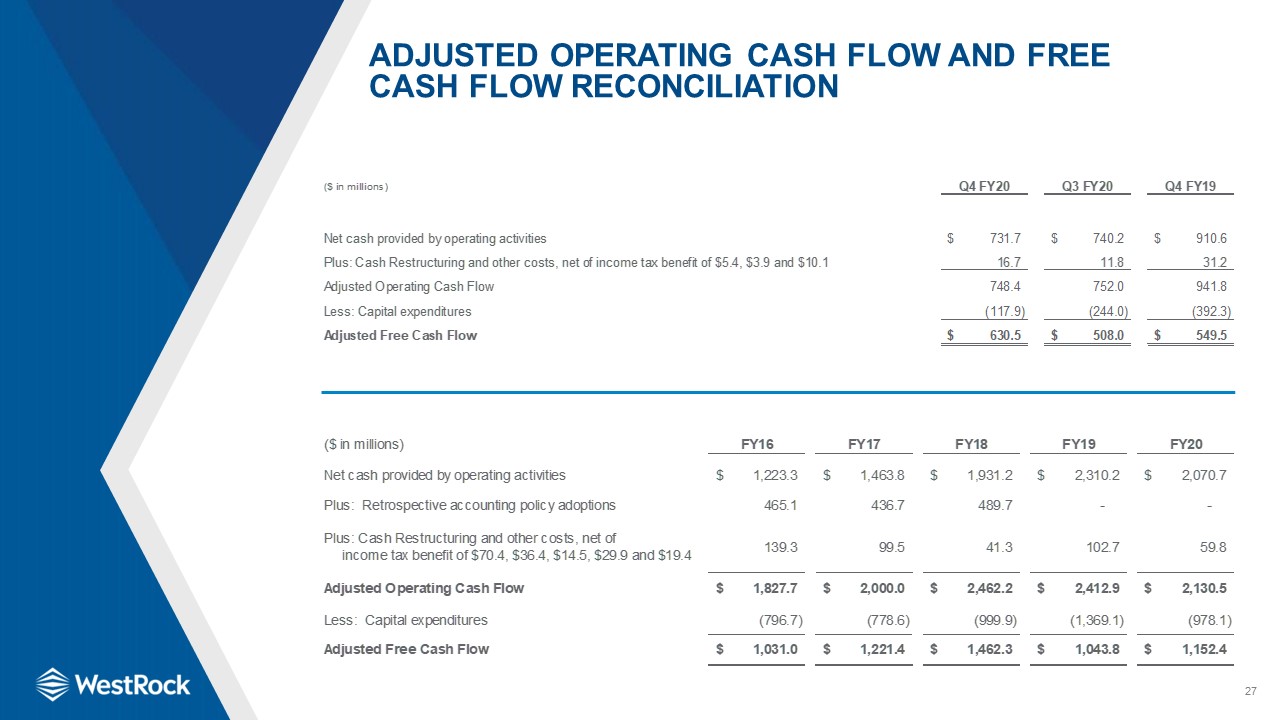
27 Adjusted Operating Cash Flow and Free Cash Flow Reconciliation
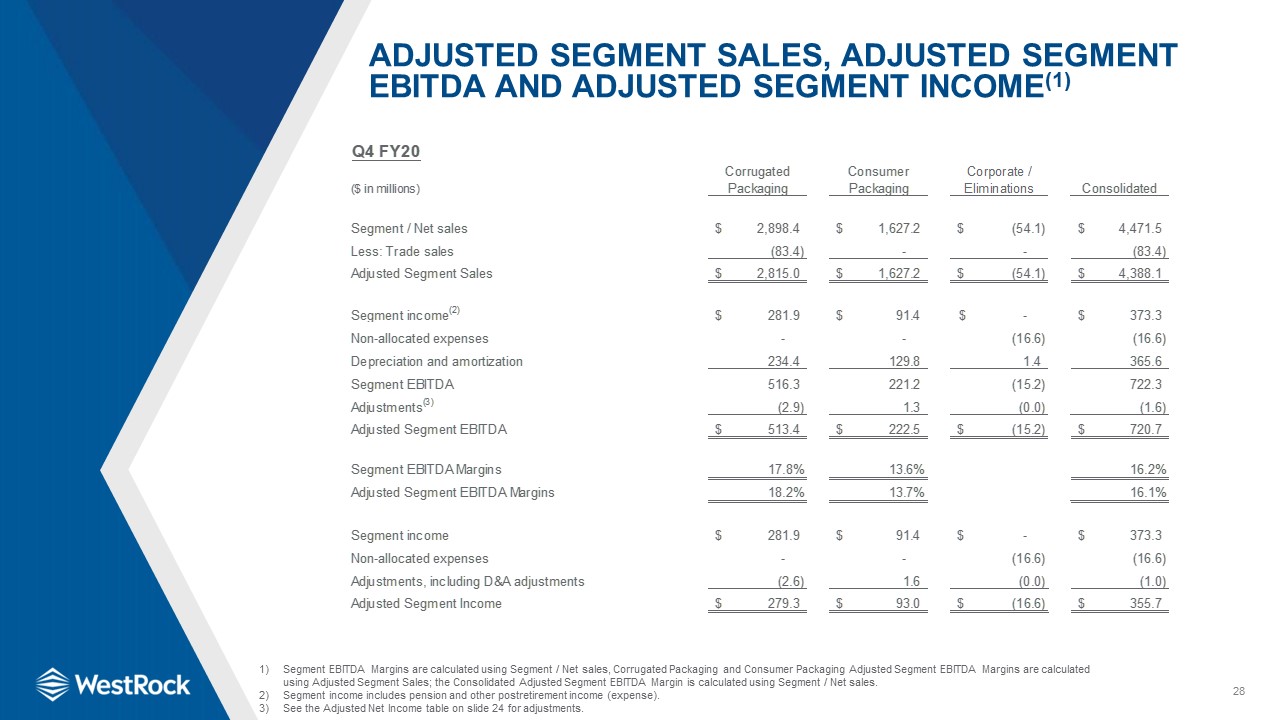
28 Adjusted Segment Sales, Adjusted Segment EBITDA and Adjusted Segment Income(1) Segment EBITDA
Margins are calculated using Segment / Net sales, Corrugated Packaging and Consumer Packaging Adjusted Segment EBITDA Margins are calculated using Adjusted Segment Sales; the Consolidated Adjusted Segment EBITDA Margin is calculated using
Segment / Net sales.Segment income includes pension and other postretirement income (expense).See the Adjusted Net Income table on slide 24 for adjustments.

29 Corrugated Packaging Adjusted Segment EBITDA(1) Segment EBITDA Margins are calculated using
Segment sales and Adjusted Segment EBITDA Margins are calculated using Adjusted Segment Sales.The “Other” column includes our Victory Packaging and India corrugated operations.Segment income includes pension and other postretirement income
(expense).See the Adjusted Net income table on slide 24 for adjustments.
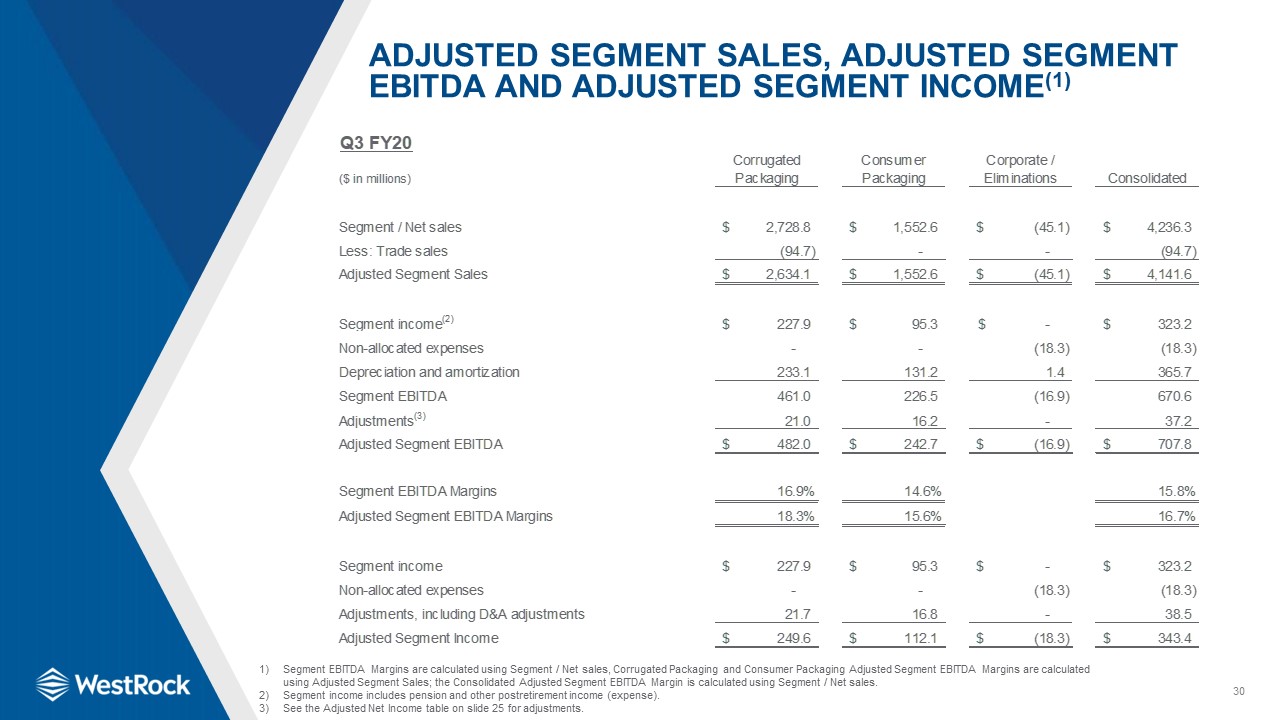
30 Adjusted Segment Sales, Adjusted Segment EBITDA and Adjusted Segment Income(1) Segment EBITDA
Margins are calculated using Segment / Net sales, Corrugated Packaging and Consumer Packaging Adjusted Segment EBITDA Margins are calculated using Adjusted Segment Sales; the Consolidated Adjusted Segment EBITDA Margin is calculated using
Segment / Net sales.Segment income includes pension and other postretirement income (expense).See the Adjusted Net Income table on slide 25 for adjustments.
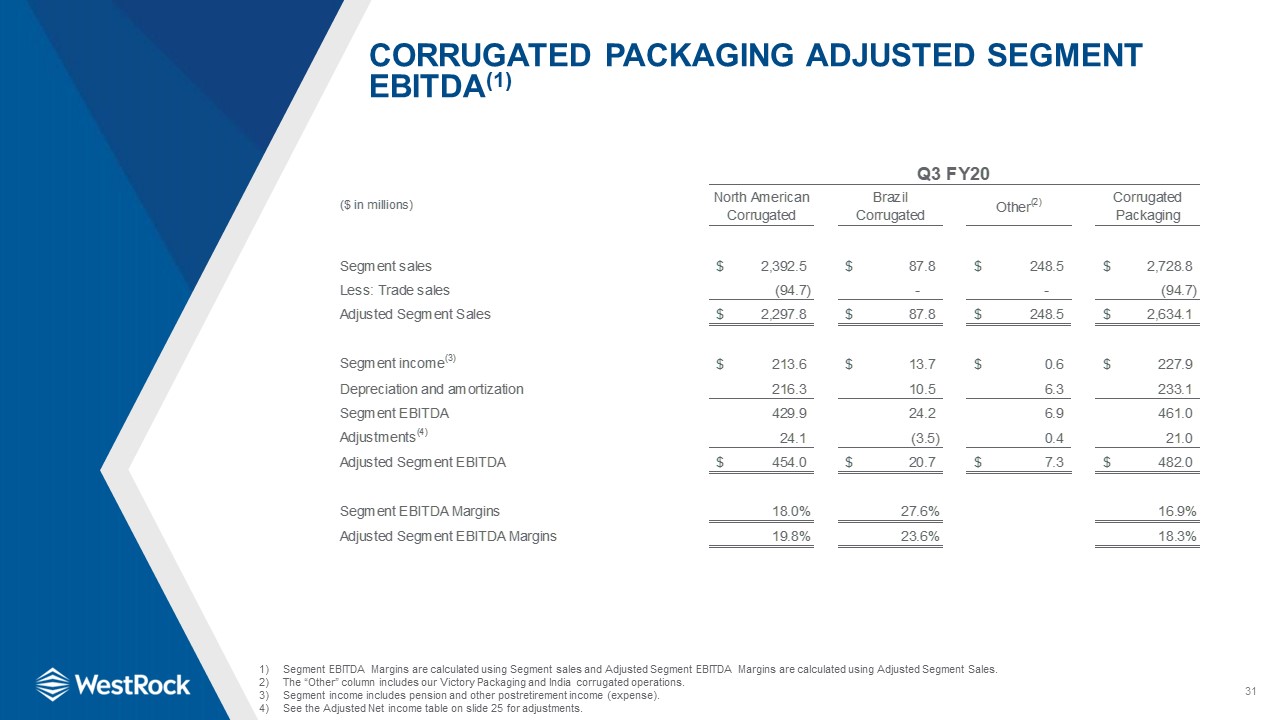
31 Corrugated Packaging Adjusted Segment EBITDA(1) Segment EBITDA Margins are calculated using
Segment sales and Adjusted Segment EBITDA Margins are calculated using Adjusted Segment Sales.The “Other” column includes our Victory Packaging and India corrugated operations.Segment income includes pension and other postretirement income
(expense).See the Adjusted Net income table on slide 25 for adjustments.
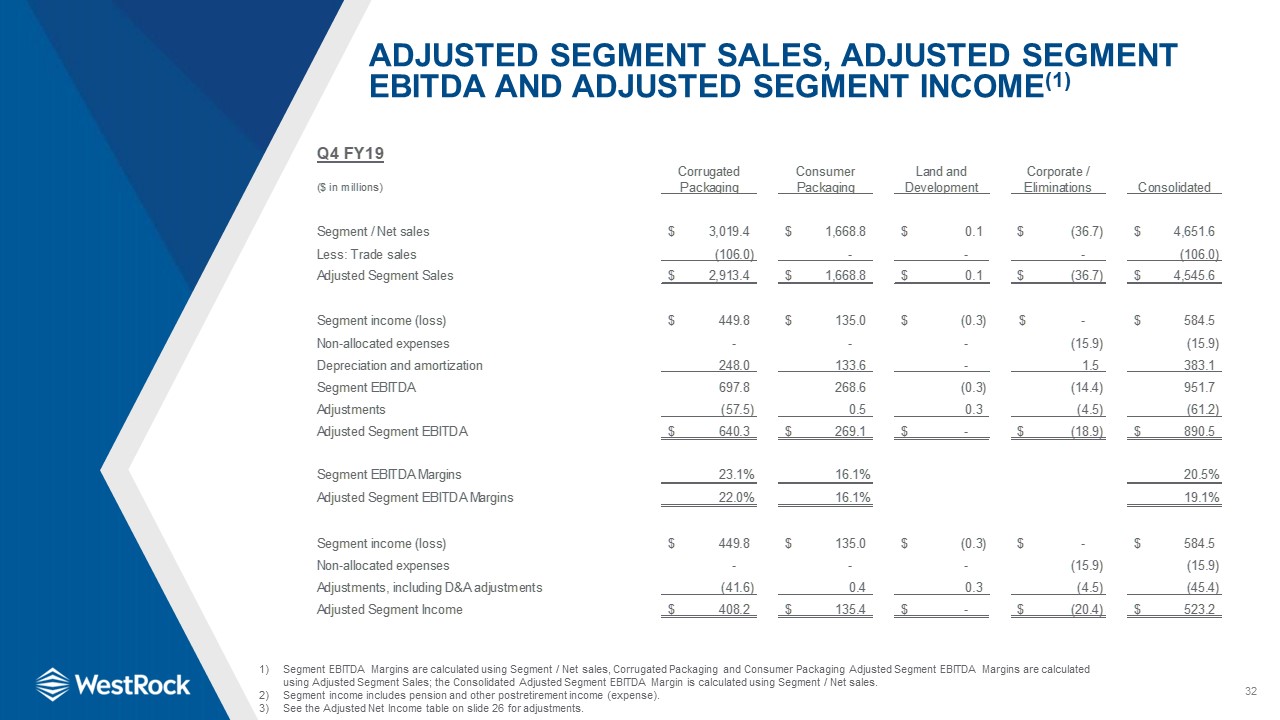
32 Adjusted Segment Sales, Adjusted Segment EBITDA and Adjusted Segment Income(1) Segment EBITDA
Margins are calculated using Segment / Net sales, Corrugated Packaging and Consumer Packaging Adjusted Segment EBITDA Margins are calculated using Adjusted Segment Sales; the Consolidated Adjusted Segment EBITDA Margin is calculated using
Segment / Net sales. Segment income includes pension and other postretirement income (expense).See the Adjusted Net Income table on slide 26 for adjustments.

33 Corrugated Packaging Adjusted Segment EBITDA(1) Segment EBITDA Margins are calculated using
Segment sales and Adjusted Segment EBITDA Margins are calculated using Adjusted Segment Sales.The “Other” column includes our Victory Packaging and India corrugated operations.Segment income includes pension and other postretirement income
(expense).See the Adjusted Net Income table on slide 26 for adjustments.
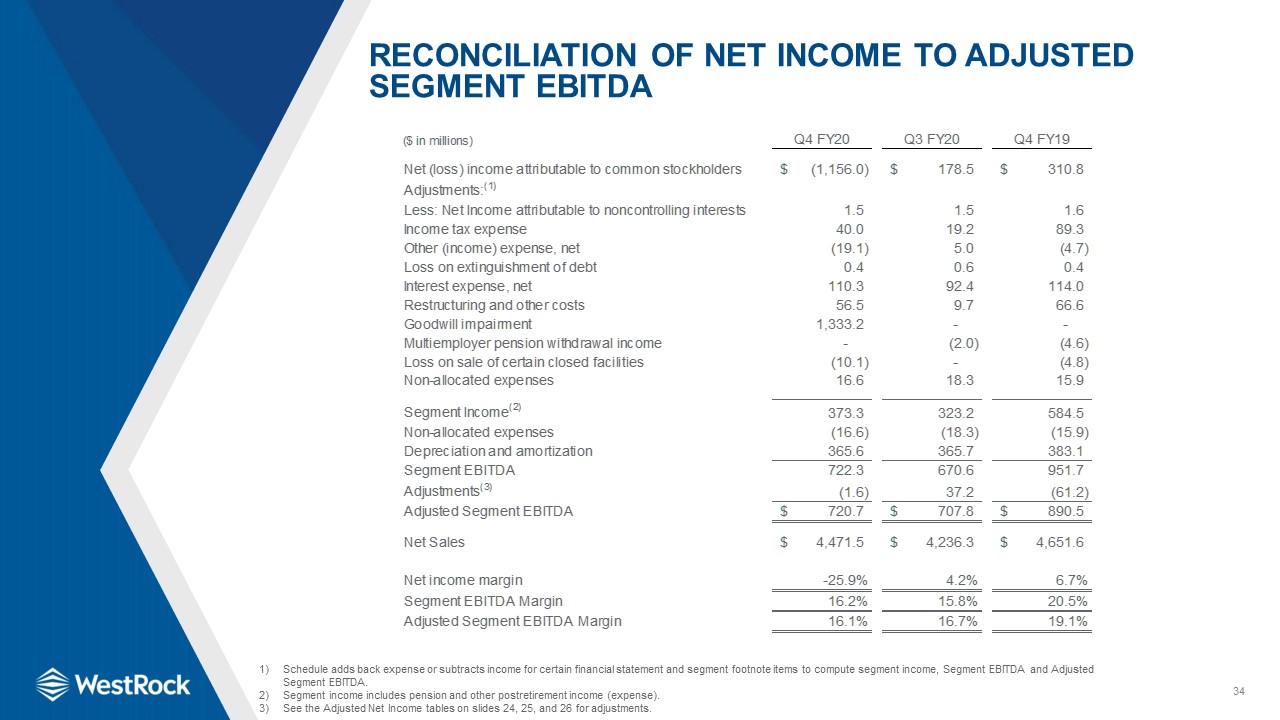
34 Reconciliation of Net Income to Adjusted Segment EBITDA Schedule adds back expense or subtracts
income for certain financial statement and segment footnote items to compute segment income, Segment EBITDA and Adjusted Segment EBITDA.Segment income includes pension and other postretirement income (expense).See the Adjusted Net Income
tables on slides 24, 25, and 26 for adjustments.
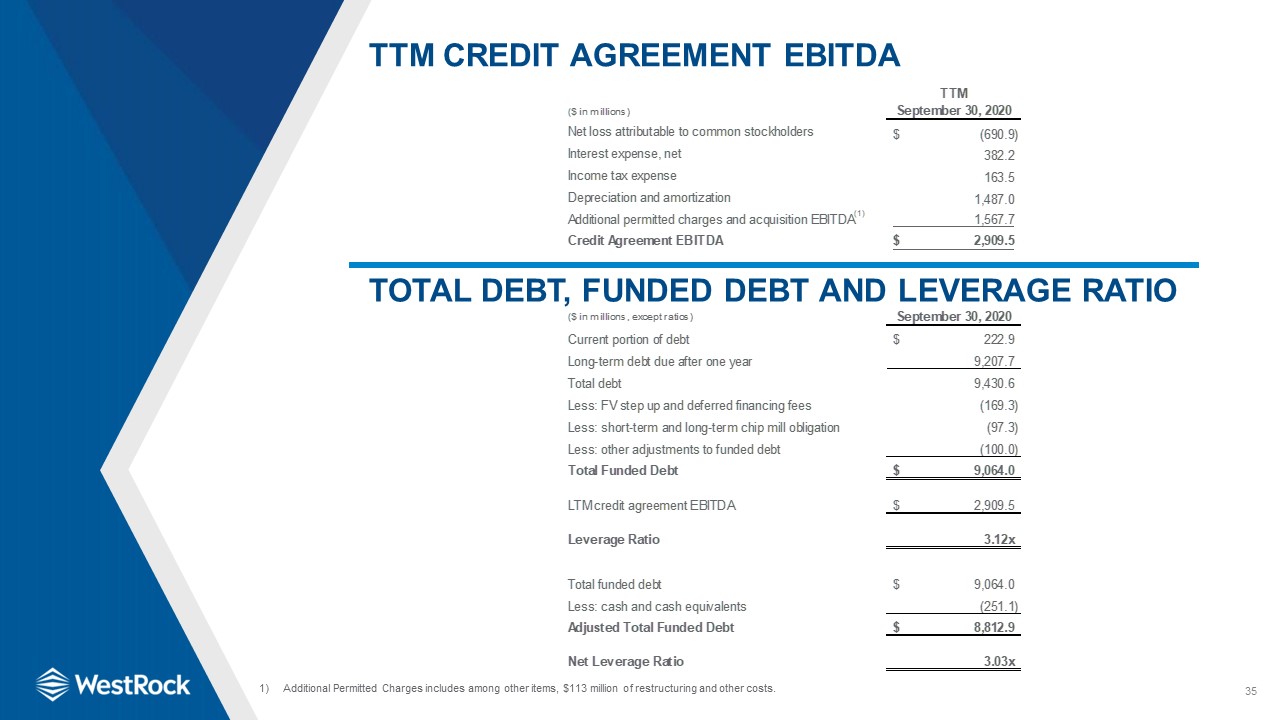
35 TTM Credit Agreement EBITDA Total Debt, Funded Debt and Leverage Ratio Additional Permitted
Charges includes among other items, $113 million of restructuring and other costs.
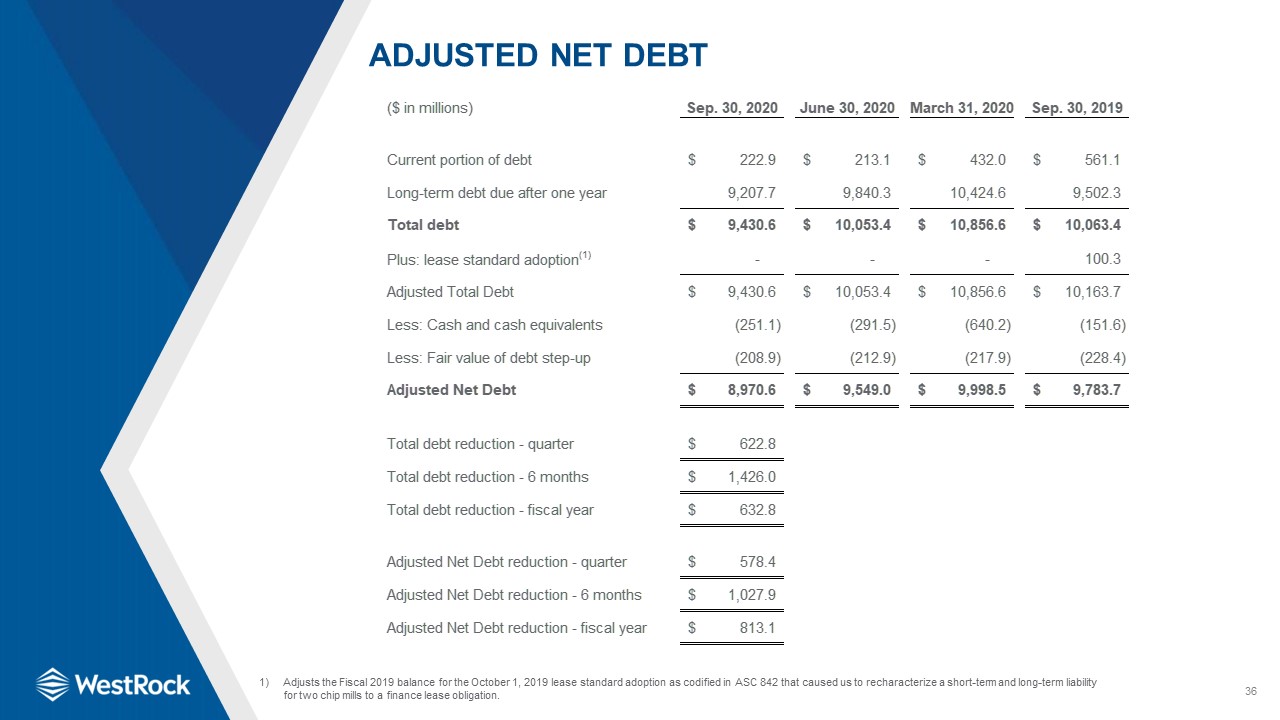
36 Adjusted Net Debt Adjusts the Fiscal 2019 balance for the October 1, 2019 lease standard adoption
as codified in ASC 842 that caused us to recharacterize a short-term and long-term liability for two chip mills to a finance lease obligation.