Attached files
| file | filename |
|---|---|
| EX-99.1 - EX-99.1 - Utz Brands, Inc. | pressrelease-2020q3ear.htm |
| 8-K - 8-K - Utz Brands, Inc. | utz-20201105.htm |
℠ Utz Brands, Inc. Q3 2020 Earnings Presentation November 5, 2020 HIGHLY CONFIDENTIAL 1
Disclaimer Forward-Looking Statements Certain statements made herein are not historical facts but are forward-looking statements for purposes of the safe harbor provisions under The Private Securities Litigation Reform Act of 1995, as amended. Forward-looking statements generally are accompanied by or include words such as “will”, “expect”, “intends”, “goal” or other similar words, phrases or expressions. These forward-looking statements include the expected effects from the COVID-19 outbreak, future plans for Utz Brands, Inc. (the “Company”), the estimated or anticipated future results and benefits of the Company’s future plans and operations, future capital structure, future opportunities for the Company, and other statements that are not historical facts. These statements are based on the current expectations of the Company’s management and are not predictions of actual performance. These statements are subject to a number of risks and uncertainties and the Company’s business and actual results may differ materially. These risks and uncertainties include, but are not limited to the effect of the COVID-19 outbreak on the Company's business, suppliers (including its contract manufacturing and logistics suppliers), customers, consumers and employees along with disruptions or inefficiencies in the supply chain resulting from any effects of the COVID-19 outbreak; achieving the anticipated benefits of the business combination with Collier Creek Holdings (“CCH”); changes in the business environment in which the Company operates including general financial, economic, capital market, regulatory and political conditions affecting the Company and the industry in which the Company operates; changes in consumer preferences and purchasing habits; the Company’s ability to maintain adequate product inventory levels to timely supply customer orders; changes in taxes, tariffs, duties, governmental laws and regulations; the availability of or competition for other brands, assets or other opportunities for investment by the Company or to expand the Company’s business; competitive product and pricing activity; difficulties of managing growth profitably; the loss of one or more members of the Company’s management team; and other risk factors described from time to time in the Company’s Form 10-K, Form 10-Q, and Form 8-K reports (including all amendments to those reports) filed with the U.S. Securities and Exchange Commission from time to time. In addition, forward-looking statements provide the Company’s expectations, plans or forecasts of future events and views as of the date of this communication. Except as required by law, the Company undertakes no obligation to update such statements to reflect events or circumstances arising after such date, and cautions investors not to place undue reliance on any such forward-looking statements. These forward-looking statements should not be relied upon as representing the Company’s assessments as of any date subsequent to the date of this communication. Non-GAAP Financial Measures This presentation includes certain financial measures not presented in accordance with U.S. generally accepted accounting principles (“GAAP”) including, but not limited to, Pro Forma Net Sales, Adjusted Gross Profit, Pro Forma Adjusted Gross Profit, Adjusted SG&A, EBITDA, Adjusted EBITDA, Further Adjusted EBITDA, Normalized Further Adjusted EBITDA, Adjusted Net Income and certain ratios and other metrics derived there from. These non-GAAP financial measures are not measures of financial performance in accordance with GAAP and may exclude items that are significant in understanding and assessing financial results. Therefore, these measures should not be considered in isolation or as an alternative to net income, cash flows from operations or other measures of profitability, liquidity or performance under GAAP. You should be aware that the presentation of these measures may not be comparable to similarly-titled measures used by other companies. Reconciliations and definitions of these non-GAAP measures to the most directly comparable GAAP measures are set forth in the appendix to this presentation. We believe (i) these non-GAAP measures of financial results provide useful information to management and investors regarding certain financial and business trends relating to the financial condition and results of operations of the Company to date; and (ii) that the use of these non-GAAP financial measures provides an additional tool for investors to use in evaluating ongoing operating results and trends in and in comparing financial measures with other similar companies, many of which present similar non-GAAP financial measures to investors. These non-GAAP financial measures are subject to inherent limitations as they reflect the exercise of judgments by management about which expense and income are excluded or included in determining these non-GAAP financial measures. 2 ℠
Key Messages . Combination of Utz and Collier Creek Successfully Consummated . Very Strong Q3 Financial Results . Q3 In-Market Performance Significantly Outpaced Salty Snack Category . Executing Well Against Our Value Creation Strategies . Ensuring Safety of Our Associates and Resiliency of Our Supply Chain . Raising Outlook for 2020 3 ℠
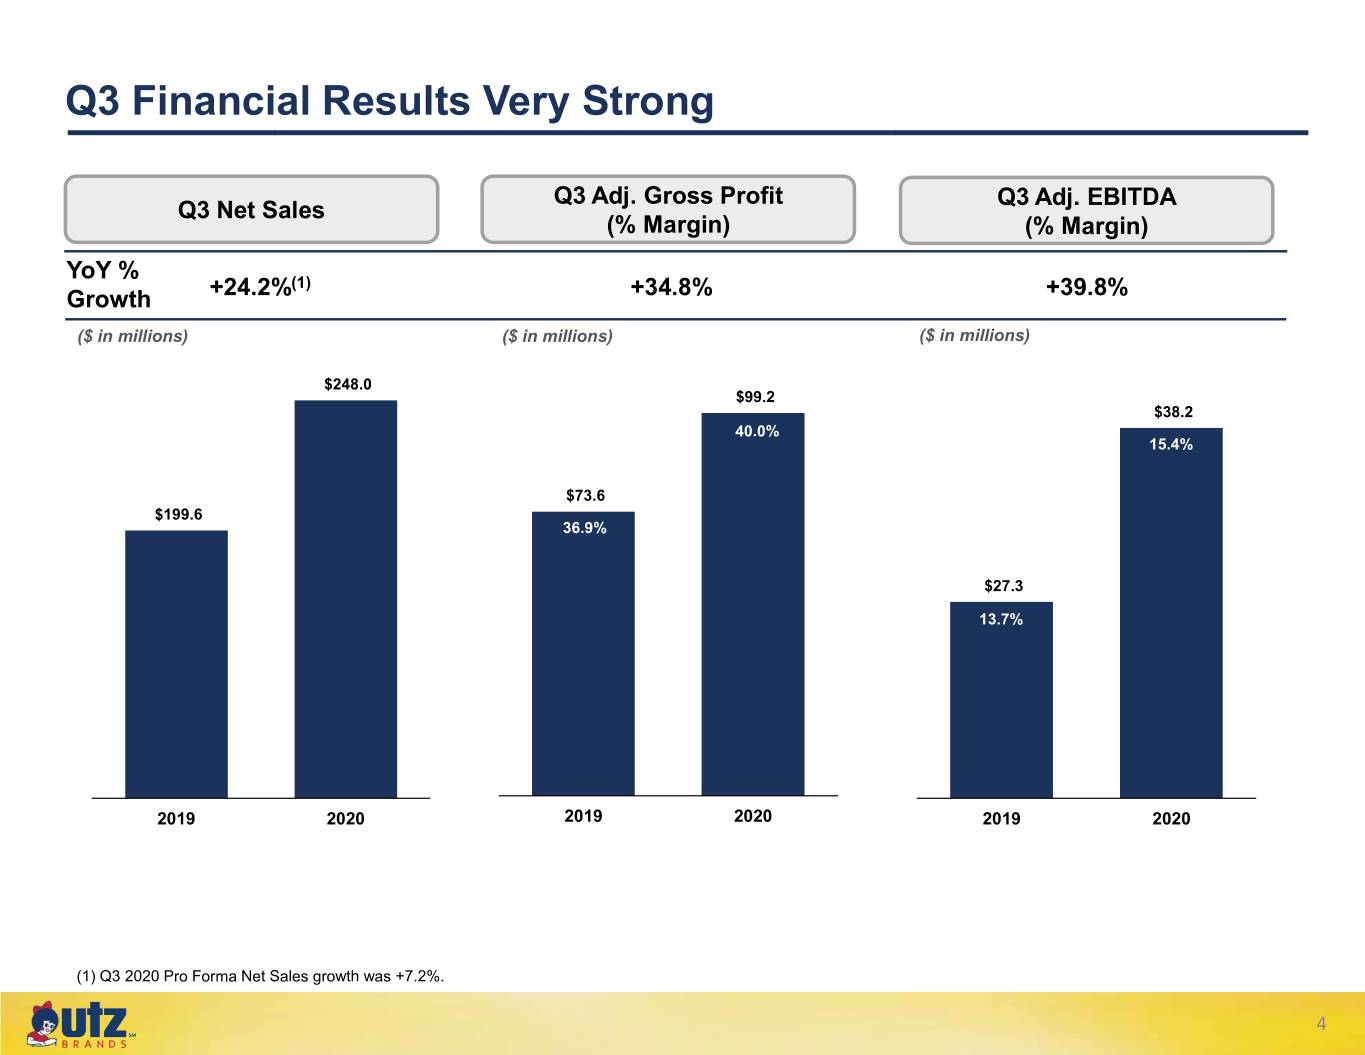
Q3 Financial Results Very Strong Q3 Adj. Gross Profit Q3 Adj. EBITDA Q3 Net Sales (% Margin) (% Margin) YoY % +24.2%(1) +34.8% +39.8% Growth ($ in millions) ($ in millions) ($ in millions) $248.0 $99.2 $38.2 40.0% 15.4% $73.6 $199.6 36.9% $27.3 13.7% 2019 2020 2019 2020 2019 2020 (1) Q3 2020 Pro Forma Net Sales growth was +7.2%. 4 ℠
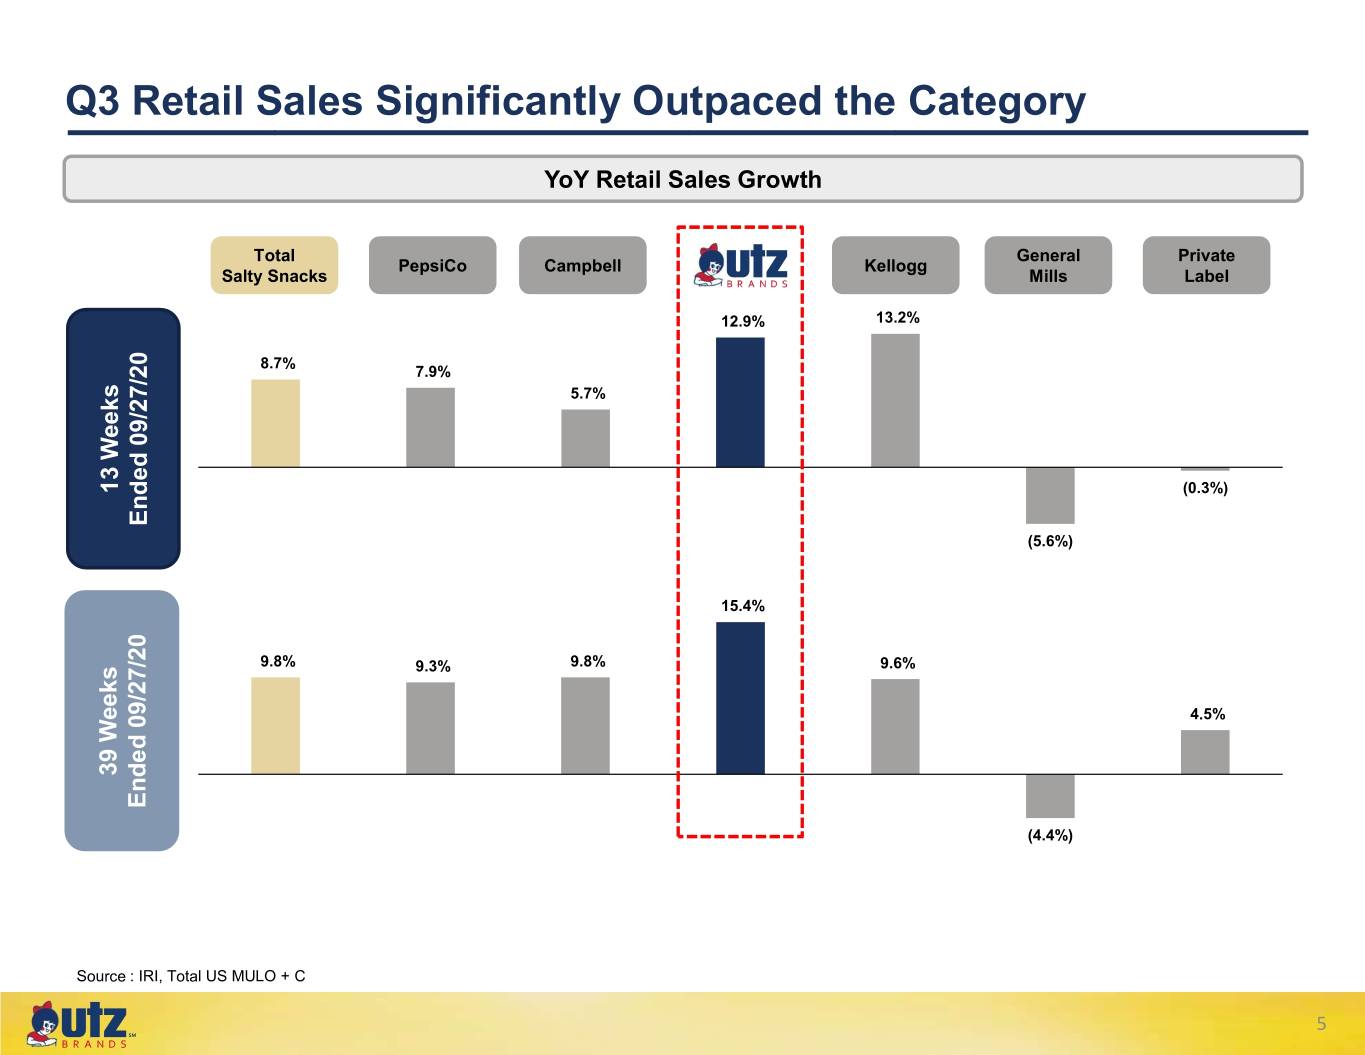
Q3 Retail Sales Significantly Outpaced the Category YoY Retail Sales Growth Total General Private PepsiCo Campbell Kellogg Salty Snacks Mills Label 12.9% 13.2% 8.7% 7.9% 5.7% 13 Weeks Weeks 13 (0.3%) Ended 09/27/20 Ended (5.6%) 15.4% 9.8% 9.3% 9.8% 9.6% 4.5% 39 Weeks Weeks 39 Ended 09/27/20 Ended (4.4%) Source : IRI, Total US MULO + C 5 ℠
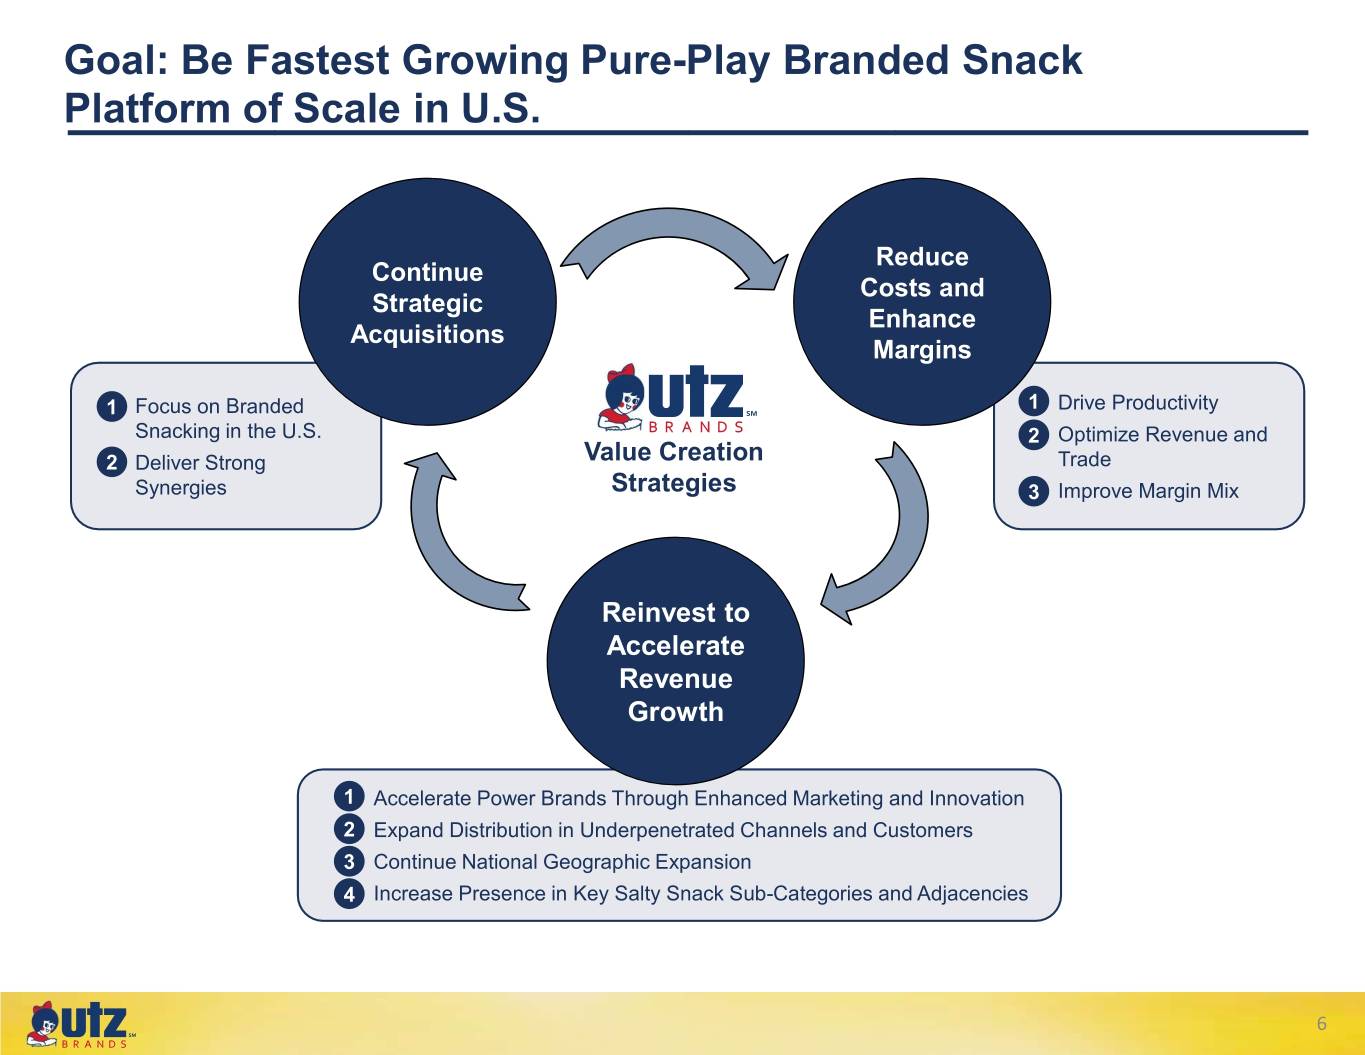
Goal: Be Fastest Growing Pure-Play Branded Snack Platform of Scale in U.S. Reduce Continue Costs and Strategic Enhance Acquisitions Margins 1. Focus on Branded 1.1 Drive Productivity 1 ℠ Snacking in the U.S. 2.2 Optimize Revenue and 2.2 Deliver Strong Value Creation Trade Synergies Strategies 3.3 Improve Margin Mix Reinvest to Accelerate Revenue Growth 1.1 Accelerate Power Brands Through Enhanced Marketing and Innovation 2.2 Expand Distribution in Underpenetrated Channels and Customers 3.3 Continue National Geographic Expansion 4.4 Increase Presence in Key Salty Snack Sub-Categories and Adjacencies 6 ℠
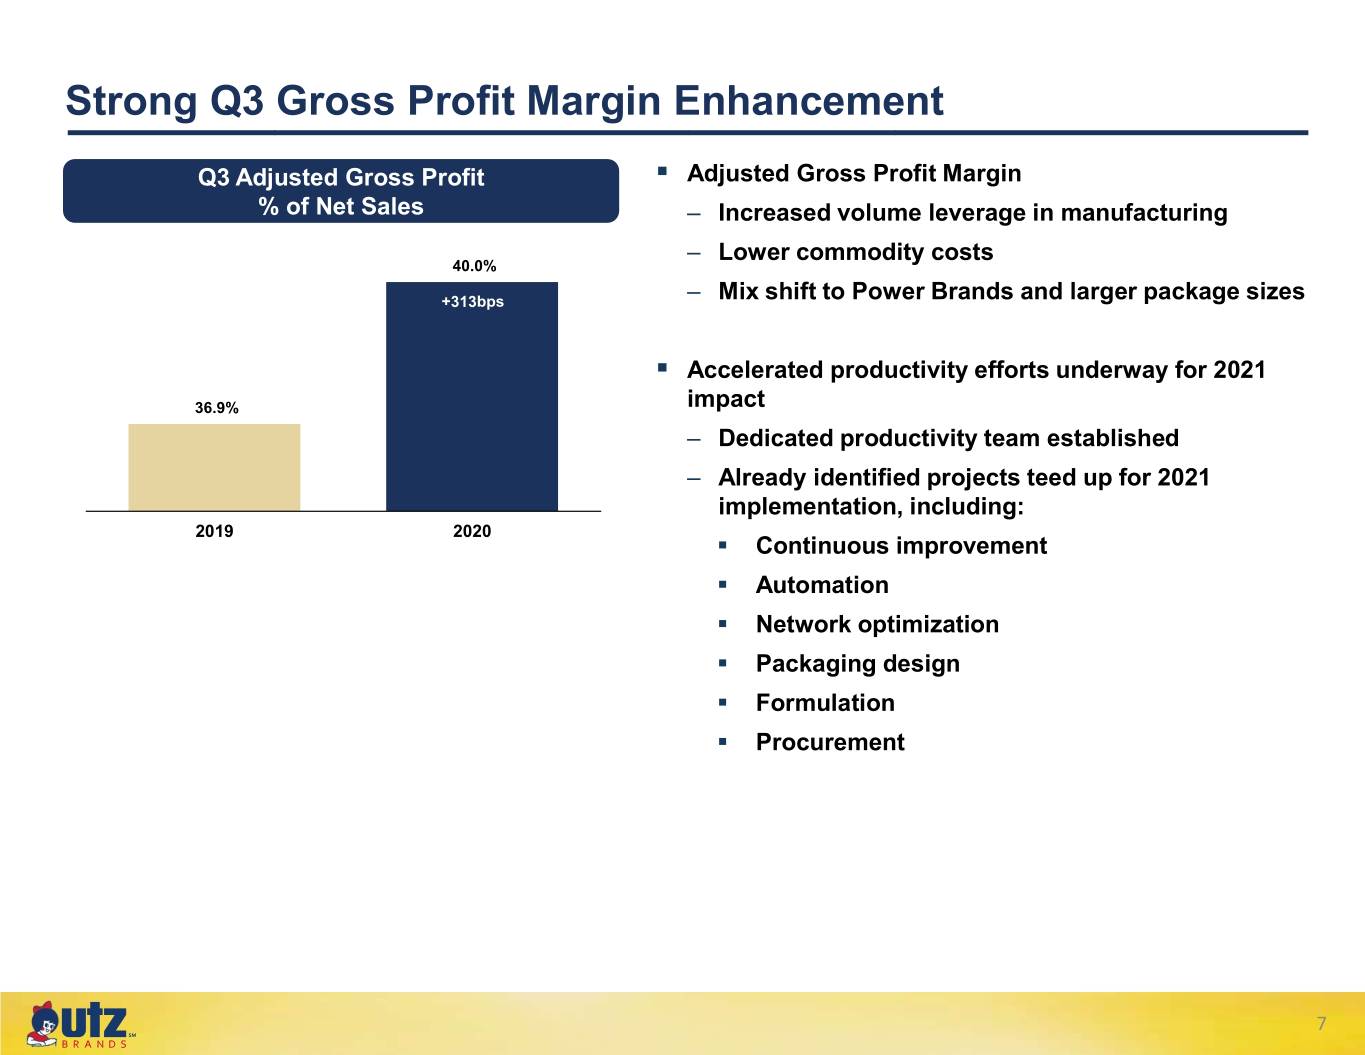
Strong Q3 Gross Profit Margin Enhancement Q3 Adjusted Gross Profit . Adjusted Gross Profit Margin % of Net Sales – Increased volume leverage in manufacturing – Lower commodity costs 40.0% +313bps – Mix shift to Power Brands and larger package sizes . Accelerated productivity efforts underway for 2021 36.9% impact – Dedicated productivity team established – Already identified projects teed up for 2021 implementation, including: 2019 2020 . Continuous improvement . Automation . Network optimization . Packaging design . Formulation . Procurement 7 ℠
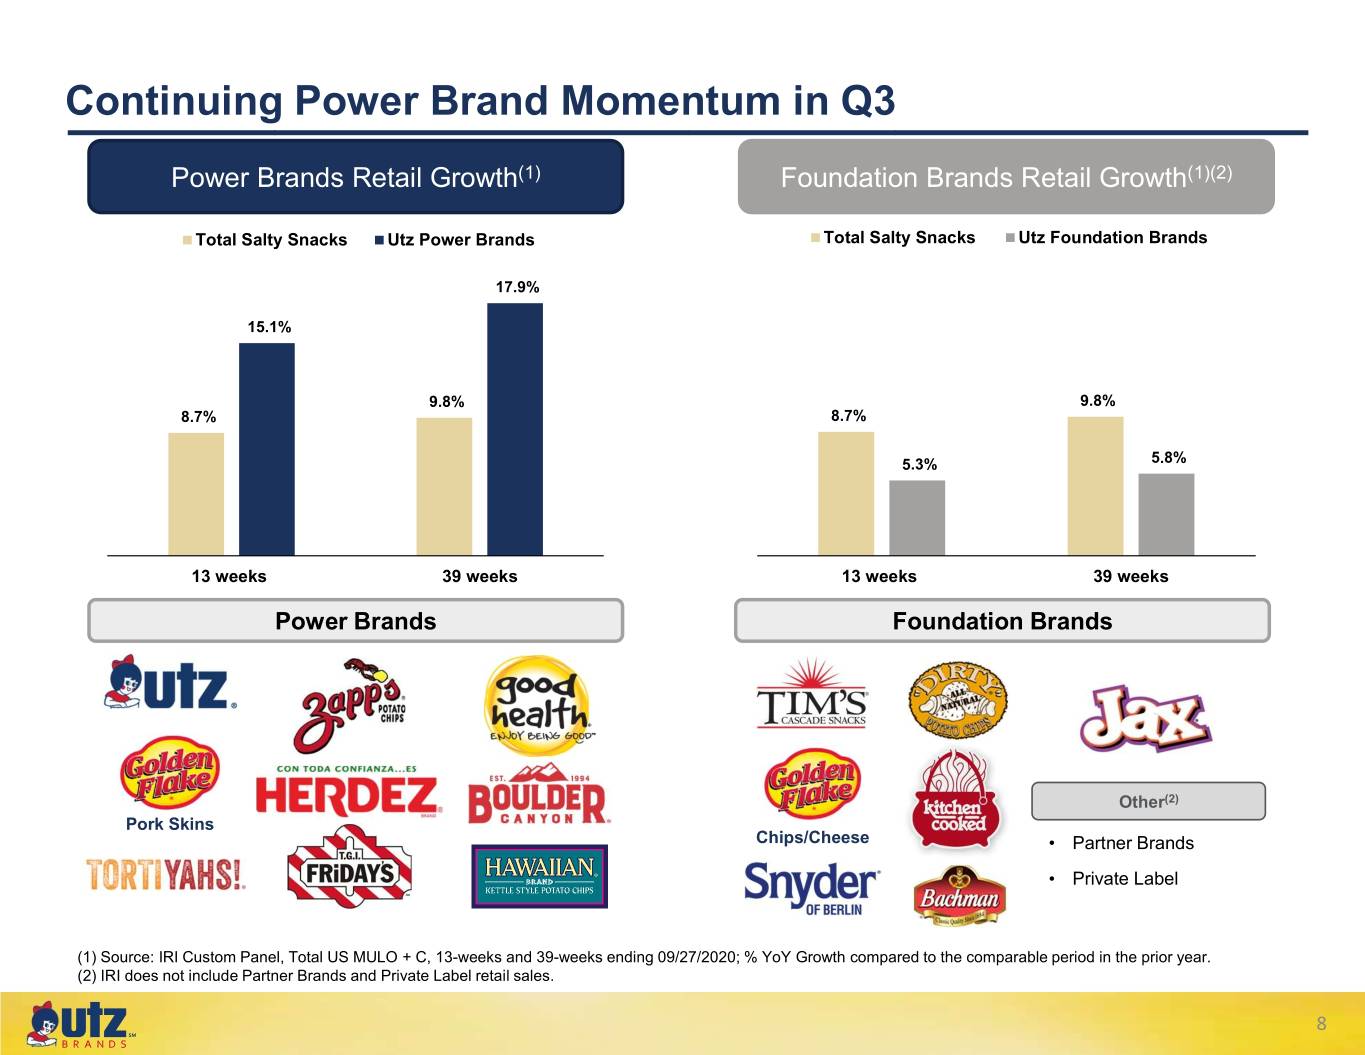
Continuing Power Brand Momentum in Q3 Power Brands Retail Growth(1) Foundation Brands Retail Growth(1)(2) Total Salty Snacks Utz Power Brands Total Salty Snacks Utz Foundation Brands 17.9% 15.1% 9.8% 9.8% 8.7% 8.7% 5.3% 5.8% 13 weeks 39 weeks 13 weeks 39 weeks Power Brands Foundation Brands Other(2) Pork Skins Chips/Cheese • Partner Brands • Private Label (1) Source: IRI Custom Panel, Total US MULO + C, 13-weeks and 39-weeks ending 09/27/2020; % YoY Growth compared to the comparable period in the prior year. (2) IRI does not include Partner Brands and Private Label retail sales. 8 ℠
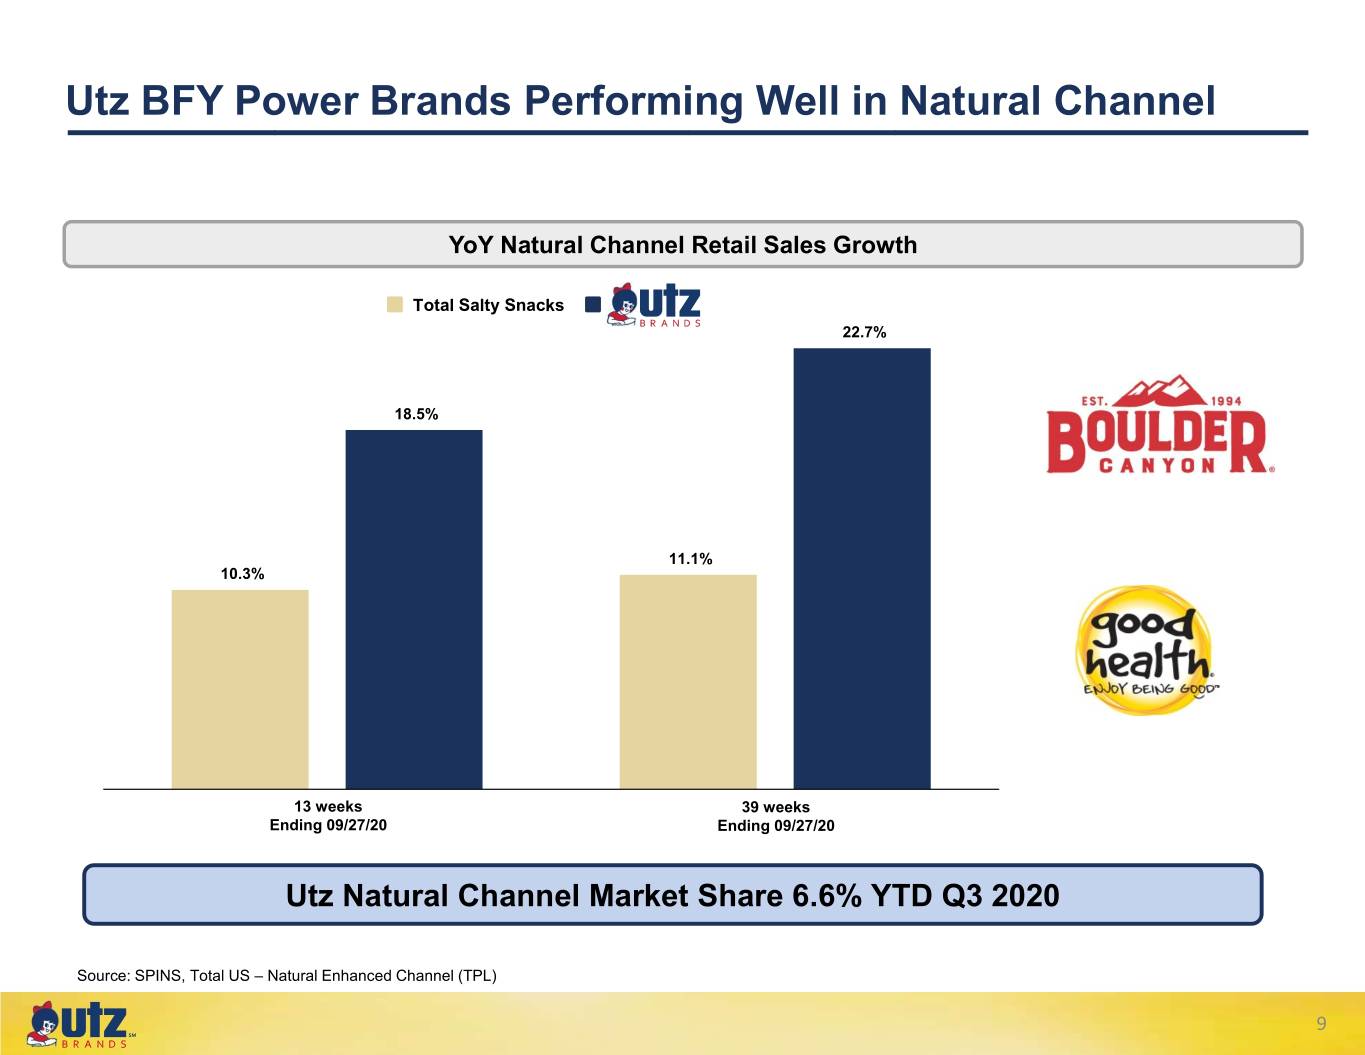
Utz BFY Power Brands Performing Well in Natural Channel YoY Natural Channel Retail Sales Growth Total Salty Snacks 22.7% 18.5% 11.1% 10.3% 13 weeks 39 weeks Ending 09/27/20 Ending 09/27/20 Utz Natural Channel Market Share 6.6% YTD Q3 2020 Source: SPINS, Total US – Natural Enhanced Channel (TPL) 9 ℠
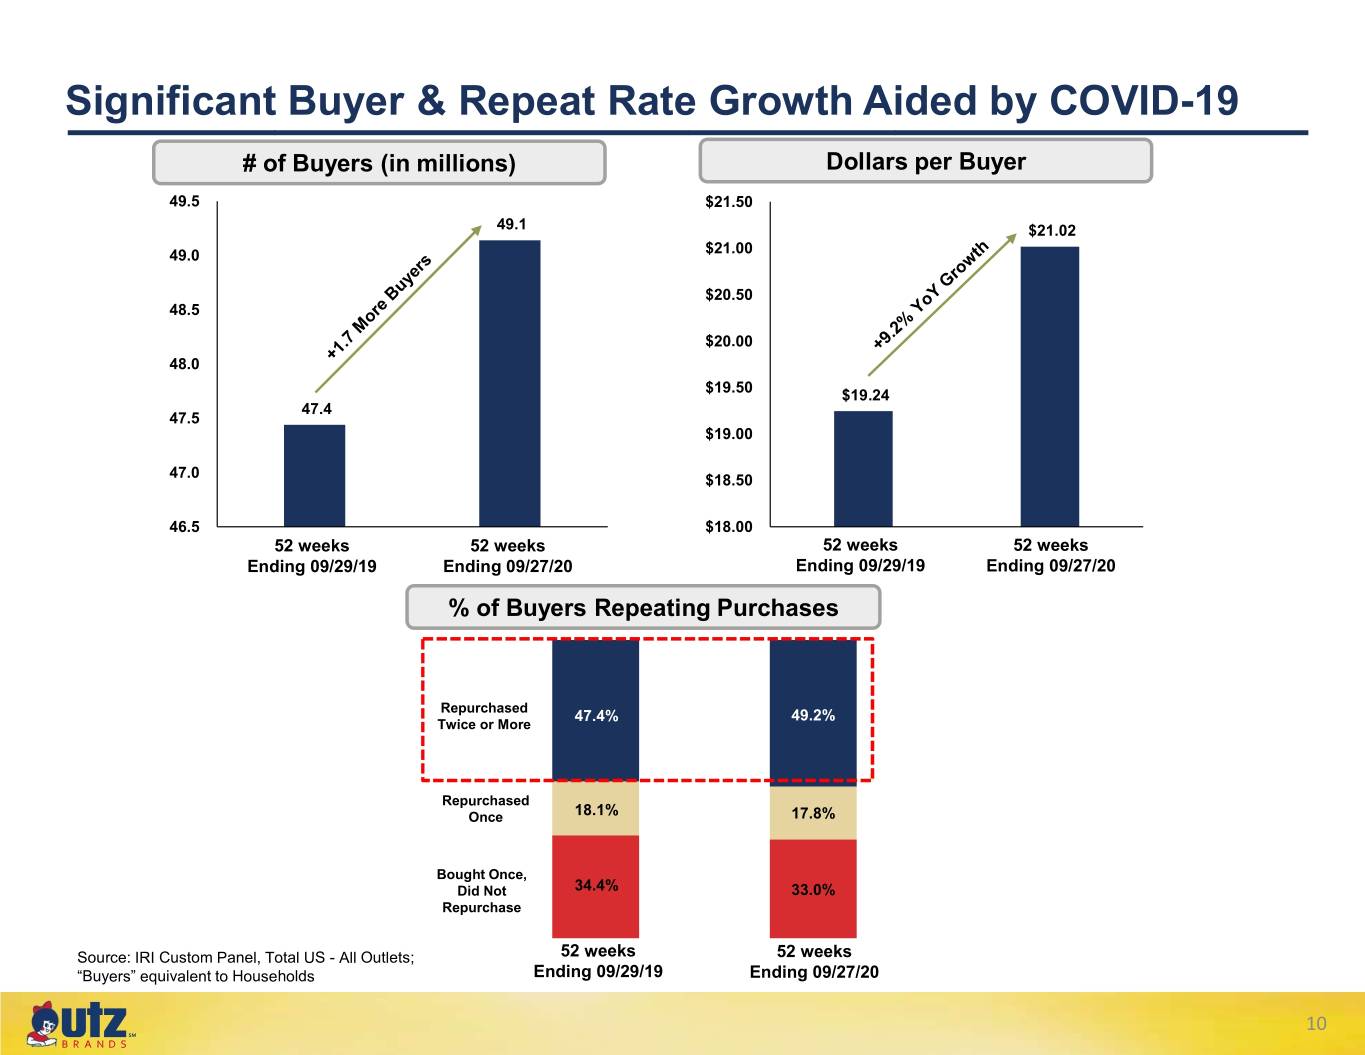
Significant Buyer & Repeat Rate Growth Aided by COVID-19 # of Buyers (in millions) Dollars per Buyer 49.5 $21.50 49.1 $21.02 49.0 $21.00 $20.50 48.5 $20.00 48.0 $19.50 $19.24 47.4 47.5 $19.00 47.0 $18.50 46.5 $18.00 52 weeks 52 weeks 52 weeks 52 weeks Ending 09/29/19 Ending 09/27/20 Ending 09/29/19 Ending 09/27/20 % of Buyers Repeating Purchases Repurchased 47.4% 49.2% Twice or More Repurchased Once 18.1% 17.8% Bought Once, Did Not 34.4% 33.0% Repurchase Source: IRI Custom Panel, Total US - All Outlets; 52 weeks 52 weeks “Buyers” equivalent to Households Ending 09/29/19 Ending 09/27/20 10 ℠
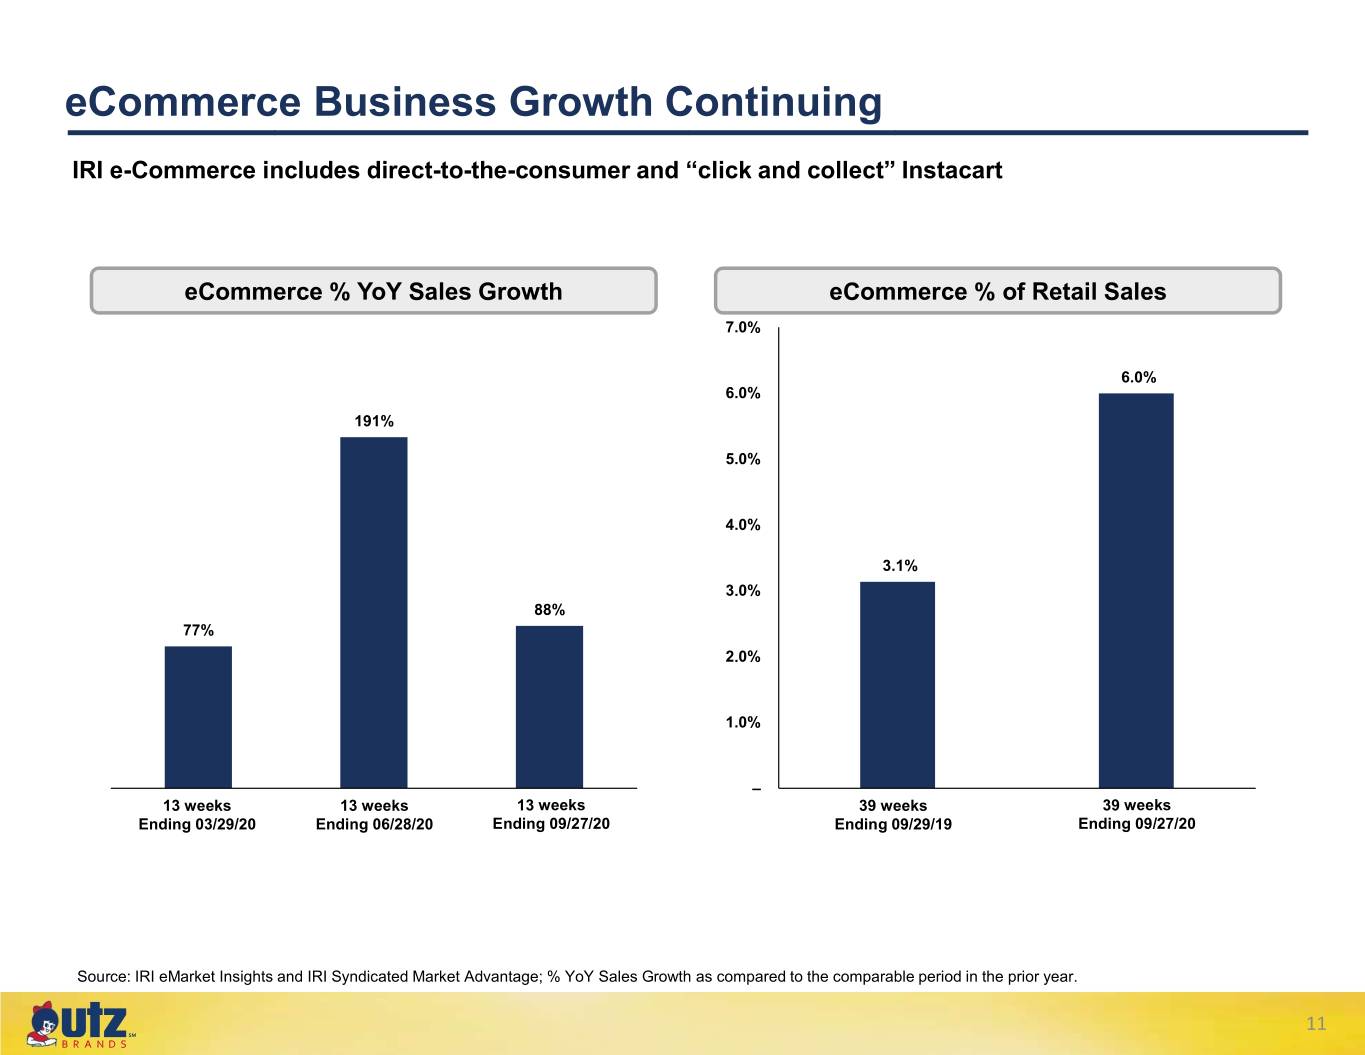
eCommerce Business Growth Continuing IRI e-Commerce includes direct-to-the-consumer and “click and collect” Instacart eCommerce % YoY Sales Growth eCommerce % of Retail Sales 7.0% 6.0% 6.0% 191% 5.0% 4.0% 3.1% 3.0% 88% 77% 2.0% 1.0% – 13 weeks 13 weeks 13 weeks 39 weeks 39 weeks Ending 03/29/20 Ending 06/28/20 Ending 09/27/20 Ending 09/29/19 Ending 09/27/20 Source: IRI eMarket Insights and IRI Syndicated Market Advantage; % YoY Sales Growth as compared to the comparable period in the prior year. 11 ℠
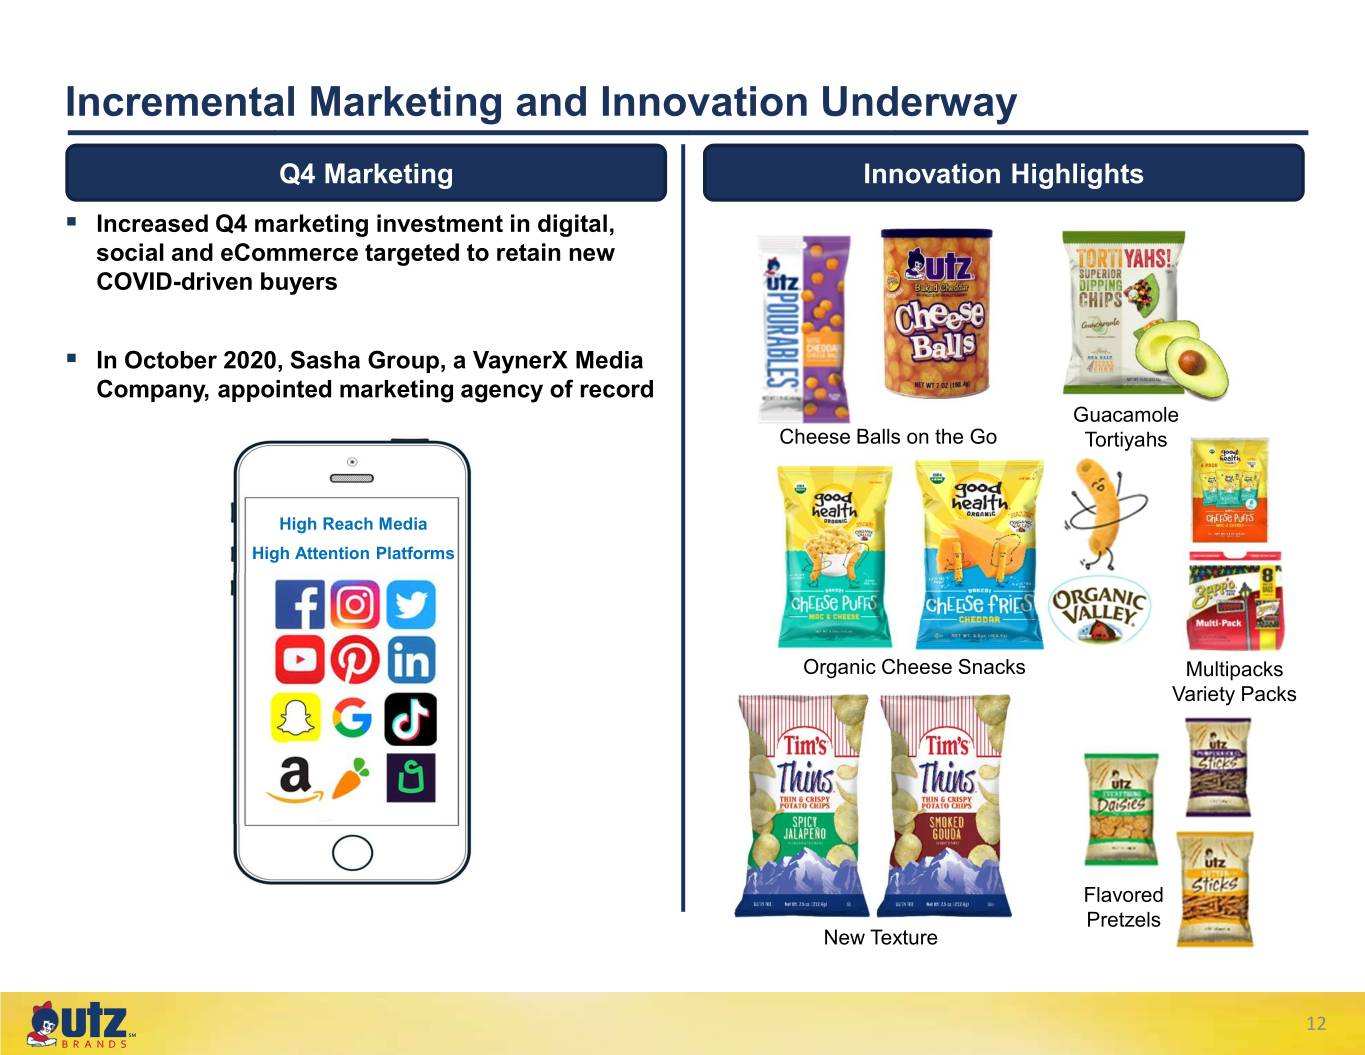
Incremental Marketing and Innovation Underway Q4 Marketing Innovation Highlights . Increased Q4 marketing investment in digital, social and eCommerce targeted to retain new COVID-driven buyers . In October 2020, Sasha Group, a VaynerX Media Company, appointed marketing agency of record Guacamole Cheese Balls on the Go Tortiyahs High Reach Media High Attention Platforms Organic Cheese Snacks Multipacks Variety Packs Flavored Pretzels New Texture 12 ℠
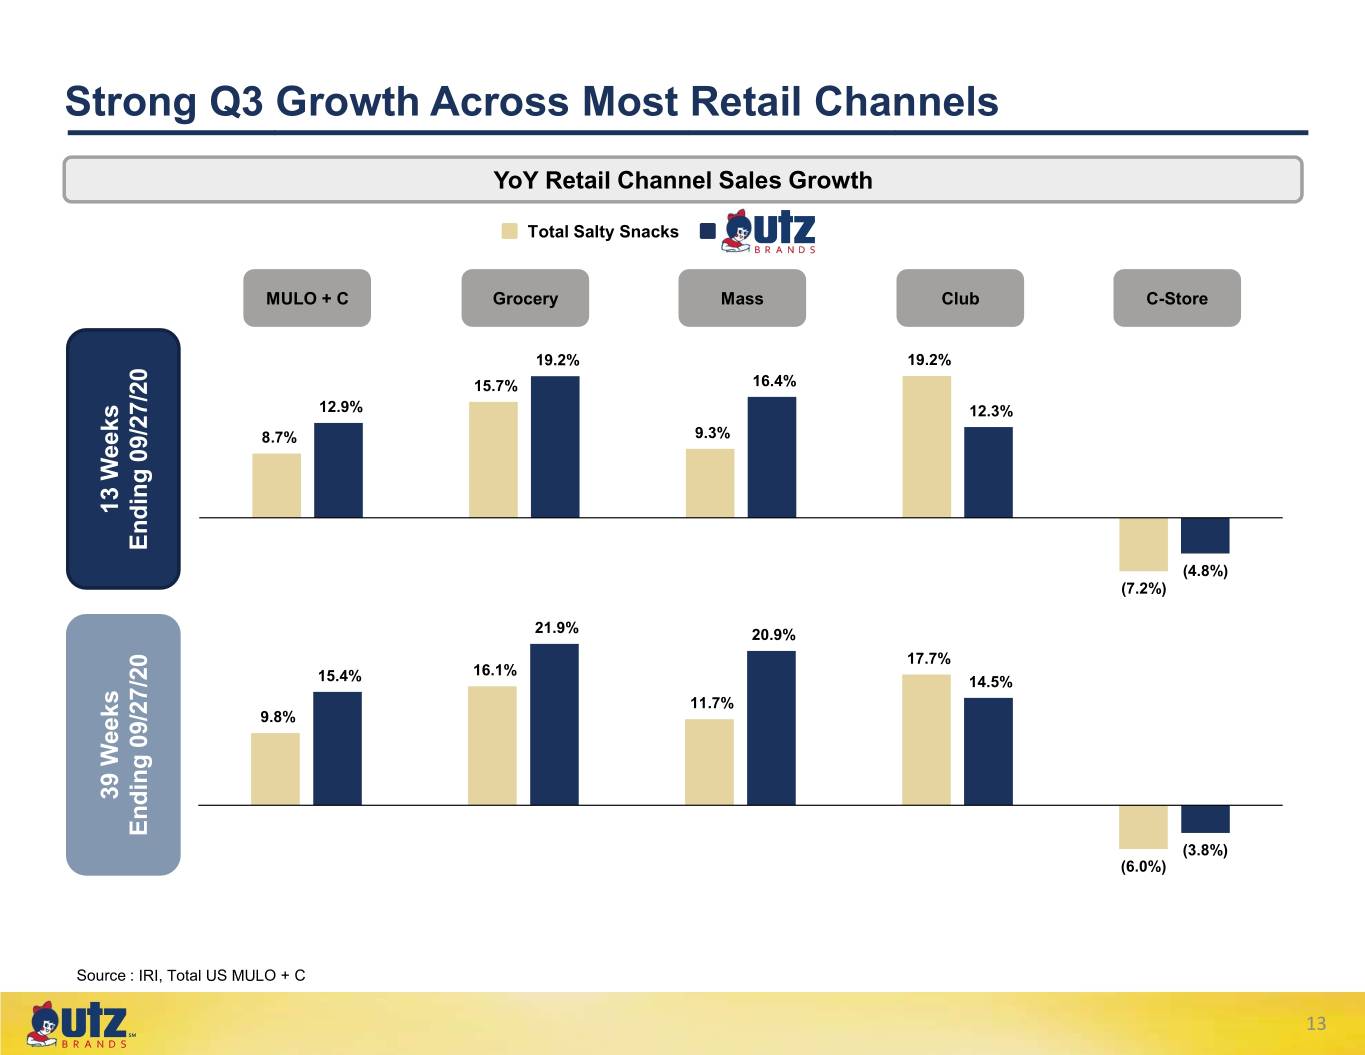
Strong Q3 Growth Across Most Retail Channels YoY Retail Channel Sales Growth Total Salty Snacks MULO + C Grocery Mass Club C-Store 19.2% 19.2% 15.7% 16.4% 12.9% 12.3% 8.7% 9.3% 13 Weeks Weeks 13 Ending 09/27/20 Ending (4.8%) (7.2%) 21.9% 20.9% 17.7% 16.1% 15.4% 14.5% 11.7% 9.8% 39 Weeks Weeks 39 Ending 09/27/20 Ending (3.8%) (6.0%) Source : IRI, Total US MULO + C 13 ℠
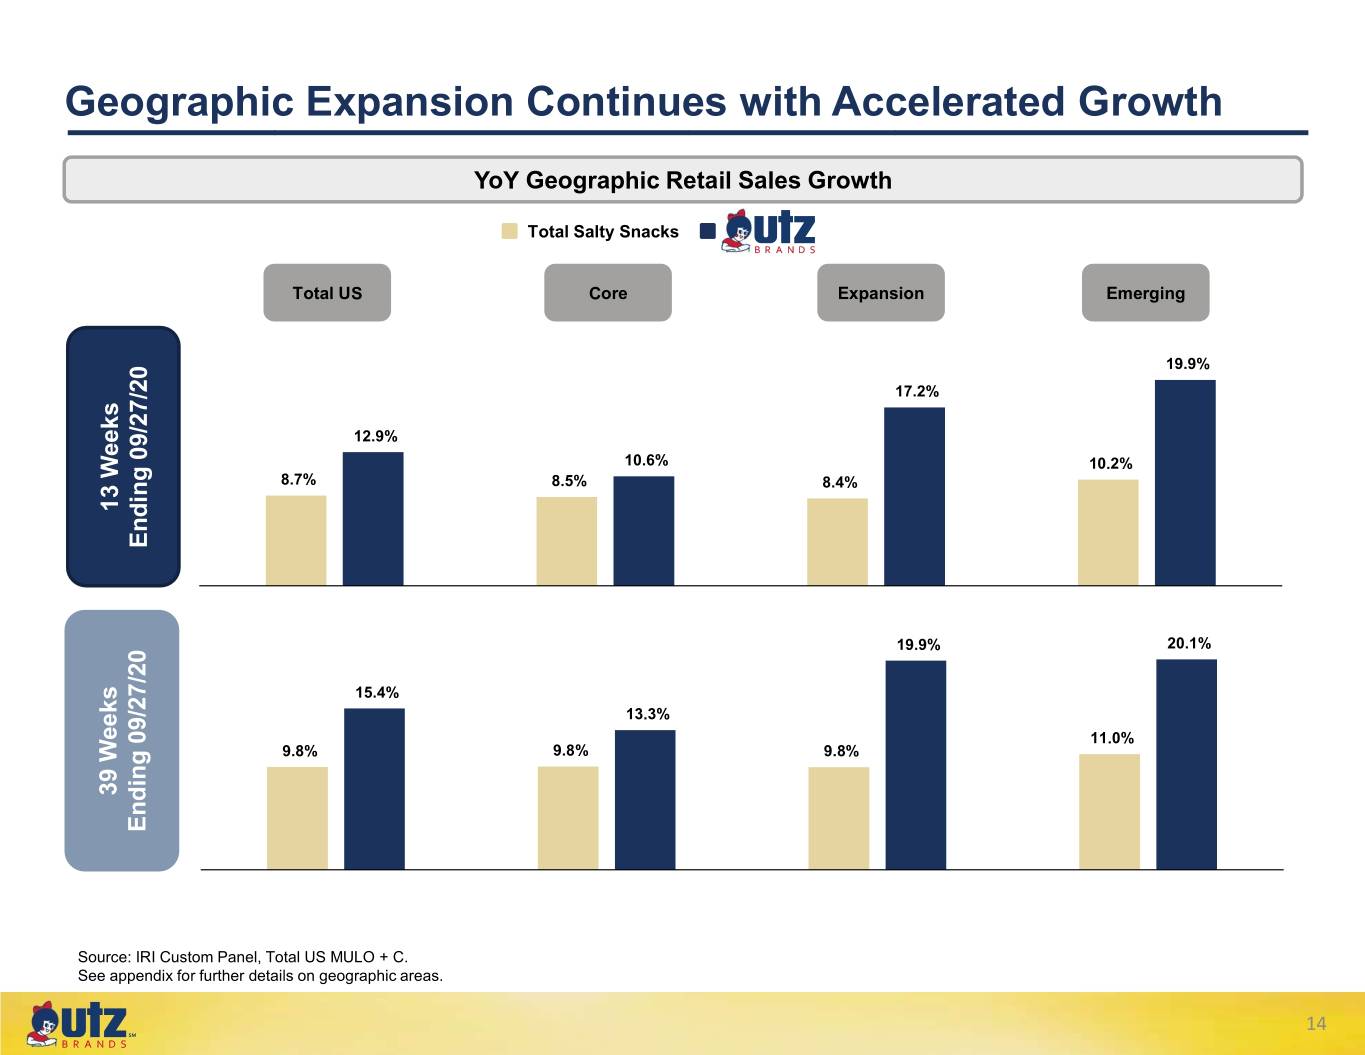
Geographic Expansion Continues with Accelerated Growth YoY Geographic Retail Sales Growth Total Salty Snacks Total US Core Expansion Emerging 19.9% 17.2% 12.9% 10.6% 10.2% 8.7% 8.5% 8.4% 13 Weeks Weeks 13 Ending 09/27/20 Ending 19.9% 20.1% 15.4% 13.3% 11.0% 9.8% 9.8% 9.8% 39 Weeks Weeks 39 Ending 09/27/20 Ending Source: IRI Custom Panel, Total US MULO + C. See appendix for further details on geographic areas. 14 ℠
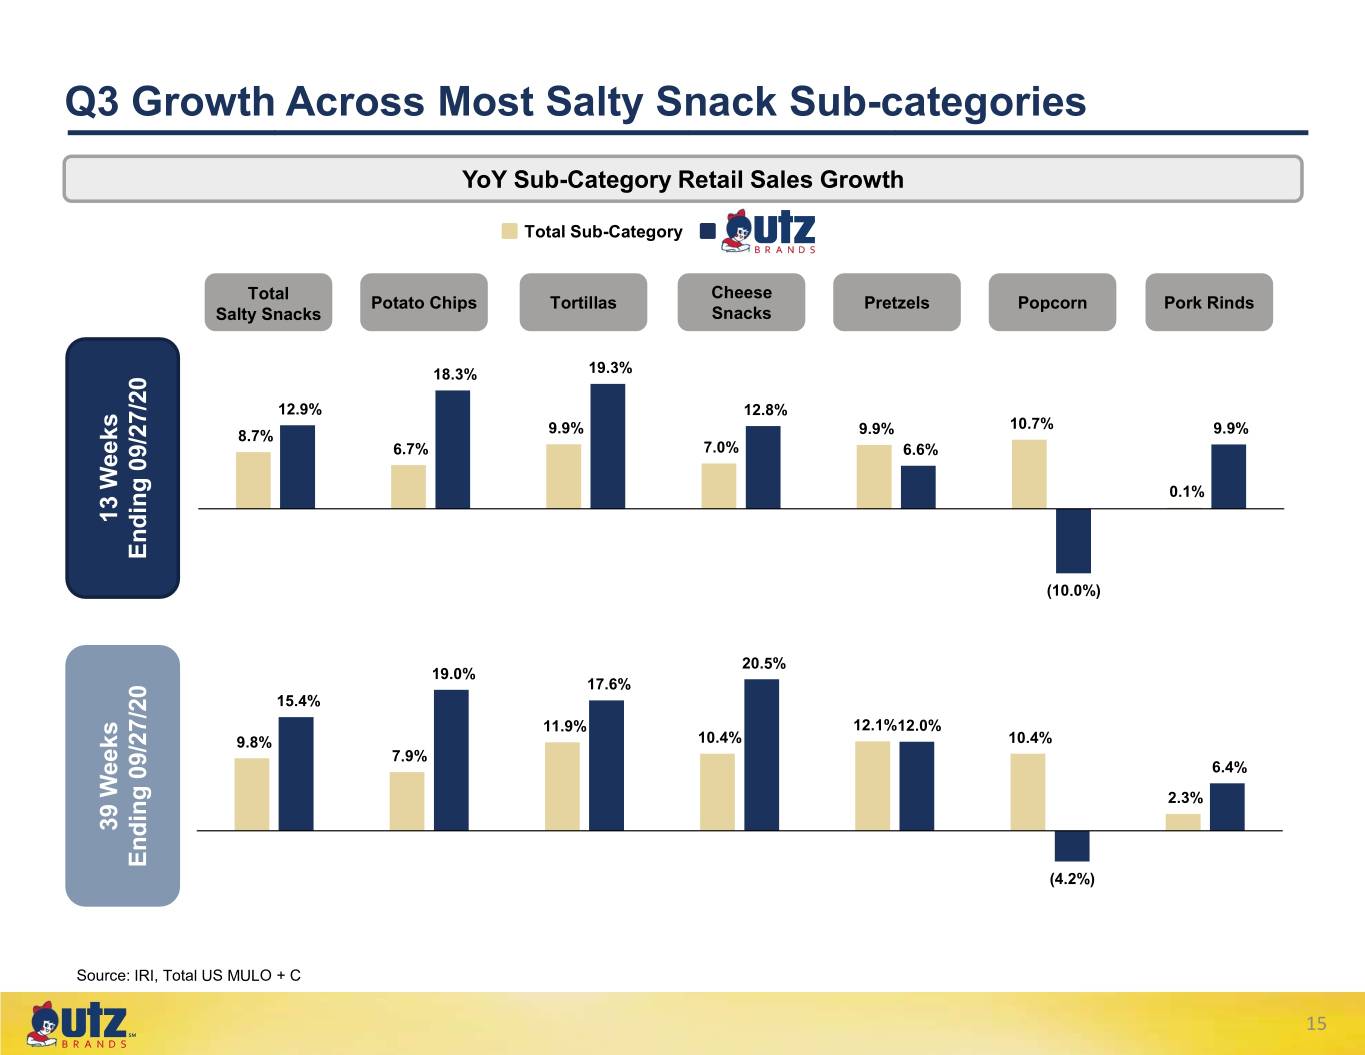
Q3 Growth Across Most Salty Snack Sub-categories YoY Sub-Category Retail Sales Growth Total Sub-Category Total Cheese Potato Chips Tortillas Pretzels Popcorn Pork Rinds Salty Snacks Snacks 18.3% 19.3% 12.9% 12.8% 9.9% 10.7% 8.7% 9.9% 9.9% 6.7% 7.0% 6.6% 0.1% 13 Weeks Weeks 13 Ending 09/27/20 Ending (10.0%) 20.5% 19.0% 17.6% 15.4% 11.9% 12.1% 12.0% 9.8% 10.4% 10.4% 7.9% 6.4% 2.3% 39 Weeks Weeks 39 Ending 09/27/20 Ending (4.2%) Source: IRI, Total US MULO + C 15 ℠
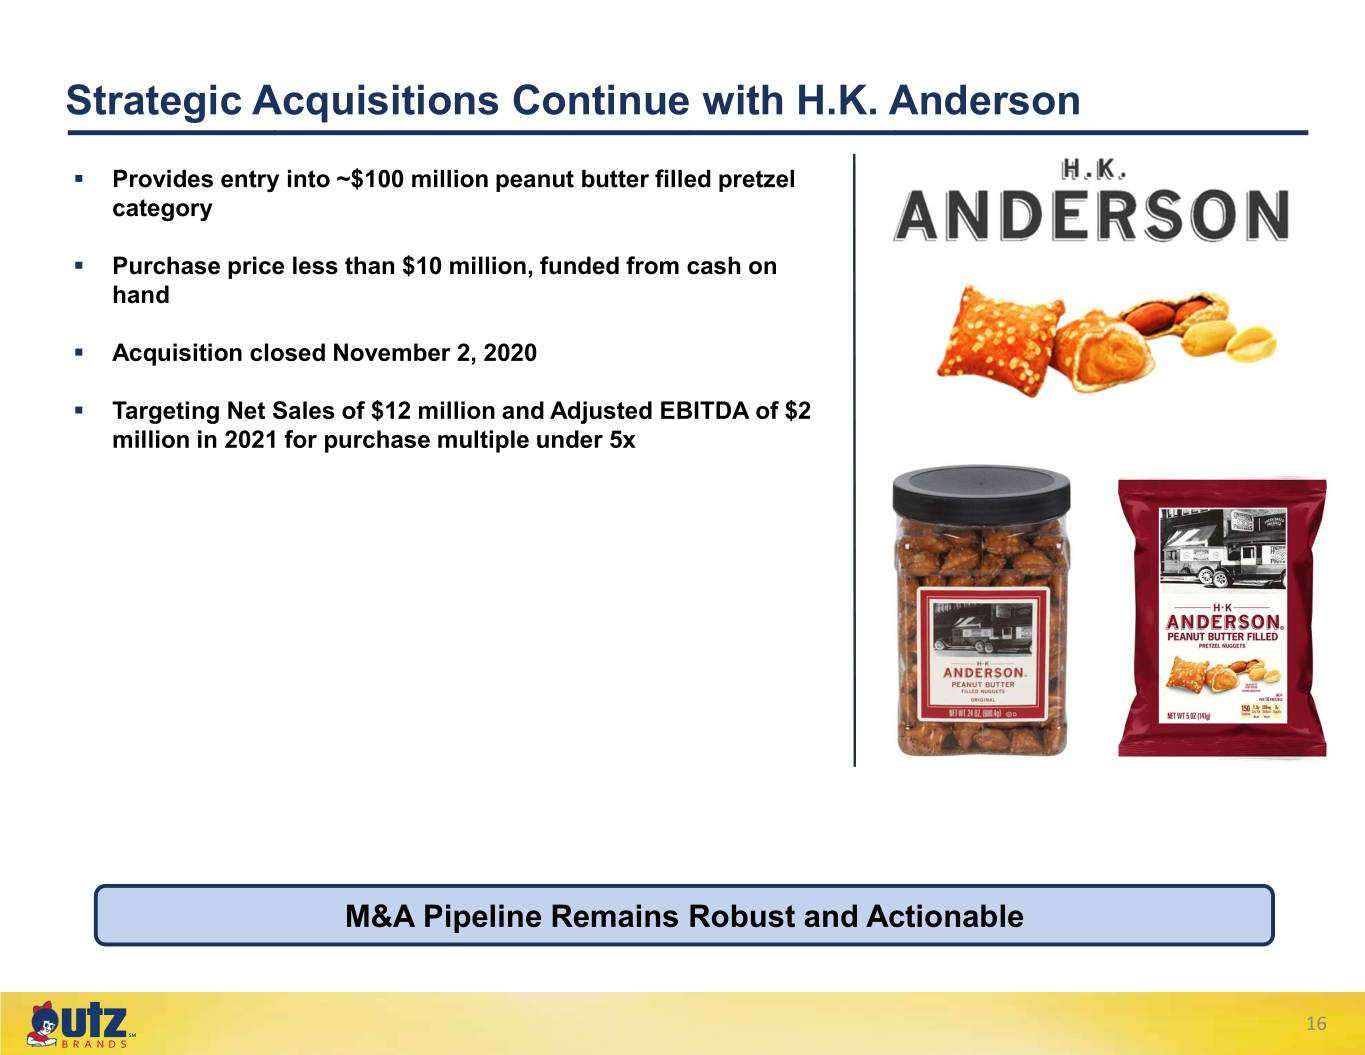
Strategic Acquisitions Continue with H.K. Anderson . Provides entry into ~$100 million peanut butter filled pretzel category . Purchase price less than $10 million, funded from cash on hand . Acquisition closed November 2, 2020 . Targeting Net Sales of $12 million and Adjusted EBITDA of $2 million in 2021 for purchase multiple under 5x M&A Pipeline Remains Robust and Actionable 16 ℠
Financial Performance HIGHLY CONFIDENTIAL 17
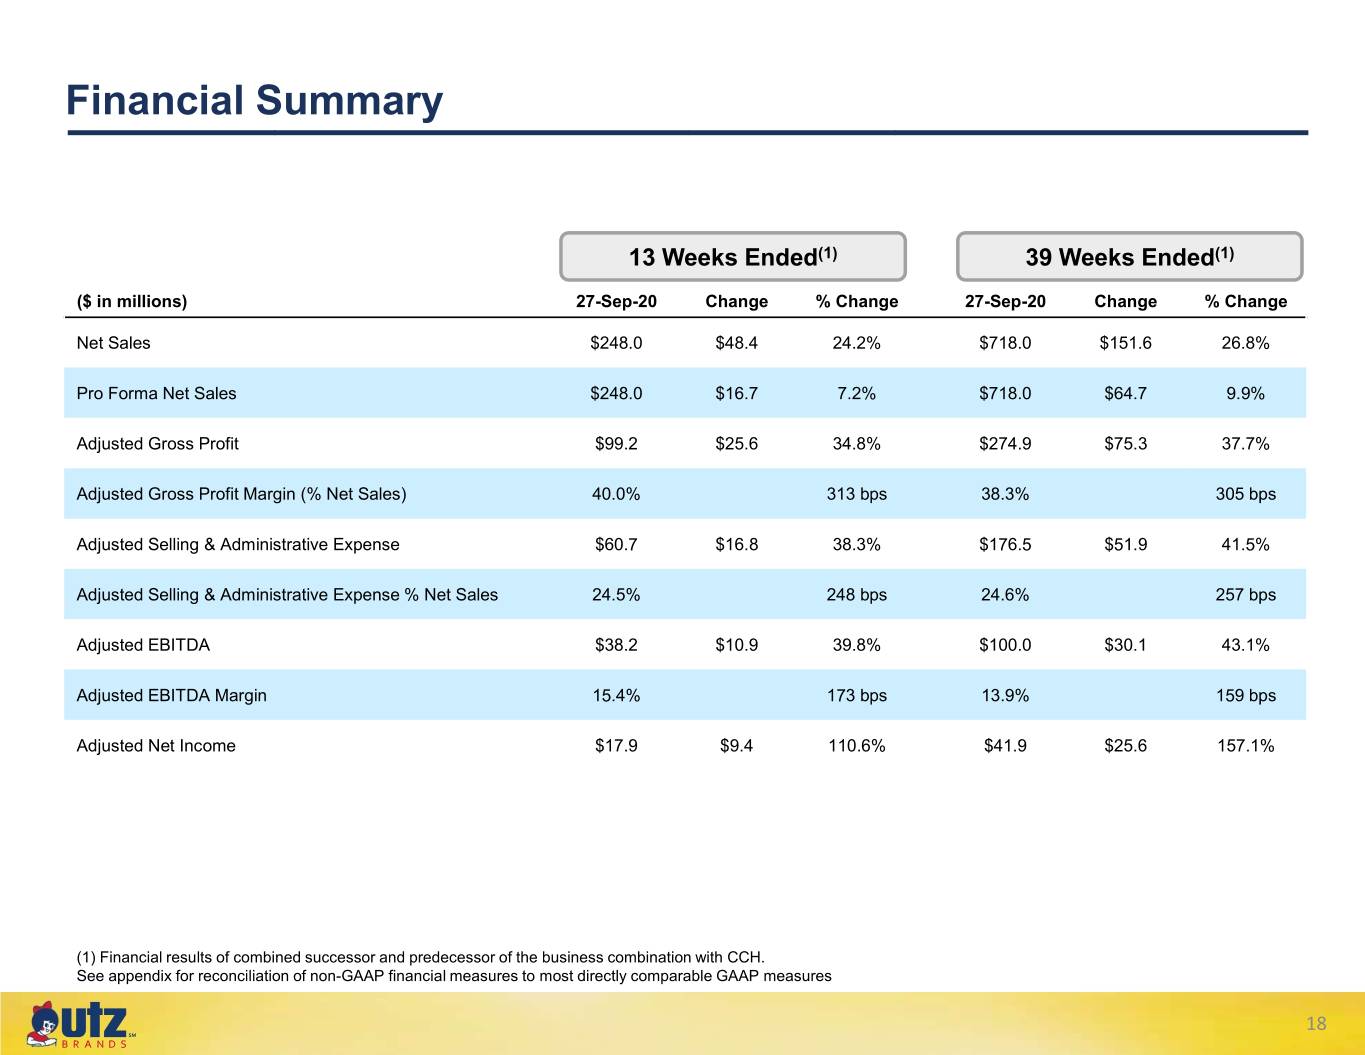
Financial Summary 13 Weeks Ended(1) 39 Weeks Ended(1) ($ in millions) 27-Sep-20 Change % Change 27-Sep-20 Change % Change Net Sales $248.0 $48.4 24.2% $718.0 $151.6 26.8% Pro Forma Net Sales $248.0 $16.7 7.2% $718.0 $64.7 9.9% Adjusted Gross Profit $99.2 $25.6 34.8% $274.9 $75.3 37.7% Adjusted Gross Profit Margin (% Net Sales) 40.0% 313 bps 38.3% 305 bps Adjusted Selling & Administrative Expense $60.7 $16.8 38.3% $176.5 $51.9 41.5% Adjusted Selling & Administrative Expense % Net Sales 24.5% 248 bps 24.6% 257 bps Adjusted EBITDA $38.2 $10.9 39.8% $100.0 $30.1 43.1% Adjusted EBITDA Margin 15.4% 173 bps 13.9% 159 bps Adjusted Net Income $17.9 $9.4 110.6% $41.9 $25.6 157.1% (1) Financial results of combined successor and predecessor of the business combination with CCH. See appendix for reconciliation of non-GAAP financial measures to most directly comparable GAAP measures 18 ℠
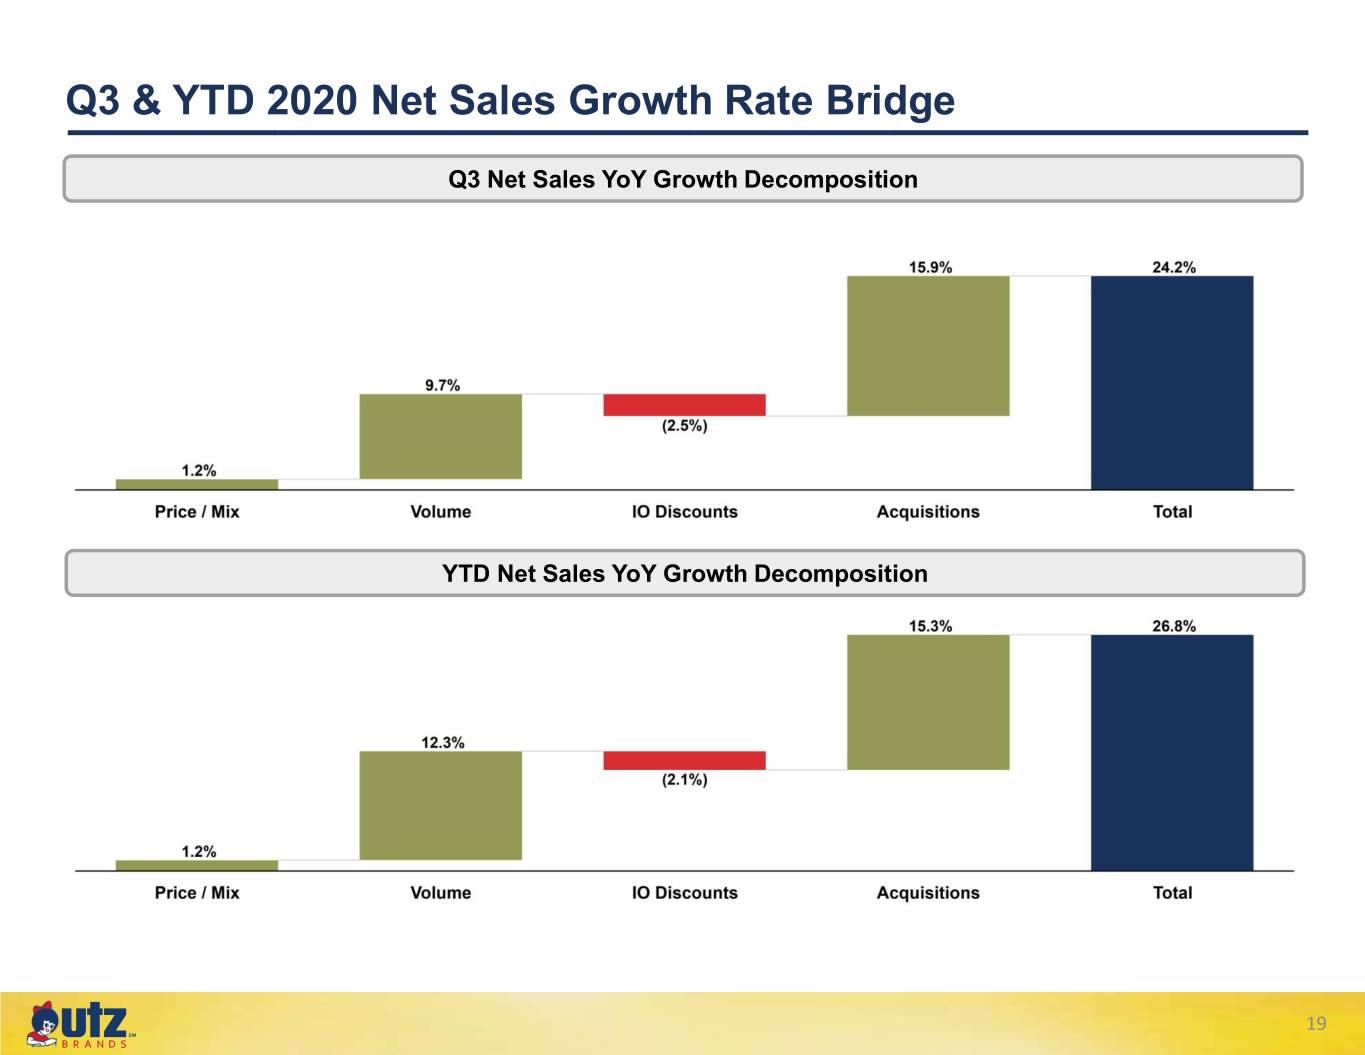
Q3 & YTD 2020 Net Sales Growth Rate Bridge Q3 Net Sales YoY Growth Decomposition YTD Net Sales YoY Growth Decomposition 19 ℠
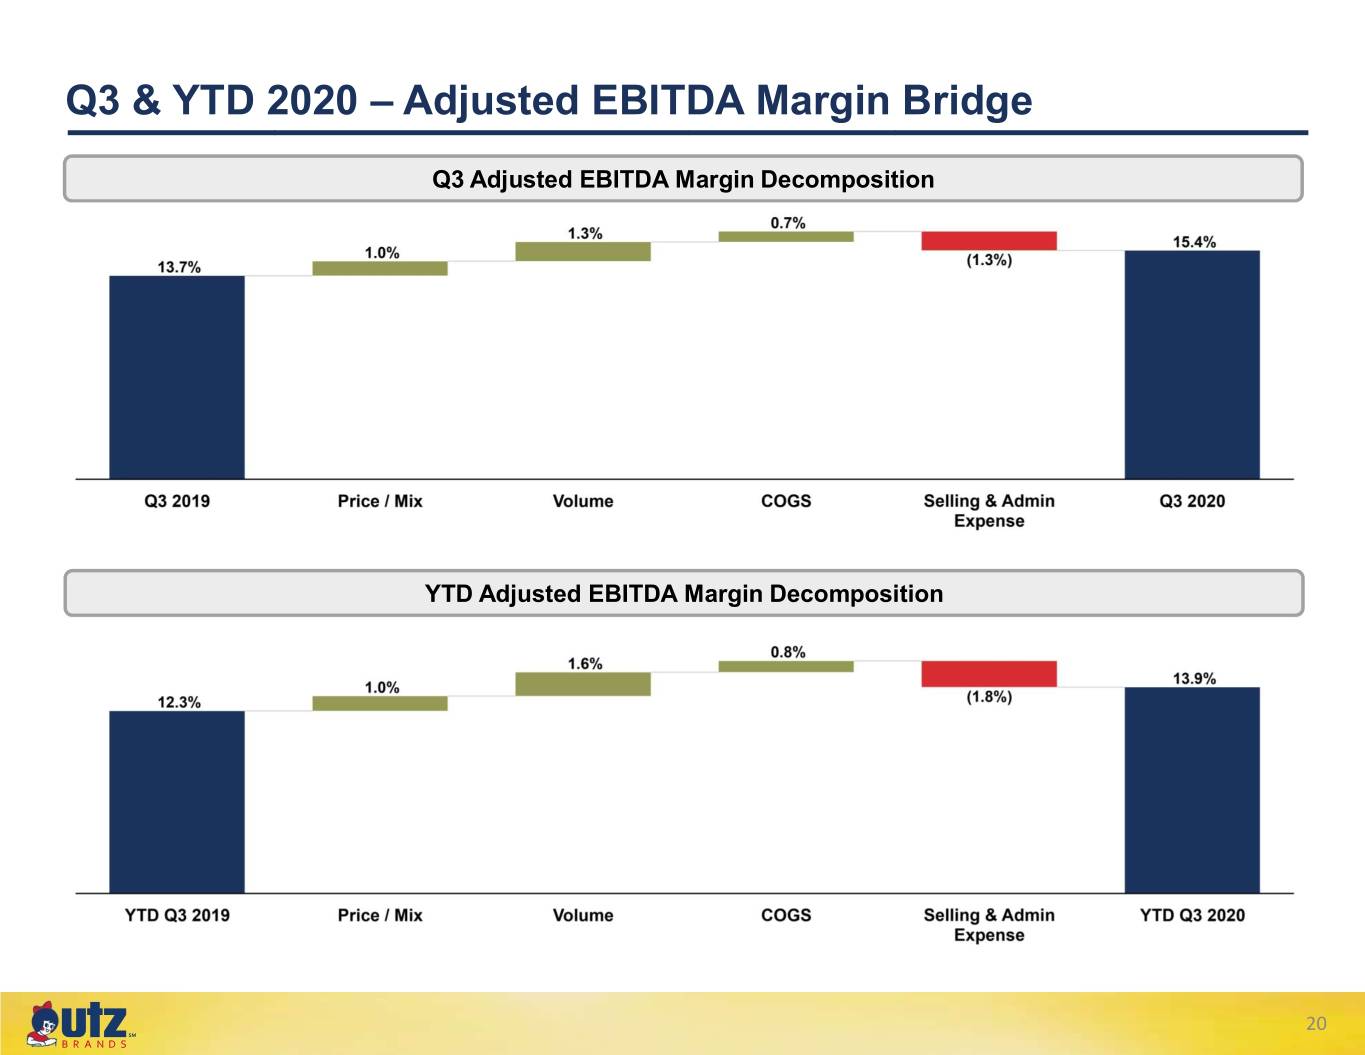
Q3 & YTD 2020 – Adjusted EBITDA Margin Bridge Q3 Adjusted EBITDA Margin Decomposition YTD Adjusted EBITDA Margin Decomposition 20 ℠
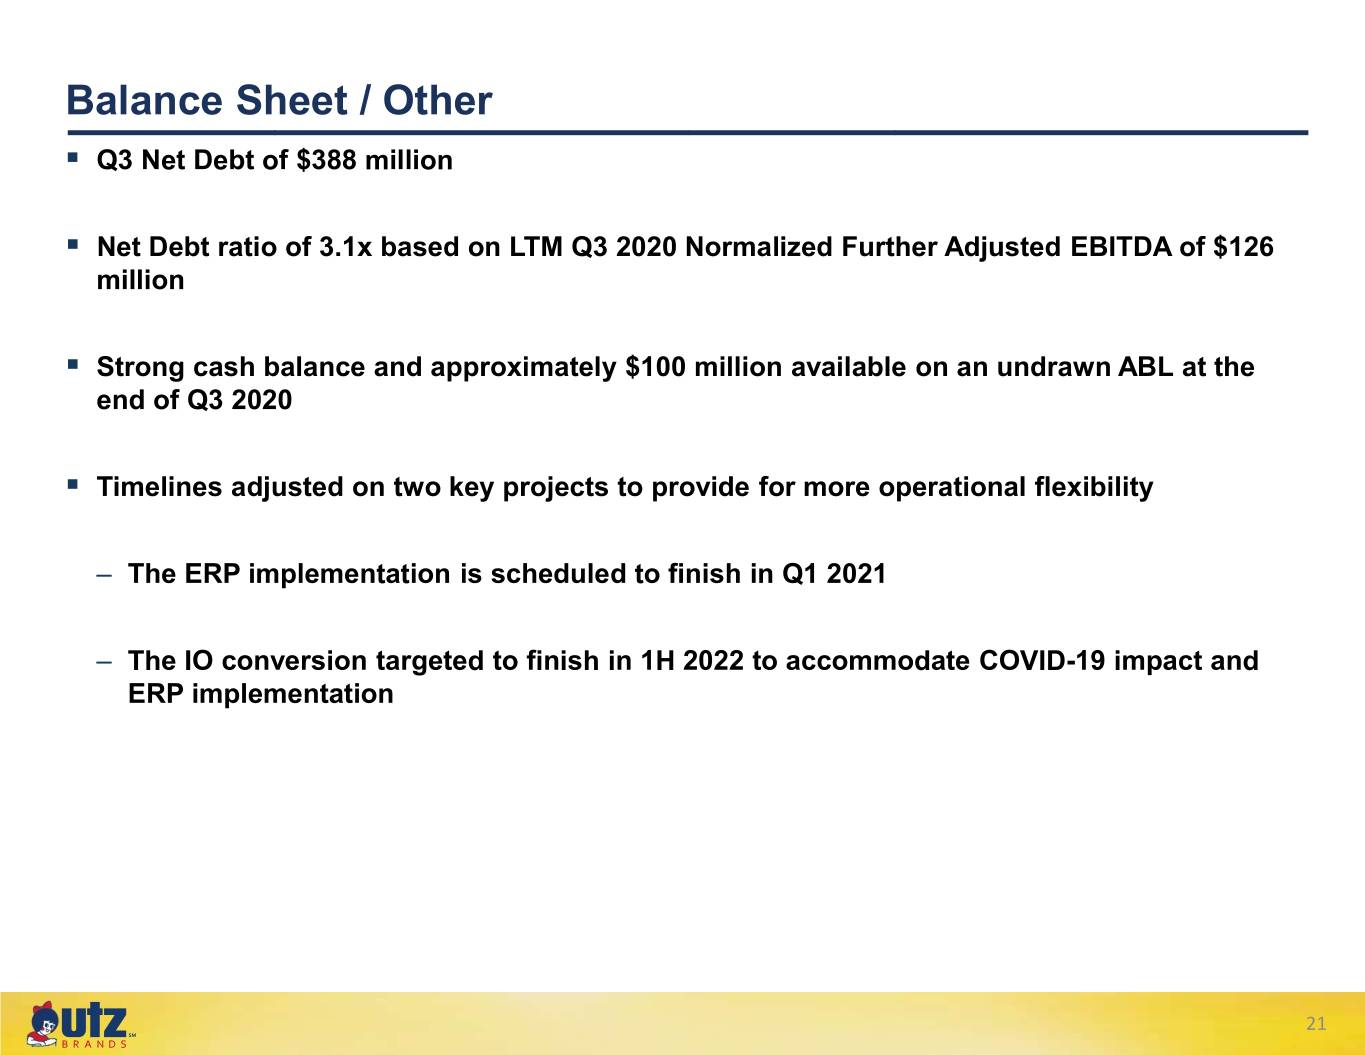
Balance Sheet / Other . Q3 Net Debt of $388 million . Net Debt ratio of 3.1x based on LTM Q3 2020 Normalized Further Adjusted EBITDA of $126 million . Strong cash balance and approximately $100 million available on an undrawn ABL at the end of Q3 2020 . Timelines adjusted on two key projects to provide for more operational flexibility – The ERP implementation is scheduled to finish in Q1 2021 – The IO conversion targeted to finish in 1H 2022 to accommodate COVID-19 impact and ERP implementation 21 ℠
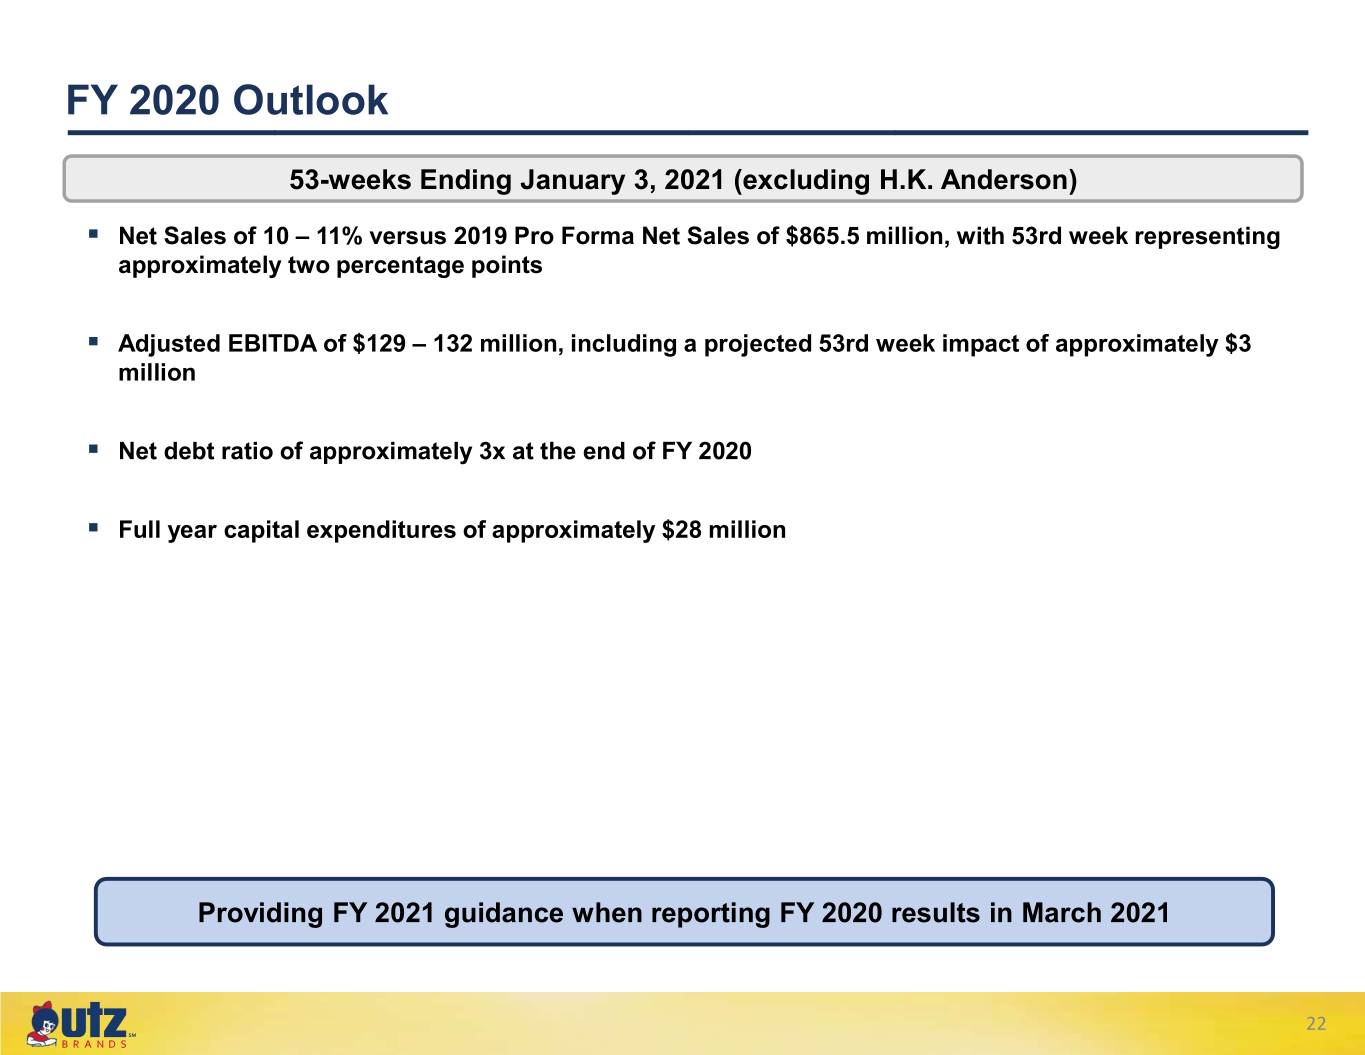
FY 2020 Outlook 53-weeks Ending January 3, 2021 (excluding H.K. Anderson) . Net Sales of 10 – 11% versus 2019 Pro Forma Net Sales of $865.5 million, with 53rd week representing approximately two percentage points . Adjusted EBITDA of $129 – 132 million, including a projected 53rd week impact of approximately $3 million . Net debt ratio of approximately 3x at the end of FY 2020 . Full year capital expenditures of approximately $28 million Providing FY 2021 guidance when reporting FY 2020 results in March 2021 22 ℠
Appendix HIGHLY CONFIDENTIAL 23
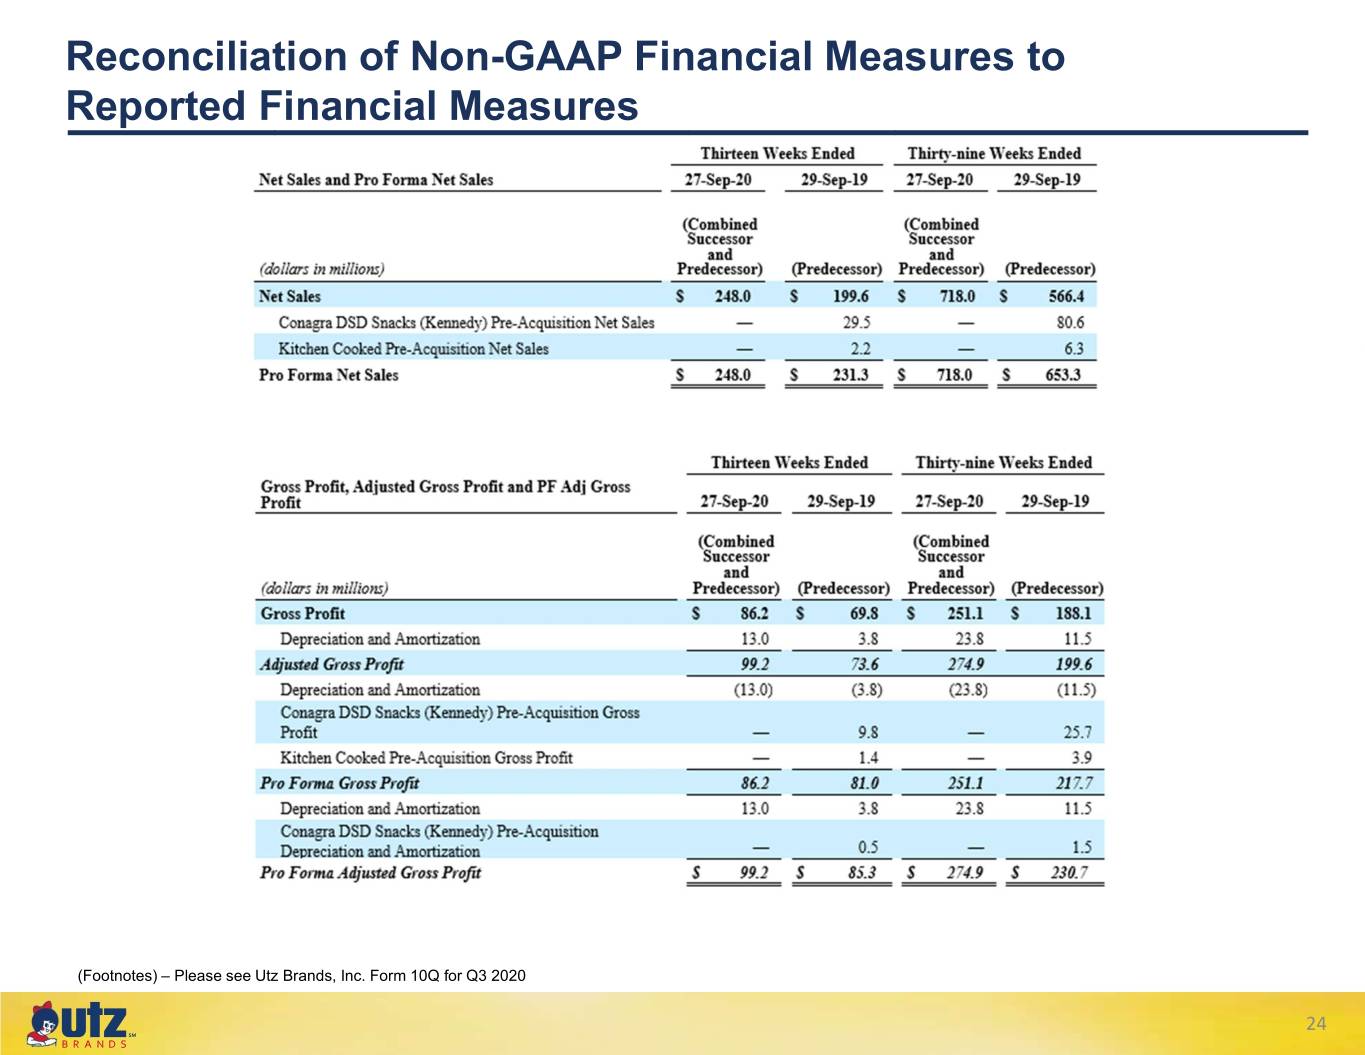
Reconciliation of Non-GAAP Financial Measures to Reported Financial Measures (Footnotes) – Please see Utz Brands, Inc. Form 10Q for Q3 2020 24 ℠
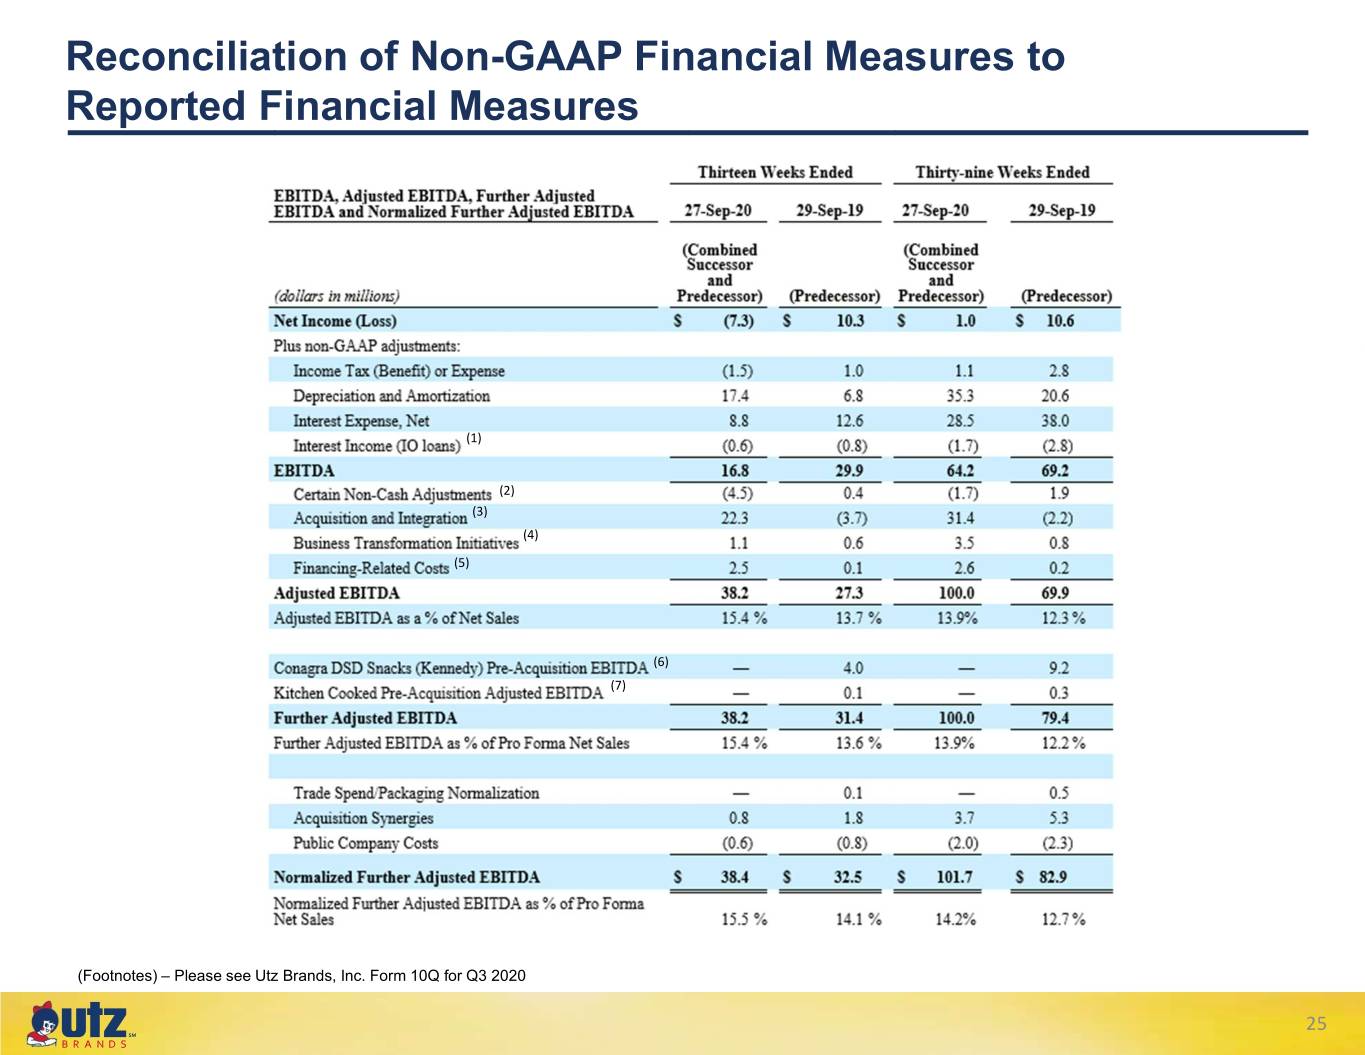
Reconciliation of Non-GAAP Financial Measures to Reported Financial Measures (1) (2) (3) (4) (5) (6) (7) (Footnotes) – Please see Utz Brands, Inc. Form 10Q for Q3 2020 25 ℠
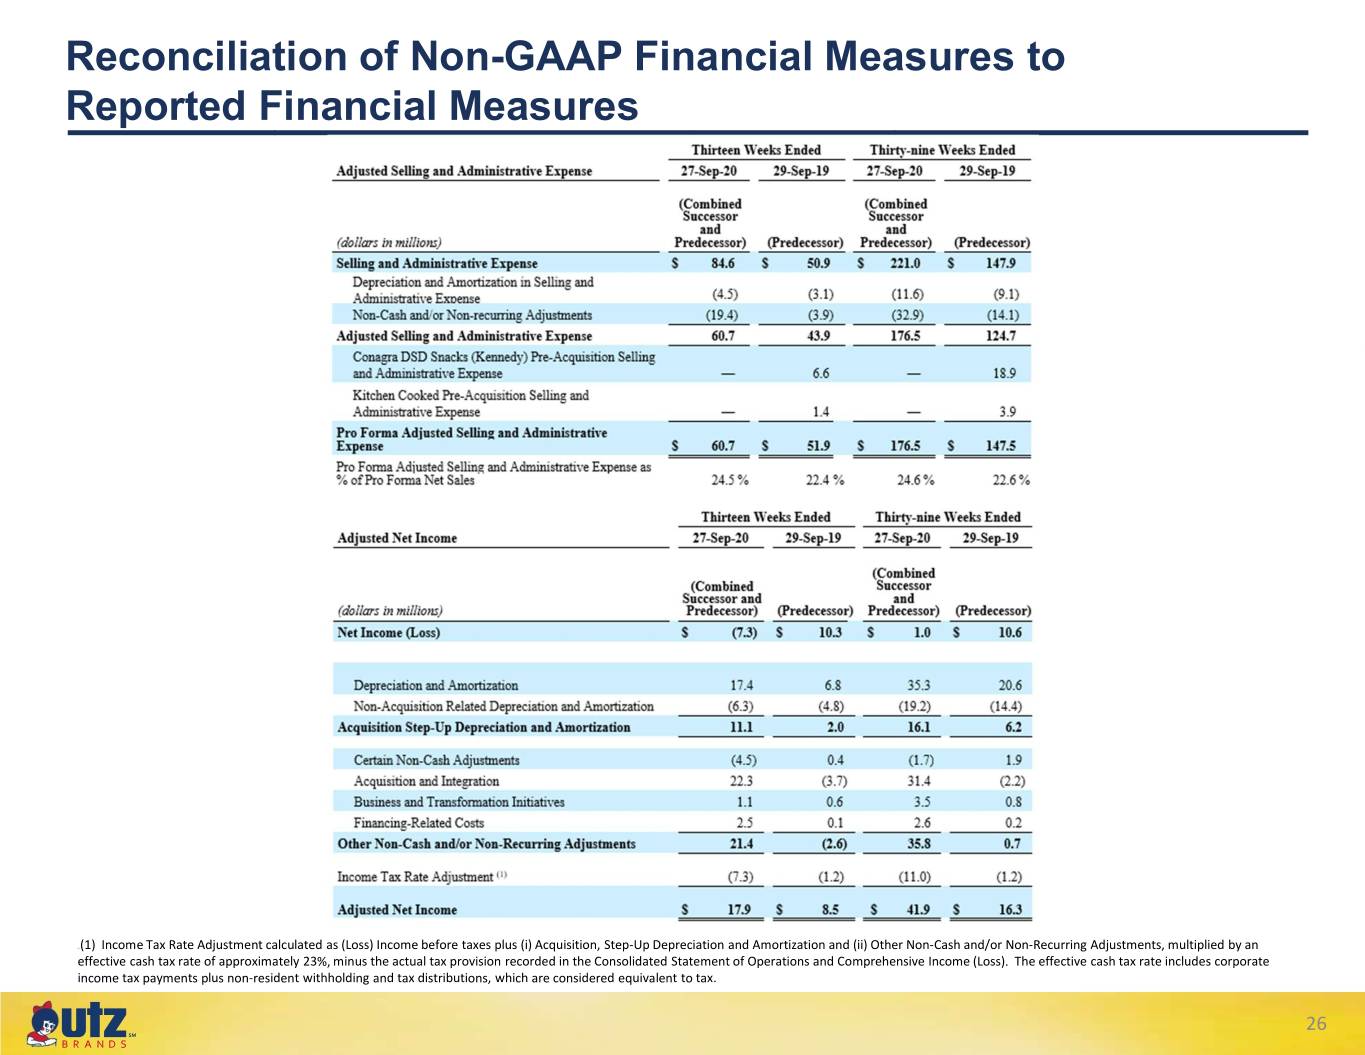
Reconciliation of Non-GAAP Financial Measures to Reported Financial Measures (1) (1) Income Tax Rate Adjustment calculated as (Loss) Income before taxes plus (i) Acquisition, Step-Up Depreciation and Amortization and (ii) Other Non-Cash and/or Non-Recurring Adjustments, multiplied by an effective cash tax rate of approximately 23%, minus the actual tax provision recorded in the Consolidated Statement of Operations and Comprehensive Income (Loss). The effective cash tax rate includes corporate income tax payments plus non-resident withholding and tax distributions, which are considered equivalent to tax. 26 ℠
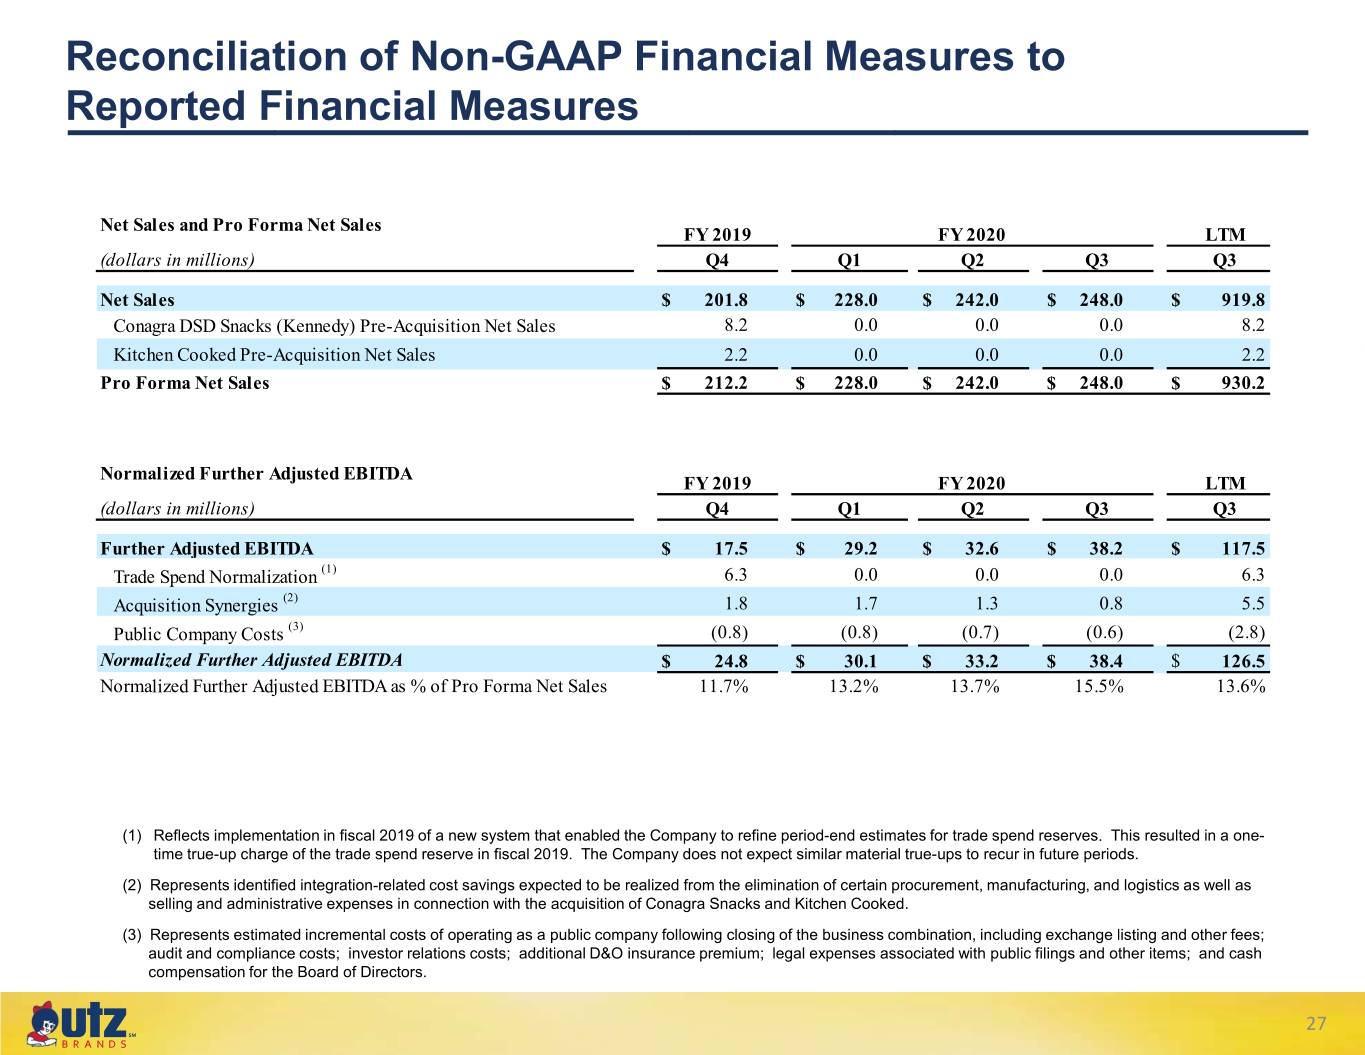
Reconciliation of Non-GAAP Financial Measures to Reported Financial Measures Net Sales and Pro Forma Net Sales FY 2019 FY 2020 LTM (dollars in millions) Q4 Q1 Q2 Q3 Q3 Net Sales $ 201.8 $ 228.0 $ 242.0 $ 248.0 $ 919.8 Conagra DSD Snacks (Kennedy) Pre-Acquisition Net Sales 8.2 0.0 0.0 0.0 8.2 Kitchen Cooked Pre-Acquisition Net Sales 2.2 0.0 0.0 0.0 2.2 Pro Forma Net Sales $ 212.2 $ 228.0 $ 242.0 $ 248.0 $ 930.2 Normalized Further Adjusted EBITDA FY 2019 FY 2020 LTM (dollars in millions) Q4 Q1 Q2 Q3 Q3 Further Adjusted EBITDA $ 17.5 $ 29.2 $ 32.6 $ 38.2 $ 117.5 Trade Spend Normalization (1) 6.3 0.0 0.0 0.0 6.3 Acquisition Synergies (2) 1.8 1.7 1.3 0.8 5.5 Public Company Costs (3) (0.8) (0.8) (0.7) (0.6) (2.8) Normalized Further Adjusted EBITDA $ 24.8 $ 30.1 $ 33.2 $ 38.4 $ 126.5 Normalized Further Adjusted EBITDA as % of Pro Forma Net Sales 11.7% 13.2% 13.7% 15.5% 13.6% (1) Reflects implementation in fiscal 2019 of a new system that enabled the Company to refine period-end estimates for trade spend reserves. This resulted in a one- time true-up charge of the trade spend reserve in fiscal 2019. The Company does not expect similar material true-ups to recur in future periods. (2) Represents identified integration-related cost savings expected to be realized from the elimination of certain procurement, manufacturing, and logistics as well as selling and administrative expenses in connection with the acquisition of Conagra Snacks and Kitchen Cooked. (3) Represents estimated incremental costs of operating as a public company following closing of the business combination, including exchange listing and other fees; audit and compliance costs; investor relations costs; additional D&O insurance premium; legal expenses associated with public filings and other items; and cash compensation for the Board of Directors. 27 ℠
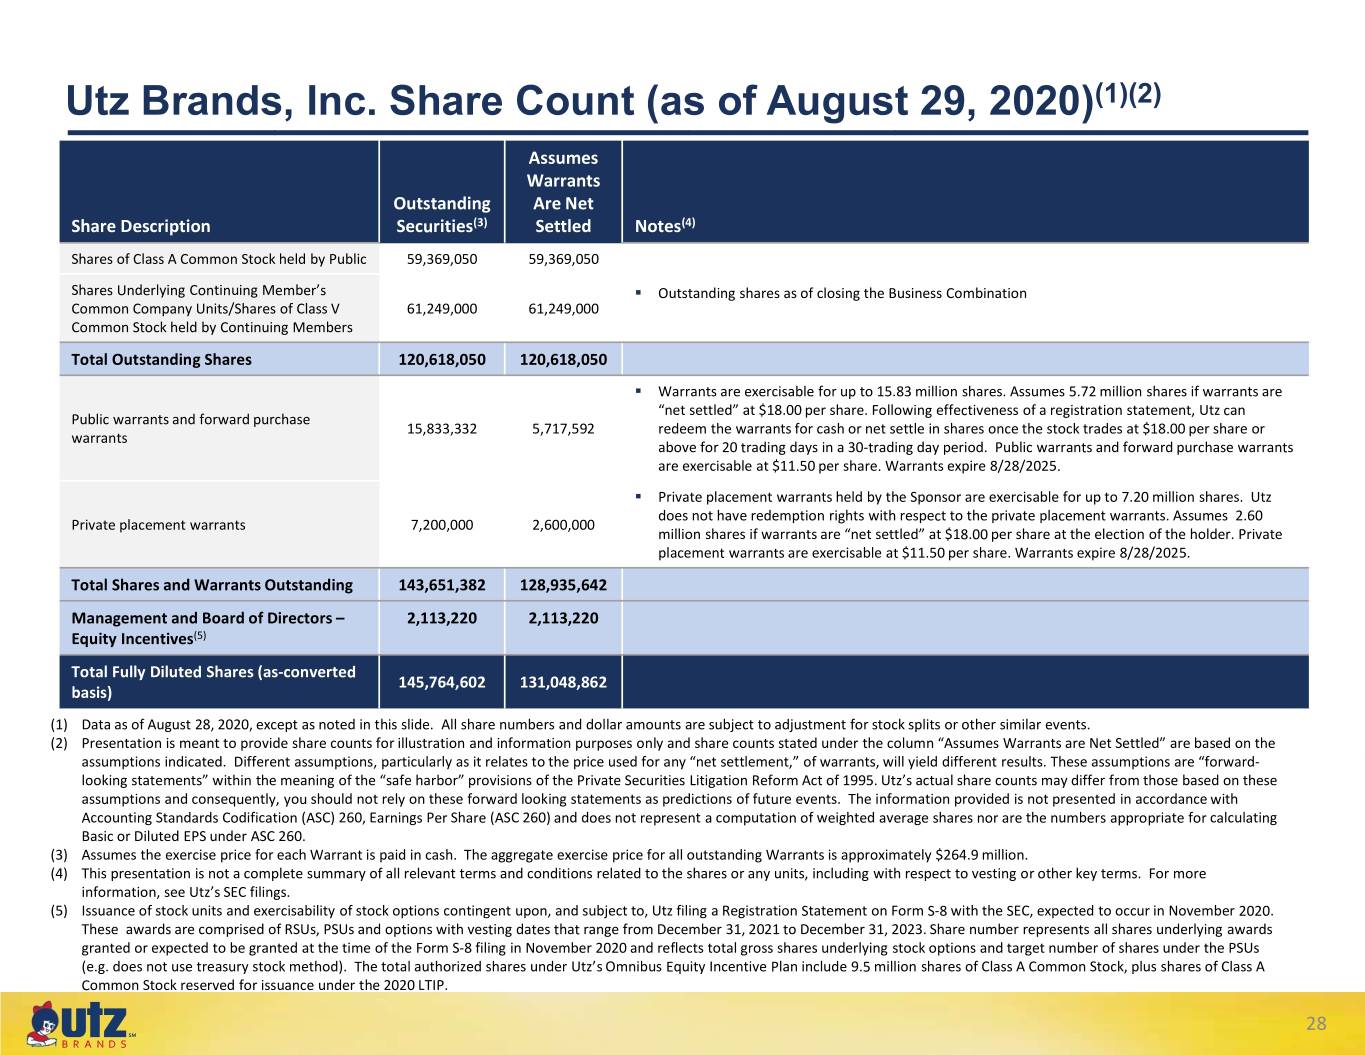
Utz Brands, Inc. Share Count (as of August 29, 2020)(1)(2) Assumes Warrants Outstanding Are Net Share Description Securities(3) Settled Notes(4) Shares of Class A Common Stock held by Public 59,369,050 59,369,050 Shares Underlying Continuing Member’s . Outstanding shares as of closing the Business Combination Common Company Units/Shares of Class V 61,249,000 61,249,000 Common Stock held by Continuing Members Total Outstanding Shares 120,618,050 120,618,050 . Warrants are exercisable for up to 15.83 million shares. Assumes 5.72 million shares if warrants are “net settled” at $18.00 per share. Following effectiveness of a registration statement, Utz can Public warrants and forward purchase 15,833,332 5,717,592 redeem the warrants for cash or net settle in shares once the stock trades at $18.00 per share or warrants above for 20 trading days in a 30-trading day period. Public warrants and forward purchase warrants are exercisable at $11.50 per share. Warrants expire 8/28/2025. . Private placement warrants held by the Sponsor are exercisable for up to 7.20 million shares. Utz does not have redemption rights with respect to the private placement warrants. Assumes 2.60 Private placement warrants 7,200,000 2,600,000 million shares if warrants are “net settled” at $18.00 per share at the election of the holder. Private placement warrants are exercisable at $11.50 per share. Warrants expire 8/28/2025. Total Shares and Warrants Outstanding 143,651,382 128,935,642 Management and Board of Directors – 2,113,220 2,113,220 Equity Incentives(5) Total Fully Diluted Shares (as-converted 145,764,602 131,048,862 basis) (1) Data as of August 28, 2020, except as noted in this slide. All share numbers and dollar amounts are subject to adjustment for stock splits or other similar events. (2) Presentation is meant to provide share counts for illustration and information purposes only and share counts stated under the column “Assumes Warrants are Net Settled” are based on the assumptions indicated. Different assumptions, particularly as it relates to the price used for any “net settlement,” of warrants, will yield different results. These assumptions are “forward- looking statements” within the meaning of the “safe harbor” provisions of the Private Securities Litigation Reform Act of 1995. Utz’s actual share counts may differ from those based on these assumptions and consequently, you should not rely on these forward looking statements as predictions of future events. The information provided is not presented in accordance with Accounting Standards Codification (ASC) 260, Earnings Per Share (ASC 260) and does not represent a computation of weighted average shares nor are the numbers appropriate for calculating Basic or Diluted EPS under ASC 260. (3) Assumes the exercise price for each Warrant is paid in cash. The aggregate exercise price for all outstanding Warrants is approximately $264.9 million. (4) This presentation is not a complete summary of all relevant terms and conditions related to the shares or any units, including with respect to vesting or other key terms. For more information, see Utz’s SEC filings. (5) Issuance of stock units and exercisability of stock options contingent upon, and subject to, Utz filing a Registration Statement on Form S-8 with the SEC, expected to occur in November 2020. These awards are comprised of RSUs, PSUs and options with vesting dates that range from December 31, 2021 to December 31, 2023. Share number represents all shares underlying awards granted or expected to be granted at the time of the Form S-8 filing in November 2020 and reflects total gross shares underlying stock options and target number of shares under the PSUs (e.g. does not use treasury stock method). The total authorized shares under Utz’s Omnibus Equity Incentive Plan include 9.5 million shares of Class A Common Stock, plus shares of Class A Common Stock reserved for issuance under the 2020 LTIP. 28 ℠
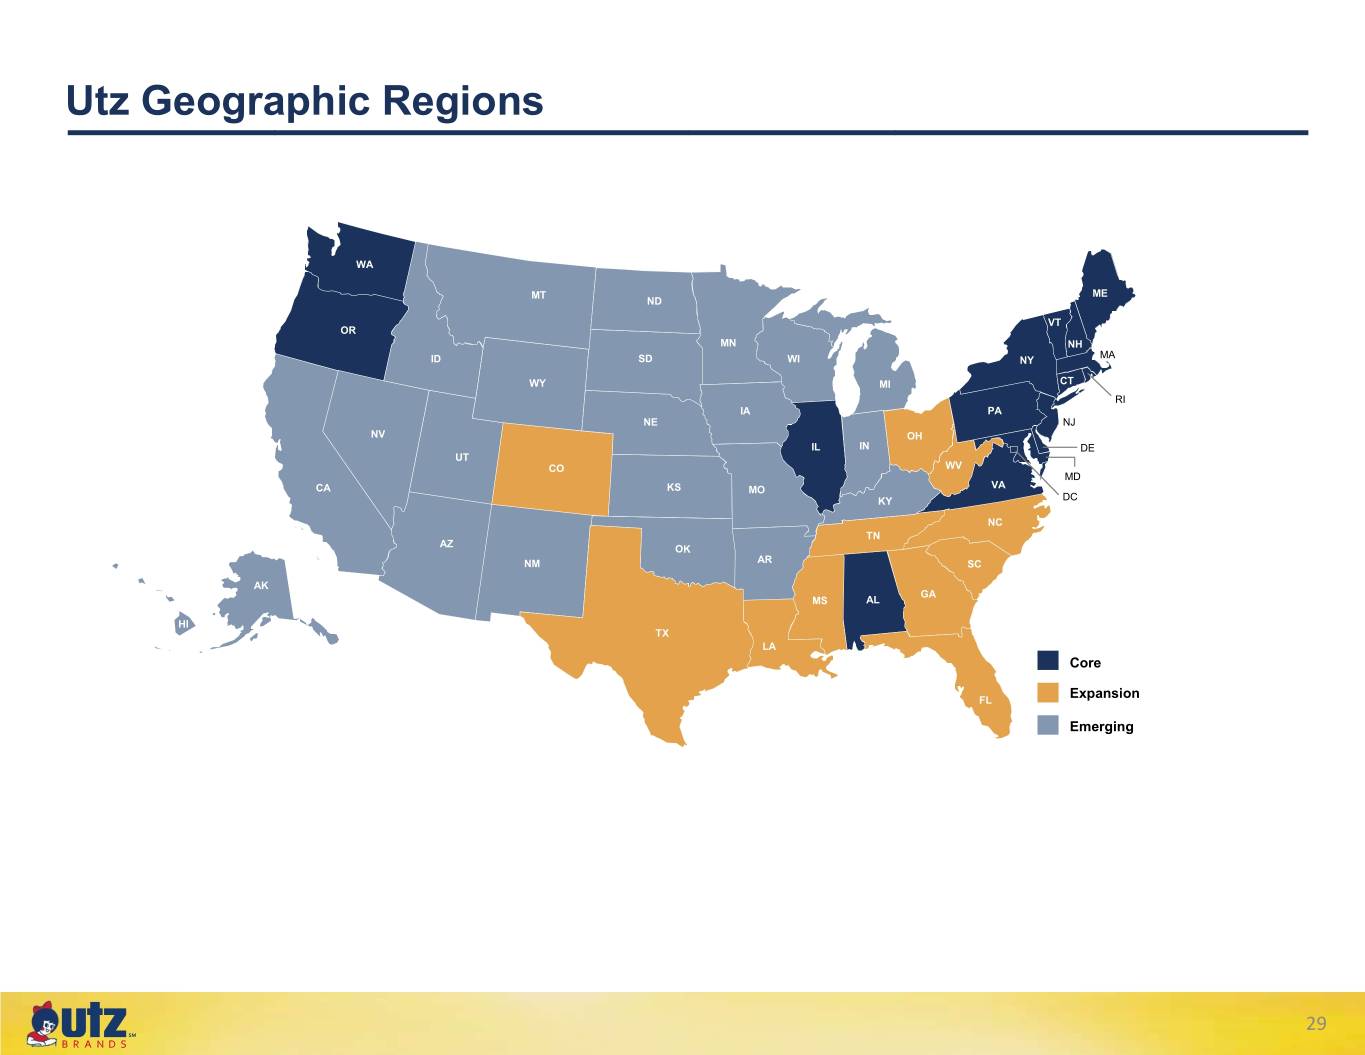
Utz Geographic Regions WA MT ME ND VT OR MN NH MA ID SD WI NY WY MI CT RI IA PA NE NJ NV OH IL IN DE UT CO WV MD CA KS MO VA KY DC NC TN AZ OK NM AR SC AK GA MS AL HI TX LA Core FL Expansion Emerging 29 ℠
