Attached files
| file | filename |
|---|---|
| 8-K - 8-K - Trinseo S.A. | tse-20201105x8k.htm |
| EX-99.1 - EX-99.1 - Trinseo S.A. | tse-20201105xex99d1.htm |
Exhibit 99.2
| ™Trademark of Trinseo S.A. or its affiliates Third Quarter 2020 Financial Results November 5, 2020 |
| 2 Disclosure Rules Cautionary Note on Forward-Looking Statements. This presentation contains forward-looking statements including, without limitation, statements concerning plans, objectives, goals, projections, strategies, future events or performance, and underlying assumptions and other statements, which are not statements of historical facts or guarantees or assurances of future performance. Forward-looking statements may be identified by the use of words like “expect,” “anticipate,” “intend,” “forecast,” “outlook,” “will,” “may,” “might,” “see,” “tend,” “assume,” “potential,” “likely,” “target,” “plan,” “contemplate,” “seek,” “attempt,” “should,” “could,” “would” or expressions of similar meaning. Forward-looking statements reflect management’s evaluation of information currently available and are based on our current expectations and assumptions regarding the impact from the Covid-19 pandemic, our business, the economy and other future conditions. Because forward-looking statements relate to the future, they are subject to inherent uncertainties, risks and changes in circumstances that are difficult to predict. Factors that might cause such a difference include, but are not limited to, those discussed in our Annual Report on Form 10-K, under Part I, Item 1A — “Risk Factors” and elsewhere in our other reports filed with the U.S. Securities and Exchange Commission. As a result of these or other factors, our actual results may differ materially from those contemplated by the forward-looking statements. Therefore, we caution you against relying on any of these forward-looking statements. The forward-looking statements included in this presentation are made only as of the date hereof. We undertake no obligation to publicly update or revise any forward-looking statement as a result of new information, future events or otherwise, except as otherwise required by law. This presentation contains financial measures that are not in accordance with generally accepted accounting principles in the US (“GAAP”) including EBITDA, Adjusted EBITDA, Adjusted Net Income, Adjusted EPS and Free Cash Flow. We believe these measures provide relevant and meaningful information to investors and lenders about the ongoing operating results and liquidity position of the Company. Such measures when referenced herein should not be viewed as an alternative to GAAP measures of performance or liquidity, as applicable. We have provided a reconciliation of these measures to the most comparable GAAP metric alongside of the respective measure or otherwise in the Appendix section of this presentation. Introductions • Frank Bozich, President & CEO • David Stasse, Executive Vice President & CFO • Andy Myers, Director of Investor Relations Introductions & Disclosure Rules |

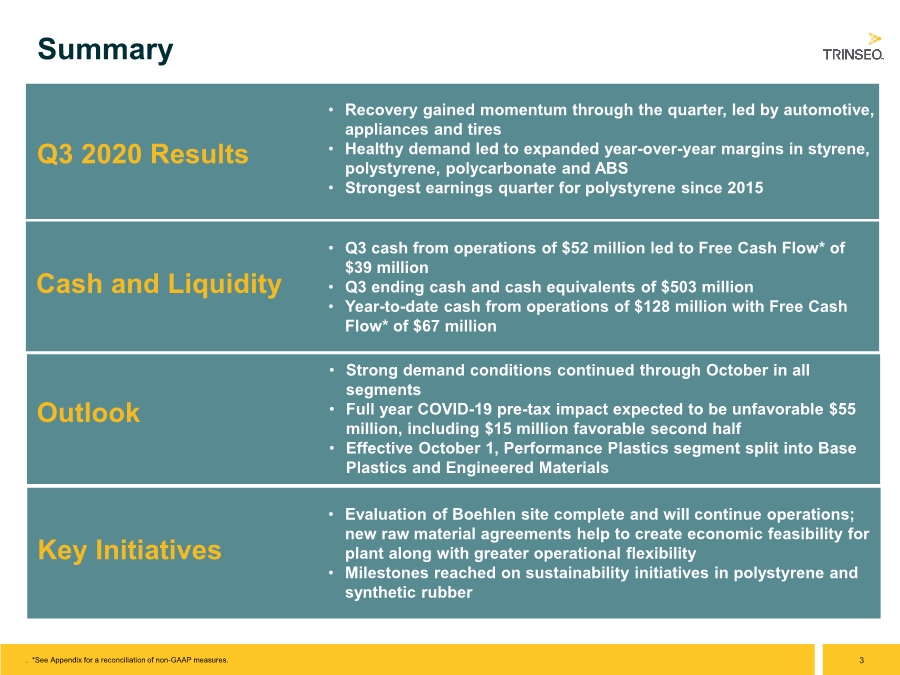
| 3 Summary • Recovery gained momentum through the quarter, led by automotive, appliances and tires • Healthy demand led to expanded year-over-year margins in styrene, polystyrene, polycarbonate and ABS • Strongest earnings quarter for polystyrene since 2015 Outlook Q3 2020 Results • Q3 cash from operations of $52 million led to Free Cash Flow* of $39 million • Q3 ending cash and cash equivalents of $503 million • Year-to-date cash from operations of $128 million with Free Cash Flow* of $67 million Cash and Liquidity • Strong demand conditions continued through October in all segments • Full year COVID-19 pre-tax impact expected to be unfavorable $55 million, including $15 million favorable second half • Effective October 1, Performance Plastics segment split into Base Plastics and Engineered Materials • Evaluation of Boehlen site complete and will continue operations; new raw material agreements help to create economic feasibility for plant along with greater operational flexibility • Milestones reached on sustainability initiatives in polystyrene and synthetic rubber Key Initiatives . *See Appendix for a reconciliation of non-GAAP measures. |
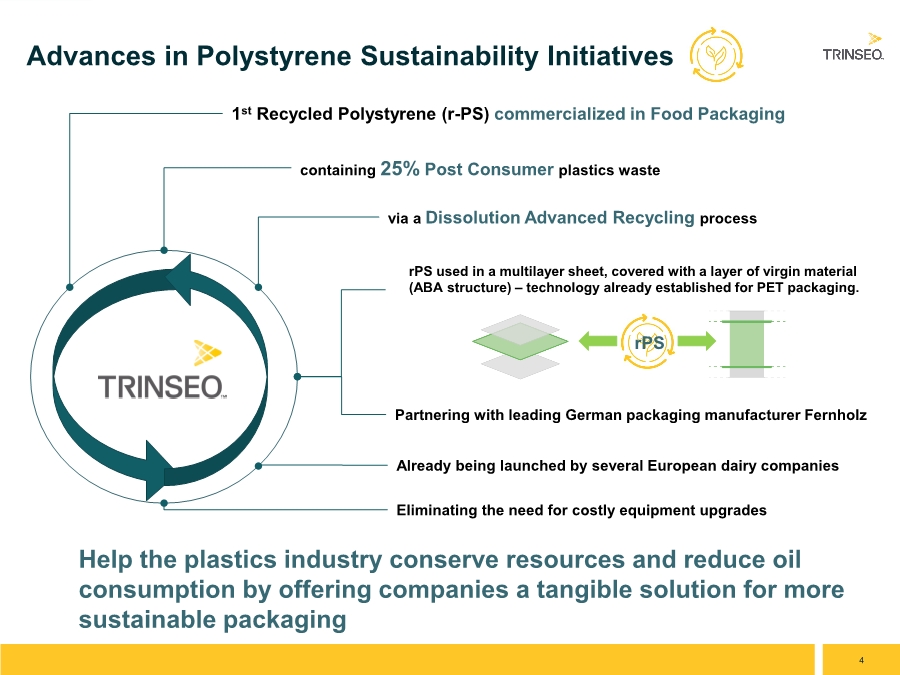
| 4 Advances in Polystyrene Sustainability Initiatives containing 25% Post Consumer plastics waste via a Dissolution Advanced Recycling process Partnering with leading German packaging manufacturer Fernholz Help the plastics industry conserve resources and reduce oil consumption by offering companies a tangible solution for more sustainable packaging 1st Recycled Polystyrene (r-PS) commercialized in Food Packaging rPS used in a multilayer sheet, covered with a layer of virgin material (ABA structure) – technology already established for PET packaging. Eliminating the need for costly equipment upgrades Already being launched by several European dairy companies rPS |
| 5 Sustainability Initiatives – TRS and Mass Balance Certification 1. Mass Balance certification from the International Sustainability & Carbon Certification (ISCC), representing the first step towards achieving true circularity in synthetic rubber • Enables cost effective, transparent tracking of sustainably advantaged materials at a large scale • Applies to polystyrene from Tessenderlo, Belgium, polycarbonate produced in Stade, Germany and synthetic rubber from Schkopau, Germany 2. Reached definitive agreement with Tyre Recycling Solutions (TRS) on a commercial collaboration and an equity investment in TRS • Collaboration in R&D to help tire manufacturers develop more sustainable tire formulations, aiding the long-term goal of creating a sustainable outlet for end-of-life tires • Provides ability to offer a circular solution to tire manufacturers with recycled tire powder content without compromising performance Two Sustainability initiatives announced in support of goal of 40% of product portfolio sustainably advantaged by 2030 |
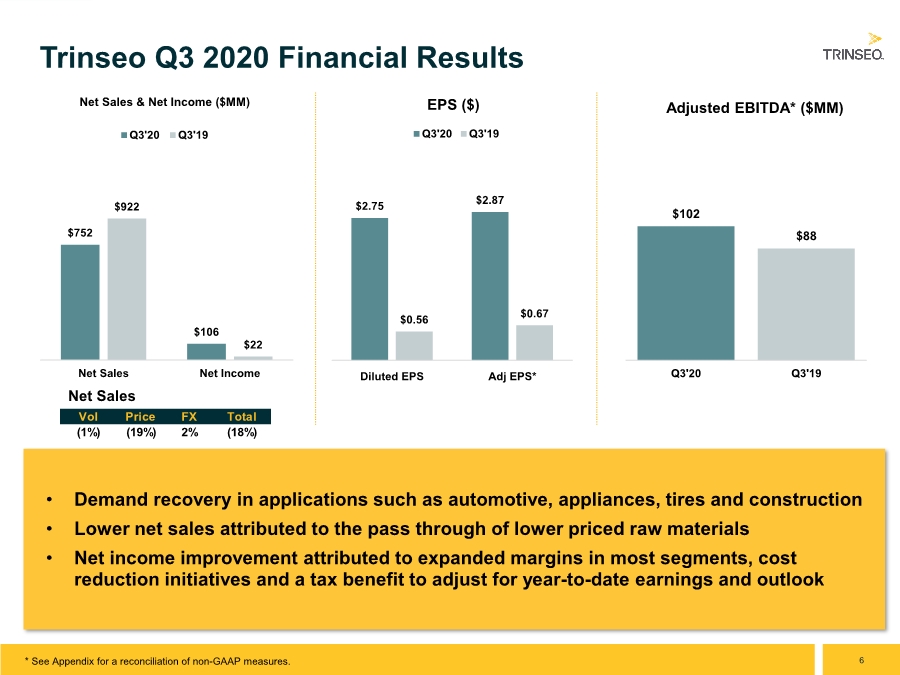
| 6 $102 $88 Q3'20 Q3'19 Adjusted EBITDA* ($MM) • Demand recovery in applications such as automotive, appliances, tires and construction • Lower net sales attributed to the pass through of lower priced raw materials • Net income improvement attributed to expanded margins in most segments, cost reduction initiatives and a tax benefit to adjust for year-to-date earnings and outlook Trinseo Q3 2020 Financial Results $2.75 $2.87 $0.56 $0.67 Diluted EPS Adj EPS* EPS ($) Q3'20 Q3'19 $752 $106 $922 $22 Net Sales Net Income Net Sales & Net Income ($MM) Q3'20 Q3'19 Net Sales Vol Price FX Total (1%) (19%) 2% (18%) * See Appendix for a reconciliation of non-GAAP measures. |
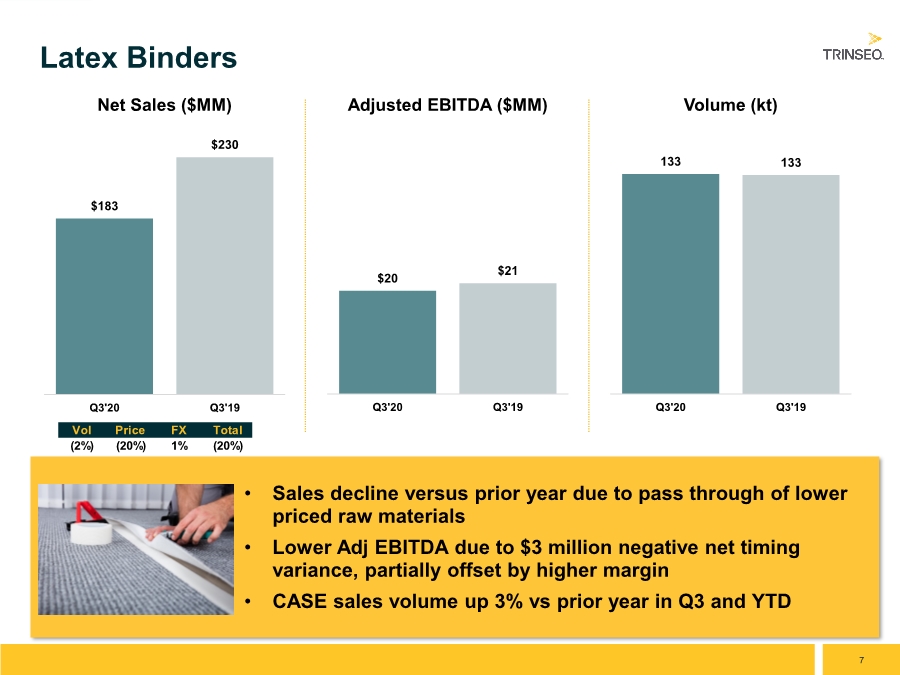
| 7 • Sales decline versus prior year due to pass through of lower priced raw materials • Lower Adj EBITDA due to $3 million negative net timing variance, partially offset by higher margin • CASE sales volume up 3% vs prior year in Q3 and YTD Latex Binders $183 $230 Q3'20 Q3'19 Net Sales ($MM) $20 $21 Q3'20 Q3'19 Adjusted EBITDA ($MM) 133 133 Q3'20 Q3'19 Volume (kt) Vol Price FX Total (2%) (20%) 1% (20%) |
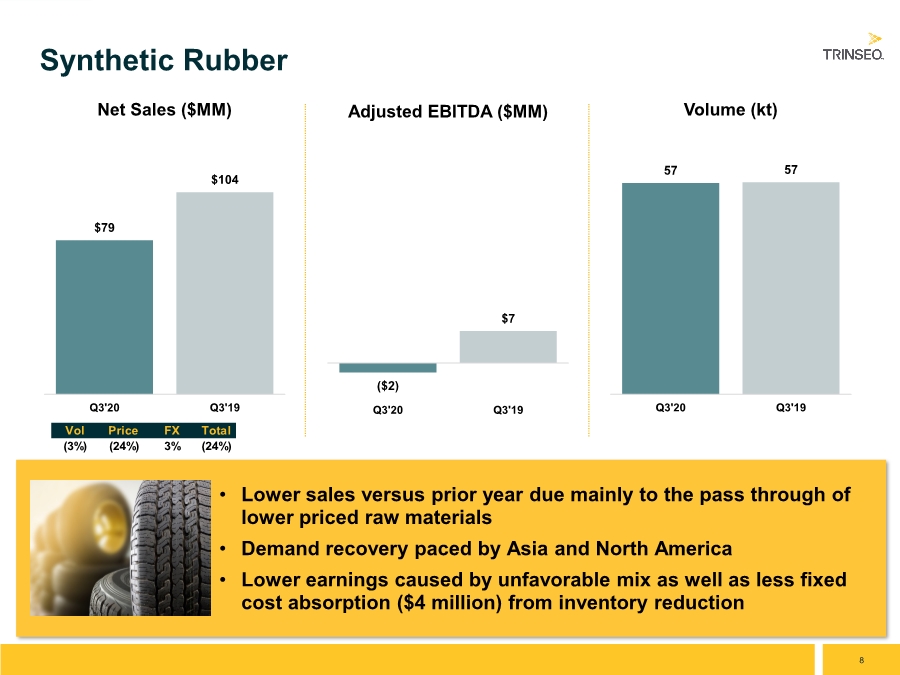
| 8 • Lower sales versus prior year due mainly to the pass through of lower priced raw materials • Demand recovery paced by Asia and North America • Lower earnings caused by unfavorable mix as well as less fixed cost absorption ($4 million) from inventory reduction Synthetic Rubber $79 $104 Q3'20 Q3'19 Net Sales ($MM) ($2) $7 Q3'20 Q3'19 Adjusted EBITDA ($MM) 57 57 Q3'20 Q3'19 Volume (kt) Vol Price FX Total (3%) (24%) 3% (24%) |
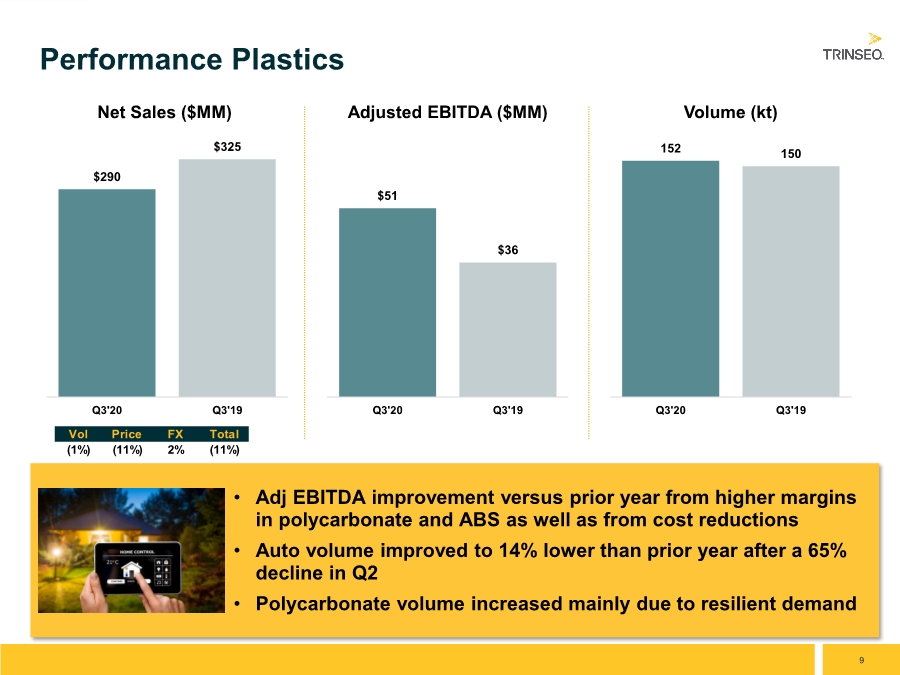
| 9 • Adj EBITDA improvement versus prior year from higher margins in polycarbonate and ABS as well as from cost reductions • Auto volume improved to 14% lower than prior year after a 65% decline in Q2 • Polycarbonate volume increased mainly due to resilient demand Performance Plastics $290 $325 Q3'20 Q3'19 Net Sales ($MM) $51 $36 Q3'20 Q3'19 Adjusted EBITDA ($MM) 152 150 Q3'20 Q3'19 Volume (kt) Vol Price FX Total (1%) (11%) 2% (11%) |
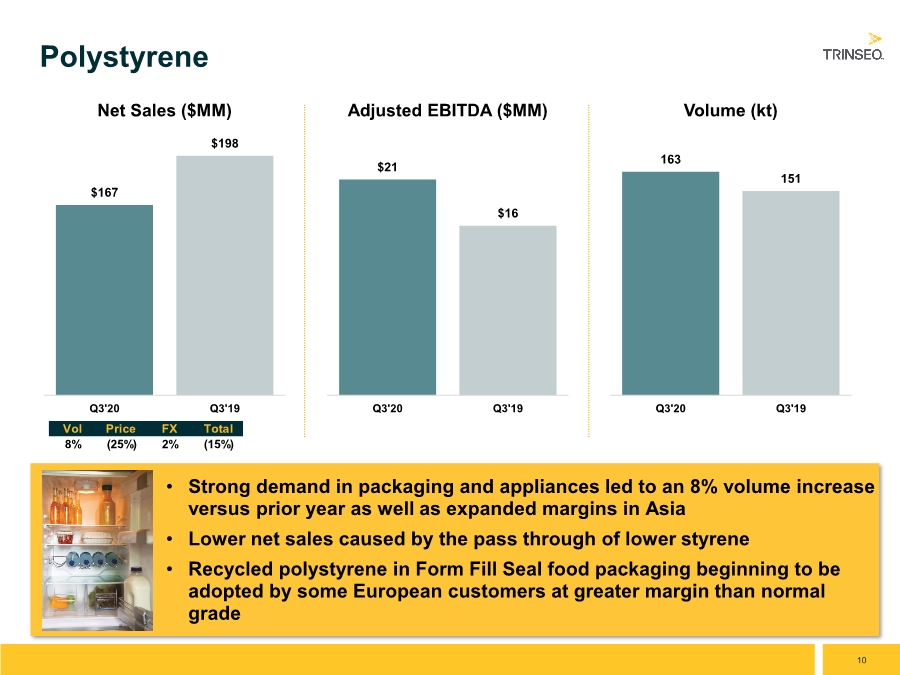
| 10 • Strong demand in packaging and appliances led to an 8% volume increase versus prior year as well as expanded margins in Asia • Lower net sales caused by the pass through of lower styrene • Recycled polystyrene in Form Fill Seal food packaging beginning to be adopted by some European customers at greater margin than normal grade Polystyrene $167 $198 Q3'20 Q3'19 Net Sales ($MM) $21 $16 Q3'20 Q3'19 Adjusted EBITDA ($MM) 163 151 Q3'20 Q3'19 Volume (kt) Vol Price FX Total 8% (25%) 2% (15%) |
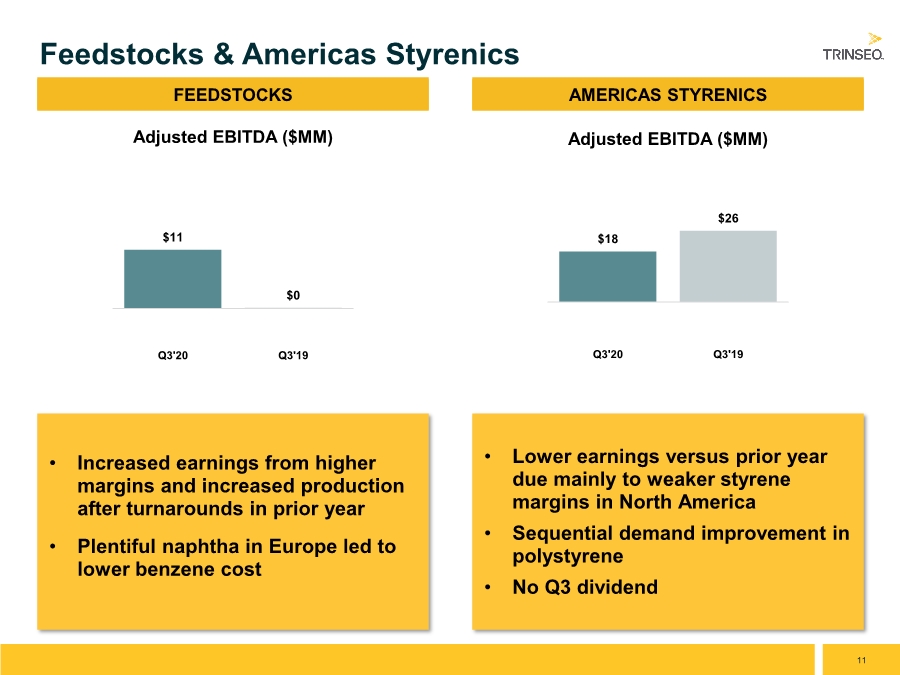
| 11 • Increased earnings from higher margins and increased production after turnarounds in prior year • Plentiful naphtha in Europe led to lower benzene cost Feedstocks & Americas Styrenics $11 $0 Q3'20 Q3'19 Adjusted EBITDA ($MM) FEEDSTOCKS • Lower earnings versus prior year due mainly to weaker styrene margins in North America • Sequential demand improvement in polystyrene • No Q3 dividend AMERICAS STYRENICS $18 $26 Q3'20 Q3'19 Adjusted EBITDA ($MM) |
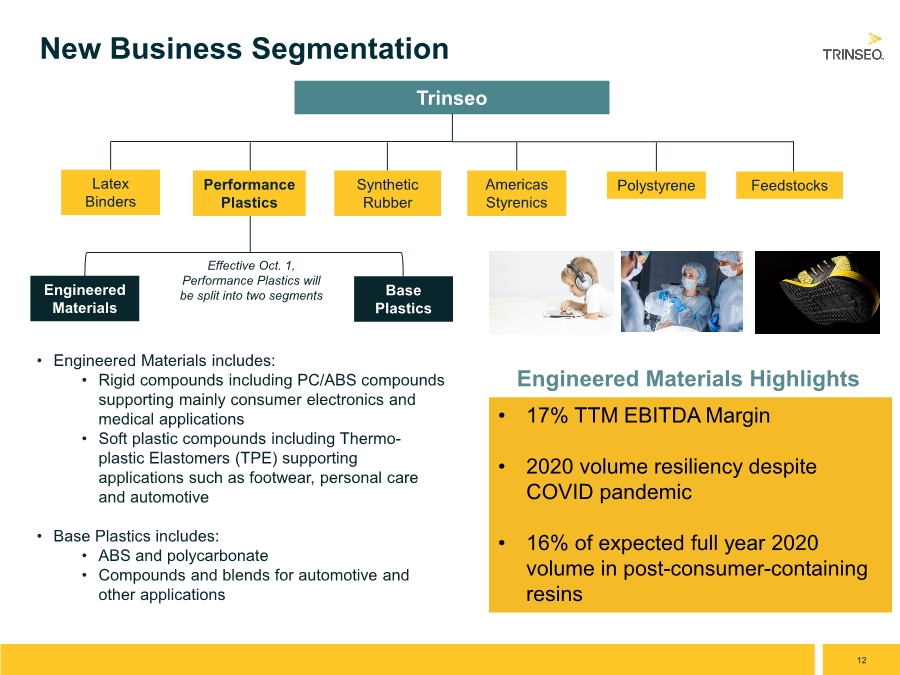
| 12 New Business Segmentation Trinseo Latex Binders Performance Plastics Synthetic Rubber Americas Styrenics Polystyrene Feedstocks Effective Oct. 1, Performance Plastics will be split into two segments Engineered Materials Base Plastics • Engineered Materials includes: • Rigid compounds including PC/ABS compounds supporting mainly consumer electronics and medical applications • Soft plastic compounds including Thermo- plastic Elastomers (TPE) supporting applications such as footwear, personal care and automotive • Base Plastics includes: • ABS and polycarbonate • Compounds and blends for automotive and other applications Engineered Materials Highlights • 17% TTM EBITDA Margin • 2020 volume resiliency despite COVID pandemic • 16% of expected full year 2020 volume in post-consumer-containing resins |
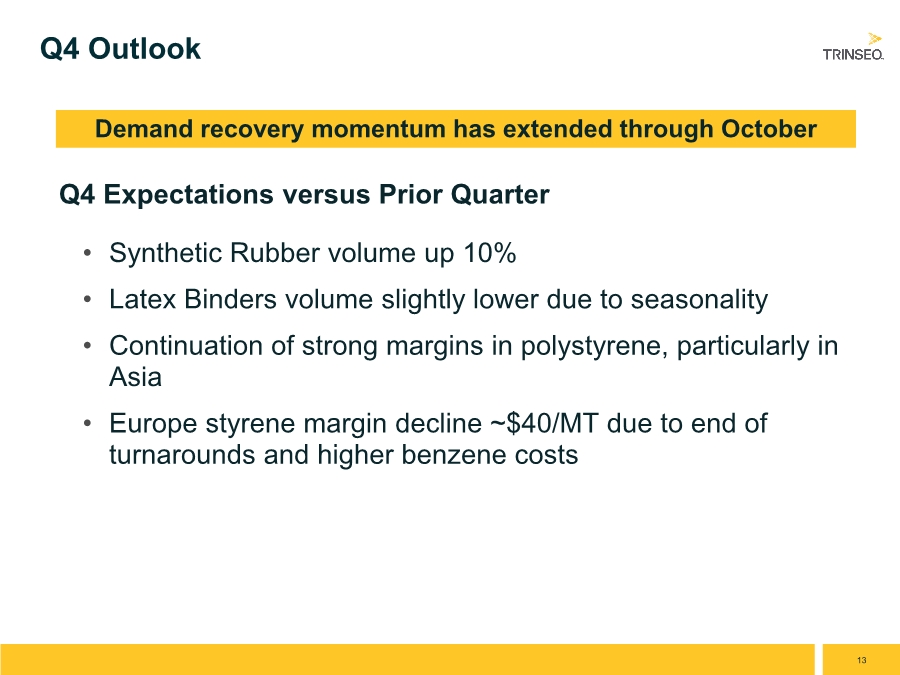
| 13 Q4 Outlook • Synthetic Rubber volume up 10% • Latex Binders volume slightly lower due to seasonality • Continuation of strong margins in polystyrene, particularly in Asia • Europe styrene margin decline ~$40/MT due to end of turnarounds and higher benzene costs Demand recovery momentum has extended through October Q4 Expectations versus Prior Quarter |
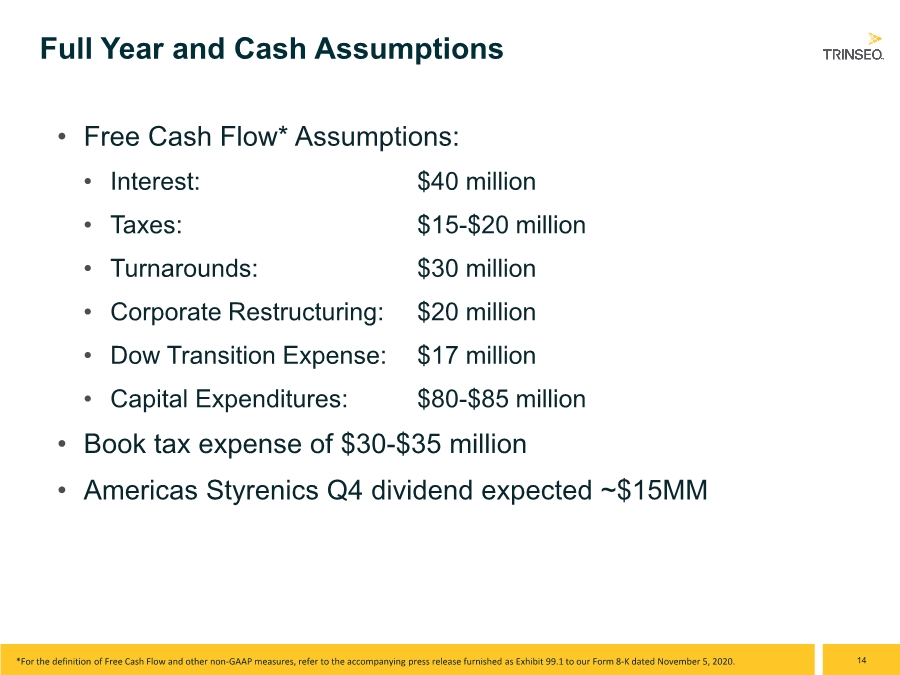
| 14 Full Year and Cash Assumptions • Free Cash Flow* Assumptions: • Interest: $40 million • Taxes: $15-$20 million • Turnarounds: $30 million • Corporate Restructuring: $20 million • Dow Transition Expense: $17 million • Capital Expenditures: $80-$85 million • Book tax expense of $30-$35 million • Americas Styrenics Q4 dividend expected ~$15MM *For the definition of Free Cash Flow and other non-GAAP measures, refer to the accompanying press release furnished as Exhibit 99.1 to our Form 8-K dated November 5, 2020. |
| 15 •Appendix |

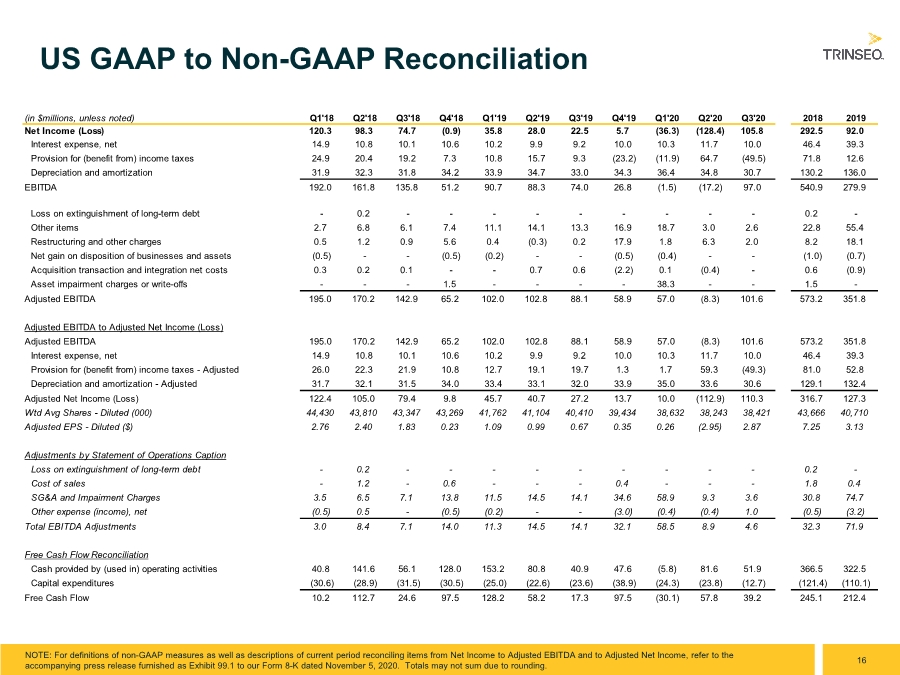
| 16 US GAAP to Non-GAAP Reconciliation NOTE: For definitions of non-GAAP measures as well as descriptions of current period reconciling items from Net Income to Adjusted EBITDA and to Adjusted Net Income, refer to the accompanying press release furnished as Exhibit 99.1 to our Form 8-K dated November 5, 2020. Totals may not sum due to rounding. (in $millions, unless noted) Q1'18 Q2'18 Q3'18 Q4'18 Q1'19 Q2'19 Q3'19 Q4'19 Q1'20 Q2'20 Q3'20 2018 2019 Net Income (Loss) 120.3 98.3 74.7 (0.9) 35.8 28.0 22.5 5.7 (36.3) (128.4) 105.8 292.5 92.0 Interest expense, net 14.9 10.8 10.1 10.6 10.2 9.9 9.2 10.0 10.3 11.7 10.0 46.4 39.3 Provision for (benefit from) income taxes 24.9 20.4 19.2 7.3 10.8 15.7 9.3 (23.2) (11.9) 64.7 (49.5) 71.8 12.6 Depreciation and amortization 31.9 32.3 31.8 34.2 33.9 34.7 33.0 34.3 36.4 34.8 30.7 130.2 136.0 EBITDA 192.0 161.8 135.8 51.2 90.7 88.3 74.0 26.8 (1.5) (17.2) 97.0 540.9 279.9 Loss on extinguishment of long-term debt - 0.2 - - - - - - - - - 0.2 - Other items 2.7 6.8 6.1 7.4 11.1 14.1 13.3 16.9 18.7 3.0 2.6 22.8 55.4 Restructuring and other charges 0.5 1.2 0.9 5.6 0.4 (0.3) 0.2 17.9 1.8 6.3 2.0 8.2 18.1 Net gain on disposition of businesses and assets (0.5) - - (0.5) (0.2) - - (0.5) (0.4) - - (1.0) (0.7) Acquisition transaction and integration net costs 0.3 0.2 0.1 - - 0.7 0.6 (2.2) 0.1 (0.4) - 0.6 (0.9) Asset impairment charges or write-offs - - - 1.5 - - - - 38.3 - - 1.5 - Adjusted EBITDA 195.0 170.2 142.9 65.2 102.0 102.8 88.1 58.9 57.0 (8.3) 101.6 573.2 351.8 Adjusted EBITDA to Adjusted Net Income (Loss) Adjusted EBITDA 195.0 170.2 142.9 65.2 102.0 102.8 88.1 58.9 57.0 (8.3) 101.6 573.2 351.8 Interest expense, net 14.9 10.8 10.1 10.6 10.2 9.9 9.2 10.0 10.3 11.7 10.0 46.4 39.3 Provision for (benefit from) income taxes - Adjusted 26.0 22.3 21.9 10.8 12.7 19.1 19.7 1.3 1.7 59.3 (49.3) 81.0 52.8 Depreciation and amortization - Adjusted 31.7 32.1 31.5 34.0 33.4 33.1 32.0 33.9 35.0 33.6 30.6 129.1 132.4 Adjusted Net Income (Loss) 122.4 105.0 79.4 9.8 45.7 40.7 27.2 13.7 10.0 (112.9) 110.3 316.7 127.3 Wtd Avg Shares - Diluted (000) 44,430 43,810 43,347 43,269 41,762 41,104 40,410 39,434 38,632 38,243 38,421 43,666 40,710 Adjusted EPS - Diluted ($) 2.76 2.40 1.83 0.23 1.09 0.99 0.67 0.35 0.26 (2.95) 2.87 7.25 3.13 Adjustments by Statement of Operations Caption Loss on extinguishment of long-term debt - 0.2 - - - - - - - - - 0.2 - Cost of sales - 1.2 - 0.6 - - - 0.4 - - - 1.8 0.4 SG&A and Impairment Charges 3.5 6.5 7.1 13.8 11.5 14.5 14.1 34.6 58.9 9.3 3.6 30.8 74.7 Other expense (income), net (0.5) 0.5 - (0.5) (0.2) - - (3.0) (0.4) (0.4) 1.0 (0.5) (3.2) Total EBITDA Adjustments 3.0 8.4 7.1 14.0 11.3 14.5 14.1 32.1 58.5 8.9 4.6 32.3 71.9 Free Cash Flow Reconciliation Cash provided by (used in) operating activities 40.8 141.6 56.1 128.0 153.2 80.8 40.9 47.6 (5.8) 81.6 51.9 366.5 322.5 Capital expenditures (30.6) (28.9) (31.5) (30.5) (25.0) (22.6) (23.6) (38.9) (24.3) (23.8) (12.7) (121.4) (110.1) Free Cash Flow 10.2 112.7 24.6 97.5 128.2 58.2 17.3 97.5 (30.1) 57.8 39.2 245.1 212.4 |
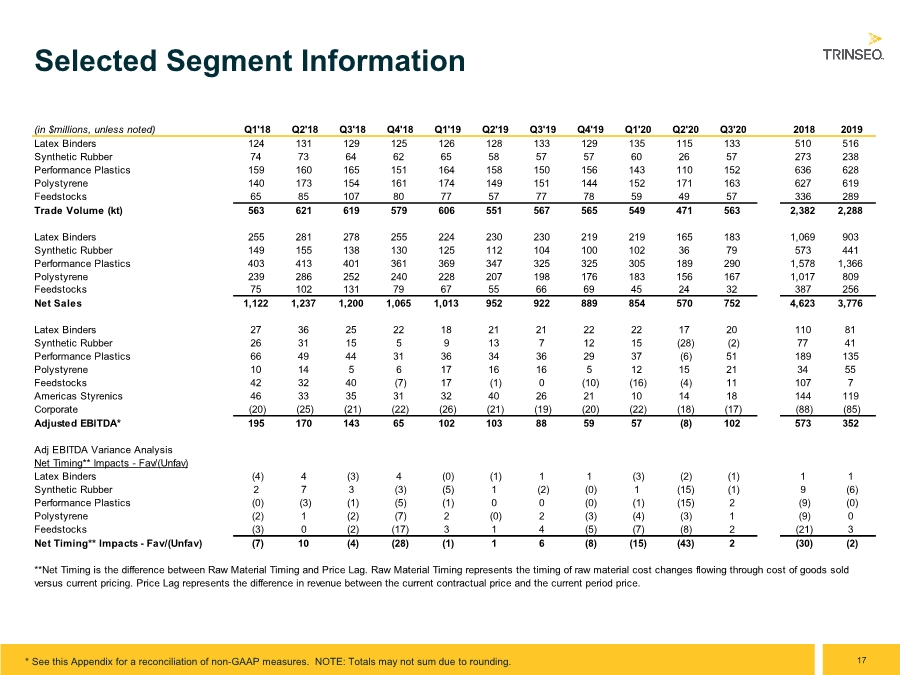
| 17 Selected Segment Information * See this Appendix for a reconciliation of non-GAAP measures. NOTE: Totals may not sum due to rounding. (in $millions, unless noted) Q1'18 Q2'18 Q3'18 Q4'18 Q1'19 Q2'19 Q3'19 Q4'19 Q1'20 Q2'20 Q3'20 2018 2019 Latex Binders 124 131 129 125 126 128 133 129 135 115 133 510 516 Synthetic Rubber 74 73 64 62 65 58 57 57 60 26 57 273 238 Performance Plastics 159 160 165 151 164 158 150 156 143 110 152 636 628 Polystyrene 140 173 154 161 174 149 151 144 152 171 163 627 619 Feedstocks 65 85 107 80 77 57 77 78 59 49 57 336 289 Trade Volume (kt) 563 621 619 579 606 551 567 565 549 471 563 2,382 2,288 Latex Binders 255 281 278 255 224 230 230 219 219 165 183 1,069 903 Synthetic Rubber 149 155 138 130 125 112 104 100 102 36 79 573 441 Performance Plastics 403 413 401 361 369 347 325 325 305 189 290 1,578 1,366 Polystyrene 239 286 252 240 228 207 198 176 183 156 167 1,017 809 Feedstocks 75 102 131 79 67 55 66 69 45 24 32 387 256 Net Sales 1,122 1,237 1,200 1,065 1,013 952 922 889 854 570 752 4,623 3,776 Latex Binders 27 36 25 22 18 21 21 22 22 17 20 110 81 Synthetic Rubber 26 31 15 5 9 13 7 12 15 (28) (2) 77 41 Performance Plastics 66 49 44 31 36 34 36 29 37 (6) 51 189 135 Polystyrene 10 14 5 6 17 16 16 5 12 15 21 34 55 Feedstocks 42 32 40 (7) 17 (1) 0 (10) (16) (4) 11 107 7 Americas Styrenics 46 33 35 31 32 40 26 21 10 14 18 144 119 Corporate (20) (25) (21) (22) (26) (21) (19) (20) (22) (18) (17) (88) (85) Adjusted EBITDA* 195 170 143 65 102 103 88 59 57 (8) 102 573 352 Adj EBITDA Variance Analysis Net Timing** Impacts - Fav/(Unfav) Latex Binders (4) 4 (3) 4 (0) (1) 1 1 (3) (2) (1) 1 1 Synthetic Rubber 2 7 3 (3) (5) 1 (2) (0) 1 (15) (1) 9 (6) Performance Plastics (0) (3) (1) (5) (1) 0 0 (0) (1) (15) 2 (9) (0) Polystyrene (2) 1 (2) (7) 2 (0) 2 (3) (4) (3) 1 (9) 0 Feedstocks (3) 0 (2) (17) 3 1 4 (5) (7) (8) 2 (21) 3 Net Timing** Impacts - Fav/(Unfav) (7) 10 (4) (28) (1) 1 6 (8) (15) (43) 2 (30) (2) **Net Timing is the difference between Raw Material Timing and Price Lag. Raw Material Timing represents the timing of raw material cost changes flowing through cost of goods sold versus current pricing. Price Lag represents the difference in revenue between the current contractual price and the current period price. |
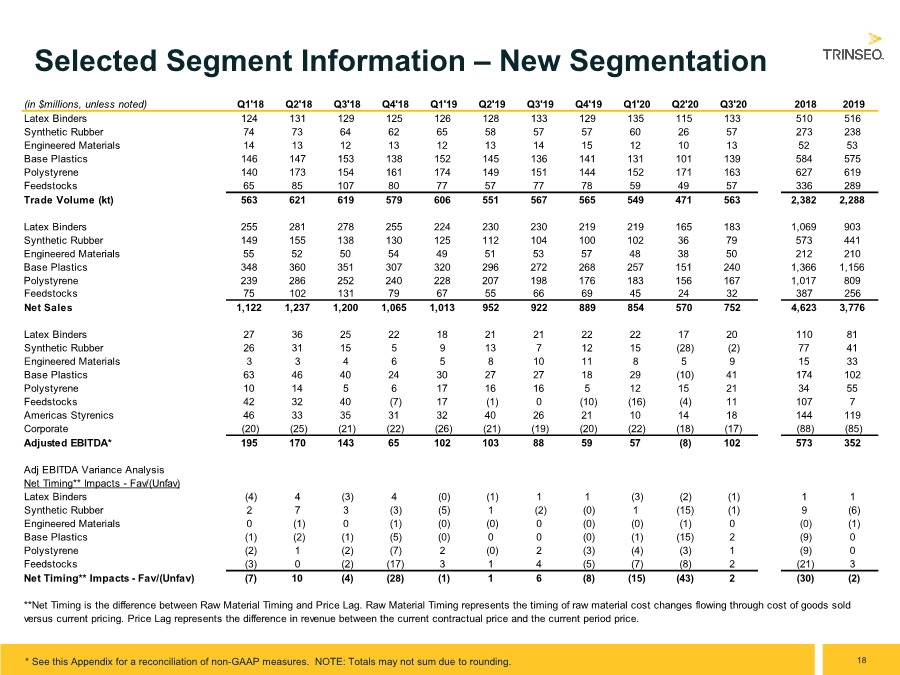
| 18 Selected Segment Information – New Segmentation * See this Appendix for a reconciliation of non-GAAP measures. NOTE: Totals may not sum due to rounding. (in $millions, unless noted) Q1'18 Q2'18 Q3'18 Q4'18 Q1'19 Q2'19 Q3'19 Q4'19 Q1'20 Q2'20 Q3'20 2018 2019 Latex Binders 124 131 129 125 126 128 133 129 135 115 133 510 516 Synthetic Rubber 74 73 64 62 65 58 57 57 60 26 57 273 238 Engineered Materials 14 13 12 13 12 13 14 15 12 10 13 52 53 Base Plastics 146 147 153 138 152 145 136 141 131 101 139 584 575 Polystyrene 140 173 154 161 174 149 151 144 152 171 163 627 619 Feedstocks 65 85 107 80 77 57 77 78 59 49 57 336 289 Trade Volume (kt) 563 621 619 579 606 551 567 565 549 471 563 2,382 2,288 Latex Binders 255 281 278 255 224 230 230 219 219 165 183 1,069 903 Synthetic Rubber 149 155 138 130 125 112 104 100 102 36 79 573 441 Engineered Materials 55 52 50 54 49 51 53 57 48 38 50 212 210 Base Plastics 348 360 351 307 320 296 272 268 257 151 240 1,366 1,156 Polystyrene 239 286 252 240 228 207 198 176 183 156 167 1,017 809 Feedstocks 75 102 131 79 67 55 66 69 45 24 32 387 256 Net Sales 1,122 1,237 1,200 1,065 1,013 952 922 889 854 570 752 4,623 3,776 Latex Binders 27 36 25 22 18 21 21 22 22 17 20 110 81 Synthetic Rubber 26 31 15 5 9 13 7 12 15 (28) (2) 77 41 Engineered Materials 3 3 4 6 5 8 10 11 8 5 9 15 33 Base Plastics 63 46 40 24 30 27 27 18 29 (10) 41 174 102 Polystyrene 10 14 5 6 17 16 16 5 12 15 21 34 55 Feedstocks 42 32 40 (7) 17 (1) 0 (10) (16) (4) 11 107 7 Americas Styrenics 46 33 35 31 32 40 26 21 10 14 18 144 119 Corporate (20) (25) (21) (22) (26) (21) (19) (20) (22) (18) (17) (88) (85) Adjusted EBITDA* 195 170 143 65 102 103 88 59 57 (8) 102 573 352 Adj EBITDA Variance Analysis Net Timing** Impacts - Fav/(Unfav) Latex Binders (4) 4 (3) 4 (0) (1) 1 1 (3) (2) (1) 1 1 Synthetic Rubber 2 7 3 (3) (5) 1 (2) (0) 1 (15) (1) 9 (6) Engineered Materials 0 (1) 0 (1) (0) (0) 0 (0) (0) (1) 0 (0) (1) Base Plastics (1) (2) (1) (5) (0) 0 0 (0) (1) (15) 2 (9) 0 Polystyrene (2) 1 (2) (7) 2 (0) 2 (3) (4) (3) 1 (9) 0 Feedstocks (3) 0 (2) (17) 3 1 4 (5) (7) (8) 2 (21) 3 Net Timing** Impacts - Fav/(Unfav) (7) 10 (4) (28) (1) 1 6 (8) (15) (43) 2 (30) (2) **Net Timing is the difference between Raw Material Timing and Price Lag. Raw Material Timing represents the timing of raw material cost changes flowing through cost of goods sold versus current pricing. Price Lag represents the difference in revenue between the current contractual price and the current period price. |