Attached files
| file | filename |
|---|---|
| EX-99.1 - EXHIBIT 99.1 - Quotient Technology Inc. | a52320388ex99_1.htm |
| 8-K - QUOTIENT TECHNOLOGY INC. 8-K - Quotient Technology Inc. | a52320388.htm |
Exhibit 99.2
Dear stockholders,
It has been a full year since we began making transformational changes to our business, and we have come a long way in that short amount of time—despite
managing through the challenges of a global pandemic. Quotient has always been a thought leader and innovator in the digital promotion and advertising markets. Now we are matching that thought-leadership with improved operations and execution. We
have been listening to our employees, customers, partners and stockholders on what we can do better. As a result, we’ve enhanced our sales processes, focused on innovating and evolving our platforms, and launched great new products. While driving
sustainable and profitable growth for the business, we have also improved our culture to make Quotient a great place to work for our employees.
Two weeks ago, we launched a brand-new product designed to make it easier for any consumer to engage with brands and take advantage of savings at any retailer
that provides an itemized receipt. If you were a user of our Coupons.com mobile app, you recently saw that app go through a significant transformation. Early consumer feedback has been fantastic, yet another example of Quotient’s position as an
industry innovator.
Last quarter, consumer-packaged goods manufacturers (CPGs) noted publicly, as well as in discussions with our teams, that they would increase promotional and
advertising spend in 2H 2020. We witnessed that increased spend with 45% revenue growth in Q3 2020 over Q2 2020. Brands, retailers and consumers are recognizing our core value proposition; CPGs are benefitting from our proprietary analytics and
closed loop measurement, resulting in solid ROIs for their marketing spend; new retailers are joining our platform and shoppers are being presented with targeted, curated offers at every step and touchpoint of their purchase journey.
|
Q3 2020 FINANCIAL RESULTS AND BUSINESS UPDATES
|
2 |
As a leadership team, we remain focused on the health and wellbeing of our global workforce, presenting our customers with best-in-class solutions, building a
strong pipeline of future business and delivering long-term, sustainable growth.
Business Update
As CPGs began to spend more in the second half of the year on promotions, brand advertising and shopper marketing, we delivered record-setting revenue results
in the third quarter of $121.1 million. On a GAAP basis, revenue growth was up 5% over Q3 2019 and up 45% over Q2 2020. We also delivered on the bottom line with an Adjusted EBITDA margin of 15.4%, the highest margin in almost two years. This is a
historical quarter for Quotient, and it demonstrates the success of our business transformation over the past year.
Throughout the third quarter, we saw a sequential monthly increase in revenues as brands started to spend more on promotions and advertising. Store
merchandising efforts between retailers and brands resumed. Additionally, traditional late summer and fall themes—such as sporting events, back-to-school and Halloween—helped drive CPG marketing spend in the quarter. While many parts of the country
continue to feel the impact of the pandemic and the increased possibility for more quarantines, our early bookings and pipeline data points to continued spending for most brands throughout the rest of the year.
As we begin the fourth quarter, October showed strength in bookings as brands and retailers continue to work together to shift more of their spend to digital.
Our pipeline remains strong with the upcoming holiday season and with growth in grocery eCommerce as catalysts for CPGs to continue spending.
|
Q3 2020 FINANCIAL RESULTS AND BUSINESS UPDATES
|
3 |
“We are placing the consumer at the center of everything we do,
leveraging our greatest assets, strengthening our partnerships, generating fuel that funds growth investments like our 30% increase in marketing spend...”
– Miguel Patricio, CEO, The Kraft Heinz Company
As noted earlier, our third quarter revenues represented quarter-over-quarter growth of 45%. Shopper behavior changed, with eCommerce increasing three times
pre-pandemic levels as more shoppers are digitally engaged than ever before. These changes provide opportunities for our business, and we continue to focus on our technology to meet new needs and demands. In addition, as our network ramped back
up to deliver more normalized volumes in Q3, our models were not optimally tuned, and we were unable to deliver the full booked promotions business that we expected would convert to revenue in the quarter. We have made adjustments to our
algorithms that immediately improved results. We expect these adjustments will benefit our business in the fourth quarter and beyond as customer demand for our solutions and platforms remains high.
We remain committed to sustainable and profitable growth, and we continue to make changes to our business that will lower costs and operational complexity to
benefit the company over the long term. In Q3, we exited a portion of the media business that had gone through a delivery and accounting change from gross to net. This change, along with our past acquisition of Ubimo, make year-over-year growth
comparisons difficult to calculate. For simplification purposes for the investment community, we are providing the following: with the exclusion of the benefit of the Ubimo acquisition as well as exiting a portion of the media business, our
year-over-year total revenue growth would be 11.6% overall and media revenue growth would be 27.5%.
|
Q3 2020 FINANCIAL RESULTS AND BUSINESS UPDATES
|
4 |
Retail Partnerships
With a strategic focus on new and expanding retail partnerships, our network continues to grow. Retailers have an immediate need for digital strategies
in order to drive sales, build on their brand loyalty and engagement and better compete in a highly fragmented retail landscape. With Quotient’s broad network and collaborative approach, retailers are able to garner a greater share of CPG
digital spend in their business in a highly engaging way for consumers.
Rite Aid, a national chain of 2,400 drug stores across 18 states with $22 billion in total annual sales, launched Rite Aid Performance Media in
partnership with Quotient in October. This partnership enables brands to execute targeted digital media campaigns to Rite Aid customers to drive in-store and online conversion. Powered by our leading edge technology and analytics, CPGs have
the opportunity to reach targeted audiences of Rite Aid customers across Rite Aid-owned and -operated digital properties, social media platforms, offsite programmatic display and digital-out-of-home (DOOH) channels. CPGs benefit from
Quotient’s closed-loop measurement and fully transparent performance across their marketing campaigns. As consumers receive curated content and brands see tangible results, the Rite Aid / Quotient partnership is expected to drive incremental
sales and generate a new alternative revenue stream for Rite Aid.
HyVee, a chain of 265 supermarkets and convenience stores in the Midwestern U.S. with more than $10 billion in total annual sales (and another retail
partnership we signed in Q2 2020), is now live on our Retailer iQ platform. Through this platform, HyVee is able to deliver incremental savings and rewards to consumers during a time when stretching dollars matters most. We look forward to
HyVee going live with our Retail Performance Media (RPM) offering in the near future to enhance their solution set and offer a comprehensive promotional and media platform benefitting all parties: HyVee, their brands, and most importantly,
their shoppers.
|
Q3 2020 FINANCIAL RESULTS AND BUSINESS UPDATES
|
5 |
In Q3 2020, Ahold Delhaize USA and Peapod Digital Labs launched their self-service sponsored search platform powered by Quotient. This new platform gives
CPGs’ digital, eCommerce and search teams always-on access to initiate, track and optimize campaigns. It also allows CPGs to directly manage and optimize placement with near real-time measurement tools. CPGs can now work across each of
Ahold’s local banners to optimize search ads for customers—whenever, wherever and however they choose to shop.
We continue to see interest from retailers looking to leverage our platforms and solutions to meet the demands of digitally influenced consumers. We’re
also seeing interest from retailers in new verticals outside of our traditional core grocery, drug, mass merchant, dollar, club and convenience channels. We provide a closed loop experience that is cost efficient and profitable for retailers
while increasing sales for brands.
Quotient Wins MarTech Breakthrough Marketing Innovation Award
Our solutions continue to receive accolades, further demonstrating the strength of our market-leading position. Our Social-Influencer solution was
recently presented with the prestigious MarTech Breakthrough Marketing Innovation award.
 |
 |
|
Q3 2020 FINANCIAL RESULTS AND BUSINESS UPDATES
|
6 |
This solution drives results while striving to make marketing more meaningful and engagement more enticing by matching shoppers with meaningful
influencer content catered specifically to them. Even in these unprecedented times, our agility affords us the ability to support audiences with relevant and inspiring content through data-driven insights, our curated network of over 10,000
trusted micro influencers and measurable impressions through social media to best predict success. Notably, revenue from our social offerings grew 28% in Q3 2020 as compared to the third quarter last year.
Products and Automation
As more marketing dollars shift to digital channels, Quotient continues to innovate on behalf of our key constituents: brands, retailers and consumers.
With our proprietary first-party data, exclusive second-party purchase data and large-scale national network, we bring data, measurement and insights to retailers and brands across today’s important marketing channels.
Digital Out of Home: DOOH creates an ideal channel
for brand advertisers as they look for more efficient ways to get in front of consumers. We recently announced expanded inventory for our DOOH offering, which now includes over 35,000 screens in 20+ retailers available in-store that can be
accessed directly through Quotient’s programmatic digital media buying and planning solutions. Using a near real-time data approach, our DOOH offering allows brands to measure campaign effectiveness, make quick changes as needed and
dynamically connect with consumers in digital display channels in ways that were not possible before.
|
Q3 2020 FINANCIAL RESULTS AND BUSINESS UPDATES
|
7 |
 |
 |
Flexibility, reliable ROI measurement and audience-based targeting allow our DOOH solution to be another effective digital tool for our customers,
enabling them to reach the right audiences at the right time and place—all powered by data.
Expanding our distribution in DOOH to in-store, brand advertisers have the ability to influence consumers right at the point of purchase. Since Q1,
we have seen increase in demand for our DOOH product more than double—even amid lower traffic patterns under pandemic-related quarantines. We expect our pipeline for this solution to continue to grow.
National Rebates Platform: We recently launched
National Rebates through the Coupons.com app. Through the Coupons.com app, consumers have more choice in how and where they save, at a time when value and convenience are increasingly important. Addressing the needs of consumers and
brands alike, Quotient’s National Rebates platform offers a brand-first, retailer-agnostic experience to our 20 million+ monthly users within the Coupons.com network. This solution also now allows brands to execute their promotions in one
place with consistent data and measurement. We are already seeing strong interest for this offering from brands.
|
Q3 2020 FINANCIAL RESULTS AND BUSINESS UPDATES
|
8 |
Shift to Digital Continues
In a recent eRetail report by Merkle,
85% of CPGs said they are planning to move more marketing dollars to retail media networks. Additionally, 52% said they plan to do so within the next year. The report also noted that retailers have identified digital media networks as a
critical growth area to create more personalized experiences for their customers. The primary opportunity, as noted in the report, lies in partnerships as retailers leverage technology and relationships with CPG brands. This data and
commentary directly supports Quotient’s strategic positioning that leverages our technology and knowledgeable sales and data teams, along with multi-channel offerings, to bring solutions to brands and retailers that cannot be accomplished
by a stand-alone retailer offering. Quotient’s RPM provides the benefits of driving sales and increased customer loyalty with the cost efficiencies of strategically partnering with a market leader for best-in-class technology, ROI
measurement and expertise. Additionally, retailers benefit almost immediately from a high-margin alternative revenue stream.
Growth in eCommerce channel: Incisiv, in collaboration with Mercatus,
recently projected that online grocery will account for 21.5% of total grocery sales by 2025, or $250 billion, a more than 60% increase over pre-pandemic estimates.
The growth in online sales attracts digital marketing spend to our network. As more shoppers purchase groceries online, it becomes increasingly
important for CPGs to promote and market their products at the point of purchase. We deliver targeted content to the consumer across channels in the path to purchase. This includes before, during and after the shopping experience as well as
across touchpoints—whether online through eCommerce or in-store channels. The number of brands who ran a sponsored search campaign increased 30% in the third quarter compared to the second quarter 2020. With more retailers going live with
our offering, and more retailers looking to our overall platforms and solutions, we expect this growth to continue.
|
Q3 2020 FINANCIAL RESULTS AND BUSINESS UPDATES
|
9 |
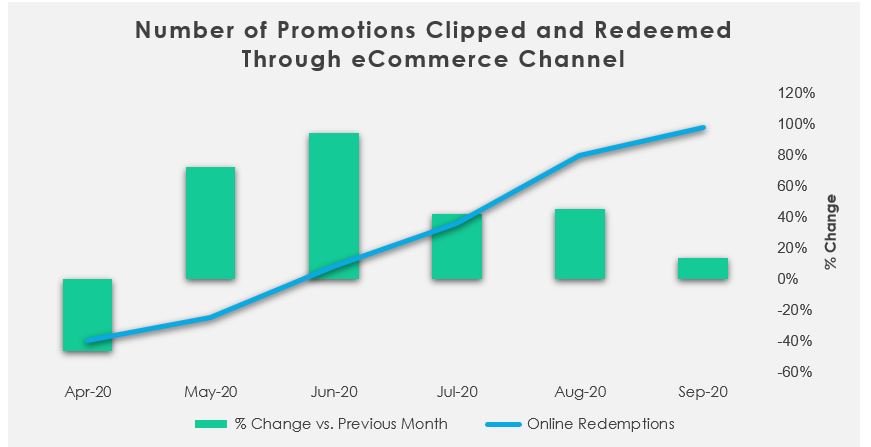
As illustrated in the graph below, the number of redemptions from our eCommerce channel increased 220% over Q2 2020 as strength in online grocery
sales continued. We believe shoppers will move toward mixed-mode shopping over time, where they combine in-store purchases with online purchases. In-store purchasing allows shoppers to optimize for choice and still enjoy tactile product
discovery, and eCommerce purchasing drives efficiency and convenience. Quotient enables retailers and CPGs to engage with shoppers through all channels with consistent, targeted messaging.
“…we’ve increased marketing spending, with a significant
shift to where consumers are increasingly spending their time, including digital marketing and e-commerce.”
– Jeff Harmening, Chairman & CEO,
General Mills, Inc.
|
Q3 2020 FINANCIAL RESULTS AND BUSINESS UPDATES
|
10 |
Quotient Promotions:
The shift from offline paper coupons to digital continues to be a growth driver as we begin to see more brands and retailers adopt strategies and
roadmaps for exiting the FSI. In a recent Wall Street Journal article, Walgreens noted that their
digital redemptions are up about 80% over the past year. They also suspended their weekly print circulars, opting to publish online-only circulars going forward. We continue to see these trends throughout the retail industry, which we
believe are catalysts for growth in our promotion business as the shift from offline printed promotions to digital continues.
In addition to the overall shift from offline to digital, economic concerns over jobless rates have shifted shopper attitudes. According to a recent survey by Nielsen, financial stability remains a looming question for 46% of Americans. The
report also noted that consumers are pursuing new shopping strategies to make each dollar stretch further by seeking out discounts and promotions and increasing their reliance on eCommerce. Lastly, the report comments that this group
of consumers are less familiar with stretching dollars. Therefore, retailers and brands need to make it easier to find information on deals and lower prices by leveraging communications such as digital campaigns and social media.
Digital coupons remain one of the most effective and efficient ways for CPGs to spend marketing dollars to drive sales.
“We’ve cut down on our print circular…And we continue
to migrate from print to digital to engage and drive growth within our key consumer segments.”
– James Joseph Peters, COO, Rite
Aid Corporation
|
Q3 2020 FINANCIAL RESULTS AND BUSINESS UPDATES
|
11 |
Retail Performance Media: eCommerce sales
and shopper engagement continue to be a main focus for both brands and retailers who want to increase sales and market share. Quotient’s RPM gives retailers an advantage in the market by providing them with a powerful digital
platform offering high-performing, targeted marketing solutions that result in increased sales and incremental revenues to the retailer without the cost and time of building out their own platform. In addition, we provide industry
expertise—such as our experienced sales force and a data analytics team—to deliver outcomes that are mutually beneficial for both retailers and brands.
With Quotient’s RPM platform in place, retailers are eager to utilize and further build out their digital strategies with CPGs for more
effective and measurable campaigns. This is evidenced by two more retailers adding our comprehensive platform to their solution set. All parties benefit with RPM: CPGs take advantage of our near-real time purchase data to make quick
decisions mid-campaign and see measurable results, retailers increase shopper engagement and receive high margin dollars, and shoppers receive personalized content and targeted savings.
Join Us for Investor Day
We believe we are well positioned to take advantage of market trends that favor digital promotions and marketing. We are still in the early
stages of a large and growing opportunity in front of us, and we look forward to sharing more with you at our upcoming Virtual Investor Day on November 19, 2020. Please register here to receive more details.
In Summary
Innovation, market leadership and reliable ROIs on marketing spend continue to be key pillars of our strategy as we move along on our journey
to boost our visibility in the market; manage costs appropriately; improve internal processes; invest in our culture
|
Q3 2020 FINANCIAL RESULTS AND BUSINESS UPDATES
|
12 |
and most importantly, deliver for our brands, retailers and shoppers during a time when they need it most.
Market dynamics continue to accelerate the shift from offline to digital, providing a tailwind for our business. Additionally, our CPG
customers and retail partners are working closely with us to strategically focus on their businesses—which is resulting in a continued strong bookings pipeline moving into Q4 as well as 1H 2021. However, the pandemic still
represents a challenge globally. Parts of our country are experiencing spikes and, in some areas, another round of closures. With the effects of these factors unknown, we have chosen to revise our guidance, now expecting
revenue in the second half of the year to be up by 30% over the first half.
Our dedicated team continues to perform at a high level, and we are appreciative of the contribution by every person at Quotient each day
to make our company a success, keep us at the forefront of change and maintain market leadership in our industry. We look forward to the future and are excited to finally see the vision we created taking hold as the
acceleration of the shift to digital is here.
Sincerely,
 |
 |
|
Steven Boal
|
Pamela Strayer
|
|
Chief Executive Officer
|
Chief Financial Officer
|
|
Q3 2020 FINANCIAL RESULTS AND BUSINESS UPDATES
|
13 |
Financial Review
Third Quarter 2020 Summary Results
|
•
|
We delivered revenue of $121.1 million, up 5% over Q3 2019 and up 45% over Q2 2020 on a GAAP basis.
|
|
•
|
Organic revenue growth was 11.6% over Q3 2019 excluding the acquisition of Ubimo and the elimination of a portion of our media
business.
|
|
•
|
GAAP gross margin was 39.2%, compared to 38.6% in Q3 2019.
|
|
•
|
Non-GAAP gross margin was 46.2%, compared to 43.6% in Q3 2019.
|
|
•
|
GAAP operating expenses were 39.6% of revenue, compared to 45.4% of revenue in Q3 2019.
|
|
•
|
Non-GAAP operating expenses were $39.1 million and 32.3% of revenue, compared to the prior year of $38.4 million and 33.5% of
revenue.
|
|
•
|
We recorded a GAAP net loss of $4.2 million, compared to a net loss of $10.4 million in Q3 2019. The decrease in GAAP net loss
from the prior year is due primarily to higher revenues and lower operating expenses due to a $4.2 million restructuring charge in Q3 2019. Net Loss Per Share in the quarter was $0.05 compared to $0.12 in Q3 2019.
|
|
•
|
Adjusted EBITDA was $18.7 million, representing a 15.4% margin.
|
|
Q3 2020 FINANCIAL RESULTS AND BUSINESS UPDATES
|
14 |
Revenue Details
We delivered $121.1 million of revenue in Q3 2020, up from $114.8 million in the prior year, as CPGs increased spend in digital media
and promotions on our platform.
Media revenue was up 11.3% in the third quarter over last year, primarily driven by our programmatic display and social display
solutions. Sponsored product search and DOOH, although still smaller offerings in our portfolio of solutions, also continued to contribute growth in the third quarter. The organic growth rate for media was 27.5% compared to
the prior year quarter. This organic growth rate excludes the Ubimo acquisition completed in Q4 2019 as well as Q3 2019 revenues from the portion of the media business we exited in Q3 2020.
Promotion revenue increased 1% over last year driven by specialty retail and digital paperless, which grew 4% and 1% respectively. This
was offset by digital print, which was down 1% year over year.
Q3 2020 customer cohorts remained flat year over year with growth of 8% in our 21-40 cohort offset by a revenue decline of 2% in our
top 20 cohort. We believe spending by several customers in our top 20 cohort remains flat to down over the prior year primarily due to supply chain concerns lingering from the impact of the pandemic. On a quarterly basis,
revenue from our customer cohorts grew 2% in Q3 2020 over Q2 2020 driven by increased spend from CPGs and retailers.
Gross Margin
Non-GAAP gross margin excludes stock-based compensation expense, amortization of acquired intangible assets and loss contingency related
to a contract dispute resulting from a retailer’s failure to perform certain obligations related to a guaranteed distribution fee arrangement.
|
Q3 2020 FINANCIAL RESULTS AND BUSINESS UPDATES
|
15 |
GAAP gross margin in the third quarter was 39.2%, up 60 basis points compared to the same quarter last year. This increase was due to
product mix along with the benefits from the acquisition of Ubimo, offset by an increase in fixed costs and amortization on intangible assets.
Non-GAAP gross margin in Q3 2020 was 46.2%, up 260 basis points compared to 43.6% in Q3 last year. This increase was driven primarily
by product mix and the benefits from the acquisition of Ubimo, partly offset by increased headcount costs. Non-GAAP gross margin declined quarter
over quarter by 100 basis points. Compared to Q2 2020, Non-GAAP gross margin declined due to product mix, partly offset by a benefit of 400 basis points from increased leverage in fixed costs in cost of revenues.
Operating Expenses
Non-GAAP operating expenses exclude stock-based compensation, the change in fair value of contingent consideration, amortization of
acquired intangible assets, certain acquisition related costs and restructuring charges.
We continued to manage costs and invest where appropriate while driving greater efficiencies in the business. Operating expenses
continue to benefit from temporarily low variable compensation and travel expenses resulting from the global pandemic. These savings are expected to temporarily reduce operating expenses by approximately $12.6 million for
the full fiscal year 2020. We expect bonus expense to return to target levels in 2021, which will result in higher compensation costs next year, even without taking additional headcount growth into consideration.
GAAP operating expenses decreased by $4.2M over the prior year. This decrease is primarily due to a one-time restructuring charge
realized in Q3 2019. On a quarter-over-quarter basis, operating
expenses decreased by $0.5M due primarily to a decrease in the fair value of contingent consideration, partially offset by increases in R&D expense from headcount growth.
|
Q3 2020 FINANCIAL RESULTS AND BUSINESS UPDATES
|
16 |
Non-GAAP operating expenses increased slightly by $0.7M compared to Q3 2019, primarily due to our Ubimo acquisition, and other
increases in headcount offset by a decrease in travel expenses, variable compensation and other expenses related to the global pandemic.
Adjusted EBITDA
Adjusted EBITDA excludes interest expense, income taxes, depreciation and amortization; the change in fair value of contingent
consideration; stock-based compensation; charges for certain acquisition related costs; loss contingency related to a contract dispute resulting from a retailer’s failure to perform certain obligations related to a guaranteed
distribution fee arrangement; restructuring charges and other (income) expense, net.
We reported $18.7 million of Adjusted EBITDA in the third quarter 2020. This was driven by our increased revenues compared to the prior
year while operating expenses remained low due to savings in travel and variable compensation.
Balance Sheet and Cash Flow
We continue to focus on maintaining a strong balance sheet,
delivering higher than expected cash flow from operations in Q3 2020 of $5.2 million. This was primarily driven by strong collections and lower payments on accounts payable.
We ended Q3 with $209.9 million in cash and cash equivalents, down approximately $2.0 million from the prior quarter.
|
Q3 2020 FINANCIAL RESULTS AND BUSINESS UPDATES
|
17 |
Looking Forward
As noted above, we look forward to discussing our long-term financial model with you at our Investor Day. We continue to make
improvements in our gross margins through streamlined operations and automation. However, product mix still remains the biggest variable in gross margin predictability. Over time, we do see this becoming less of a hurdle with the work we are doing internally. We will provide more detail on November 19th.
We also continue to prioritize investments to meet the changing business environment while staying agile throughout the year to
maintain our market-leading position. We anticipate non-GAAP operating expenses for the fourth quarter to be approximately $42 million to $44 million.
We remain focused on maintaining a strong balance sheet with cash flow from operations in Q3 coming in higher than expected. We expect
revenue to remain strong in Q4 and are also forecasting continued strong operating cash flows through the end of the year from our improved internal sales and financial operations processes and continued focus on timely
collections.
Business Outlook
For the fourth quarter of 2020, we expect revenue to be in the range of $115.0 million to $125.0 million. Predicting the mix of revenue between promotion and media remains difficult at this time.
For the fourth quarter of 2020, we expect Adjusted EBITDA to be in the range of $10.0 million to $15.0 million.
For the full year 2020, we expect revenue to be in the range of $418.0 million to $428.0 million.
|
Q3 2020 FINANCIAL RESULTS AND BUSINESS UPDATES
|
18 |
Adjusted EBITDA for the full year 2020 is expected to be in the range of $38.0 million to $43.0 million.
We expect weighted average diluted shares outstanding for 2020 to be approximately 92.0 million.
Upcoming Events
Quotient will be participating in the following events:
|
•
|
RBC’s Virtual Technology Conference, November 17, 2020
|
|
•
|
Quotient Virtual Investor Day, November 19, 2020
|
|
•
|
Oppenheimer Virtual NDR, November 20, 2020
|
Earnings Webcast
Quotient will host a conference call and
live webcast today at 2:00pm PST to discuss the third quarter 2020 financial results. To listen to a live audio webcast, please visit Quotient’s Investor Relations website at investors.quotient.com. A replay of the webcast will be available at the same website. You may also access the call and register with a live operator by dialing (866)
270-1533, or outside the U.S. (412) 317-0797, at least 15 minutes prior to the 2:00 p.m. PST start time.
About Quotient Technology Inc.
Quotient Technology (NYSE: QUOT) is the leading digital
promotions, media and analytics company that delivers personalized digital coupons and ads informed by proprietary shopper and online engagement data to millions of shoppers daily. We use our proprietary Promotions, Media,
Audience and Analytics Platforms and services to seamlessly target audiences; optimize performance; and deliver measurable, incremental sales for CPG and retail marketers. We serve hundreds of CPGs and retailers nationwide,
including Clorox; Procter & Gamble; General Mills; Unilever; Albertsons Companies; CVS; Dollar General; and Peapod Digital Labs, a company of Ahold Delhaize USA. Quotient is headquartered in Mountain View, California and
has offices in Bangalore, Cincinnati, New York, Paris, London and Tel Aviv. Visit www.quotient.com for more information.
|
Q3 2020 FINANCIAL RESULTS AND BUSINESS UPDATES
|
19 |
Quotient and the Quotient logo are trademarks or registered trademarks of Quotient Technology Inc. and its subsidiaries in the United
States and other countries. Other marks are the property of their respective owners.
Forward Looking Statements
This stockholder letter includes forward-looking statements that include projections for our fourth quarter and full year 2020;
expectations about our ability to grow revenues, gross margin and Adjusted EBITDA; our expectations for our solutions, partnerships, and product launches including national rebates; the benefits of our algorithm adjustments;
our ability to manage our business and liquidity during and after the COVID-19 pandemic growth in Quotient Promotions, RPM and eCommerce; retailers’ plans to prioritize RPM; increasing the number of retailers to our retailer
network; benefits of a DOOH offering; our efforts to streamline our operations; the importance of promotions to CPGs during recessionary periods; the effectiveness of our cost control measures; CPGs’ plans to reduce spending
in offline free-standing inserts; the future demands and behaviors of consumers, retailers and CPGs, particularly in light of the continuing effects of the COVID-19 pandemic; the impacts of the ongoing COVID-19 pandemic, which
may continue to significantly impact our business, plans, and results of operations, as well as the value of our common stock; the expected growth of, and investments in, our business generally and the expected ability to
leverage investments and operating expenses.
Forward-looking statements are based on information available to and the good faith beliefs of our Management team as of the time of this
call and are subject to known and unknown risks and uncertainties that could cause actual performances or results to differ materially.
Additional information about factors that could potentially impact our financial results can be found in today's press release and in the
risk factors identified in our Quarterly Reports on Form 10-Q filed with the SEC on August 5, 2020. We disclaim any obligation to update information contained in these forward-looking statements, whether as a result of new
information, future events or otherwise.
|
Q3 2020 FINANCIAL RESULTS AND BUSINESS UPDATES
|
20 |
Financial Tables
|
QUOTIENT TECHNOLOGY INC.
|
||||||||
|
CONDENSED CONSOLIDATED BALANCE SHEETS
|
||||||||
|
(in thousands)
|
||||||||
|
September 30,
2020
|
December 31,
2019
|
|||||||
|
(unaudited)
|
||||||||
|
Assets
|
||||||||
|
Current assets:
|
||||||||
|
Cash and cash equivalents
|
209,854
|
224,764
|
||||||
|
Accounts receivable, net
|
122,148
|
125,304
|
||||||
|
Prepaid expenses and other current assets
|
21,266
|
22,026
|
||||||
|
Total current assets
|
353,268
|
372,094
|
||||||
|
Property and equipment, net
|
15,628
|
13,704
|
||||||
|
Operating lease right-of-use-assets
|
17,181
|
7,211
|
||||||
|
Intangible assets, net
|
52,677
|
69,752
|
||||||
|
Goodwill
|
128,427
|
128,427
|
||||||
|
Other assets
|
1,246
|
750
|
||||||
|
Total assets
|
$
|
568,427
|
$
|
591,938
|
||||
|
Liabilities and Stockholders’ Equity
|
||||||||
|
Current liabilities:
|
||||||||
|
Accounts payable
|
$
|
10,765
|
$
|
19,116
|
||||
|
Accrued compensation and benefits
|
10,474
|
15,232
|
||||||
|
Other current liabilities
|
63,634
|
50,032
|
||||||
|
Deferred revenues
|
11,353
|
10,903
|
||||||
|
Contingent consideration related to acquisitions
|
—
|
27,000
|
||||||
|
Total current liabilities
|
96,226
|
122,283
|
||||||
|
Other non-current liabilities
|
17,926
|
7,119
|
||||||
|
Contingent consideration related to acquisitions
|
15,008
|
9,220
|
||||||
|
Convertible senior notes, net
|
174,360
|
166,157
|
||||||
|
Deferred tax liabilities
|
1,937
|
1,937
|
||||||
|
Total liabilities
|
305,457
|
306,716
|
||||||
|
Stockholders’ equity:
|
||||||||
|
Common stock
|
1
|
1
|
||||||
|
Additional paid-in capital
|
689,013
|
671,060
|
||||||
|
Accumulated other comprehensive loss
|
(1,045
|
)
|
(916
|
)
|
||||
|
Accumulated deficit
|
(424,999
|
)
|
(384,923
|
)
|
||||
|
Total stockholders’ equity
|
262,970
|
285,222
|
||||||
|
Total liabilities and stockholders’ equity
|
$
|
568,427
|
$
|
591,938
|
||||
|
Q3 2020 FINANCIAL RESULTS AND BUSINESS UPDATES
|
21 |
|
QUOTIENT TECHNOLOGY INC.
|
||||||||||||||||
|
CONDENSED CONSOLIDATED STATEMENTS OF OPERATIONS
|
||||||||||||||||
|
(Unaudited, in thousands, except per share data)
|
||||||||||||||||
|
Three Months Ended
September 30,
|
Nine Months Ended
September 30,
|
|||||||||||||||
|
2020
|
2019
|
2020
|
2019
|
|||||||||||||
|
Revenues
|
$
|
121,116
|
$
|
114,830
|
$
|
303,358
|
$
|
317,628
|
||||||||
|
Costs and expenses:
|
||||||||||||||||
|
Cost of revenues (1)
|
73,603
|
70,458
|
185,445
|
191,387
|
||||||||||||
|
Sales and marketing (1)
|
24,555
|
24,310
|
73,403
|
73,703
|
||||||||||||
|
Research and development (1)
|
9,744
|
9,236
|
28,958
|
28,305
|
||||||||||||
|
General and administrative (1)
|
12,099
|
17,643
|
39,457
|
44,101
|
||||||||||||
|
Change in fair value of contingent consideration
|
1,562
|
999
|
5,788
|
1,052
|
||||||||||||
|
Total costs and expenses
|
121,563
|
122,646
|
333,051
|
338,548
|
||||||||||||
|
Loss from operations
|
(447
|
)
|
(7,816
|
)
|
(29,693
|
)
|
(20,920
|
)
|
||||||||
|
Interest expense
|
(3,646
|
)
|
(3,507
|
)
|
(10,830
|
)
|
(10,416
|
)
|
||||||||
|
Other income (expense), net
|
(59
|
)
|
1,175
|
708
|
4,214
|
|||||||||||
|
Loss before income taxes
|
(4,152
|
)
|
(10,148
|
)
|
(39,815
|
)
|
(27,122
|
)
|
||||||||
|
Provision for income taxes
|
66
|
215
|
261
|
375
|
||||||||||||
|
Net loss
|
$
|
(4,218
|
)
|
$
|
(10,363
|
)
|
$
|
(40,076
|
)
|
$
|
(27,497
|
)
|
||||
|
Net loss per share, basic and diluted
|
$
|
(0.05
|
)
|
$
|
(0.12
|
)
|
$
|
(0.44
|
)
|
$
|
(0.30
|
)
|
||||
|
Weighted-average shares used to compute net loss per share, basic and diluted
|
90,585
|
88,789
|
90,113
|
91,850
|
||||||||||||
|
Three Months Ended
September 30,
|
Nine Months Ended
September 30,
|
|||||||||||||||
|
2020
|
2019
|
2020
|
2019
|
|||||||||||||
|
Cost of revenues
|
$
|
442
|
$
|
508
|
$
|
1,264
|
$
|
1,672
|
||||||||
|
Sales and marketing
|
1,187
|
1,433
|
3,912
|
4,996
|
||||||||||||
|
Research and development
|
1,003
|
1,140
|
2,723
|
3,579
|
||||||||||||
|
General and administrative
|
3,857
|
4,527
|
13,122
|
13,445
|
||||||||||||
|
Total stock-based compensation
|
$
|
6,489
|
$
|
7,608
|
$
|
21,021
|
$
|
23,692
|
||||||||
|
Q3 2020 FINANCIAL RESULTS AND BUSINESS UPDATES
|
22 |
|
QUOTIENT TECHNOLOGY INC.
|
||||||||
|
CONDENSED CONSOLIDATED STATEMENTS OF CASH FLOWS
|
||||||||
|
(Unaudited, in thousands)
|
||||||||
|
Nine Months Ended
September 30,
|
||||||||
|
2020
|
2019
|
|||||||
|
Cash flows from operating activities:
|
||||||||
|
Net loss
|
$
|
(40,076
|
)
|
$
|
(27,497
|
)
|
||
|
Adjustments to reconcile net loss to net cash (used in) provided by operating activities:
|
||||||||
|
Depreciation and amortization
|
26,522
|
23,260
|
||||||
|
Stock-based compensation
|
21,021
|
23,692
|
||||||
|
Amortization of debt discount and issuance cost
|
8,203
|
7,776
|
||||||
|
Allowance for credit losses
|
542
|
583
|
||||||
|
Deferred income taxes
|
261
|
375
|
||||||
|
Change in fair value of contingent consideration
|
5,788
|
1,052
|
||||||
|
Impairment of capitalized software development costs
|
—
|
3,579
|
||||||
|
Other non-cash expenses
|
2,546
|
1,872
|
||||||
|
Changes in operating assets and liabilities:
|
||||||||
|
Accounts receivable
|
2,615
|
(5,332
|
)
|
|||||
|
Prepaid expenses and other current assets
|
158
|
(11,084
|
)
|
|||||
|
Accounts payable and other current liabilities
|
4,893
|
9,053
|
||||||
|
Payments for contingent consideration and bonuses
|
(15,418
|
)
|
—
|
|||||
|
Accrued compensation and benefits
|
(4,334
|
)
|
(1,743
|
)
|
||||
|
Deferred revenues
|
450
|
4,405
|
||||||
|
Net cash provided by operating activities
|
13,171
|
29,991
|
||||||
|
Cash flows from investing activities:
|
||||||||
|
Purchases of property and equipment
|
(6,648
|
)
|
(7,412
|
)
|
||||
|
Purchases of intangible assets
|
(3,000
|
)
|
(14,811
|
)
|
||||
|
Proceeds from maturity of short-term investment
|
—
|
20,738
|
||||||
|
Net cash used in investing activities
|
(9,648
|
)
|
(1,485
|
)
|
||||
|
Cash flows from financing activities:
|
||||||||
|
Proceeds from issuances of common stock under stock plans
|
1,579
|
3,113
|
||||||
|
Payments for taxes related to net share settlement of equity awards
|
(5,456
|
)
|
(8,181
|
)
|
||||
|
Repurchases and retirement of common stock under share repurchase program
|
—
|
(87,097
|
)
|
|||||
|
Principal payments on promissory note and capital lease obligations
|
(100
|
)
|
(236
|
)
|
||||
|
Payments for contingent consideration
|
(14,582
|
)
|
—
|
|||||
|
Net cash used in financing activities
|
(18,559
|
)
|
(92,401
|
)
|
||||
|
Effect of exchange rates on cash and cash equivalents
|
126
|
1
|
||||||
|
Net decrease in cash and cash equivalents
|
(14,910
|
)
|
(63,894
|
)
|
||||
|
Cash and cash equivalents at beginning of period
|
224,764
|
302,028
|
||||||
|
Cash and cash equivalents at end of period
|
$
|
209,854
|
$
|
238,134
|
||||
|
Q3 2020 FINANCIAL RESULTS AND BUSINESS UPDATES
|
23 |
|
QUOTIENT TECHNOLOGY INC.
|
||||||||||||||||
|
RECONCILIATION OF NET LOSS TO ADJUSTED EBITDA
|
||||||||||||||||
|
(Unaudited, in thousands)
|
||||||||||||||||
|
Three Months Ended
September 30,
|
Nine Months Ended
September 30,
|
|||||||||||||||
|
2020
|
2019
|
2020
|
2019
|
|||||||||||||
|
Net loss
|
$
|
(4,218
|
)
|
$
|
(10,363
|
)
|
$
|
(40,076
|
)
|
$
|
(27,497
|
)
|
||||
|
Adjustments:
|
||||||||||||||||
|
Stock-based compensation
|
6,489
|
7,608
|
21,021
|
23,692
|
||||||||||||
|
Depreciation, amortization and other (1)
|
11,072
|
12,786
|
31,011
|
29,839
|
||||||||||||
|
Change in fair value of contingent consideration
|
1,562
|
999
|
5,788
|
1,052
|
||||||||||||
|
Interest expense
|
3,646
|
3,507
|
10,830
|
10,416
|
||||||||||||
|
Other (income) expense, net
|
59
|
(1,175
|
)
|
(708
|
)
|
(4,214
|
)
|
|||||||||
|
Provision for income taxes
|
66
|
215
|
261
|
375
|
||||||||||||
|
Total adjustments
|
$
|
22,894
|
$
|
23,940
|
$
|
68,203
|
$
|
61,160
|
||||||||
|
Adjusted EBITDA
|
$
|
18,676
|
$
|
13,577
|
$
|
28,127
|
$
|
33,663
|
||||||||
(1) For the three and nine months ended September 30, 2020, Other includes restructuring charges of zero and $1.5 million, respectively, certain acquisition related
costs of $0.4 million and $1.0 million, respectively, and loss contingency of $2.0 million related to a contract dispute resulting from a retailer’s failure to perform certain obligations related to a
guaranteed distribution fee arrangement for both respective periods. For the three and nine months ended September 30, 2019, Other includes restructuring charges of $4.2 million for each respective
period, and certain acquisition related costs of $0.9 million and $2.3 million, respectively.
|
Q3 2020 FINANCIAL RESULTS AND BUSINESS UPDATES
|
24 |
|
QUOTIENT TECHNOLOGY INC.
|
||||||||||||
|
RECONCILIATION OF GROSS MARGIN TO NON-GAAP GROSS MARGIN
|
||||||||||||
|
(Unaudited, in thousands)
|
||||||||||||
|
Q3 FY 19
|
Q2 FY 20
|
Q3 FY 20
|
||||||||||
|
Revenues
|
$
|
114,830
|
$
|
83,455
|
$
|
121,116
|
||||||
|
Cost of revenues (GAAP)
|
$
|
70,458
|
$
|
50,731
|
$
|
73,603
|
||||||
|
(less) Stock-based compensation
|
(508
|
)
|
(387
|
)
|
(442
|
)
|
||||||
|
(less) Amortization of acquired intangible assets
|
(5,184
|
)
|
(6,278
|
)
|
(6,027
|
)
|
||||||
|
(less) Loss contingency related to a contract dispute
|
—
|
—
|
(2,000
|
)
|
||||||||
|
Cost of revenues (Non-GAAP)
|
$
|
64,766
|
$
|
44,066
|
$
|
65,134
|
||||||
|
Gross margin (GAAP)
|
$
|
44,372
|
$
|
32,724
|
$
|
47,513
|
||||||
|
Gross margin percentage (GAAP)
|
38.6
|
%
|
39.2
|
%
|
39.2
|
%
|
||||||
|
Gross margin (Non-GAAP)*
|
$
|
50,064
|
$
|
39,389
|
$
|
55,982
|
||||||
|
Gross margin percentage (Non-GAAP)
|
43.6
|
%
|
47.2
|
%
|
46.2
|
%
|
||||||
* Non-GAAP gross margin excludes stock-based compensation, amortization of acquired intangible assets, and loss contingency related to a contract
dispute resulting from a retailer’s failure to perform certain obligations related to a guaranteed distribution fee arrangement.
|
Q3 2020 FINANCIAL RESULTS AND BUSINESS UPDATES
|
25 |
|
QUOTIENT TECHNOLOGY INC.
|
||||||||||||
|
RECONCILIATION OF OPERATING EXPENSES TO NON-GAAP OPERATING EXPENSES
|
||||||||||||
|
(Unaudited, in thousands)
|
||||||||||||
|
Q3 FY 19
|
Q2 FY 20
|
Q3 FY 20
|
||||||||||
|
Revenues
|
$
|
114,830
|
$
|
83,455
|
$
|
121,116
|
||||||
|
Sales and marketing expenses
|
24,310
|
23,814
|
24,555
|
|||||||||
|
(less) Stock-based compensation
|
(1,433
|
)
|
(1,323
|
)
|
(1,187
|
)
|
||||||
|
(less) Amortization of acquired intangible assets
|
(513
|
)
|
(914
|
)
|
(866
|
)
|
||||||
|
Non-GAAP Sales and marketing expenses
|
$
|
22,364
|
$
|
21,577
|
$
|
22,502
|
||||||
|
Non-GAAP Sales and marketing percentage
|
19
|
%
|
26
|
%
|
19
|
%
|
||||||
|
Research and development
|
9,236
|
8,621
|
9,744
|
|||||||||
|
(less) Stock-based compensation
|
(1,140
|
)
|
(839
|
)
|
(1,003
|
)
|
||||||
|
Non-GAAP Research and development expenses
|
$
|
8,096
|
$
|
7,782
|
$
|
8,741
|
||||||
|
Non-GAAP Research and development percentage
|
7
|
%
|
9
|
%
|
7
|
%
|
||||||
|
General and administrative expenses
|
17,643
|
12,268
|
12,099
|
|||||||||
|
(less) Stock-based compensation
|
(4,527
|
)
|
(4,457
|
)
|
(3,857
|
)
|
||||||
|
(less) Restructuring charges
|
(4,212
|
)
|
—
|
—
|
||||||||
|
(less) Acquisiton related costs
|
(946
|
)
|
(387
|
)
|
(393
|
)
|
||||||
|
Non-GAAP General and administrative expenses
|
$
|
7,958
|
$
|
7,424
|
$
|
7,849
|
||||||
|
Non-GAAP General and administrative percentage
|
7
|
%
|
9
|
%
|
6
|
%
|
||||||
|
Non-GAAP Operating expenses*
|
$
|
38,418
|
$
|
36,783
|
$
|
39,092
|
||||||
|
Non-GAAP Operating expense percentage
|
33
|
%
|
44
|
%
|
32
|
%
|
||||||
* Non-GAAP operating expenses excludes changes in fair value of contingent consideration, stock-based compensation, amortization of acquired
intangible assets, restructuring charges, and acquisition related costs.
|
Q3 2020 FINANCIAL RESULTS AND BUSINESS UPDATES
|
26 |