Attached files
| file | filename |
|---|---|
| EX-99.1 - EXHIBIT 99.1 EARNINGS RELEASE - Presidio Property Trust, Inc. | ex_208260.htm |
| 8-K - FORM 8-K - Presidio Property Trust, Inc. | sqft20201022_8k.htm |
Exhibit 99.2


SUPPLEMENTAL FINANCIAL INFORMATION
THIRD QUARTER 2020
| FORWARD-LOOKING STATEMENTS |
 |
This presentation contains “forward-looking statements” within the meaning of the federal securities laws that involve risks and uncertainties, many of which are beyond our control. Our actual results could differ materially and adversely from those anticipated in such forward-looking statements as a result of certain factors, including those set forth in the Quarterly Report on Form 10-Q. Forward-looking statements relate to matters such as our industry, business strategy, goals and expectations concerning our market position, future operations, margins, profitability, capital expenditures, financial condition, liquidity, capital resources, cash flows, dividends, results of operations and other financial and operating information. When used in this presentation, the words “will,” “may,” “believe,” “anticipate,” “intend,” “estimate,” “expect,” “should,” “project,” “plan,” and similar expressions are intended to identify forward-looking statements, although not all forward-looking statements contain such identifying words.
The forward-looking statements contained in this presentation are based on historical performance and management’s current plans, estimates and expectations in light of information currently available to it and are subject to uncertainty and changes in circumstances. There can be no assurance that future developments affecting us will be those that we have anticipated. Actual results may differ materially from these expectations due to the factors, risks and uncertainties described in the Annual Report on Form 10-K, as filed March 13, 2020 (“Annual Report”), changes in global, regional or local political, economic, business, competitive, market, regulatory and other factors described in the “Risk Factors” section of the Annual Report, many of which are beyond our control. Should one or more of these risks or uncertainties materialize or should any of our assumptions prove to be incorrect, our actual results may vary in material respects from what we may have expressed or implied by these forward-looking statements. We caution that you should not place undue reliance on any of our forward-looking statements. Any forward-looking statement made by us in this presentation speaks only as of the date on which we make it. Factors or events that could cause our actual results to differ may emerge from time to time, and it is not possible for us to predict all of them. We undertake no obligation to publicly update any forward-looking statement, whether as a result of new information, future developments or otherwise, except as may be required by applicable securities laws.
| COMPANY OVERVIEW | |
 |
 |
||
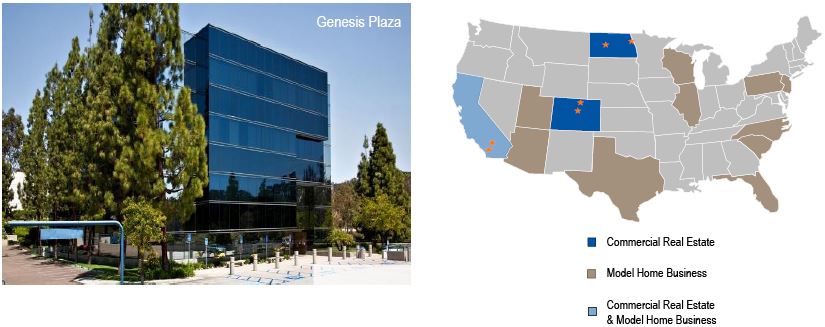
| ■ | Presidio Property Trust, Inc. (“Presidio” or the “Company”) was founded in 1999 as NetREIT | ||
| ■ | Presidio is a self-managed real estate company focused on commercial real estate opportunities in often overlooked and regionally dominant markets |
 |
|
| ■ | The Company acquires and manages office and industrial real estate assets in markets with strong demographic and economic drivers with attractive going-in cap rates | ||
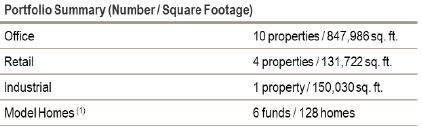
| ■ | Presidio’s commercial portfolio currently includes 15 commercial properties with a book value of approximately $128.0 million | ||
 |
|||
| ■ | In addition to its commercial real estate holdings, Presidio generates fees and rental income from affiliated entities, which manage and/or own a portfolio of model homes (1) | ||
(1) The Company holds partial ownership interests in several entities which own model home properties (2) includes book value of model homes
| COMMERCIAL PORTFOLIO | |
|
Property Location ($ in 000s) |
Sq. Ft. |
Date |
Year |
Purchase |
Occupancy |
Percent |
Mortgage |
||||||||||||||||||
|
Office/Industrial Properties: |
|||||||||||||||||||||||||
|
Garden Gateway, Colorado Springs, CO(2) |
115,052 |
03/07 |
1982/2006 |
$ | 15,126 | 76.4 |
% |
100.0 |
% |
$ | 5,915 | ||||||||||||||
|
Executive Office Park, Colorado Springs, CO(3) |
65,084 |
07/08 |
2000 | 10,126 | 96.6 |
% |
100.0 |
% |
4,755 | ||||||||||||||||
|
Genesis Plaza, San Diego, CA (4)(5) |
57,807 |
08/10 |
1989 | 10,000 | 74.7 |
% |
76.4 |
% |
6,302 | ||||||||||||||||
|
Dakota Center, Fargo, ND |
119,434 |
05/11 |
1982 | 9,575 | 86.0 |
% |
100.0 |
% |
9,955 | ||||||||||||||||
|
Grand Pacific Center, Bismarck, ND |
93,058 |
04/14 |
1976 | 5,350 | 74.2 |
% |
100.0 |
% |
3,767 | ||||||||||||||||
|
Arapahoe Service Center II, Centennial, CO |
79,023 |
12/14 |
2000 | 11,850 | 100.0 |
% |
100.0 |
% |
7,972 | ||||||||||||||||
|
West Fargo Industrial, West Fargo, ND |
150,030 |
08/15 |
1998/2005 |
7,900 | 84.0 |
% |
100.0 |
% |
4,291 | ||||||||||||||||
|
300 N.P., West Fargo, ND |
34,517 |
08/15 |
1922 | 3,850 | 72.8 |
% |
100.0 |
% |
2,283 | ||||||||||||||||
|
Highland Court, Centennial, CO (6) |
93,536 |
08/15 |
1984 | 13,050 | 63.3 |
% |
84.5 |
% |
6,313 | ||||||||||||||||
|
One Park Centre, Westminster, CO |
69,174 |
08/15 |
1983 | 9,150 | 81.4 |
% |
100.0 |
% |
6,411 | ||||||||||||||||
|
Shea Center II, Highlands Ranch, CO |
121,301 |
12/15 |
2000 | 25,325 | 87.9 |
% |
100.0 |
% |
17,728 | ||||||||||||||||
|
Total Office/Industrial Properties |
998,016 | $ | 121,302 | 82.0 |
% |
$ | 75,692 | ||||||||||||||||||
|
Retail Properties: |
|||||||||||||||||||||||||
|
World Plaza, San Bernardino, CA |
55,810 |
09/07 |
1974 | 7,650 | 100.0 |
% |
100.0 |
% |
5,829 | ||||||||||||||||
|
Waterman Plaza, San Bernardino, CA(7) |
21,170 |
08/08 |
2008 | 7,164 | 85.9 |
% |
100.0 |
% |
3,240 | ||||||||||||||||
|
Union Town Center, Colorado Springs, CO |
44,042 |
12/14 |
2003 | 11,212 | 100.0 |
% |
100.0 |
% |
8,350 | ||||||||||||||||
|
Research Parkway, Colorado Springs, CO |
10,700 |
8/15 |
2003 | 2,850 | 100.0 |
% |
100.0 |
% |
1,774 | ||||||||||||||||
|
Total Retail Properties |
131,722 | $ | 28,876 | 97.7 |
% |
$ | 19,193 | ||||||||||||||||||
|
Total Commercial Properties |
1,129,738 | $ | 150,178 | 83.8 |
% |
$ | 94,885 | ||||||||||||||||||
|
(1) |
Prior to January 1, 2009, “Purchase Price” includes our acquisition related costs and expenses for the purchase of the property. After January 1, 2009, acquisition related costs and expenses were recognized as expense when incurred. |
|
(2) |
As of August 27, 2020, this property is in escrow in connection with a purchase and sale agreement and, subject to satisfaction and/or waiver of certain contingencies (including buyer obtaining suitable financing), the transaction is expected to close in the fourth quarter of 2020. |
|
(3) |
As of September 3, 2020, one of the four buildings that comprise this property is in escrow in connection with a purchase and sale agreement and, subject to satisfaction and/or waiver of certain contingencies (including buyer obtaining suitable financing), the transaction is expected to close in the fourth quarter of 2020. |
|
(4) |
Approximately 9,224 square feet, or 16.0% of this property, is occupied by us as our corporate offices and related parties. |
|
(5) |
This property is owned by two tenants-in-common, each of which owns 57% and 43%, respectively, and we beneficially own an aggregate interest of 76.4%. |
|
(6) |
This property is owned by two tenants-in-common, of which we own approximately 60% and 52%, respectively, and we beneficially own an aggregate interest of 84.5%. |
|
(7) |
This property is classified as held for sale as of September 17, 2020. |
| MODEL HOMES PORTFOLIO | |
|
Region |
No. of |
Aggregate |
Approximate % |
Current |
Approximate % |
Purchase |
Current |
|||||||||||||||||||||
|
Southwest |
104 | 305,203 | 83.7 |
% |
$ | 3,036,024 | 80.2 |
% |
$ | 39,174,002 | $ | 24,383,667 | ||||||||||||||||
|
Southeast |
18 | 41,621 | 11.4 |
% |
499,320 | 13.2 |
% |
6,205,606 | 3,638,343 | |||||||||||||||||||
|
Midwest |
2 | 6,602 | 1.8 |
% |
99,276 | 2.6 |
% |
1,103,000 | 717,191 | |||||||||||||||||||
|
East |
2 | 5,255 | 1.4 |
% |
70,716 | 1.9 |
% |
764,520 | 184,220 | |||||||||||||||||||
|
Northeast |
2 | 6,153 | 1.7 |
% |
80,844 | 2.1 |
% |
898,250 | 591,240 | |||||||||||||||||||
| 128 | 364,834 | 100.0 |
% |
$ | 3,786,180 | 100.0 |
% |
$ | 48,145,378 | $ | 29,514,662 | |||||||||||||||||
| CONDENSED CONSOLIDATED BALANCE SHEET | |
(Unaudited)
|
September 30, |
December 31, |
|||||||
|
2020 |
2019 |
|||||||
|
(Unaudited) |
||||||||
|
ASSETS |
||||||||
|
Real estate assets and lease intangibles: |
||||||||
|
Land |
$ | 24,063,107 | $ | 24,490,342 | ||||
|
Buildings and improvements |
133,689,849 | 133,767,144 | ||||||
|
Tenant improvements |
15,095,039 | 14,043,829 | ||||||
|
Lease intangibles |
5,321,295 | 5,321,295 | ||||||
|
Real estate assets and lease intangibles held for investment, cost |
178,169,290 | 177,622,610 | ||||||
|
Accumulated depreciation and amortization |
(31,769,133 | ) | (27,970,897 | ) | ||||
|
Real estate assets and lease intangibles held for investment, net |
146,400,157 | 149,651,713 | ||||||
|
Real estate assets held for sale, net |
27,551,655 | 50,554,907 | ||||||
|
Real estate assets, net |
173,951,812 | 200,206,620 | ||||||
|
Cash, cash equivalents and restricted cash |
10,006,026 | 10,391,275 | ||||||
|
Deferred leasing costs, net |
1,721,939 | 2,053,927 | ||||||
|
Goodwill |
2,423,000 | 2,423,000 | ||||||
|
Other assets, net |
3,715,172 | 5,709,586 | ||||||
|
TOTAL ASSETS |
$ | 191,817,949 | $ | 220,784,408 | ||||
|
LIABILITIES AND EQUITY |
||||||||
|
Liabilities: |
||||||||
|
Mortgage notes payable, net |
$ | 107,114,310 | $ | 109,795,546 | ||||
|
Mortgage notes payable related to properties held for sale, net |
16,422,504 | 32,597,446 | ||||||
|
Mortgage notes payable, total net |
123,536,814 | 142,392,992 | ||||||
|
Note payable, net |
8,424,574 | 12,238,692 | ||||||
|
Accounts payable and accrued liabilities |
5,266,774 | 5,673,815 | ||||||
|
Accrued real estate taxes |
1,972,841 | 2,987,601 | ||||||
|
Lease liability, net |
108,743 | 560,188 | ||||||
|
Below-market leases, net |
187,493 | 309,932 | ||||||
|
Total liabilities |
139,497,239 | 164,163,220 | ||||||
|
Commitments and contingencies (Note 9) |
||||||||
|
Equity: |
||||||||
|
Series A Common Stock, $0.01 par value, shares authorized: 100,000,000; 8,922,036 and 8,881,842 shares were both issued and outstanding at September 30, 2020 and December 31, 2019, respectively |
89,220 | 88,818 | ||||||
|
Additional paid-in capital |
153,358,708 | 152,129,120 | ||||||
|
Dividends and accumulated losses |
(117,815,335 | ) | (113,037,144 | ) | ||||
|
Total stockholders' equity before noncontrolling interest |
35,632,593 | 39,180,794 | ||||||
|
Noncontrolling interest |
16,688,117 | 17,440,394 | ||||||
|
Total equity |
52,320,710 | 56,621,188 | ||||||
|
TOTAL LIABILITIES AND EQUITY |
$ | 191,817,949 | $ | 220,784,408 | ||||
| CONDENSED CONSOLIDATED STATEMENT OF OPERATIONS | |
(Unaudited)
|
For the Three Months Ended September 30, |
For the Nine Months Ended September 30, |
|||||||||||||||
|
2020 |
2019 |
2020 |
2019 |
|||||||||||||
|
Revenues: |
||||||||||||||||
|
Rental income |
$ | 5,433,303 | $ | 6,677,145 | $ | 18,098,514 | $ | 20,371,900 | ||||||||
|
Fees and other income |
230,265 | 323,725 | 715,609 | 929,221 | ||||||||||||
|
Total revenue |
5,663,568 | 7,000,870 | 18,814,123 | 21,301,121 | ||||||||||||
|
Costs and expenses: |
||||||||||||||||
|
Rental operating costs |
2,108,621 | 2,533,064 | 6,489,547 | 7,822,616 | ||||||||||||
|
General and administrative |
1,366,380 | 1,451,873 | 3,996,696 | 4,632,244 | ||||||||||||
|
Depreciation and amortization |
1,626,917 | 1,755,253 | 4,823,673 | 5,714,446 | ||||||||||||
|
Impairment of real estate assets |
— | — | 845,674 | — | ||||||||||||
|
Total costs and expenses |
5,101,918 | 5,740,190 | 16,155,590 | 18,169,306 | ||||||||||||
|
Other income (expense): |
||||||||||||||||
|
Interest expense-Series B preferred stock |
— | (924,538 | ) | — | (2,200,262 | ) | ||||||||||
|
Interest expense-mortgage notes |
(1,439,771 | ) | (1,723,844 | ) | (4,605,175 | ) | (5,485,194 | ) | ||||||||
|
Interest expense - note payable |
(704,189 | ) | (182,476 | ) | (2,365,987 | ) | (182,476 | ) | ||||||||
|
Interest and other income (expense), net |
(12,270 | ) | 9,294 | (10,865 | ) | 19,227 | ||||||||||
|
Gain on sales of real estate, net |
332,714 | 4,853,186 | 656,975 | 6,243,819 | ||||||||||||
|
Income tax expense |
(122,602 | ) | (338,713 | ) | (257,602 | ) | (611,952 | ) | ||||||||
|
Total other income (expense), net |
(1,946,118 | ) | 1,692,909 | (6,582,654 | ) | (2,216,838 | ) | |||||||||
|
Net (loss) income |
(1,384,468 | ) | 2,953,589 | (3,924,121 | ) | 914,977 | ||||||||||
|
Less: (Loss) income attributable to noncontrolling interests |
(363,777 | ) | (416,725 | ) | (854,070 | ) | (1,366,104 | ) | ||||||||
|
Net (loss) income attributable to Presidio Property Trust, Inc. common stockholders |
$ | (1,748,245 | ) | $ | 2,536,864 | $ | (4,778,191 | ) | $ | (451,127 | ) | |||||
|
Basic (loss) income per common share |
$ | (0.20 | ) | $ | 0.29 | $ | (0.54 | ) | $ | (0.05 | ) | |||||
|
Weighted average number of common shares outstanding - basic |
8,922,525 | 8,852,348 | 8,900,547 | 8,860,228 | ||||||||||||
|
Diluted (loss) income per common share |
$ | (0.20 | ) | $ | 0.27 | $ | (0.54 | ) | $ | (0.05 | ) | |||||
|
Weighted average number of common shares outstanding - diluted |
8,922,525 | 9,275,427 | 8,900,547 | 8,860,228 | ||||||||||||
| CONDENSED CONSOLIDATED STATEMENT OF CASH FLOWS | |
(Unaudited)
|
For the Nine Months Ended September 30, |
||||||||
|
2020 |
2019 |
|||||||
|
Cash flows from operating activities: |
||||||||
|
Net (loss) income |
$ | (3,924,121 | ) | $ | 914,977 | |||
|
Adjustments to reconcile net (loss) income to net cash provided by operating activities: |
||||||||
|
Depreciation and amortization |
4,823,673 | 5,714,446 | ||||||
|
Stock compensation |
541,865 | 809,127 | ||||||
|
Bad debt expense |
93,958 | 19,088 | ||||||
|
Gain on sale of real estate assets, net |
(656,975 | ) | (6,243,819 | ) | ||||
|
Impairment of real estate assets |
845,674 | — | ||||||
|
Accretion of original issue discount |
1,013,405 | 48,793 | ||||||
|
Amortization of financing costs |
992,705 | 592,598 | ||||||
|
Amortization of above-market leases |
38,012 | 42,796 | ||||||
|
Amortization of below-market leases |
(122,439 | ) | (140,777 | ) | ||||
|
Straight-line rent adjustment |
67,732 | (26,590 | ) | |||||
|
Changes in operating assets and liabilities: |
||||||||
|
Other assets |
2,171,813 | 1,709,386 | ||||||
|
Accounts payable and accrued liabilities |
(1,974,401 | ) | (244,791 | ) | ||||
|
Accrued real estate taxes |
(1,014,760 | ) | (817,366 | ) | ||||
|
Net cash provided by operating activities |
2,896,141 | 2,377,868 | ||||||
|
Cash flows from investing activities: |
||||||||
|
Real estate acquisitions |
(8,996,248 | ) | (6,116,035 | ) | ||||
|
Additions to buildings and tenant improvements |
(2,510,152 | ) | (5,182,033 | ) | ||||
|
Additions to deferred leasing costs |
(137,961 | ) | (661,401 | ) | ||||
|
Proceeds from sales of real estate, net |
33,810,274 | 29,211,836 | ||||||
|
Net cash provided by investing activities |
22,165,913 | 17,252,367 | ||||||
|
Cash flows from financing activities: |
||||||||
|
Proceeds from mortgage notes payable, net of issuance costs |
13,339,739 | 10,667,286 | ||||||
|
Repayment of mortgage notes payable |
(32,399,522 | ) | (20,723,326 | ) | ||||
|
Proceeds from note payable, net of issuance cost of $1.1 million |
— | 11,623,164 | ||||||
|
Repayment of note payable |
(5,224,402 | ) | — | |||||
|
Payment of extension costs, note payable |
(351,025 | ) | — | |||||
|
Redemption of mandatorily redeemable preferred stock |
— | (16,900,000 | ) | |||||
|
Payment of deferred offering costs |
(435,736 | ) | — | |||||
|
Distributions to noncontrolling interests, net of contributions |
(358,357 | ) | (628,462 | ) | ||||
|
Repurchase of common stock |
(18,000 | ) | (215,206 | ) | ||||
|
Dividends paid to stockholders |
— | (2,158,467 | ) | |||||
|
Net cash used in financing activities |
(25,447,303 | ) | (18,335,011 | ) | ||||
|
Net (decrease) increase in cash equivalents and restricted cash |
(385,249 | ) | 1,295,224 | |||||
|
Cash, cash equivalents and restricted cash - beginning of period |
10,391,275 | 9,776,215 | ||||||
|
Cash, cash equivalents and restricted cash - end of period |
$ | 10,006,026 | $ | 11,071,439 | ||||
|
Supplemental disclosure of cash flow information: |
||||||||
|
Interest paid-Series B preferred stock |
$ | — | $ | 1,859,672 | ||||
|
Interest paid-mortgage notes payable |
$ | 4,542,959 | $ | 4,792,830 | ||||
|
Interest paid-notes payable |
$ | 604,679 | $ | — | ||||
|
Non-cash financing activities: |
||||||||
|
Issuance of stock for limited partnership interests |
$ | 1,247,990 | $ | — | ||||
| EBITDA RECONCILIATION | |
|
For the Three Months Ended September 30, |
For the Nine Months Ended September 30, |
|||||||||||||||
|
2020 |
2019 |
2020 |
2019 |
|||||||||||||
|
Net (loss) income attributable to Presidio Property Trust, Inc. common stockholders |
$ | (1,748,245 | ) | $ | 2,536,864 | $ | (4,778,191 | ) | $ | (451,127 | ) | |||||
|
Adjustments: |
||||||||||||||||
|
Income attributable to noncontrolling interests |
363,777 | $ | 416,725 | 854,070 | 1,366,104 | |||||||||||
|
Depreciation and amortization |
1,626,917 | $ | 1,755,253 | 4,823,673 | 5,714,446 | |||||||||||
|
Amortization of above and below market leases, net |
(26,182 | ) | (33,564 | ) | (84,427 | ) | (97,981 | ) | ||||||||
|
Impairment of real estate assets |
- | $ | - | 845,674 | - | |||||||||||
|
Gain on sale of real estate assets |
(332,714 | ) | $ | (4,853,186 | ) | (656,975 | ) | (6,243,819 | ) | |||||||
|
FFO |
$ | (116,447 | ) | $ | (177,908 | ) | $ | 1,003,824 | $ | 287,623 | ||||||
|
Stock Based Compensation |
180,622 | 192,747 | 541,865 | 809,127 | ||||||||||||
|
Core FFO |
$ | 64,175 | $ | 14,839 | $ | 1,545,689 | $ | 1,096,750 | ||||||||
| FFO AND CORE FFO RECONCILIATION | |
|
For the Three Months Ended September 30, |
For the Nine Months Ended September 30, |
|||||||||||||||
|
2020 |
2019 |
2020 |
2019 |
|||||||||||||
|
Net (loss) income attributable to Presidio Property Trust, Inc. common stockholders |
$ | (1,748,245 | ) | $ | 2,536,864 | $ | (4,778,191 | ) | $ | (451,127 | ) | |||||
|
Adjustments: |
||||||||||||||||
|
Income attributable to noncontrolling interests |
363,777 | $ | 416,725 | 854,070 | 1,366,104 | |||||||||||
|
Depreciation and amortization |
1,626,917 | $ | 1,755,253 | 4,823,673 | 5,714,446 | |||||||||||
|
Amortization of above and below market leases, net |
(26,182 | ) | (33,564 | ) | (84,427 | ) | (97,981 | ) | ||||||||
|
Impairment of real estate assets |
- | $ | - | 845,674 | - | |||||||||||
|
Gain on sale of real estate assets |
(332,714 | ) | $ | (4,853,186 | ) | (656,975 | ) | (6,243,819 | ) | |||||||
|
FFO |
$ | (116,447 | ) | $ | (177,908 | ) | $ | 1,003,824 | $ | 287,623 | ||||||
|
Stock Based Compensation |
180,622 | 192,747 | 541,865 | 809,127 | ||||||||||||
|
Core FFO |
$ | 64,175 | $ | 14,839 | $ | 1,545,689 | $ | 1,096,750 | ||||||||
| SAME STORE ANALYSIS | |
|
For the Three Months Ended September 30, |
Variance |
For the Nine Months Ended September 30, |
Variance |
|||||||||||||||||||||||||||||
|
2020 |
2019 |
$ |
% |
2020 |
2019 |
$ |
% |
|||||||||||||||||||||||||
|
Rental revenues |
$ | 4,728,379 | $ | 4,944,888 | $ | (216,509 | ) | (4.4 | )% | $ | 15,104,102 | $ | 14,677,827 | $ | 426,275 | 2.9 | % | |||||||||||||||
|
Rental operating costs |
2,112,951 | 2,165,441 | (52,490 | ) | (2.4 | )% | 6,338,882 | 6,327,656 | 11,226 | 0.2 | % | |||||||||||||||||||||
|
Net operating income |
$ | 2,615,428 | $ | 2,779,447 | $ | (164,019 | ) | (5.9 | )% | $ | 8,765,220 | $ | 8,350,171 | $ | 415,049 | 5.0 | % | |||||||||||||||
|
Operating Ratios: |
||||||||||||||||||||||||||||||||
|
Number of same properties |
15 | 15 | 15 | 15 | ||||||||||||||||||||||||||||
|
Occupancy, end of period |
83.8 | % | 82.3 | % | 1.5 | % | 83.8 | % | 82.3 | % | 1.5 | % | ||||||||||||||||||||
|
Operating costs as a percentage of total revenues |
44.7 | % | 43.8 | % | 0.9 | % | 42.0 | % | 43.1 | % | (1.1 | )% | ||||||||||||||||||||
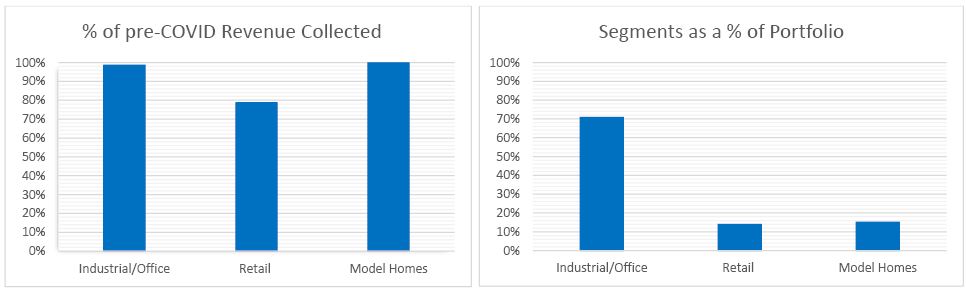
| SEGMENT DATA |
| DEFINITIONS – NON-GAAP MEASUREMENTS | |
EBITDAre - EBITDAre is defined by Nareit as earnings before interest, taxes, depreciation and amortization, gain or loss on disposal of depreciated assets, and impairment write-offs.
Funds from Operations (“FFO”) – The Company evaluates performance based on Funds From Operations, which we refer to as FFO, as management believes that FFO represents the most accurate measure of activity and is the basis for distributions paid to equity holders. The Company defines FFO, a non-GAAP measure, as net income or loss (computed in accordance with GAAP), excluding gains (or losses) from sales of property, hedge ineffectiveness, acquisition costs of newly acquired properties that are not capitalized and lease acquisition costs that are not capitalized plus depreciation and amortization, including amortization of acquired above and below market lease intangibles and impairment charges on properties or investments in non-consolidated REITs, and after adjustments to exclude equity in income or losses from, and, to include the proportionate share of FFO from, non-consolidated REITs.
However, because FFO excludes depreciation and amortization and as well as the changes in the value of the Company’s properties that result from use or market conditions, each of which have real economic effects and could materially impact the Company’s results from operations, the utility of FFO as a measure of the Company’s performance is limited. In addition, other equity REITs may not calculate FFO in accordance with the NAREIT definition as the Company does, and, accordingly, the Company’s FFO may not be comparable to such other REITs’ FFO. Accordingly, FFO should be considered only as a supplement to net income as a measure of the Company’s performance.
Core Funds from Operations (“Core FFO”) – We calculate Core FFO, a non-GAAP measure, by using FFO as defined by NAREIT and adjusting for certain other non-core items. We also exclude from our Core FFO calculation acquisition costs, loss on early extinguishment of debt, changes in the fair value of the earn-out, changes in fair value of contingent consideration and the amortization of stock-based compensation.
We believe Core FFO provides a useful metric in comparing operations between reporting periods and in assessing the sustainability of our ongoing operating performance. Other equity REITs may calculate Core FFO differently or not at all, and, accordingly, the Company’s Core FFO may not be comparable to such other REITs’ Core FFO.
Same Store Net Operating Income (“Same Store NOI”) – Same Store NOI, a non-GAAP measure, is calculated as the NOI attributable to the properties continuously owned and operated for the entirety of the reporting periods presented. The Company’s definition of Same Store NOI excludes properties that were not stabilized during both of the applicable reporting periods. These exclusions may include, but are not limited to, acquisitions, dispositions and properties undergoing repositioning or significant renovations.
The Company evaluates the performance of its same-store property operating results based upon net operating income from continuing operations, which is a non-GAAP supplemental financial measure. The Company defines NOI as operating revenues (rental income, tenant reimbursements and other operating income) less property and related expenses (property operating expenses, real estate taxes, insurance and provision for bad debt) less interest expense. NOI excludes certain items that are not considered to be controllable in connection with the management of an asset such as non-property income and expenses, depreciation and amortization, asset management fees and corporate general and administrative expenses. The Company believes that net income is the GAAP measure that is most directly comparable to NOI; however, NOI should not be considered as an alternative to net income as the primary indicator of operating performance as it excludes the items described above.
We believe Same Store NOI, a non-GAAP measure, is an important measure of comparison because it allows for comparison of operating results of stabilized properties owned and operated for the entirety of both applicable periods and therefore eliminates variations caused by acquisitions, dispositions or repositioning during such periods. Other REITs may calculate Same Store NOI differently and our calculation should not be compared to that of other REITs.