Attached files
| file | filename |
|---|---|
| EX-32.2 - EX-32.2 - NCS Multistage Holdings, Inc. | ncsm-20200930xex32_2.htm |
| EX-32.1 - EX-32.1 - NCS Multistage Holdings, Inc. | ncsm-20200930xex32_1.htm |
| EX-31.2 - EX-31.2 - NCS Multistage Holdings, Inc. | ncsm-20200930xex31_2.htm |
| EX-31.1 - EX-31.1 - NCS Multistage Holdings, Inc. | ncsm-20200930xex31_1.htm |
UNITED STATES
SECURITIES AND EXCHANGE COMMISSION
Washington, D.C. 20549
FORM 10-Q
(Mark One)
☑ Quarterly Report Pursuant to Section 13 or 15(d) of
the Securities Exchange Act of 1934
For the quarterly period ended September 30, 2020
OR
☐ Transition Report Pursuant to Section 13 or 15(d) of
the Securities Exchange Act of 1934
For the transition period from ______ to ______
Commission file number: 001-38071
NCS Multistage Holdings, Inc.
(Exact name of registrant as specified in its charter)
|
|
Delaware |
46-1527455 |
||
|
|
(State or other jurisdiction of incorporation or organization) |
(IRS Employer Identification number) |
||
|
|
||||
|
|
19350 State Highway 249, Suite 600 |
|||
|
|
Houston, Texas |
77070 |
||
|
|
(Address of principal executive offices) |
(Zip Code) |
Registrant’s telephone number, including area code: (281) 453-2222
Securities registered pursuant to Section 12(b) of the Act:
|
|
|
|
|
Title of each class |
Trading Symbol(s) |
Name of each exchange on which registered |
|
Common Stock, $0.01 par value |
NCSM |
NASDAQ Global Select Market |
Indicate by check mark whether the registrant (1) has filed all reports required to be filed by Section 13 or 15(d) of the Securities Exchange Act of 1934 during the preceding 12 months (or for such shorter period that the registrant was required to file such reports), and (2) has been subject to such filing requirements for the past 90 days. Yes ☑ No ☐
Indicate by check mark whether the registrant has submitted electronically every Interactive Data File required to be submitted pursuant to Rule 405 of Regulation S-T (§232.405 of this chapter) during the preceding 12 months (or for such shorter period that the registrant was required to submit such files). Yes ☑ No ☐
Indicate by check mark whether the registrant is a large accelerated filer, an accelerated filer, a non-accelerated filer, a smaller reporting company, or an emerging growth company. See the definitions of “large accelerated filer,” “accelerated filer,” “smaller reporting company,” and “emerging growth company” in Rule 12b-2 of the Exchange Act.
|
|
|
|
|
|
|
|
|
Large accelerated filer |
☐ |
Accelerated filer |
☐ |
|
|
|
Non-accelerated filer |
☑ |
Smaller reporting company |
☑ |
|
|
|
|
|
Emerging growth company |
☑ |
|
If an emerging growth company, indicate by check mark if the registrant has elected not to use the extended transition period for complying with any new or revised financial accounting standards provided pursuant to Section 13(a) of the Exchange Act. ☑
Indicate by check mark whether the registrant is a shell company (as defined in Rule 12b-2 of the Act). Yes ☐ No ☑
As of November 3, 2020, there were 47,198,367 shares of common stock outstanding.
|
|
Page |
|
|
|
||
|
Item 1. |
||
|
|
3 | |
|
|
4 | |
|
|
Condensed Consolidated Statements of Comprehensive (Loss) Income |
5 |
|
|
6 | |
|
|
8 | |
|
|
9 | |
|
|
||
|
Item 2. |
Management’s Discussion and Analysis of Financial Condition and Results of Operations |
22 |
|
|
||
|
Item 3. |
37 | |
|
|
||
|
Item 4. |
37 | |
|
|
||
|
|
||
|
Item 1. |
38 | |
|
|
||
|
Item 1A. |
38 | |
|
|
||
|
Item 6. |
41 | |
|
|
||
| 42 | ||
2
CONDENSED CONSOLIDATED BALANCE SHEETS
(In thousands, except share data)
(Unaudited)
|
|
|
|
|
|
|
|
|
|
|
|
|
|
|
|
|
|
|
September 30, |
|
December 31, |
||
|
|
|
2020 |
|
2019 |
||
|
Assets |
|
|
|
|
|
|
|
Current assets |
|
|
|
|
|
|
|
Cash and cash equivalents |
|
$ |
8,635 |
|
$ |
11,243 |
|
Accounts receivable—trade, net |
|
|
14,130 |
|
|
41,960 |
|
Inventories, net |
|
|
36,586 |
|
|
39,921 |
|
Prepaid expenses and other current assets |
|
|
3,251 |
|
|
2,444 |
|
Other current receivables |
|
|
10,425 |
|
|
5,028 |
|
Total current assets |
|
|
73,027 |
|
|
100,596 |
|
Noncurrent assets |
|
|
|
|
|
|
|
Property and equipment, net |
|
|
24,511 |
|
|
32,974 |
|
Goodwill |
|
|
15,222 |
|
|
15,222 |
|
Identifiable intangibles, net |
|
|
2,689 |
|
|
45,248 |
|
Operating lease assets |
|
|
5,634 |
|
|
5,071 |
|
Deposits and other assets |
|
|
3,497 |
|
|
3,460 |
|
Deferred income taxes, net |
|
|
65 |
|
|
6 |
|
Total noncurrent assets |
|
|
51,618 |
|
|
101,981 |
|
Total assets |
|
$ |
124,645 |
|
$ |
202,577 |
|
Liabilities and Stockholders’ Equity |
|
|
|
|
|
|
|
Current liabilities |
|
|
|
|
|
|
|
Accounts payable—trade |
|
$ |
3,149 |
|
$ |
8,549 |
|
Accrued expenses |
|
|
3,594 |
|
|
3,451 |
|
Income taxes payable |
|
|
365 |
|
|
1,883 |
|
Operating lease liabilities |
|
|
1,918 |
|
|
2,052 |
|
Current maturities of long-term debt |
|
|
1,446 |
|
|
1,481 |
|
Other current liabilities |
|
|
2,349 |
|
|
2,364 |
|
Total current liabilities |
|
|
12,821 |
|
|
19,780 |
|
Noncurrent liabilities |
|
|
|
|
|
|
|
Long-term debt, less current maturities |
|
|
4,537 |
|
|
11,436 |
|
Operating lease liabilities, long-term |
|
|
4,364 |
|
|
3,487 |
|
Other long-term liabilities |
|
|
1,965 |
|
|
1,373 |
|
Deferred income taxes, net |
|
|
880 |
|
|
2,956 |
|
Total noncurrent liabilities |
|
|
11,746 |
|
|
19,252 |
|
Total liabilities |
|
|
24,567 |
|
|
39,032 |
|
Commitments and contingencies (Note 9) |
|
|
|
|
|
|
|
Stockholders’ equity |
|
|
|
|
|
|
|
Preferred stock, $0.01 par value, 10,000,000 shares authorized, no shares issued and outstanding at |
|
|
|
|
|
|
|
September 30, 2020 and December 31, 2019 |
|
|
— |
|
|
— |
|
Common stock, $0.01 par value, 225,000,000 shares authorized, 47,439,214 shares issued |
|
|
|
|
|
|
|
and 47,197,895 shares outstanding at September 30, 2020 and 46,905,782 shares issued |
|
|
|
|
|
|
|
and 46,813,117 shares outstanding at December 31, 2019 |
|
|
474 |
|
|
469 |
|
Additional paid-in capital |
|
|
430,902 |
|
|
424,633 |
|
Accumulated other comprehensive loss |
|
|
(83,659) |
|
|
(80,811) |
|
Retained deficit |
|
|
(265,198) |
|
|
(199,029) |
|
Treasury stock, at cost; 241,319 shares at September 30, 2020 and 92,665 shares |
|
|
|
|
|
|
|
at December 31, 2019 |
|
|
(809) |
|
|
(652) |
|
Total stockholders’ equity |
|
|
81,710 |
|
|
144,610 |
|
Non-controlling interest |
|
|
18,368 |
|
|
18,935 |
|
Total equity |
|
|
100,078 |
|
|
163,545 |
|
Total liabilities and stockholders' equity |
|
$ |
124,645 |
|
$ |
202,577 |
The accompanying notes are an integral part of these condensed consolidated financial statements.
3
CONDENSED CONSOLIDATED STATEMENTS OF OPERATIONS
(In thousands, except per share data)
(Unaudited)
|
|
|
|
|
|
|
|
|
|
|
|
|
|
|
|
|
|
|
|
|
|
|
|
|
|
|
|
|
|
|
Three Months Ended |
|
Nine Months Ended |
||||||||
|
|
|
September 30, |
|
September 30, |
||||||||
|
|
|
2020 |
|
2019 |
|
2020 |
|
2019 |
||||
|
Revenues |
|
|
|
|
|
|
|
|
|
|
|
|
|
Product sales |
|
$ |
11,660 |
|
$ |
43,756 |
|
$ |
55,948 |
|
$ |
110,933 |
|
Services |
|
|
4,652 |
|
|
17,017 |
|
|
23,646 |
|
|
42,458 |
|
Total revenues |
|
|
16,312 |
|
|
60,773 |
|
|
79,594 |
|
|
153,391 |
|
Cost of sales |
|
|
|
|
|
|
|
|
|
|
|
|
|
Cost of product sales, exclusive of depreciation |
|
|
7,874 |
|
|
23,796 |
|
|
35,191 |
|
|
57,032 |
|
Cost of services, exclusive of depreciation |
|
|
2,334 |
|
|
8,413 |
|
|
12,024 |
|
|
25,021 |
|
Total cost of sales, exclusive of depreciation |
|
|
10,208 |
|
|
32,209 |
|
|
47,215 |
|
|
82,053 |
|
Selling, general and administrative expenses |
|
|
12,474 |
|
|
20,441 |
|
|
48,782 |
|
|
66,360 |
|
Depreciation |
|
|
1,000 |
|
|
1,461 |
|
|
3,446 |
|
|
4,382 |
|
Amortization |
|
|
103 |
|
|
1,153 |
|
|
1,340 |
|
|
3,451 |
|
Change in fair value of contingent consideration |
|
|
— |
|
|
— |
|
|
— |
|
|
37 |
|
Impairment |
|
|
— |
|
|
— |
|
|
50,194 |
|
|
7,919 |
|
(Loss) income from operations |
|
|
(7,473) |
|
|
5,509 |
|
|
(71,383) |
|
|
(10,811) |
|
Other income (expense) |
|
|
|
|
|
|
|
|
|
|
|
|
|
Interest expense, net |
|
|
(876) |
|
|
(424) |
|
|
(1,622) |
|
|
(1,497) |
|
Other income, net |
|
|
414 |
|
|
259 |
|
|
580 |
|
|
349 |
|
Foreign currency exchange loss, net |
|
|
(260) |
|
|
(131) |
|
|
(467) |
|
|
(678) |
|
Total other expense |
|
|
(722) |
|
|
(296) |
|
|
(1,509) |
|
|
(1,826) |
|
(Loss) income before income tax |
|
|
(8,195) |
|
|
5,213 |
|
|
(72,892) |
|
|
(12,637) |
|
Income tax (benefit) expense |
|
|
(3,058) |
|
|
(1,396) |
|
|
(9,956) |
|
|
10,200 |
|
Net (loss) income |
|
|
(5,137) |
|
|
6,609 |
|
|
(62,936) |
|
|
(22,837) |
|
Net income attributable to non-controlling interest |
|
|
726 |
|
|
2,988 |
|
|
3,233 |
|
|
7,809 |
|
Net (loss) income attributable to |
|
$ |
(5,863) |
|
$ |
3,621 |
|
$ |
(66,169) |
|
$ |
(30,646) |
|
(Loss) earnings per common share |
|
|
|
|
|
|
|
|
|
|
|
|
|
Basic (loss) earnings per common share attributable to |
|
$ |
(0.12) |
|
$ |
0.08 |
|
$ |
(1.40) |
|
$ |
(0.66) |
|
Diluted (loss) earnings per common share attributable to |
|
$ |
(0.12) |
|
$ |
0.08 |
|
$ |
(1.40) |
|
$ |
(0.66) |
|
Weighted average common shares outstanding |
|
|
|
|
|
|
|
|
|
|
|
|
|
Basic |
|
|
47,351 |
|
|
46,892 |
|
|
47,240 |
|
|
46,552 |
|
Diluted |
|
|
47,351 |
|
|
46,921 |
|
|
47,240 |
|
|
46,552 |
The accompanying notes are an integral part of these condensed consolidated financial statements.
4
CONDENSED CONSOLIDATED STATEMENTS OF COMPREHENSIVE (LOSS) INCOME
(In thousands)
(Unaudited)
|
|
|
|
|
|
|
|
|
|
|
|
|
|
|
|
|
|
|
|
|
|
|
|
|
|
|
|
|
|
|
Three Months Ended |
|
Nine Months Ended |
||||||||
|
|
|
September 30, |
|
September 30, |
||||||||
|
|
|
2020 |
|
2019 |
|
2020 |
|
2019 |
||||
|
Net (loss) income |
|
$ |
(5,137) |
|
$ |
6,609 |
|
$ |
(62,936) |
|
$ |
(22,837) |
|
Foreign currency translation adjustments, net of tax of $0 |
|
|
809 |
|
|
(1,017) |
|
|
(2,848) |
|
|
2,005 |
|
Comprehensive (loss) income |
|
|
(4,328) |
|
|
5,592 |
|
|
(65,784) |
|
|
(20,832) |
|
Less: Comprehensive income attributable to non-controlling interest |
|
|
726 |
|
|
2,988 |
|
|
3,233 |
|
|
7,809 |
|
Comprehensive (loss) income attributable to NCS Multistage Holdings, Inc. |
|
$ |
(5,054) |
|
$ |
2,604 |
|
$ |
(69,017) |
|
$ |
(28,641) |
The accompanying notes are an integral part of these condensed consolidated financial statements.
5
CONDENSED CONSOLIDATED STATEMENTS OF STOCKHOLDERS’ EQUITY
(In thousands, except share data)
(Unaudited)
|
|
|
|
|
|
|
|
|
|
|
|
|
|
|
|
|
|
|
|
|
|
|
|
|
|
|
|
|
|
|
|
|
|
|
Three and Nine Months Ended September 30, 2020 |
||||||||||||||||||||||||||||
|
|
|
Preferred Stock |
|
Common Stock |
|
Additional |
|
Accumulated |
|
Retained |
|
Treasury Stock |
|
Non-controlling |
|
Total Stockholders' |
||||||||||||||
|
|
|
Shares |
|
Amount |
|
Shares |
|
Amount |
|
Capital |
|
Loss |
|
Deficit |
|
Shares |
|
Amount |
|
Interest |
|
Equity |
||||||||
|
Balances as of December 31, 2019 |
|
— |
|
$ |
— |
|
46,905,782 |
|
$ |
469 |
|
$ |
424,633 |
|
$ |
(80,811) |
|
$ |
(199,029) |
|
(92,665) |
|
$ |
(652) |
|
$ |
18,935 |
|
$ |
163,545 |
|
Share-based compensation |
|
— |
|
|
— |
|
— |
|
|
— |
|
|
2,950 |
|
|
— |
|
|
— |
|
— |
|
|
— |
|
|
— |
|
|
2,950 |
|
Net (loss) income |
|
— |
|
|
— |
|
— |
|
|
— |
|
|
— |
|
|
— |
|
|
(51,549) |
|
— |
|
|
— |
|
|
2,642 |
|
|
(48,907) |
|
Distribution to noncontrolling interest |
|
— |
|
|
— |
|
— |
|
|
— |
|
|
— |
|
|
— |
|
|
— |
|
— |
|
|
— |
|
|
(3,050) |
|
|
(3,050) |
|
Vesting of restricted stock |
|
— |
|
|
— |
|
481,996 |
|
|
5 |
|
|
(5) |
|
|
— |
|
|
— |
|
— |
|
|
— |
|
|
— |
|
|
— |
|
Shares withheld |
|
— |
|
|
— |
|
— |
|
|
— |
|
|
— |
|
|
— |
|
|
— |
|
(137,855) |
|
|
(151) |
|
|
— |
|
|
(151) |
|
Currency translation adjustment |
|
— |
|
|
— |
|
— |
|
|
— |
|
|
— |
|
|
(5,249) |
|
|
— |
|
— |
|
|
— |
|
|
— |
|
|
(5,249) |
|
Balances as of March 31, 2020 |
|
— |
|
$ |
— |
|
47,387,778 |
|
$ |
474 |
|
$ |
427,578 |
|
$ |
(86,060) |
|
$ |
(250,578) |
|
(230,520) |
|
$ |
(803) |
|
$ |
18,527 |
|
$ |
109,138 |
|
Share-based compensation |
|
— |
|
|
— |
|
— |
|
|
— |
|
|
1,722 |
|
|
— |
|
|
— |
|
— |
|
|
— |
|
|
— |
|
|
1,722 |
|
Net loss |
|
— |
|
|
— |
|
— |
|
|
— |
|
|
— |
|
|
— |
|
|
(8,757) |
|
— |
|
|
— |
|
|
(135) |
|
|
(8,892) |
|
Exercise of stock options |
|
— |
|
|
— |
|
13,500 |
|
|
— |
|
|
— |
|
|
— |
|
|
— |
|
— |
|
|
— |
|
|
— |
|
|
— |
|
Vesting of restricted stock |
|
— |
|
|
— |
|
13,324 |
|
|
— |
|
|
— |
|
|
— |
|
|
— |
|
— |
|
|
— |
|
|
— |
|
|
— |
|
Shares withheld |
|
— |
|
|
— |
|
— |
|
|
— |
|
|
— |
|
|
— |
|
|
— |
|
(4,493) |
|
|
(2) |
|
|
— |
|
|
(2) |
|
Currency translation adjustment |
|
— |
|
|
— |
|
— |
|
|
— |
|
|
— |
|
|
1,592 |
|
|
— |
|
— |
|
|
— |
|
|
— |
|
|
1,592 |
|
Balances as of June 30, 2020 |
|
— |
|
$ |
— |
|
47,414,602 |
|
$ |
474 |
|
$ |
429,300 |
|
$ |
(84,468) |
|
$ |
(259,335) |
|
(235,013) |
|
$ |
(805) |
|
$ |
18,392 |
|
$ |
103,558 |
|
Share-based compensation |
|
— |
|
|
— |
|
— |
|
|
— |
|
|
1,602 |
|
|
— |
|
|
— |
|
— |
|
|
— |
|
|
— |
|
|
1,602 |
|
Net (loss) income |
|
— |
|
|
— |
|
— |
|
|
— |
|
|
— |
|
|
— |
|
|
(5,863) |
|
— |
|
|
— |
|
|
726 |
|
|
(5,137) |
|
Distribution to noncontrolling interest |
|
— |
|
|
— |
|
— |
|
|
— |
|
|
— |
|
|
— |
|
|
— |
|
— |
|
|
— |
|
|
(750) |
|
|
(750) |
|
Vesting of restricted stock |
|
— |
|
|
— |
|
24,612 |
|
|
— |
|
|
— |
|
|
— |
|
|
— |
|
— |
|
|
— |
|
|
— |
|
|
— |
|
Shares withheld |
|
— |
|
|
— |
|
— |
|
|
— |
|
|
— |
|
|
— |
|
|
— |
|
(6,306) |
|
|
(4) |
|
|
— |
|
|
(4) |
|
Currency translation adjustment |
|
— |
|
|
— |
|
— |
|
|
— |
|
|
— |
|
|
809 |
|
|
— |
|
— |
|
|
— |
|
|
— |
|
|
809 |
|
Balances as of September 30, 2020 |
|
— |
|
$ |
— |
|
47,439,214 |
|
$ |
474 |
|
$ |
430,902 |
|
$ |
(83,659) |
|
$ |
(265,198) |
|
(241,319) |
|
$ |
(809) |
|
$ |
18,368 |
|
$ |
100,078 |
The accompanying notes are an integral part of these condensed consolidated financial statements.
6
NCS MULTISTAGE HOLDINGS, INC.
CONDENSED CONSOLIDATED STATEMENTS OF STOCKHOLDERS’ EQUITY
(In thousands, except share data)
(Unaudited)
|
|
|
|
|
|
|
|
|
|
|
|
|
|
|
|
|
|
|
|
|
|
|
|
|
|
|
|
|
|
|
|
|
|
|
Three and Nine Months Ended September 30, 2019 |
||||||||||||||||||||||||||||
|
|
|
Preferred Stock |
|
Common Stock |
|
Additional |
|
Accumulated |
|
Retained |
|
Treasury Stock |
|
Non-controlling |
|
Total Stockholders' |
||||||||||||||
|
|
|
Shares |
|
Amount |
|
Shares |
|
Amount |
|
Capital |
|
Loss |
|
Deficit |
|
Shares |
|
Amount |
|
Interest |
|
Equity |
||||||||
|
Balances as of December 31, 2018 |
|
1 |
|
$ |
— |
|
45,100,771 |
|
$ |
451 |
|
$ |
411,423 |
|
$ |
(84,030) |
|
$ |
(166,206) |
|
(28,308) |
|
$ |
(337) |
|
$ |
14,930 |
|
$ |
176,231 |
|
Share-based compensation |
|
— |
|
|
— |
|
— |
|
|
— |
|
|
2,968 |
|
|
— |
|
|
— |
|
— |
|
|
— |
|
|
— |
|
|
2,968 |
|
Net (loss) income |
|
— |
|
|
— |
|
— |
|
|
— |
|
|
— |
|
|
— |
|
|
(11,966) |
|
— |
|
|
— |
|
|
2,088 |
|
|
(9,878) |
|
Distribution to noncontrolling interest |
|
— |
|
|
— |
|
— |
|
|
— |
|
|
— |
|
|
— |
|
|
— |
|
— |
|
|
— |
|
|
(600) |
|
|
(600) |
|
Vesting of restricted stock |
|
— |
|
|
— |
|
168,563 |
|
|
2 |
|
|
(2) |
|
|
— |
|
|
— |
|
— |
|
|
— |
|
|
— |
|
|
— |
|
Shares withheld |
|
— |
|
|
— |
|
— |
|
|
— |
|
|
— |
|
|
— |
|
|
— |
|
(54,529) |
|
|
(309) |
|
|
— |
|
|
(309) |
|
Proceeds from the issuance of ESPP shares |
|
— |
|
|
— |
|
156,486 |
|
|
2 |
|
|
675 |
|
|
— |
|
|
— |
|
— |
|
|
— |
|
|
— |
|
|
677 |
|
Cemblend exchangeable shares |
|
(1) |
|
|
— |
|
1,326,935 |
|
|
13 |
|
|
(13) |
|
|
— |
|
|
— |
|
— |
|
|
— |
|
|
— |
|
|
— |
|
Currency translation adjustment |
|
— |
|
|
— |
|
— |
|
|
— |
|
|
— |
|
|
1,537 |
|
|
— |
|
— |
|
|
— |
|
|
— |
|
|
1,537 |
|
Balances as of March 31, 2019 |
|
— |
|
$ |
— |
|
46,752,755 |
|
$ |
468 |
|
$ |
415,051 |
|
$ |
(82,493) |
|
$ |
(178,172) |
|
(82,837) |
|
$ |
(646) |
|
$ |
16,418 |
|
$ |
170,626 |
|
Share-based compensation |
|
— |
|
|
— |
|
— |
|
|
— |
|
|
3,314 |
|
|
— |
|
|
— |
|
— |
|
|
— |
|
|
— |
|
|
3,314 |
|
Net (loss) income |
|
— |
|
|
— |
|
— |
|
|
— |
|
|
— |
|
|
— |
|
|
(22,301) |
|
— |
|
|
— |
|
|
2,733 |
|
|
(19,568) |
|
Currency translation adjustment |
|
— |
|
|
— |
|
— |
|
|
— |
|
|
— |
|
|
1,485 |
|
|
— |
|
— |
|
|
— |
|
|
— |
|
|
1,485 |
|
Balances as of June 30, 2019 |
|
— |
|
$ |
— |
|
46,752,755 |
|
$ |
468 |
|
$ |
418,365 |
|
$ |
(81,008) |
|
$ |
(200,473) |
|
(82,837) |
|
$ |
(646) |
|
$ |
19,151 |
|
$ |
155,857 |
|
Share-based compensation |
|
— |
|
|
— |
|
— |
|
|
— |
|
|
2,872 |
|
|
— |
|
|
— |
|
— |
|
|
— |
|
|
— |
|
|
2,872 |
|
Net income |
|
— |
|
|
— |
|
— |
|
|
— |
|
|
— |
|
|
— |
|
|
3,621 |
|
— |
|
|
— |
|
|
2,988 |
|
|
6,609 |
|
Distribution to noncontrolling interest |
|
— |
|
|
— |
|
— |
|
|
— |
|
|
— |
|
|
— |
|
|
— |
|
— |
|
|
— |
|
|
(2,800) |
|
|
(2,800) |
|
Vesting of restricted stock |
|
— |
|
|
— |
|
36,285 |
|
|
— |
|
|
— |
|
|
— |
|
|
— |
|
— |
|
|
— |
|
|
— |
|
|
— |
|
Shares withheld |
|
— |
|
|
— |
|
— |
|
|
— |
|
|
— |
|
|
— |
|
|
— |
|
(9,540) |
|
|
(21) |
|
|
— |
|
|
(21) |
|
Proceeds from the issuance of ESPP shares |
|
— |
|
|
— |
|
115,192 |
|
|
1 |
|
|
346 |
|
|
— |
|
|
— |
|
— |
|
|
— |
|
|
— |
|
|
347 |
|
Currency translation adjustment |
|
— |
|
|
— |
|
— |
|
|
— |
|
|
— |
|
|
(1,017) |
|
|
— |
|
— |
|
|
— |
|
|
— |
|
|
(1,017) |
|
Balances as of September 30, 2019 |
|
— |
|
$ |
— |
|
46,904,232 |
|
$ |
469 |
|
$ |
421,583 |
|
$ |
(82,025) |
|
$ |
(196,852) |
|
(92,377) |
|
$ |
(667) |
|
$ |
19,339 |
|
$ |
161,847 |
The accompanying notes are an integral part of these condensed consolidated financial statements.
7
CONDENSED CONSOLIDATED STATEMENTS OF CASH FLOWS
(In thousands)
(Unaudited)
|
|
|
|
|
|
|
|
|
|
|
Nine Months Ended |
||||
|
|
|
September 30, |
||||
|
|
|
2020 |
|
2019 |
||
|
Cash flows from operating activities |
|
|
|
|||
|
Net loss |
|
$ |
(62,936) |
|
$ |
(22,837) |
|
Adjustments to reconcile net loss to net cash provided by operating activities: |
|
|
|
|
|
|
|
Depreciation and amortization |
|
|
4,786 |
|
|
7,833 |
|
Impairment |
|
|
50,194 |
|
|
7,919 |
|
Amortization of deferred loan cost |
|
|
226 |
|
|
236 |
|
Write-off of deferred loan costs |
|
|
606 |
|
|
— |
|
Share-based compensation |
|
|
6,477 |
|
|
9,380 |
|
Provision for inventory obsolescence |
|
|
1,198 |
|
|
417 |
|
Deferred income tax (benefit) expense |
|
|
(2,069) |
|
|
9,281 |
|
Gain on sale of property and equipment |
|
|
(514) |
|
|
(300) |
|
Change in fair value of contingent consideration |
|
|
— |
|
|
37 |
|
Provision for doubtful accounts |
|
|
895 |
|
|
1,715 |
|
Payment of contingent consideration |
|
|
— |
|
|
(3,042) |
|
Proceeds from note receivable |
|
|
300 |
|
|
— |
|
Changes in operating assets and liabilities: |
|
|
|
|
|
|
|
Accounts receivable—trade |
|
|
25,814 |
|
|
(9,552) |
|
Inventories, net |
|
|
1,386 |
|
|
(8,218) |
|
Prepaid expenses and other assets |
|
|
(2,754) |
|
|
723 |
|
Accounts payable—trade |
|
|
(4,555) |
|
|
12,272 |
|
Accrued expenses |
|
|
131 |
|
|
(915) |
|
Other liabilities |
|
|
1,421 |
|
|
(805) |
|
Income taxes receivable/payable |
|
|
(6,098) |
|
|
671 |
|
Net cash provided by operating activities |
|
|
14,508 |
|
|
4,815 |
|
Cash flows from investing activities |
|
|
|
|
|
|
|
Purchases of property and equipment |
|
|
(1,882) |
|
|
(4,990) |
|
Purchase and development of software and technology |
|
|
— |
|
|
(251) |
|
Proceeds from sales of property and equipment |
|
|
704 |
|
|
816 |
|
Net cash used in investing activities |
|
|
(1,178) |
|
|
(4,425) |
|
Cash flows from financing activities |
|
|
|
|
|
|
|
Equipment note borrowings |
|
|
— |
|
|
835 |
|
Payments on equipment note and finance leases |
|
|
(1,268) |
|
|
(4,552) |
|
Line of credit borrowings |
|
|
5,000 |
|
|
— |
|
Payments on revolver |
|
|
(15,000) |
|
|
(7,000) |
|
Payment of contingent consideration |
|
|
— |
|
|
(6,958) |
|
Treasury shares withheld |
|
|
(157) |
|
|
(330) |
|
Distribution to noncontrolling interest |
|
|
(3,800) |
|
|
(3,400) |
|
Proceeds from the issuance of ESPP shares |
|
|
— |
|
|
1,025 |
|
Payment of deferred loan cost related to senior secured credit facility |
|
|
(482) |
|
|
(871) |
|
Net cash used in financing activities |
|
|
(15,707) |
|
|
(21,251) |
|
Effect of exchange rate changes on cash and cash equivalents |
|
|
(231) |
|
|
248 |
|
Net change in cash and cash equivalents |
|
|
(2,608) |
|
|
(20,613) |
|
Cash and cash equivalents beginning of period |
|
|
11,243 |
|
|
25,131 |
|
Cash and cash equivalents end of period |
|
$ |
8,635 |
|
$ |
4,518 |
|
Noncash investing and financing activities |
|
|
|
|
|
|
|
Leased assets obtained in exchange for new finance lease liabilities |
|
$ |
5,102 |
|
$ |
1,371 |
|
Leased assets obtained in exchange for new operating lease liabilities |
|
$ |
2,573 |
|
$ |
336 |
|
Return of vehicles under finance lease |
|
$ |
(722) |
|
$ |
— |
The accompanying notes are an integral part of these condensed consolidated financial statements.
8
NCS MULTISTAGE HOLDINGS, INC.
NOTES TO UNAUDITED CONDENSED CONSOLIDATED FINANCIAL STATEMENTS
NCS Multistage Holdings, Inc., a Delaware corporation, through its wholly owned subsidiaries and subsidiaries for which it has a controlling voting interest (collectively referred to as the “Company,” “NCS,” “we,” “our” and “us”), is primarily engaged in providing engineered products and support services for oil and natural gas well completions and field development strategies. We offer our products and services primarily to exploration and production companies for use in onshore wells. We operate through service facilities principally located in Houston and Odessa, Texas; Tulsa, Oklahoma; Billings, Montana; Morgantown, West Virginia; Calgary, Red Deer, Grande Prairie and Estevan, Canada; Neuquén, Argentina and Stavanger, Norway.
Basis of Presentation
Our accompanying unaudited condensed consolidated financial statements have been prepared in accordance with accounting principles generally accepted in the United States (“GAAP”) for interim financial information and with the instructions to Form 10-Q and Article 8 of Regulation S-X of the Securities Exchange Act of 1934, as amended, issued by the Securities Exchange Commission (“SEC”) and have not been audited by our independent registered public accounting firm. The condensed consolidated balance sheet at December 31, 2019 is derived from our audited financial statements. However, certain information and footnote disclosures required by GAAP for complete annual financial statements have been omitted or condensed as permitted by the rules and regulations of the SEC, and, therefore, these interim financial statements should be read in conjunction with our audited financial statements included in our Annual Report on Form 10-K for the year ended December 31, 2019, filed with the SEC on March 3, 2020. As NCS has the controlling voting interest in Repeat Precision, LLC (“Repeat Precision”), the other party’s ownership percentage is presented separately as a non-controlling interest. In the opinion of management, these condensed consolidated financial statements reflect all normal, recurring adjustments necessary for a fair statement of the interim periods presented. The results of operations for interim periods are not necessarily indicative of those for a full year. Certain reclassifications have been made to conform 2019 balances to our 2020 presentation on the condensed consolidated balance sheets. All intercompany accounts and transactions have been eliminated for purposes of preparing these condensed consolidated financial statements.
Recent Accounting Pronouncements
Pronouncements Adopted in 2020
In August 2018, the Financial Accounting Standards Board (“FASB”) issued Accounting Standards Update (“ASU”) No. 2018-15, Intangibles - Goodwill and Other-Internal-Use Software (Subtopic 350-40). The ASU aligns the requirements to capitalize implementation costs incurred in a cloud computing arrangement that is a service contract with the requirements to capitalize implementation costs incurred to develop or obtain internal-use software. For public entities, this guidance became effective for fiscal years beginning after December 15, 2019 and interim periods within those fiscal years. Early adoption was permitted, including adoption in any interim period. We adopted ASU No. 2018-15 on a prospective basis on January 1, 2020, with no material impact on our condensed consolidated financial statements.
In August 2018, the FASB issued ASU No. 2018-13, Fair Value Measurement (Topic 820). The ASU modifies, removes and adds certain disclosure requirements on fair value measurements. For public entities, this guidance became effective for fiscal years beginning after December 15, 2019 and interim periods within those fiscal years. Early adoption was permitted for all amendments. Alternatively, entities could early-adopt certain eliminated or modified disclosure requirements and delay the adoption of all new disclosure requirements until the effective date. We adopted ASU No. 2018-13 on January 1, 2020, with no material impact on our condensed consolidated financial statements.
Pronouncements Not Yet Effective
In March 2020, the FASB issued ASU No. 2020-04, Reference Rate Reform (Topic 848). The ASU provides optional guidance for a limited period of time to ease the potential burden in accounting for contracts, hedging relationships, and other transactions affected by the discontinuation of the London Interbank Offered Rate (“LIBOR”) or other interest rates used globally that could be discontinued. The amendments are effective for all entities as of March 12, 2020 through December 31, 2022. We are currently evaluating the impact of the adoption of this guidance.
In December 2019, the FASB issued ASU No. 2019-12, Income Taxes (Topic 740): Simplifying the Accounting for Income Taxes, which is intended to simplify various aspects related to accounting for income taxes. ASU No. 2019-12 removes certain exceptions to the general principles in Topic 740 and also clarifies and amends existing guidance to improve consistent application. For public
9
NCS MULTISTAGE HOLDINGS, INC.
NOTES TO UNAUDITED CONDENSED CONSOLIDATED FINANCIAL STATEMENTS
entities, this guidance is effective for fiscal years beginning after December 15, 2020 and interim periods within those fiscal years. We are currently evaluating the impact of the adoption of this guidance.
In June 2016, the FASB issued ASU No. 2016-13, Financial Instruments-Credit Losses (Topic 326). This ASU introduces a new impairment model that is based on expected credit losses rather than incurred credit losses for financial instruments, including trade accounts receivable. It requires an entity to measure expected credit losses for financial assets held at the reporting date based on historical experience, current conditions and reasonable and supportable forecasts. The new standard was to become effective for fiscal years beginning after December 15, 2019 and interim periods within those fiscal years. In November 2019, the FASB issued ASU No. 2019-10, which deferred the effective dates for certain accounting guidance (ASUs). The effective date for ASU No. 2016-13 will remain the same for public business entities that are SEC filers, except for entities who are deemed smaller reporting companies (“SRC”). The effective date for all other entities, including SRCs, will begin after December 15, 2022 and interim periods within those fiscal years. NCS qualifies as a SRC. We are currently evaluating the impact of the adoption of this guidance.
Note 2. Revenues
Disaggregation of Revenue
We sell our products and services primarily in North America and in selected international markets. Revenue by geography is attributed based on the current billing address of the customer. The following table depicts the disaggregation of revenue by geographic region (in thousands):
|
|
|
|
|
|
|
|
|
|
|
|
|
|
|
|
|
Three Months Ended |
|
Nine Months Ended |
||||||||
|
|
|
September 30, |
|
September 30, |
||||||||
|
|
|
2020 |
|
2019 |
|
2020 |
|
2019 |
||||
|
United States |
|
|
|
|
|
|
|
|
|
|
|
|
|
Product sales |
|
$ |
8,192 |
|
$ |
21,639 |
|
$ |
29,319 |
|
$ |
62,272 |
|
Services |
|
|
1,143 |
|
|
6,915 |
|
|
5,588 |
|
|
18,370 |
|
Total United States |
|
|
9,335 |
|
|
28,554 |
|
|
34,907 |
|
|
80,642 |
|
Canada |
|
|
|
|
|
|
|
|
|
|
|
|
|
Product sales |
|
|
2,762 |
|
|
18,531 |
|
|
24,740 |
|
|
43,953 |
|
Services |
|
|
931 |
|
|
7,590 |
|
|
9,819 |
|
|
18,670 |
|
Total Canada |
|
|
3,693 |
|
|
26,121 |
|
|
34,559 |
|
|
62,623 |
|
Other Countries |
|
|
|
|
|
|
|
|
|
|
|
|
|
Product sales |
|
|
706 |
|
|
3,586 |
|
|
1,889 |
|
|
4,708 |
|
Services |
|
|
2,578 |
|
|
2,512 |
|
|
8,239 |
|
|
5,418 |
|
Total Other Countries |
|
|
3,284 |
|
|
6,098 |
|
|
10,128 |
|
|
10,126 |
|
Total |
|
|
|
|
|
|
|
|
|
|
|
|
|
Product sales |
|
|
11,660 |
|
|
43,756 |
|
|
55,948 |
|
|
110,933 |
|
Services |
|
|
4,652 |
|
|
17,017 |
|
|
23,646 |
|
|
42,458 |
|
Total revenues |
|
$ |
16,312 |
|
$ |
60,773 |
|
$ |
79,594 |
|
$ |
153,391 |
When the timing of the delivery of products and provision of services is different from the timing of the customer payments, we recognize either a contract asset (performance precedes contractual due date in connection with estimates of variable consideration) or a contract liability (customer payment precedes performance) on our condensed consolidated balance sheet. We currently do not have any contract assets or non-current contract liabilities. The following table includes the current contract liabilities as of September 30, 2020 and December 31, 2019 (in thousands):
|
|
|
|
|
|
Balance at December 31, 2019 |
|
$ |
59 |
|
Additions |
|
|
- |
|
Revenue recognized |
|
|
(8) |
|
Balance at September 30, 2020 |
|
$ |
51 |
Our contract liability as of September 30, 2020 and December 31, 2019 is included in current liabilities on our condensed consolidated balance sheet. Our performance obligations for our product and service revenues are satisfied before the customer’s payment however prepayments may occasionally be required for international sales. Revenue recognized from the contract liability balance was $8 thousand and $0.6 million for the nine months ended September 30, 2020 and 2019, respectively.
10
NCS MULTISTAGE HOLDINGS, INC.
NOTES TO UNAUDITED CONDENSED CONSOLIDATED FINANCIAL STATEMENTS
Practical Expedient
We do not disclose the value of unsatisfied performance obligations when the related contract has a duration of one year or less or we recognize revenue equal to what we have the right to invoice when that amount corresponds directly with the value to the customer of our performance to date.
Note 3. Inventories, net
Inventories consist of the following as of September 30, 2020 and December 31, 2019 (in thousands):
|
|
|
|
|
|
|
|
|
|
|
September 30, |
|
December 31, |
||
|
|
|
2020 |
|
2019 |
||
|
Raw materials |
|
$ |
1,800 |
|
$ |
1,986 |
|
Work in process |
|
|
47 |
|
|
523 |
|
Finished goods |
|
|
34,739 |
|
|
37,412 |
|
Total inventories, net |
|
$ |
36,586 |
|
$ |
39,921 |
Note 4. Other Current Receivables
Other current receivables consist of the following as of September 30, 2020 and December 31, 2019 (in thousands):
|
|
|
|
|
|
|
|
|
|
|
September 30, |
|
December 31, |
||
|
|
|
2020 |
|
2019 |
||
|
Current income tax receivables |
|
$ |
9,347 |
|
$ |
4,777 |
|
Employee receivables |
|
|
467 |
|
|
5 |
|
Other receivables |
|
|
611 |
|
|
246 |
|
Total other receivables, net |
|
$ |
10,425 |
|
$ |
5,028 |
Employee receivables relate primarily to amounts paid by us for foreign withholding tax paid on behalf of employees working on international assignments, which is expected to be reimbursed to us by the employees when refunded as foreign tax credits on home-country tax returns.
Note 5. Property and Equipment
Property and equipment by major asset class consist of the following as of September 30, 2020 and December 31, 2019 (in thousands):
|
|
|
|
|
|
|
|
|
|
|
|
|
|
|
|
|
|
|
September 30, |
|
December 31, |
||
|
|
|
2020 |
|
2019 |
||
|
Land |
|
$ |
1,616 |
|
$ |
2,090 |
|
Building and improvements |
|
|
7,954 |
|
|
12,242 |
|
Machinery and equipment |
|
|
17,817 |
|
|
21,469 |
|
Computers and software |
|
|
2,333 |
|
|
2,694 |
|
Furniture and fixtures |
|
|
1,296 |
|
|
1,208 |
|
Vehicles |
|
|
499 |
|
|
646 |
|
Right of use assets - finance leases |
|
|
7,938 |
|
|
5,739 |
|
Service equipment |
|
|
244 |
|
|
244 |
|
|
|
|
39,697 |
|
|
46,332 |
|
Less: Accumulated depreciation and amortization |
|
|
(15,325) |
|
|
(14,333) |
|
|
|
|
24,372 |
|
|
31,999 |
|
Construction in progress |
|
|
139 |
|
|
975 |
|
Property and equipment, net |
|
$ |
24,511 |
|
$ |
32,974 |
In May 2020, we commenced a finance lease for land and a building in Odessa, Texas and recorded a long-term asset totaling $4.0 million and a corresponding lease liability. The lease has a ten-year term with two renewal periods available for an additional five years each.
11
NCS MULTISTAGE HOLDINGS, INC.
NOTES TO UNAUDITED CONDENSED CONSOLIDATED FINANCIAL STATEMENTS
We also maintain a vehicle leasing arrangement with a fleet management company in order to lease light vehicles and trucks that meet the criteria to record as finance leases. Due to unfavorable market conditions during 2020 associated primarily with the Coronavirus disease 2019 (“COVID-19”) pandemic, we returned many of these vehicles to the fleet management company for sale. During the nine months ended September 30, 2020, we retired lease vehicles with a historical cost of $2.9 million and accumulated depreciation of $1.8 million, or a net book value of $1.1 million, and an outstanding lease obligation totaling $0.7 million. The fleet management company sold the vehicles and we were entitled to proceeds of $1.0 million, of which we have received $0.7 million as of September 30, 2020. The surrender of the assets for sale and the retirement of the related lease obligations of $0.7 million has been included as a non-cash investing and financing activity in the accompanying condensed consolidated statements of cash flows for the nine months ended September 30, 2020.
The following table presents the depreciation expense associated with the following income statement line items for the three and nine months ended September 30, 2020 and 2019 (in thousands):
|
|
|
|
|
|
|
|
|
|
|
|
|
|
|
|
|
Three Months Ended |
|
Nine Months Ended |
||||||||
|
|
|
September 30, |
|
September 30, |
||||||||
|
|
|
2020 |
|
2019 |
|
2020 |
|
2019 |
||||
|
Cost of sales |
|
|
|
|
|
|
|
|
|
|
|
|
|
Cost of product sales |
|
$ |
258 |
|
$ |
682 |
|
$ |
1,341 |
|
$ |
2,015 |
|
Cost of services |
|
|
251 |
|
|
320 |
|
|
811 |
|
|
951 |
|
Selling, general and administrative expenses |
|
|
491 |
|
|
459 |
|
|
1,294 |
|
|
1,416 |
|
Total depreciation |
|
$ |
1,000 |
|
$ |
1,461 |
|
$ |
3,446 |
|
$ |
4,382 |
We evaluate our property and equipment for impairment whenever changes in circumstances indicate that the carrying amount of an asset group may not be recoverable. We performed an impairment analysis to assess the recoverability of the carrying values for our property and equipment during the first quarter of 2020 because we determined that a triggering event had occurred. Evidence that led to a triggering event included the industry conditions, such as a reduction in global economic growth expectations, a significantly reduced demand for crude oil and refined products, the significant decline in commodity prices and the corresponding impact on future expectations of demand for our products and services primarily related to the COVID-19 pandemic as well as the resulting decline in the quoted price of our common stock. As a result of the analysis, we recorded an impairment charge of $9.7 million in our property and equipment, primarily related to our land, building and improvements and machinery and equipment, because the carrying value exceeded the estimated fair value as of March 31, 2020. We did not identify any triggering events after March 31, 2020 through September 30, 2020 that required further impairment testing. Therefore, we have not recorded any impairment charges since March 31, 2020. No impairment charges were recorded for the three and nine months ended September 30, 2019.
Note 6. Goodwill and Identifiable Intangibles
Changes in the carrying amount of goodwill are as follows (in thousands):
|
|
|
|
|
|
|
|
|
|
|
|
|
|
|
|
|
|
|
|
|
|
|
|
|
Gross Value |
|
Accumulated Impairment |
|
Net |
|||
|
At December 31, 2018 |
|
$ |
177,115 |
|
$ |
(154,003) |
|
$ |
23,112 |
|
Impairment |
|
|
— |
|
|
(7,937) |
|
|
(7,937) |
|
Currency translation adjustment |
|
|
47 |
|
|
— |
|
|
47 |
|
At December 31, 2019 |
|
$ |
177,162 |
|
$ |
(161,940) |
|
$ |
15,222 |
|
Impairment |
|
|
— |
|
|
— |
|
|
— |
|
At September 30, 2020 |
|
$ |
177,162 |
|
$ |
(161,940) |
|
$ |
15,222 |
We perform our annual impairment analysis of goodwill as of December 31, or when there is an indication an impairment may have occurred. As of March 31, 2020, we performed a quantitative impairment analysis for goodwill utilizing a market participant perspective and determined that the fair value exceeded the carrying value of our reporting unit. During the second and third quarters of 2020, we did not identify any triggering events indicating potential impairment of goodwill. Accordingly, there was no impairment charge recorded for goodwill for the three and nine months ended September 30, 2020.
During the second quarter of 2019, we performed an impairment analysis for goodwill. Evidence of an indication of impairment included further deterioration in customer activity levels in North America, which resulted in lower demand for oilfield services driving a decrease in our market share and increased customer and competitor-driven pricing pressures in addition to a decline in the quoted price of our common stock. We determined that the carrying value of one of our reporting units exceeded its fair value and we recorded an impairment charge of $7.9 million for our tracer diagnostic services reporting unit. Following the impairment, our tracer
12
NCS MULTISTAGE HOLDINGS, INC.
NOTES TO UNAUDITED CONDENSED CONSOLIDATED FINANCIAL STATEMENTS
diagnostic services reporting unit had no remaining goodwill balance as of June 30, 2019. There was no indication an impairment may have occurred in any other reporting unit for the three and nine months ended September 30, 2019.
Identifiable intangibles by major asset class consist of the following (in thousands):
|
|
|
|
|
|
|
|
|
|
|
|
|
|
|
|
|
|
|
|
|
|
|
|
|
|
|
|
|
|
|
September 30, 2020 |
|||||||
|
|
|
Estimated |
|
Gross |
|
|
|
|
|
|
|
|
|
|
Useful |
|
Carrying |
|
Accumulated |
|
Net |
|||
|
|
|
Lives (Years) |
|
Amount |
|
Amortization |
|
Balance |
|||
|
Technology |
|
1 - 18 |
|
$ |
157 |
|
$ |
(64) |
|
$ |
93 |
|
Customer relationships |
|
10 |
|
|
4,100 |
|
|
(1,504) |
|
|
2,596 |
|
Total identifiable intangibles |
|
|
|
$ |
4,257 |
|
$ |
(1,568) |
|
$ |
2,689 |
|
|
|
|
|
|
|
|
|
|
|
|
|
|
|
|
|
|
|
|
|
|
|
|
|
|
|
|
|
|
|
December 31, 2019 |
|||||||
|
|
|
Estimated |
|
Gross |
|
|
|
|
|
|
|
|
|
|
Useful |
|
Carrying |
|
Accumulated |
|
Net |
|||
|
|
|
Lives (Years) |
|
Amount |
|
Amortization |
|
Balance |
|||
|
Technology |
|
8 - 18 |
|
$ |
17,721 |
|
$ |
(2,380) |
|
$ |
15,341 |
|
Trademarks |
|
5 - 10 |
|
|
1,600 |
|
|
(373) |
|
|
1,227 |
|
Customer relationships |
|
10 - 21 |
|
|
28,689 |
|
|
(3,928) |
|
|
24,761 |
|
Internally developed software |
|
5 |
|
|
4,904 |
|
|
(985) |
|
|
3,919 |
|
Total identifiable intangibles |
|
|
|
$ |
52,914 |
|
$ |
(7,666) |
|
$ |
45,248 |
Total amortization expense, which is associated with the selling, general and administrative expenses on the condensed consolidated statements of operations, was $0.1 million and $1.2 million for the three months ended September 30, 2020 and 2019, respectively, and $1.3 million and $3.5 million for the nine months ended September 30, 2020 and 2019, respectively.
Identifiable intangibles with definite lives are tested for impairment whenever events or changes in circumstances indicate that their carrying amount may not be recoverable. On March 31, 2020, we evaluated our finite-lived intangible assets for impairment due to current industry conditions including a reduction in global economic growth expectations, a significantly reduced demand for crude oil and refined products, the significant decline in commodity prices and the corresponding impact on future expectations of demand for our products and services primarily related to the COVID-19 pandemic as well as the resulting decline in the quoted price of our common stock. As a result of the analysis, we determined that the carrying values of certain intangible assets were no longer recoverable, which resulted in an impairment charge of $11.9 million in the asset group that includes fracturing systems and well construction related to technology and internally-developed software and an impairment charge of $28.6 million in our tracer diagnostics asset group related to customer relationships, technology, internally developed software and trademarks, each recorded on March 31, 2020. Following the impairment charges in the first quarter of 2020, we had no remaining identifiable intangible balances in the asset group that includes our fracturing systems and well construction or our tracer diagnostics asset group. There were no impairment charges recorded for our identifiable intangibles for the three months ended September 30, 2020 and 2019.
Note 7. Accrued Expenses
Accrued expenses consist of the following as of September 30, 2020 and December 31, 2019 (in thousands):
|
|
|
|
|
|
|
|
|
|
|
|
|
|
|
|
|
|
|
September 30, |
|
December 31, |
||
|
|
|
2020 |
|
2019 |
||
|
Accrued payroll and bonus |
|
$ |
1,131 |
|
$ |
2,558 |
|
Property and franchise taxes accrual |
|
|
479 |
|
|
462 |
|
Severance and other termination benefits (Note 10) |
|
|
1,316 |
|
|
— |
|
Accrued other miscellaneous liabilities |
|
|
668 |
|
|
431 |
|
Total accrued expenses |
|
$ |
3,594 |
|
$ |
3,451 |
13
NCS MULTISTAGE HOLDINGS, INC.
NOTES TO UNAUDITED CONDENSED CONSOLIDATED FINANCIAL STATEMENTS
Note 8. Debt
Our long-term debt consists of the following as of September 30, 2020 and December 31, 2019 (in thousands):
|
|
|
|
|
|
|
|
|
|
|
|
|
|
|
|
|
|
|
September 30, |
|
December 31, |
||
|
|
|
2020 |
|
2019 |
||
|
Senior Secured Credit Facility |
|
$ |
— |
|
$ |
10,000 |
|
Finance leases |
|
|
5,983 |
|
|
2,917 |
|
Total debt |
|
|
5,983 |
|
|
12,917 |
|
Less: current portion |
|
|
(1,446) |
|
|
(1,481) |
|
Long-term debt |
|
$ |
4,537 |
|
$ |
11,436 |
The estimated fair value of total debt as of September 30, 2020 and December 31, 2019 was $5.4 million and $12.5 million, respectively. The carrying value of the senior secured revolving credit facility and the lines of credit approximated the fair value of debt at December 31, 2019 since these facilities have variable interest rates and can be paid at any time. The fair value for the remaining debt was estimated using Level 2 inputs by calculating the sum of the discounted future interest and principal payments through the date of maturity.
Below is a description of our credit agreement and other financing arrangements.
Senior Secured Credit Facility
On May 1, 2019, we entered into a Second Amended and Restated Credit Agreement (the “Credit Agreement”) with Pioneer Investment, Inc., as borrower (the “U.S. Borrower”), NCS Multistage Inc., as borrower (the “Canadian Borrower”, together with the U.S. Borrower, the “Borrowers”), Pioneer Intermediate, Inc. (together with the Company, the “Parent Guarantors”) and the lenders party thereto, Wells Fargo Bank, National Association as administrative agent in respect of the U.S. Facility (as defined below) and Wells Fargo Bank, National Association, Canadian Branch, as administrative agent in respect of the Canadian Facility (as defined below) (the senior secured revolving credit facilities provided thereunder, the “Senior Secured Credit Facility”). The Credit Agreement amended and restated our prior credit agreement in its entirety.
On August 6, 2020, we entered into Amendment No. 1 (the “Amendment”) to the Credit Agreement (as amended by the Amendment, the “Amended Credit Agreement”) with Pioneer Investment, Inc., as borrower, NCS Multistage Inc., as borrower, Pioneer Intermediate, Inc., certain subsidiaries of the Borrowers, the lenders party thereto, Wells Fargo Bank, National Association as administrative agent in respect of the U.S. Facility and Wells Fargo Bank, National Association, Canadian Branch, as administrative agent in respect of the Canadian Facility (the U.S. Facility and the Canadian Facility, collectively, the “Facilities”).
The Amendment (i) reduced the U.S. Commitments (as defined in the Amended Credit Agreement) from $50.0 million to $25.0 million, of which up to $2.5 million may be made available for letters of credit and up to $2.5 million may be made available for swingline loans and (ii) reduced the Canadian Commitments (as defined in the Amended Credit Agreement) from $25.0 million to $0. The Canadian Borrower may make borrowings under the U.S. Facility, subject to a $15.0 million sublimit. The Amendment also limits total outstanding credit exposure of the lenders under the Facilities to a borrowing base calculated based on eligible receivables. Our borrowing base under the Senior Secured Credit Facility as of September 30, 2020 was $4.2 million. The maturity date of the Amended Credit Agreement remains May 1, 2023. We repaid the $15.0 million outstanding under the Senior Secured Credit Facility in connection with the Amendment. As of September 30, 2020, we had no outstanding indebtedness under the Senior Secured Credit Facility.
Borrowings under the Senior Secured Credit Facility may be made in U.S. dollars for Adjusted Base Rate Advances, and in U.S. dollars, Canadian dollars or Euros for Eurocurrency Rate Advances (each as defined in the Amended Credit Agreement). Such advances bear interest at the Adjusted Base Rate or at the Eurocurrency Rate (each as defined in the Amended Credit Agreement) plus an applicable interest margin between 2.75% and 3.75%, depending on our leverage ratio. The applicable interest rate at September 30, 2020 was 4.375% on the Senior Secured Credit Facility. We incurred interest expense related to the Senior Secured Credit Facility, including commitment fees, of $0.1 million and $0.3 million for the three months ended September 30, 2020 and 2019, respectively, and $0.6 million and $0.5 million for the nine months ended September 30, 2020 and 2019, respectively.
Pursuant to amended guaranty and security documents entered into concurrently with the Amendment, the obligations of the Borrowers under the Senior Secured Credit Facility are guaranteed by the Parent Guarantors, as well as each of the other existing and future direct and indirect restricted subsidiaries of NCS organized under the laws of the United States and Canada (subject to certain
14
NCS MULTISTAGE HOLDINGS, INC.
NOTES TO UNAUDITED CONDENSED CONSOLIDATED FINANCIAL STATEMENTS
exceptions), and are secured by substantially all of the assets of the Parent Guarantors, the Borrowers and such other subsidiary guarantors, in each case, subject to certain exceptions and permitted liens.
Prior to giving effect to the Amendment, the Credit Agreement contained financial covenants that required (i) commencing with the fiscal quarter ending June 30, 2019, compliance with a maximum leverage ratio test set at 2.50 to 1.00 as of the last day of each fiscal quarter, (ii) commencing with the fiscal quarter ending June 30, 2019, compliance with an interest coverage ratio test set at not more than 2.75 to 1.00 as of the last day of each fiscal quarter, (iii) if the leverage ratio as of the end of any fiscal quarter is greater than 2.00 to 1.00 and the amount outstanding under the Canadian Facility at any time during such fiscal quarter was greater than $0, compliance as of the end of such fiscal quarter with a Canadian asset coverage ratio test of at least 1.00 to 1.00 and (iv) if the leverage ratio as of the end of any fiscal quarter is greater than 2.00 to 1.00 and the amount outstanding under the Senior Secured Credit Facility at any time during such fiscal quarter was greater than $0, compliance as of the end of such fiscal quarter with a U.S. asset coverage ratio test of at least 1.00 to 1.00. Pursuant to the Amendment, we are no longer required to comply with the foregoing financial covenants.
Pursuant to the Amendment, the Amended Credit Agreement now requires us to (i) maintain liquidity (defined as availability under the Senior Secured Credit Facility plus certain cash deposits) of at least $7.5 million as of the date of each borrowing base certificate due to be delivered either monthly (if availability is greater than or equal to than 12%) or weekly (if availability is less than 12%) thereunder, (ii) maintain, for quarters during which availability is less than 20% of the borrowing base, a fixed charge coverage of at least 1.0 to 1.0 and (iii) on the last business day of each week, prepay advances to the extent that available cash exceeds $12.0 million. As of September 30, 2020, we were in compliance with these financial covenants. The Amendment also narrowed or eliminated several exceptions to prohibitions on the creation of liens, the incurrence of indebtedness, the making of investments and restricted payments and other negative covenants, rendering these covenants generally more restrictive. The Amendment reduced the dollar thresholds above which certain cross-defaults and adverse employee benefit plan events constitute events of default. The Amendment added a new event of default if the indebtedness of Repeat Precision exceeds $10.0 million.
The Amended Credit Agreement includes customary events of default for facilities of this type (with customary materiality thresholds and grace periods, as applicable). If an event of default occurs, the lenders party to the Amended Credit Agreement may elect (after the expiration of any applicable notice or grace periods) to declare all outstanding borrowings under such facility, together with accrued and unpaid interest and other amounts payable thereunder, to be immediately due and payable. The lenders party to the Amended Credit Agreement also have the right upon an event of default thereunder to terminate any commitments they have to provide further borrowings and to proceed against the collateral securing the Senior Secured Credit Facility.
We believe that our cash on hand, cash flows from operations and potential borrowings under our Senior Secured Credit Facility will be sufficient to fund our capital expenditures and liquidity requirements for the next twelve months. However, if the depressed market conditions, including reduced demand for oil, lower customer spending and the resulting low level of demand for our products and services continue, it will have a material negative impact on our financial performance. We can make no assurances that the current actions taken by us will provide us with enough liquidity in the future if the current economic environment worsens.
Direct costs of $0.9 million were incurred in 2019 in connection with the Senior Secured Credit Facility in addition to $0.3 million of unamortized deferred costs related to the modification of the prior senior secured credit facility. The costs were capitalized as an asset as they represent the benefit of being able to access capital over the contractual term and were being amortized over the term of the Senior Secured Credit Facility using the straight-line method. The Amendment reduced the overall potential capacity under the Amended Credit Agreement from $75.0 million to $25.0 million. Therefore, we expensed $0.6 million of deferred loan costs during the third quarter of 2020, which was commensurate with the reduction in potential capacity. We recorded new deferred loan costs associated with the Amendment totaling $0.6 million, which have been capitalized and will be amortized over the remaining term of the facility. Amortization expense of the deferred financing charges of $0.1 million was included in interest expense, net for each of the three months ended September 30, 2020 and 2019, respectively, and $0.2 million and $0.1 million for the nine months ended September 30, 2020 and 2019, respectively.
On February 27, 2017, Repeat Precision entered into a promissory note with Security State Bank & Trust, Fredericksburg, for an aggregate borrowing capacity of $3.8 million. The note bears interest at a variable interest rate based on prime plus 1.00%. The promissory note is collateralized by certain equipment, inventory and receivables. The promissory note was renewed on February 16, 2018 for an aggregate borrowing capacity of $4.3 million and was renewed again on February 14, 2020. The note is scheduled to mature on February 14, 2021. No other terms were changed. As of September 30, 2020 and December 31, 2019, we had no outstanding indebtedness under the promissory note.
15
NCS MULTISTAGE HOLDINGS, INC.
NOTES TO UNAUDITED CONDENSED CONSOLIDATED FINANCIAL STATEMENTS
On April 30, 2020, Repeat Precision entered into a promissory note with Security State Bank & Trust, Fredericksburg, for an aggregate borrowing capacity of $5.0 million. The note bears interest at a variable interest rate based on prime plus 1.00%. The promissory note is collateralized by certain equipment and inventory. The note is scheduled to mature on April 30, 2021. As of September 30, 2020, we had no outstanding indebtedness under the promissory note.
Note 9. Commitments and Contingencies
Litigation
In the ordinary course of our business, from time to time, we have various claims, lawsuits and administrative proceedings that are pending or threatened with respect to commercial, intellectual property and employee matters.
On July 24, 2018, we filed a patent infringement lawsuit against Kobold Corporation, Kobold Completions Inc. and 2039974 Alberta Ltd. (“Kobold”) in the Federal Court of Canada, alleging that Kobold’s fracturing tools and methods infringe on several of our Canadian patents. We previously filed a breach of contract lawsuit on March 16, 2018, against Kobold Corporation in the Court of Queen’s Bench of Alberta, alleging breach of a prior settlement agreement. Both of these lawsuits seek unspecified monetary damages and injunctive relief. On July 12, 2019, Kobold filed a counterclaim seeking unspecified damages alleging that our fracturing tools and methods infringe on their patent and that we made false and misleading statements about Kobold.
On April 3, 2020, the United States District Court for the Western District of Texas, Waco Division (“District Court”) issued a final judgment in connection with the litigation with Diamondback Industries, Inc (“Diamondback”) awarding Repeat Precision approximately $39.9 million (the “Award”) plus attorneys’ fees in connection with its breach of exclusive license, patent infringement and tortious interference claims. In its ruling, the District Court validated the terms of Repeat Precision’s exclusive license agreement with respect to the setting tool technology practicing U.S. Patent No. 9,810,035 (the “’035 Patent’) and enjoined Diamondback from selling its infringing SS line of setting tools. The judgment remains subject to appeal and, on April 21, 2020, Diamondback filed for Chapter 11 bankruptcy protection which stays any collection efforts. As of September 30, 2020, we have not recorded any amount in our condensed consolidated financial statements related to this gain contingency. In April 2020, we received $1.1 million of proceeds from our directors and officers liability insurance related to the reimbursement of legal expenses that we incurred to defend a director and officer in the Diamondback litigation, which was recorded in the condensed consolidated statements of operations under general and administrative expenses for the nine months ended September 30, 2020.
In accordance with GAAP, we accrue for contingencies where the occurrence of a material loss is probable and can be reasonably estimated, based on our estimate of the expected liability. If we have any outstanding legal accruals, we may increase or decrease these in the future, on a matter-by-matter basis, to account for developments. Our assessment of the likely outcome of litigation matters is based on our judgment of a number of factors, including experience with similar matters, past history, precedents, relevant financial information and other evidence and facts specific to the matter. While the outcome of any legal proceeding cannot be predicted with any certainty, based on a consideration of relevant facts and circumstances, our management currently does not expect that the results of these legal proceedings would have a material adverse effect on our financial position, results of operations or cash flows.
Operating Lease
In February 2020, we commenced an operating lease for our corporate headquarters in Houston, Texas and recorded a long-term asset totaling $2.4 million and a corresponding lease liability. The lease has a seven and a half year term with two renewal periods available for an additional five years each.
16
NCS MULTISTAGE HOLDINGS, INC.
NOTES TO UNAUDITED CONDENSED CONSOLIDATED FINANCIAL STATEMENTS
Note 10. Severance and Other Termination Benefits
On March 31, and April 1, 2020, we implemented, effective as of such date, a workforce reduction resulting in the termination of over 80 employees, furloughs for certain employees and lower compensation levels for executives and employees not participating in furloughs in response to the decrease in crude oil pricing, customer capital spending plans and activity as a result of the decline in market conditions primarily related to the COVID-19 pandemic and reduced demand for oil. On May 4, 2020 and in July 2020, we implemented, effective as of such date, additional workforce reductions resulting in the termination of approximately 50 employees per each reduction. In connection with these reductions in workforce and executive departures, we incurred cash severance costs, which are reflected in the condensed consolidated statements of operations under general and administrative expenses, of $0.8 million and $5.6 million for the three and nine months ended September 30, 2020.
Below is a reconciliation of the beginning and ending liability balance (in thousands):
|
|
|
|
|
|
Beginning balance, December 31, 2019 |
|
$ |
— |
|
Additions for costs expensed |
|
|
5,618 |
|
Severance payments |
|
|
(4,330) |
|
Currency translation adjustment |
|
|
28 |
|
Ending balance, September 30, 2020 |
|
$ |
1,316 |
We expect to finish paying off this severance and other terminations liability by May 2021.
Note 11. Share-Based Compensation
During the nine months ended September 30, 2020, we granted 501,049 equity-classified restricted stock units (“RSUs”) primarily to nonemployee members of the Board of Directors with a weighted average grant date fair value of $1.11. We account for RSUs granted to employees at fair value on the date of grant, which we measure as the closing price of our stock on the date of grant, and recognize the compensation expense in the financial statements over the requisite service period. RSUs generally vest over a period of three equal annual installments beginning on the anniversary of the date of grant other than those issued in connection with yearly award grants to members of our Board of Directors. The RSUs for the members of our Board will vest on the one-year anniversary of the grant date and will either settle at vesting or, if the director has elected to defer the RSUs, within thirty days following the earlier of the termination of the director’s service for any reason or a change of control.
During the nine months ended September 30, 2020, we granted 3,001,168 equivalent stock units, or cash-settled, liability-classified RSUs (“ESUs”), with a weighted average grant date fair value of $1.09. When the ESUs are originally granted to employees, they are valued at fair value, which we measure as the closing price of our common stock on the date of grant. As the ESUs will be settled in cash, they are remeasured each reporting period at fair value based upon the closing price of our common stock until the awards are settled. The ESUs will vest and settle ratably in three equal annual installments beginning on the anniversary of the date of grant. The cash settled for any ESU will not exceed the maximum payout established by our Compensation, Nominating and Governance Committee, which is generally two times the fair market value of our common stock as of a day near the grant date.
In addition, during the nine months ended September 30, 2020, we granted 1,036,185 performance stock unit awards (“PSUs”), which have a performance period from January 1, 2020 to December 31, 2022. The grant date fair value of the PSUs of $1.31 was measured using a Monte Carlo simulation. The number of PSUs ultimately issued under the program is dependent upon our total shareholder return relative to a performance peer group (“relative TSR”) over the three-year performance period. Each PSU will settle for between zero and two shares of our common stock in the first quarter of 2023. The threshold performance level (25th percentile relative TSR) starts to earn PSUs, the mid-point performance level (50th percentile relative TSR) earns 65% of the target PSUs and the maximum performance level (90th percentile relative TSR) or greater earns 200% of the target PSUs.
Total share-based compensation expense for all awards was $1.7 million and $2.9 million for the three months ended September 30, 2020 and 2019, respectively, and $6.5 million and $9.4 million for the nine months ended September 30, 2020 and 2019, respectively.
The computation of the annual expected effective tax rate at each interim period requires certain estimates and assumptions including, but not limited to, the expected operating income (or loss) for the year, projections of the proportion of income (or loss) earned and taxed in foreign jurisdictions, permanent and temporary differences and the likelihood of recovering deferred tax assets generated in the current year. The accounting estimates used to compute the provision for income taxes may change as new events
17
NCS MULTISTAGE HOLDINGS, INC.
NOTES TO UNAUDITED CONDENSED CONSOLIDATED FINANCIAL STATEMENTS
occur, more experience is acquired or additional information is obtained. The computation of the annual effective rate would include applicable modifications, which were projected for the year, such as certain book expenses not deductible for tax, tax credits and foreign deemed dividends.
We recorded a tax benefit of $3.1 million and $1.4 million for the three months ended September 30, 2020 and 2019, respectively. For the nine months ended September 30, 2020 and 2019, we recorded a tax (benefit) expense of $(10.0) million and $10.2 million, respectively. Included in the tax benefit for the nine months ended September 30, 2020 were several U.S. tax (benefit) expense adjustments related to the enactment of the Coronavirus Aid, Relief, and Economic Security Act (the “CARES Act”) including: (1) a tax benefit of $0.9 million which includes a decision to elect bonus depreciation in a prior year resulting in a Net Operating Loss (“NOL”) carryback and (2) tax expense of $9.7 million for an increase in a valuation allowance on deferred tax assets not expected to be realized. Also, included in tax benefit for the nine months ended September 30, 2020 was a tax expense in the amount of $1.2 million for a valuation allowance against our Canadian deferred tax asset based on management’s position that NCS has not met the more likely than not condition of realizing part of the deferred tax asset, as well as a benefit of $1.3 million related to a reduction in foreign tax expense. Included in tax expense for the nine months ended September 30, 2019 was a tax expense for a valuation allowance against our U.S. deferred tax asset based on management’s position that NCS has not met the more likely than not condition of realizing the deferred tax asset as well as the tax effect of a non-deductible goodwill impairment. These adjustments resulted in additional tax (benefit) expense for the three and nine months ended September 30, 2019 of approximately $(6.9) million and $11.7 million, respectively. Additionally, the effective tax rate for the nine months ended September 30, 2020 and 2019 included a tax expense of $1.4 million and $0.4 million, respectively, for the tax effect of stock awards.
On March 27, 2020, the CARES Act was enacted and signed into law and includes several provisions for corporations including allowing companies to carryback certain NOLs and increasing the amount of NOLs that corporations can use to offset income. Corporate taxpayers may carryback NOLs originating during 2018 through 2020 for up to five years and the CARES Act removes the 80% taxable income limitation on utilization of those NOLs if carried back to prior tax years or utilized in tax years beginning before 2021, which was not previously allowed under the U.S. Tax Cuts and Jobs Act of 2017 (the “2017 Tax Act”).
ASC 740 clarifies the accounting for uncertainty in income taxes recognized in an enterprise’s financial statements. The impact of an uncertain income tax position on the income tax returns must be recognized at the largest amount that is more-likely-than-not to be required to be recognized upon audit by the relevant taxing authority. This standard also provides guidance on de-recognition, measurement, classification, interest and penalties, accounting for interim periods, disclosure and transition issues with respect to tax positions. We include interest and penalties as a component of other income (expense), net in the condensed consolidated statements of operations. There were no interest and penalties for the nine months ended September 30, 2020. We recognized $42 thousand in interest and penalties for the nine months ended September 30, 2019.
18
NCS MULTISTAGE HOLDINGS, INC.
NOTES TO UNAUDITED CONDENSED CONSOLIDATED FINANCIAL STATEMENTS
Note 13. (Loss) Earnings Per Common Share
The following table presents the reconciliation of the numerator and denominator for calculating (loss) earnings per common share from net (loss) income (in thousands, except per share data):
|
|
|
|
|
|
|
|
|
|
|
|
|
|
|
|
|
|
|
|
|
|
|
|
|
|
|
|
|
|
|
Three Months Ended |
|
Nine Months Ended |
||||||||
|
|
|
September 30, |
|
September 30, |
||||||||
|
|
|
2020 |
|
2019 |
|
2020 |
|
2019 |
||||
|
Numerator—Basic |
|
|
|
|
|
|
|
|
|
|
|
|
|
Net (loss) income |
|
$ |
(5,137) |
|
$ |
6,609 |
|
$ |
(62,936) |
|
$ |
(22,837) |
|
Less: income attributable to non-controlling interest |
|
|
726 |
|
|
2,988 |
|
|
3,233 |
|
|
7,809 |
|
Net (loss) income attributable to |
|
$ |
(5,863) |
|
$ |
3,621 |
|
$ |
(66,169) |
|
$ |
(30,646) |
|
|
|
|
|
|
|
|
|
|
|
|
|
|
|
Numerator—Diluted |
|
|
|
|
|
|
|
|
|
|
|
|
|
Net (loss) income |
|
$ |
(5,137) |
|
$ |
6,609 |
|
$ |
(62,936) |
|
$ |
(22,837) |
|
Less: income attributable to non-controlling interest |
|
|
726 |
|
|
2,988 |
|
|
3,233 |
|
|
7,809 |
|
Net (loss) income attributable to |
|
$ |
(5,863) |
|
$ |
3,621 |
|
$ |
(66,169) |
|
$ |
(30,646) |
|
|
|
|
|
|
|
|
|
|
|
|
|
|
|
Denominator |
|
|
|
|
|
|
|
|
|
|
|
|
|
Basic weighted average number of shares |
|
|
47,351 |
|
|
46,892 |
|
|
47,240 |
|
|
46,552 |
|
Dilutive effect of stock options, RSUs, PSUs and ESPP |
|
|
— |
|
|
29 |
|
|
— |
|
|
— |
|
Diluted weighted average number of shares |
|
|
47,351 |
|
|
46,921 |
|
|
47,240 |
|
|
46,552 |
|
|
|
|
|
|
|
|
|
|
|
|
|
|
|
(Loss) earnings per common share |
|
|
|
|
|
|
|
|
|
|
|
|
|
Basic |
|
$ |
(0.12) |
|
$ |
0.08 |
|
$ |
(1.40) |
|
$ |
(0.66) |
|
Diluted |
|
$ |
(0.12) |
|
$ |
0.08 |
|
$ |
(1.40) |
|
$ |
(0.66) |
|
|
|
|
|
|
|
|
|
|
|
|
|
|
|
Potentially dilutive securities excluded as anti-dilutive |
|
|
4,598 |
|
|
4,184 |
|
|
4,594 |
|
|
4,357 |
19
NCS MULTISTAGE HOLDINGS, INC.
NOTES TO UNAUDITED CONDENSED CONSOLIDATED FINANCIAL STATEMENTS
The below pro-forma computation of loss (earnings) per share reflects the 1-for-20 reverse stock split that was approved by our Board of Directors and Advent International Corporation, who holds approximately 62.6% of our shares of common stock, on October 27, 2020 but is not yet effective (see Note 15) assuming it was retroactively effective for each of the periods presented:
|
|
|
|
|
|
|
|
|
|
|
|
|
|
|
|
|
Three Months Ended |
|
Nine Months Ended |
||||||||
|
|
|
September 30, |
|
September 30, |
||||||||
|
|
|
2020 |
|
2019 |
|
2020 |
|
2019 |
||||
|
Numerator—Basic |
|
|
|
|
|
|
|
|
|
|
|
|
|
Net (loss) income |
|
$ |
(5,137) |
|
$ |
6,609 |
|
$ |
(62,936) |
|
$ |
(22,837) |
|
Less: income attributable to non-controlling interest |
|
|
726 |
|
|
2,988 |
|
|
3,233 |
|
|
7,809 |
|
Net (loss) income attributable to |
|
$ |
(5,863) |
|
$ |
3,621 |
|
$ |
(66,169) |
|
$ |
(30,646) |
|
|
|
|
|
|
|
|
|
|
|
|
|
|
|
Numerator—Diluted |
|
|
|
|
|
|
|
|
|
|
|
|
|
Net (loss) income |
|
$ |
(5,137) |
|
$ |
6,609 |
|
$ |
(62,936) |
|
$ |
(22,837) |
|
Less: income attributable to non-controlling interest |
|
|
726 |
|
|
2,988 |
|
|
3,233 |
|
|
7,809 |
|
Net (loss) income attributable to |
|
$ |
(5,863) |
|
$ |
3,621 |
|
$ |
(66,169) |
|
$ |
(30,646) |
|
|
|
|
|
|
|
|
|
|
|
|
|
|
|
Denominator |
|
|
|
|
|
|
|
|
|
|
|
|
|
Pro forma basic weighted average number of shares |
|
|
2,368 |
|
|
2,345 |
|
|
2,362 |
|
|
2,328 |
|
Pro forma dilutive effect of stock options, RSUs, PSUs |
|
|
— |
|
|
1 |
|
|
— |
|
|
— |
|
Pro forma diluted weighted average number of shares |
|
|
2,368 |
|
|
2,346 |
|
|
2,362 |
|
|
2,328 |
|
|
|
|
|
|
|
|
|
|
|
|
|
|
|
Pro forma (loss) earnings per common share |
|
|
|
|
|
|
|
|
|
|
|
|
|
Basic |
|
$ |
(2.48) |
|
$ |
1.54 |
|
$ |
(28.01) |
|
$ |
(13.17) |
|
Diluted |
|
$ |
(2.48) |
|
$ |
1.54 |
|
$ |
(28.01) |
|
$ |
(13.17) |
|
|
|
|
|
|
|
|
|
|
|
|
|
|
|
Pro forma potentially dilutive securities excluded as |
|
|
230 |
|
|
209 |
|
|
230 |
|
|
218 |
Note 14. Segment and Geographic Information
We have determined that we operate in one reportable segment that has been identified based on how our chief operating decision maker manages our business. See “Note 2. Revenues” for our disaggregated revenue by geographic area.
In October 2020, we entered into an agreement to settle the Award entered into by the District Court, which will be effectuated through a Chapter 11 plan of reorganization that was filed by Diamondback and is currently set for confirmation on November 12, 2020. The agreement terminates if the bankruptcy court does not approve the plan by December 31, 2020. In connection with Repeat Precision releasing Diamondback and Derrek Drury (“Drury”) from the monetary damages in the Award and certain other claims, Repeat Precision expects to receive: (i) an upfront cash payment of approximately $15.5 million, (ii) the transfer of the ‘035 Patent from Diamondback to Repeat Precision, (iii) payments for future sales of certain setting tool sold by Diamondback or its successor as restitution, until $5 million has been paid in total, and (iv) a note from Drury payable in two years in the principal amount of up to $5 million secured by certain properties and other collateral. Repeat Precision and another claimant in the Diamondback bankruptcy have also agreed to provide mutual releases of all claims in exchange for consideration to be received by Repeat Precision, which is also conditioned on the effectiveness of the Chapter 11 plan. There are no assurances that the terms of any settlement will become effective, including uncertainty as to whether a Chapter 11 plan will be approved by the bankruptcy court, or that we will receive any portion of the settlement consideration.
Reverse Stock Split and Authorized Share Reduction
In connection with our efforts to regain compliance with Nasdaq Listing Rule 5450(a)(1), we expect to effect a reverse stock split of our issued and outstanding common stock on or about December 1, 2020. On October 27, 2020, funds affiliated with Advent
20
NCS MULTISTAGE HOLDINGS, INC.
NOTES TO UNAUDITED CONDENSED CONSOLIDATED FINANCIAL STATEMENTS
International Corporation, who beneficially hold 29,568,536 shares of our common stock as of such date, or approximately 62.6% of our shares of common stock, executed and delivered to the Board of Directors a written consent approving a proposal to effect a reverse stock split of our issued and outstanding common stock, with a ratio of 1-for-20 (the “reverse stock split”) and to reduce the number of authorized shares of our common stock by the same ratio as the reverse stock split. Our Board of Directors also approved the above reverse stock split and authorized share reduction on October 27, 2020. We expect our common stock to begin trading on Nasdaq on a split-adjusted basis when the market opens on December 1, 2020. Our Board of Directors reserves its right to elect not to proceed and abandon the reverse stock split if it determines, in its sole discretion, that this reverse stock split is no longer in the best interests of our stockholders.
To show the effect of the reverse stock split in the event it becomes effective, pro forma basic and diluted earnings per common share are disclosed in Note 13.
21
Item 2. Management’s Discussion and Analysis of Financial Condition and Results of Operations
The following discussion and analysis of our financial condition and results of our operations should be read together with our financial statements and the related notes thereto included in this Quarterly Report on Form 10-Q (“Quarterly Report”) and with our audited financial statements and the related notes thereto included in our Annual Report on Form 10-K (“Annual Report”), filed with the Securities and Exchange Commission (the “SEC”). This discussion and analysis contains forward-looking statements regarding the industry outlook, estimates and assumptions concerning events and financial and industry trends that may affect our future results of operations or financial condition and other non-historical statements. These forward-looking statements are subject to numerous risks and uncertainties, including but not limited to the risks and uncertainties described in “—Cautionary Note Regarding Forward-Looking Statements” and “Risk Factors.” Our actual results may differ materially from those contained in or implied by these forward-looking statements. As used in this Quarterly Report, except where the context otherwise requires or where otherwise indicated, the terms “Company,” “NCS,” “we,” “our” and “us” refer to NCS Multistage Holdings, Inc.
Overview
We are a leading provider of highly engineered products and support services that facilitate the optimization of oil and natural gas well completions and field development strategies. We provide our products and services primarily to exploration and production (“E&P”) companies for use in onshore wells, predominantly wells that have been drilled with horizontal laterals in unconventional oil and natural gas formations. Our products and services are utilized in oil and natural gas basins throughout North America and in selected international markets, including Argentina, China, Russia, the Middle East and the North Sea. We have provided our products and services to various customers, including leading large independent oil and natural gas companies and major oil companies.
Our primary offering is our fracturing systems products and services, which enable efficient pinpoint stimulation: the process of individually stimulating each entry point into a formation targeted by an oil or natural gas well. Our fracturing systems products and services are typically utilized in cemented wellbores and enable our customers to precisely place stimulation treatments in a more controlled and repeatable manner as compared with traditional completion techniques. Our fracturing systems products and services are utilized in conjunction with third-party providers of pressure pumping, coiled tubing and other services.
We own a 50% interest in Repeat Precision, LLC (“Repeat Precision”), which sells composite frac plugs and related products. We provide tracer diagnostics services for well completion and reservoir characterization that utilize downhole chemical and radioactive tracers. We sell products for well construction, including our AirLock casing buoyancy system, liner hanger systems and toe initiation sleeves. We operate in one reportable segment.
COVID-19 Impacts on the Oil & Gas Market and NCS Multistage
Coronavirus disease 2019 (“COVID-19”), an infectious disease caused by severe acute respiratory syndrome coronavirus 2, has spread globally. The World Health Organization (“WHO”) declared the COVID-19 outbreak a public health emergency of international concern on January 30, 2020 and a pandemic on March 11, 2020. According to Johns Hopkins University, as of October 31, 2020 there have been over 45 million confirmed cases, resulting in over 1.1 million deaths related to COVID-19 on a global basis.
Federal, state, provincial and local governments around the world have implemented measures designed to slow the spread of the coronavirus. These measures include, but are not limited to, quarantines, travel restrictions involving areas with large or growing confirmed case counts, school closures, social distancing guidelines intended to limit the size of group gatherings and maintain physical space between individuals and orders that workers in non-essential industries or roles work from home. In many countries, the most restrictive measures were eased throughout the second quarter, though case counts began rising during the third and fourth quarters in some areas, including several states in the U.S. and in Europe, following the relaxation of the restrictions.
These measures and restrictions have had material impacts on the global economy, resulting in a significant reduction in estimates for global gross domestic product (“GDP”) in 2020. In addition, businesses have been forced to shut down, either temporarily or permanently, resulting in a significant growth in unemployment rates, which have partially declined, but remain at elevated levels by historical standards.
The demand for crude oil has been materially reduced as a result of the measures taken by governments around the world to mitigate the spread of COVID-19, primarily due to significant reductions in air and motor vehicle travel, which has reduced the demand for jet fuel, diesel and gasoline, the key refined products derived from crude oil. In its September 2020 Oil Market Report, the International Energy Agency (“IEA”) stated that demand for crude oil for the full year in 2020 could be reduced by 8.4 MMBBL/D as compared to 2019, depending on COVID-19 case counts and the timing of and nature of a further resumption in global economic activity.
22
The significant reduction in global demand led to a decline in the average WTI crude oil price which was $27.96/BBL in the second quarter of 2020 before measures to restrict the spread of COVID-19 were put in place for most of the world. The average WTI crude oil price recovered to $40.89/BBL in the third quarter of 2020 but remains volatile. In addition, oil storage in OECD countries remains at elevated levels and floating storage is being utilized to hold excess crude oil. Members of the Organization of Petroleum Exporting Countries (“OPEC”) and certain other countries, including Russia, agreed to a collective reduction in oil production of 9.7 MMBBL/D in May, June and July of 2020, 7.7 MMBBL/D in August through December 2020 and 5.8 MMBBL/D in January 2021 through April 2022. The intent of the voluntary supply reductions is to attempt to increase the realized price of crude oil, and more specifically avoid overwhelming global oil storage capacity, allowing storage levels to return to normal over time as the economy and oil demand recovers.
As a result of the rapid and material reduction in oil pricing, E&P companies responded by significantly reducing their capital expenditure budgets for 2020, resulting in significant reductions in planned drilling and completion activity. In North America, reductions to initial 2020 E&P company capital budgets have ranged from 30% to nearly 100%, with some only spending the capital required to safely operate their existing productive assets. Reductions in activity began in mid-to-late March and decreases in completions activity occurred faster than reductions to drilling activity, as completions equipment is typically contracted on a short-term basis, while drilling rigs may be contracted for several months or years. Many E&P companies partially shut in production in areas where the marginal cash operating cost exceeds the market price. The amount of shut-in capacity in North America is believed to have peaked in May, with the volume of shut-in production reducing over time.
Low commodity prices are also impacting E&P companies that carry significant debt on their balance sheets and companies that rely on liquidity from loans that are based on the value of their oil and gas reserves. There have been several recent Chapter 11 bankruptcy filings by E&P companies, and the credit quality of the upstream oil and gas sector, our customer base, has been negatively impacted by the decline in market conditions, primarily related to the COVID-19 pandemic. We recorded a provision for bad debt expense of $0.9 million during the nine months ended September 30, 2020.
The reduction in customer capital spending and responses as a result of a decline in market conditions primarily related to the COVID-19 pandemic began to impact NCS in March 2020. Customers in North America began to quickly reduce the number of active completions crews, travel restrictions began to impact international operations, and activity in certain regions, including Argentina and China, was shut down due to government actions to contain the spread of COVID-19. In addition, customers began to notify us of their plans to further reduce capital spending and the resulting drilling and completion activity, which has reduced the anticipated level of demand for our products and services and the pricing we may receive for our products and services. These factors reduce our expectation of the amount of revenue and profit that we may generate for the remainder of the year and for as long as demand for oil remains below supply or as long as global oil storage levels remain elevated.
While we experienced modest disruptions to our supply chain as a result of the COVID-19 pandemic, including delays in importation of certain chemical products from China and temporary work-from-home orders that have reduced the capacity at the Repeat Precision machine shop operations in Mexico, such disruptions were temporary in nature, the impacted products are available through alternative sources of supply and we believe we have sufficient inventory on hand to meet customer demand. We have also experienced delays in access to certain materials and products utilized in our research and development activities, which may lead to delays in new product introductions.
In response to the current market conditions and reduction in demand for our products and services, including as a result of the COVID-19 pandemic, NCS has undertaken, and the Board of Directors is monitoring and evaluating, multiple initiatives to reduce our cost structure, limit capital expenditures and enhance our liquidity and access to capital, including:
|
· |
Reductions in force which have reduced our headcount in the U.S. and Canada by approximately 190 people, the implementation of furloughs for certain employees in field operations and engineering roles and reductions to salaries and hourly rates for substantially all remaining employees, including reductions in salaries for executives averaging 20%. These actions are expected to result in approximately $20 million in annualized cost savings, with approximately 70% of that amount associated with selling, general and administrative (“SG&A”) expenses; |
|
· |
A reduction in bonus accruals for 2020 and the decision to not pay out 2019 bonuses; |
|
· |
An elimination of the employer matching contributions for NCS’s U.S. 401(k) plan and its Registered Retirement Savings Plan in Canada; |
|
· |
A moratorium on non-essential travel for all employees; |
|
· |
Negotiation of new rates, work rules and payment schedules with vendors; |
|
· |
Strategies to reduce third-party spend, including information technology, financial services and third-party research and development; |
23
|
· |
Deferral of U.S. employer payroll taxes, as permitted under the Coronavirus Aid, Relief, and Economic Security Act (the “CARES Act”); |
|
· |
Application for, and receipt of, benefits under the Canada Emergency Wage Subsidy (“CEWS”) program; |
|
· |
Accelerating the filing of our 2019 U.S. federal tax return to utilize Net Operating Loss (“NOL”) carryback provisions from the CARES Act in order to obtain a cash tax refund during the fourth quarter of 2020; |
|
· |
Reducing planned capital expenditures for the year and selling excess vehicles; |
|
· |
Closing our district operational facilities in Corpus Christi and Oklahoma City and relocating our U.S. assembly operations to better align with our supply chain partners, which reduces overhead and improves fixed cost absorption; |
|
· |
In April 2020, Repeat Precision entered into a new promissory note providing up to $5.0 million in additional borrowing capacity; and |
NCS continues to evaluate market conditions and will continue to take necessary actions to further reduce our cost base and enhance liquidity should there be a further reduction in the demand for our products and services.
In connection with the reductions in force described above, NCS recorded severance expense of $1.3 million in the first quarter of 2020, $3.5 million in the second quarter of 2020 and $0.8 million in the third quarter of 2020.
As a result of the decrease in crude oil pricing, customer capital spending plans and activity as a result of the decline in market conditions primarily related to the COVID-19 pandemic as well as the resulting decline in the quoted price of our common stock, we assessed the recoverability of the carrying value of our property and equipment and finite-lived intangible assets as of March 31, 2020 and determined that a triggering event had occurred. As a result of the analysis, we recorded impairment charges of $9.7 million in property and equipment and $40.5 million related to identifiable intangible assets, which we recorded during the first quarter of 2020. There were no impairment charges recorded on our property and equipment or identifiable intangible assets during the second or third quarters of 2020. For additional information, see “Note 5. Property and Equipment” and “Note 6. Goodwill and Identifiable Intangibles” of our unaudited condensed consolidated financial statements.
On August 6, 2020, we entered into an amendment to our Senior Secured Credit Facility which, among other changes, reduced the lender commitments in the U.S. under our Senior Secured Credit Facility to $25.0 million and further limited the amount we may borrow dependent on a borrowing base calculated based on eligible receivables. See —Liquidity and Capital Resources—Financing Arrangements for a description of the amendment. Our borrowing base under the Senior Secured Credit Facility as of September 30, 2020 was $4.2 million. The amount available to be drawn under the Senior Secured Credit Facility may decline from current levels, including as a result of reductions in our borrowing base or a springing financial covenant, if our business continues to be adversely impacted by a decline in market conditions primarily related to the COVID-19 pandemic.
See Item 1A. Risk Factors below for a discussion of additional actual or potential impacts of the COVID-19 pandemic on our business and operations.
Outlook
Based on revised capital budgets for 2020 that have been set by E&P companies, we believe that industry drilling and completions activity in North America will be more than 50% lower in 2020 than it was in 2019. Many of our customers in North America are reducing capital spending as much as possible in order to generate free cash flow or minimize the extent of negative free cash flow. Drilling activity in the U.S. has declined sequentially throughout 2020 before stabilizing at low levels at the end of the third quarter and increasing modestly early in the fourth quarter. Completions activity in the U.S. is also expected to increase slightly in the fourth quarter of 2020 as compared to the third quarter. We believe that the rig count in Canada in the second quarter of 2020 was at the lowest levels of the last 50 years and did not experience a material seasonal increase in the third quarter of 2020. The Canadian rig count remains well below seasonal averages thus far in the fourth quarter, but has improved from the average rig count observed in the third quarter of 2020. The low level of industry activity has led, and is expected to continue to lead, to intense competitive pressure across all of our product and service offerings in North America, which impacts our market share as well as our margins. We currently expect international industry activity to decline in 2020 as compared to 2019 as international E&P companies continue to adjust their budgets and activity levels in response to the COVID-19 pandemic and the resulting market conditions.
24
Market Conditions
Oil and Natural Gas Drilling and Completion Activity
Our products and services are primarily sold to North American E&P companies and our ability to generate revenues from our products and services depends upon oil and natural gas drilling and completion activity in North America. Oil and natural gas drilling and completion activity is directly related to oil and natural gas prices.
Oil and natural gas prices remain volatile, with WTI crude oil pricing of approximately $61 per barrel in December 2019 before falling significantly to approximately $21 per barrel by the end of March 2020 and averaging $40.89 per barrel during the third quarter of 2020. Crude oil pricing has historically been supported by voluntary oil production reductions by members of OPEC, and certain other countries, including Russia. In response to decreased demand related to the COVID-19 pandemic, this group agreed to a collective reduction in oil production of 9.7 MMBBL/D in May, June and July of 2020, 7.7 MMBBL/D in August through December 2020 and 5.8 MMBBL/D in January 2021 through April 2022. The intent of the voluntary supply reductions is to attempt to increase the realized price of crude oil, and more specifically avoid overwhelming global oil storage capacity and allow storage levels to return to normal levels over time as the economy and oil demand recovers. There can be no assurance that the countries involved will comply with the intended reductions.
Natural gas pricing was at an average level of $2.56 per MMBtu during 2019 but has fallen to an average level of $2.00 per MMBtu during the third quarter of 2020 as supply has exceeded demand, which has been negatively impacted by the COVID-19 pandemic and resulting market conditions. Realized natural gas prices for Canadian E&P customers are typically at a discount to U.S. Henry Hub pricing. Spot pricing for Canadian natural gas at the AECO hub has been volatile since mid-2017, with wide discounts to Henry Hub pricing resulting from infrastructure bottlenecks.
Sustained declines in commodity prices, or sustained periods when the local pricing received in regional markets is below benchmark pricing, known in the industry as high differentials, would be expected to lead North American E&P companies to further reduce drilling and completion activity, which could negatively impact our business.
Listed and depicted below are recent crude oil and natural gas pricing trends, as provided by the Energy Information Administration (“EIA”) of the U.S. Department of Energy:
|
|
|
|
|
|
|
|
|
|
|
|
|
|
Average Price |
|||||||
|
Quarter Ended |
|
WTI Crude (per Bbl) |
|
Brent Crude |
|
Henry Hub Natural Gas |
|||
|
9/30/2019 |
|
|
56.34 |
|
|
61.95 |
|
|
2.38 |
|
12/31/2019 |
|
|
56.82 |
|
|
63.17 |
|
|
2.40 |
|
3/31/2020 |
|
|
45.54 |
|
|
50.45 |
|
|
1.90 |
|
6/30/2020 |
|
|
27.96 |
|
|
29.70 |
|
|
1.70 |
|
9/30/2020 |
|
|
40.89 |
|
|
42.91 |
|
|
2.00 |
25
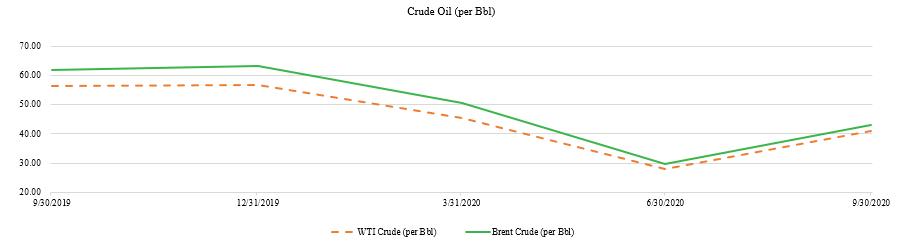
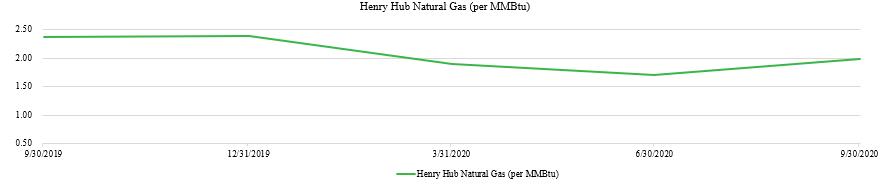
Listed and depicted below are the average number of operating onshore rigs in the U.S. and in Canada per quarter since the third quarter of 2019, as provided by Baker Hughes Company (“Baker Hughes”). The quarterly changes in the Canadian land rig count can be partially attributed to seasonality of activity in that market:
|
|
|
|
|
|
|
|
|
|
|
Average Drilling Rig Count |
||||
|
Quarter Ended |
|
U.S. Land |
|
Canada Land |
|
North America Land |
|
9/30/2019 |
|
894 |
|
130 |
|
1,024 |
|
12/31/2019 |
|
797 |
|
136 |
|
933 |
|
3/31/2020 |
|
764 |
|
194 |
|
958 |
|
6/30/2020 |
|
378 |
|
23 |
|
401 |
|
9/30/2020 |
|
241 |
|
46 |
|
287 |
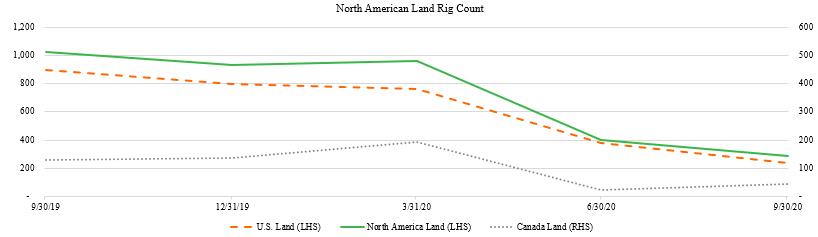
Over the past several years, North American E&P companies have been able to reduce their cost structures and have also utilized technologies, including ours, to increase efficiency and improve well performance. The rig count in the U.S. began to decline in 2019, and the decline has accelerated in 2020 with the U.S. rig count decreasing during the third quarter of 2020 from the second quarter of 2020 by 36%. The average land rig count in Canada for the third quarter was 65% lower than in the same period in 2019 and was at 85 rigs by the end of October 2020, up from 12 rigs at June 30, 2020, the lowest level ever recorded by Baker Hughes. The U.S. and Canadian rig counts are expected to remain significantly below prior year levels for the remainder of 2020.
A substantial portion of our business is subject to quarterly variability. In Canada, we typically experience higher activity levels in the first quarter of each year, as our customers take advantage of the winter freeze to gain access to remote drilling and production
26
areas. In the past, our revenue in Canada has declined during the second quarter due to warming weather conditions that result in thawing, softer ground, difficulty accessing drill sites and road bans that curtail drilling and completion activity. Access to well sites typically improves throughout the third and fourth quarters in Canada, leading to activity levels that are higher than in the second quarter, but lower than activity in the first quarter. However, as a result of the decline in market conditions primarily related to the COVID-19 pandemic, we do not expect to experience a material seasonal increase in Canada in the fourth quarter of this year. Our business can also be impacted by a reduction in customer activity during the winter holidays in late December and early January. In recent years, many customers in the U.S. exhausted their capital budgets prior to the end of the year, leading to reductions in drilling and completion activity during the fourth quarter.
The market in Canada also continues to be impacted by logistical constraints in moving oil and natural gas from areas of production activity to demand centers. These constraints have led to lower realized pricing for our Canadian customers.
The industry experienced a reduction in completions activity in the United States that began in the second half of 2018, which has extended through 2019 and into 2020, with the reduction further accelerating beginning in March 2020 before reversing during the late third quarter and early fourth quarter of 2020. In addition, revised capital budgets from E&P companies indicate that capital spending in 2020 is expected to be at least 50% below capital spending in 2019.
Adoption of Pinpoint Stimulation
Traditional well completion techniques, including plug and perf and ball drop, currently account for the majority of unconventional well completions in North America and over 90% of unconventional well completions in the U.S. We believe that pinpoint stimulation provides benefits compared to these traditional well completion techniques. Our ability to grow our market share, as evidenced by the percentage of horizontal wells in North America completed using our products and services, will depend in large part on the industry’s further adoption of pinpoint stimulation to complete wells, our ability to continue to innovate our technology to compete against continuing technological advances in competing traditional well completions techniques, and our ability to successfully compete with other providers of pinpoint stimulation products and services, including adjusting our pricing in certain markets to respond to customer demands and to competitors that may provide discounted pricing to our customers.
Increasing Well Complexity and Focus on Completion Optimization
In recent years, E&P companies have drilled longer horizontal wells and completed more hydraulic fracturing stages per well to maximize the volume of hydrocarbon recoveries per well. This trend towards longer and more complex wells has resulted in us selling more sliding sleeves or composite frac plugs per well on average, which increases our revenue opportunity per well completion and has led to increased sales of our AirLock casing buoyancy systems. Additionally, E&P companies have become increasingly focused on well productivity through optimization of completion designs and we believe this trend may further the adoption of pinpoint stimulation, and in turn, increase the opportunity for sales of our products and services if our customers observe operational benefits and long-term production results from the application of pinpoint stimulation. This trend towards more complex well completions has also resulted in increased use of tracer diagnostics services, which can be utilized to assess the effectiveness of various well completion techniques and well spacing strategies in support of completion and field development optimization efforts.
How We Generate Revenues
We derive our revenues from the sale of our fracturing systems products and the provision of related services, the sale of composite frac plugs and related products through Repeat Precision and from sales of our tracer diagnostics services, AirLock casing buoyancy system, liner hanger systems and toe initiation sleeves products.
Product sales represented 71% and 72% of our revenues for the three months ended September 30, 2020 and 2019, respectively, and 70% and 72% for the nine months ended September 30, 2020 and 2019, respectively. Most of our sales are on a just-in-time basis, as specified in individual purchase orders, with a fixed price for our products. We occasionally supply our customers with large orders that may be filled on negotiated terms. Services represented 29% and 28% of our revenues for the three months ended September 30, 2020 and 2019, respectively, and 30% and 28% for the nine months ended September 30, 2020 and 2019, respectively. Services include our tool charges and associated services related to our fracturing systems and tracer diagnostics services (which are classified together as “services” in our financial results). Services are provided at agreed rates we charge to our customers for the provision of our downhole frac isolation assembly, our personnel and for the provision of tracer diagnostics services.
During periods of low drilling and well completion activity or as may be needed to compete in certain markets we will, in certain instances, lower the prices of our products and services. Our revenues are also impacted by well complexity, with wells with more stages resulting in longer jobs and increased revenue attributable to selling more sliding sleeves or composite frac plugs and the provision of our services.
27
The percentages of our revenue derived from sales in Canada and denominated in Canadian dollars were approximately 23% and 43% for the three months ended September 30, 2020 and 2019, respectively, and approximately 43% and 41% for the nine months ended September 30, 2020 and 2019, respectively. Because our Canadian contracts are typically invoiced in Canadian dollars, the effects of foreign currency fluctuations impact our revenues and are regularly monitored.
Although most of our sales are to North American E&P companies, we also have sales to customers outside of North America and expect sales to international customers to increase over time. These international sales are made through local NCS entities or to our local operating partners on a free on board or free carrier basis with a point of sale in the United States. Some of the locations in which we have operating partners or sales representatives include China and the Middle East. Our operating partners and representatives do not have authority to contractually bind NCS but market our products in their respective territories as part of their product or service offering.
Costs of Conducting our Business
Our cost of sales is comprised of expenses relating to the manufacture of our products in addition to the costs of our support services. Manufacturing cost of sales includes payments made to our suppliers for raw materials and payments made to machine shops for the manufacturing of product components and finished assemblies and costs related to our employees that perform quality control analysis, assemble and test our products. Our strategic 50% purchase of Repeat Precision has allowed us to reduce our costs for certain product categories. We review forecasted activity levels in our business and either directly procure or ensure that our vendors procure the required raw materials with sufficient lead time to meet our business requirements. On September 24, 2018, the United States implemented a tariff of 10% on a significant number of commodities originating from China, including certain chemicals utilized in our tracer diagnostics business. The tariffs were subsequently increased to 25% in May 2019. The increased tariffs have resulted in an increase in our cost of sales. While we strive to pass through some of the increases in raw material costs directly resulting from the tariffs to our customers, there can be no assurance that we will be able to do so. Cost of sales for support services includes compensation and benefit-related expenses for employees who provide direct revenue generating services to customers in addition to the costs incurred by these employees for travel and subsistence while on site. Cost of sales includes other variable manufacturing costs, such as shrinkage, obsolescence, revaluation and scrap related to our existing inventory and costs related to the chemicals and laboratory analysis associated with our tracer diagnostics services.
Our SG&A expenses are comprised of compensation expense, which includes compensation and benefit-related expenses for our employees who are not directly involved in revenue generating activities, including those involved in our research and development activities, as well as our general operating costs. These general operating costs include, but are not limited to: rent and occupancy for our facilities, information technology infrastructure services, software licensing, advertising and marketing, third party research and development, risk insurance and professional service fees for audit, legal and other consulting services. Our SG&A expenses also include severance expenses, litigation expenses and provisions for doubtful accounts. As a result of being a public company, our legal, accounting and other expenses have increased and will further increase for costs associated with our compliance with the Sarbanes-Oxley Act.
The percentage of our costs, defined as cost of sales, excluding depreciation and amortization, and including SG&A, denominated in Canadian dollars were approximately 9% and 22% for the three months ended September 30, 2020 and 2019, respectively, and approximately 20% for each of the nine months ended September 30, 2020 and 2019, respectively.
28
Results of Operations
Three Months Ended September 30, 2020 Compared to Three Months Ended September 30, 2019
The following table summarizes our revenues and expenses for the periods presented (dollars in thousands):
|
|
|
|
|
|
|
|
|
|
|
|
|
|
|
|
|
|
|
|
|
|
|
|
|
|
|
|
|
|
|
Three Months Ended |
|
|
|
|
|
|
||||
|
|
|
September 30, |
|
Variance |
||||||||
|
|
|
2020 |
|
2019 |
|
$ |
|
% |
||||
|
Revenues |
|
|
|
|
|
|
|
|
|
|
|
|
|
Product sales |
|
$ |
11,660 |
|
$ |
43,756 |
|
$ |
(32,096) |
|
(73.4) |
% |
|
Services |
|
|
4,652 |
|
|
17,017 |
|
|
(12,365) |
|
(72.7) |
% |
|
Total revenues |
|
|
16,312 |
|
|
60,773 |
|
|
(44,461) |
|
(73.2) |
% |
|
Cost of sales |
|
|
|
|
|
|
|
|
|
|
|
|
|
Cost of product sales, exclusive of depreciation and amortization expense shown below |
|
|
7,874 |
|
|
23,796 |
|
|
(15,922) |
|
(66.9) |
% |
|
Cost of services, exclusive of depreciation and amortization expense shown below |
|
|
2,334 |
|
|
8,413 |
|
|
(6,079) |
|
(72.3) |
% |
|
Total cost of sales, exclusive of depreciation and amortization expense shown below |
|
|
10,208 |
|
|
32,209 |
|
|
(22,001) |
|
(68.3) |
% |
|
Selling, general and administrative expenses |
|
|
12,474 |
|
|
20,441 |
|
|
(7,967) |
|
(39.0) |
% |
|
Depreciation |
|
|
1,000 |
|
|
1,461 |
|
|
(461) |
|
(31.6) |
% |
|
Amortization |
|
|
103 |
|
|
1,153 |
|
|
(1,050) |
|
(91.1) |
% |
|
(Loss) income from operations |
|
|
(7,473) |
|
|
5,509 |
|
|
(12,982) |
|
(235.7) |
% |
|
Other income (expense) |
|
|
|
|
|
|
|
|
|
|
|
|
|
Interest expense, net |
|
|
(876) |
|
|
(424) |
|
|
(452) |
|
(106.6) |
% |
|
Other income, net |
|
|
414 |
|
|
259 |
|
|
155 |
|
59.8 |
% |
|
Foreign currency exchange loss, net |
|
|
(260) |
|
|
(131) |
|
|
(129) |
|
(98.5) |
% |
|
Total other expense |
|
|
(722) |
|
|
(296) |
|
|
(426) |
|
(143.9) |
% |
|
(Loss) income before income tax |
|
|
(8,195) |
|
|
5,213 |
|
|
(13,408) |
|
(257.2) |
% |
|
Income tax benefit |
|
|
(3,058) |
|
|
(1,396) |
|
|
(1,662) |
|
(119.1) |
% |
|
Net (loss) income |
|
|
(5,137) |
|
|
6,609 |
|
|
(11,746) |
|
(177.7) |
% |
|
Net income attributable to noncontrolling interest |
|
|
726 |
|
|
2,988 |
|
|
(2,262) |
|
(75.7) |
% |
|
Net (loss) income attributable to NCS Multistage Holdings, Inc. |
|
$ |
(5,863) |
|
$ |
3,621 |
|
$ |
(9,484) |
|
(261.9) |
% |
Revenues
Revenues were $16.3 million for the three months ended September 30, 2020 as compared to $60.8 million for the three months ended September 30, 2019. This decrease reflected reductions in product sales and services volumes in North America as well as lower pricing for certain products and services, including composite plugs and tracer diagnostics, and lower product sales in international markets. We believe the decrease in both activity and pricing resulting from the decline in market conditions primarily related to the COVID-19 pandemic, which had a negative impact on our revenues during the three months ended September 30, 2020 as drilling rig and completion activity in the U.S. declined sequentially throughout 2020 before stabilizing at low levels at the end of the third quarter and did not experience a material seasonal increase in Canada in the third quarter of 2020. Product sales for the three months ended September 30, 2020 were $11.7 million as compared to $43.8 million for the three months ended September 30, 2019. Services revenue was $4.7 million for the three months ended September 30, 2020 as compared to $17.0 million for the three months ended September 30, 2019.
Cost of sales was $10.2 million, or 62.6% of revenues, for the three months ended September 30, 2020 as compared to $32.2 million, or 53.0% of revenues, for the three months ended September 30, 2019. Cost of sales as a percentage of revenues increased due to the significant reduction in revenue, leading to under-utilization of manufacturing capacity and field service personnel, as well as a reduction in pricing for certain products and services. We believe that our cost of sales as a percentage of revenue was negatively impacted by the reduction in revenue activity associated with the decline in market conditions primarily related to the COVID-19 pandemic, which contributed to fixed cost under absorption. Cost of product sales was $7.9 million, or 67.5% of product sales revenue, and cost of services was $2.3 million, or 50.2% of service revenue, for the three months ended
29
September 30, 2020. For the three months ended September 30, 2019, cost of product sales was $23.8 million, or 54.4% of product sales revenue, and cost of services was $8.4 million, or 49.4% of service revenue.
Selling, general and administrative expenses
Selling, general and administrative expenses were $12.5 million for the three months ended September 30, 2020 as compared to $20.4 million for the three months ended September 30, 2019. This overall decrease in expense reflects declines in compensation and benefits, share-based compensation and research and development expenses of $4.7 million, $1.1 million and $0.4 million, respectively. We believe that travel restrictions enacted in response to the COVID-19 pandemic had a slightly favorable impact on our SG&A expense, primarily due to a reduction in travel and entertainment expenses, which decreased by $0.6 million. Additionally, professional fees were lower by $0.7 million.
Depreciation
Depreciation was $1.0 million for the three months ended September 30, 2020 as compared to $1.5 million for the three months ended September 30, 2019. The decrease is primarily attributable to a non-cash impairment charge of $9.7 million during the first quarter of 2020, which reduced the carrying values of our land, building and improvements and machinery and equipment. Additionally, our capital expenditures were lower in 2020 as compared to 2019. See “Note 5. Property and Equipment” of our unaudited condensed consolidated financial statements for additional detail.
Amortization
Amortization was $0.1 million for the three months ended September 30, 2020 as compared to $1.2 million for the three months ended September 30, 2019. The decrease in amortization was related to non-cash impairment charges of $40.5 million during the first quarter of 2020, which reduced the carrying values of technology, internally-developed software, customer relationships, and trademarks. See “Note 6. Goodwill and Intangibles” of our unaudited condensed consolidated financial statements for additional detail.
Interest expense, net
Interest expense, net was $0.9 million for the three months ended September 30, 2020 as compared to $0.4 million for the three months ended September 30, 2019. The increase in interest expense, net was primarily a result of the $0.6 million write-off of deferred loan costs associated with the amendment to our Senior Secured Credit Facility, which reduced the lender commitments.
Income tax benefit was $3.1 million for the three months ended September 30, 2020 as compared to $1.4 million for the three months ended September 30, 2019. Included in tax benefit for the three months ended September 30, 2019 was a valuation allowance against our U.S. deferred tax asset as well as the tax effect of a non-deductible goodwill impairment. These adjustments resulted in additional tax benefit for the three months ended September 30, 2019 of approximately $6.9 million.
On March 27, 2020, the CARES Act was enacted and signed into law and includes several provisions for corporations including allowing companies to carryback certain NOLs and increasing the amount of NOLs that corporations can use to offset income. Corporate taxpayers may carryback NOLs originating during 2018 through 2020 for up to five years and the CARES Act removes the 80% taxable income limitation on utilization of those NOLs if carried back to prior tax years or utilized in tax years beginning before 2021, which was not previously allowed under the U.S. Tax Cuts and Jobs Act of 2017 (the “2017 Tax Act”).
As a result of the geographic mix of earnings and losses, including discrete items, our tax rate has been and will continue to be volatile.
30
Nine Months Ended September 30, 2020 Compared to Nine Months Ended September 30, 2019
The following table summarizes our revenues and expenses for the periods presented (dollars in thousands):
|
|
|
|
|
|
|
|
|
|
|
|
|
|
|
|
|
|
|
|
|
|
|
|
|
|
|
|
|
|
|
Nine Months Ended |
|
|
|
|
|
|
||||
|
|
|
September 30, |
|
Variance |
||||||||
|
|
|
2020 |
|
2019 |
|
$ |
|
% |
||||
|
Revenues |
|
|
|
|
|
|
|
|
|
|
|
|
|
Product sales |
|
$ |
55,948 |
|
$ |
110,933 |
|
$ |
(54,985) |
|
(49.6) |
% |
|
Services |
|
|
23,646 |
|
|
42,458 |
|
|
(18,812) |
|
(44.3) |
% |
|
Total revenues |
|
|
79,594 |
|
|
153,391 |
|
|
(73,797) |
|
(48.1) |
% |
|
Cost of sales |
|
|
|
|
|
|
|
|
|
|
|
|
|
Cost of product sales, exclusive of depreciation and amortization expense shown below |
|
|
35,191 |
|
|
57,032 |
|
|
(21,841) |
|
(38.3) |
% |
|
Cost of services, exclusive of depreciation and amortization expense shown below |
|
|
12,024 |
|
|
25,021 |
|
|
(12,997) |
|
(51.9) |
% |
|
Total cost of sales, exclusive of depreciation and amortization expense shown below |
|
|
47,215 |
|
|
82,053 |
|
|
(34,838) |
|
(42.5) |
% |
|
Selling, general and administrative expenses |
|
|
48,782 |
|
|
66,360 |
|
|
(17,578) |
|
(26.5) |
% |
|
Depreciation |
|
|
3,446 |
|
|
4,382 |
|
|
(936) |
|
(21.4) |
% |
|
Amortization |
|
|
1,340 |
|
|
3,451 |
|
|
(2,111) |
|
(61.2) |
% |
|
Change in fair value of contingent consideration |
|
|
— |
|
|
37 |
|
|
(37) |
|
(100.0) |
% |
|
Impairment |
|
|
50,194 |
|
|
7,919 |
|
|
42,275 |
|
NM |
|
|
Loss from operations |
|
|
(71,383) |
|
|
(10,811) |
|
|
(60,572) |
|
NM |
|
|
Other income (expense) |
|
|
|
|
|
|
|
|
|
|
|
|
|
Interest expense, net |
|
|
(1,622) |
|
|
(1,497) |
|
|
(125) |
|
(8.4) |
% |
|
Other income, net |
|
|
580 |
|
|
349 |
|
|
231 |
|
66.2 |
% |
|
Foreign currency exchange loss, net |
|
|
(467) |
|
|
(678) |
|
|
211 |
|
31.1 |
% |
|
Total other expense |
|
|
(1,509) |
|
|
(1,826) |
|
|
317 |
|
17.4 |
% |
|
Loss before income tax |
|
|
(72,892) |
|
|
(12,637) |
|
|
(60,255) |
|
(476.8) |
% |
|
Income tax (benefit) expense |
|
|
(9,956) |
|
|
10,200 |
|
|
(20,156) |
|
(197.6) |
% |
|
Net loss |
|
|
(62,936) |
|
|
(22,837) |
|
|
(40,099) |
|
(175.6) |
% |
|
Net income attributable to noncontrolling interest |
|
|
3,233 |
|
|
7,809 |
|
|
(4,576) |
|
(58.6) |
% |
|
Net loss attributable to |
|
$ |
(66,169) |
|
$ |
(30,646) |
|
$ |
(35,523) |
|
(115.9) |
% |
_______________
|
(1) |
NM – Percentage not meaningful |
Revenues
Revenues were $79.6 million for the nine months ended September 30, 2020 as compared to $153.4 million for the nine months ended September 30, 2019. This decrease reflected reductions in product sales and services volumes in North America, particularly during the second and third quarters and lower product sales in international markets, partially offset by higher services revenue in international markets. We believe the decrease in both activity and pricing resulting from the decline in market conditions primarily related to the COVID-19 pandemic, which had a negative impact on our revenues during the nine months ended September 30, 2020 as drilling rig and completion activity in North America declined sequentially throughout 2020 before stabilizing at low levels at the end of the third quarter of 2020. In addition, customer activity in China was delayed and activity in Argentina was suspended from mid-March until June due to government regulations. Product sales for the nine months ended September 30, 2020 were $55.9 million as compared to $110.9 million for the nine months ended September 30, 2019. Services revenue was $23.6 million for the nine months ended September 30, 2020 as compared to $42.5 million for the nine months ended September 30, 2019.
Cost of sales
Cost of sales was $47.2 million, or 59.3% of revenues, for the nine months ended September 30, 2020 as compared to $82.1 million, or 53.5% of revenues, for the nine months ended September 30, 2019. Cost of sales as a percentage of revenues increased due to the significant reduction in revenue, leading to under-utilization of manufacturing capacity and field service personnel, as well as a reduction in pricing for certain products and services, particularly during the second and third quarters. We believe that our cost of sales as a percentage of revenue was negatively impacted by the reduction in revenue activity associated with the decline in market conditions primarily related to the COVID-19 pandemic, which contributed to fixed cost under absorption. Cost
31
of product sales was $35.2 million, or 62.9% of product sales revenue, and cost of services was $12.0 million, or 50.9% of service revenue, for the nine months ended September 30, 2020. For the nine months ended September 30, 2019, cost of product sales was $57.0 million, or 51.4% of product sales revenue, and cost of services was $25.0 million, or 58.9% of service revenue.
Selling, general and administrative expenses
Selling, general and administrative expenses were $48.8 million for the nine months ended September 30, 2020 as compared to $66.4 million for the nine months ended September 30, 2019. This overall decrease in expense reflects declines in compensation and benefits, share-based compensation, research and development expenses, ERP-related expenses, and bad debt expense of $10.8 million, $2.9 million, $1.3 million, $1.1 million, and $0.8 million, respectively. We believe that travel restrictions enacted in response to the COVID-19 pandemic had a favorable impact on our SG&A expense, primarily due to a reduction in travel and entertainment expenses of $1.5 million. Additionally, professional fees, including litigation fees, were lower by $3.1 million, which includes $1.1 million of proceeds from our directors and officers liability insurance related to the reimbursement of legal expenses that we incurred to defend a director and officer in the Diamondback litigation. These favorable variances were partially offset by severance charges incurred for the nine months ended September 30, 2020 related to reductions in workforce, which was higher by $4.8 million.
Depreciation
Depreciation was $3.4 million for the nine months ended September 30, 2020 as compared to $4.4 million for the nine months ended September 30, 2019. The decrease is primarily attributable to a non-cash impairment charge of $9.7 million during the first quarter of 2020, which reduced the carrying values of our land, building and improvements and machinery and equipment. Additionally, our capital expenditures were lower in 2020 compared to 2019. See “Note 5. Property and Equipment” of our unaudited condensed consolidated financial statements for additional detail.
Amortization
Amortization was $1.3 million for the nine months ended September 30, 2020 as compared to $3.5 million for the nine months ended September 30, 2019. The decrease in amortization was related to non-cash impairment charges of $40.5 million during the first quarter of 2020, which reduced the carrying values of technology, internally-developed software, customer relationships, and trademarks. See “Note 6. Goodwill and Intangibles” of our unaudited condensed consolidated financial statements for additional detail.
Impairment
In the first quarter of 2020, we evaluated our property and equipment and finite-lived intangible assets for impairment due to current industry conditions such as a reduction in global economic growth expectations, a significantly reduced demand for crude oil and refined products, the significant decline in commodity prices and the corresponding impact on future expectations of demand for our products and services primarily related to the COVID-19 pandemic as well as the resulting decline in the quoted price of our common stock. We determined that the carrying amount of certain of our long-lived assets exceeded the corresponding fair value. We recorded impairment charges of $9.7 million in property and equipment and $40.5 million in finite-lived intangible assets. There were no impairment charges recorded on our goodwill, property and equipment or identifiable intangible assets during the second or third quarters of 2020.
During the second quarter of 2019, we performed an impairment test for goodwill and determined that the carrying value of one of our reporting units exceeded its fair value. We recorded an impairment charge of $7.9 million for our tracer diagnostic services reporting unit as a result of a further deterioration in customer activity levels in North America. This resulted in lower demand for oilfield services driving a decrease in our market share and increased customer and competitor-driven pricing pressures in addition to a decline in the quoted price of our common stock. In addition to goodwill, we also assessed our identifiable intangibles for impairment as of June 30, 2019 and determined those assets were not impaired. See “Note 6. Goodwill and Intangibles” of our consolidated financial statements for additional detail.
Income tax (benefit) expense was $(10.0) million for the nine months ended September 30, 2020 as compared to $10.2 million for the nine months ended September 30, 2019. Included in the tax benefit for the nine months ended September 30, 2020 were several U.S. tax (benefit) expense adjustments related to the enactment of the CARES Act including: (1) a tax benefit of $0.9 million which includes a decision to elect bonus depreciation in a prior year resulting in a NOL carryback and (2) tax expense of $9.7 million for an increase in a valuation allowance on deferred tax assets not expected to be realized. Also, included in tax benefit for the nine months ended September 30, 2020 was a tax expense in the amount of $1.2 million for a valuation allowance against our Canadian deferred tax asset based on management’s position that NCS has not met the more likely than not condition of realizing part of the deferred tax
32
asset, as well as a benefit of $1.3 million related to a reduction in foreign tax expense. Included in tax expense for the nine months ended September 30, 2019 was a valuation allowance against our U.S. deferred tax asset as well as the tax effect of a non-deductible goodwill impairment. These adjustments resulted in additional tax expense for the nine months ended September 30, 2019 of approximately $11.7 million. Additionally, the effective tax rate for the nine months ended September 30, 2020 and 2019 included a tax expense of $1.4 million and $0.4 million, respectively, for the tax effect of stock awards.
On March 27, 2020, the CARES Act was enacted and signed into law and includes several provisions for corporations including allowing companies to carryback certain NOLs and increasing the amount of NOLs that corporations can use to offset income. Corporate taxpayers may carryback NOLs originating during 2018 through 2020 for up to five years and the CARES Act removes the 80% taxable income limitation on utilization of those NOLs if carried back to prior tax years or utilized in tax years beginning before 2021, which was not previously allowed under the 2017 Tax Act.
As a result of the geographic mix of earnings and losses, including discrete items, our tax rate has been and will continue to be volatile.
Liquidity and Capital Resources
Our primary sources of liquidity are our existing cash and cash equivalents, cash provided by operating activities and borrowings under our Senior Secured Credit Facility. As of September 30, 2020, we had cash and cash equivalents of $8.6 million and total outstanding indebtedness of $6.0 million, of which no amount is currently outstanding under our Senior Secured Credit Facility. The Senior Secured Credit Facility consists of a senior secured revolving credit facility in an aggregate principal amount of $25.0 million. Total borrowings are limited to a borrowing base calculated based on eligible receivables. We were in compliance with our debt covenants at September 30, 2020. We believe that our cash on hand, cash flows from operations and potential borrowings under our Senior Secured Credit Facility will be sufficient to fund our capital expenditure and liquidity requirements for the next twelve months. Our borrowing base under the Senior Secured Credit Facility at September 30, 2020 was $4.2 million. The amount available to be drawn under the Senior Secured Credit Facility may decline from current levels, including as a result of reductions in our borrowing base or a springing financial covenant, if our business continues to be adversely impacted by a decline in market conditions primarily related to the COVID-19 pandemic. Our principal liquidity needs have been, and are expected to continue to be, capital expenditures, working capital, severance payments, debt service and potential mergers and acquisitions.
Our capital expenditures for the nine months ended September 30, 2020 and 2019 were $1.9 million and $5.2 million, respectively. We plan to incur approximately $2.0 million to $2.5 million in capital expenditures during 2020, which includes capital expenditures related to (i) additional machining capacity at Repeat Precision, (ii) machinery and equipment utilized in manufacturing and engineering, (iii) additional equipment to support our tracer diagnostics services and (iv) leasehold improvements associated with operations facilities. We expect to generate proceeds from the sale of property and equipment of $1.0 million, primarily related to the sale of excess vehicles utilized in field operations, most of which were obtained through finance leases.
We anticipate that to the extent that we require additional liquidity to fund our capital requirements or repay existing indebtedness, it will be funded through the incurrence of additional indebtedness, the proceeds of equity issuances, or a combination thereof. We cannot assure you that we will be able to obtain this additional liquidity on reasonable terms, or at all. Our liquidity and our ability to meet our obligations and fund our capital requirements are also dependent on our future financial performance and ability to reduce costs, which is subject to general economic, financial and other factors that are beyond our control, including the COVID-19 pandemic. Accordingly, we cannot assure you that our business will generate sufficient cash flow from operations or that funds will be available from additional indebtedness, the capital markets or otherwise to meet our liquidity needs. If we decide to pursue one or more significant acquisitions, we may incur additional debt or sell additional equity to finance such acquisitions, which could result in additional expenses or dilution.
33
Cash Flows
The following table provides a summary of cash flows from operating, investing and financing activities for the periods presented (in thousands):
|
|
|
|
|
|
|
|
|
|
|
|
|
|
|
|
|
|
|
Nine Months Ended |
||||
|
|
|
September 30, |
||||
|
|
|
2020 |
|
2019 |
||
|
Net cash provided by operating activities |
|
$ |
14,508 |
|
$ |
4,815 |
|
Net cash used in investing activities |
|
|
(1,178) |
|
|
(4,425) |
|
Net cash used in financing activities |
|
|
(15,707) |
|
|
(21,251) |
|
Effect of exchange rate changes on cash and cash equivalents |
|
|
(231) |
|
|
248 |
|
Net change in cash and cash equivalents |
|
$ |
(2,608) |
|
$ |
(20,613) |
Net cash provided by operating activities was $14.5 million and $4.8 million for the nine months ended September 30, 2020 and 2019, respectively. The increase in cash flow was primarily driven by no payment of contingent consideration in 2020 compared to $3.0 million in 2019, and favorable changes in accounts receivable and inventories, partially offset by lower net income and unfavorable changes in deferred income tax (benefit) expense, prepaid expenses and other assets, accounts payable and income taxes receivable/payable as well as lower non-cash share-based compensation and depreciation and amortization expenses.
Investing Activities
Net cash used in investing activities was $1.2 million and $4.4 million for the nine months ended September 30, 2020 and 2019, respectively. The decrease in cash used in investing activities during the nine months ended September 30, 2020 as compared to the nine months ended September 30, 2019 was primarily related to reduced capital expenditures for property, equipment, software and technology which totaled $1.9 million in the nine months ended September 30, 2020 compared to $5.2 million for the same period in 2019.
Financing Activities
Net cash used in financing activities was $15.7 million and $21.3 million for the nine months ended September 30, 2020 and 2019, respectively. The decrease was primarily related to lower payments on equipment note and finance leases of $3.3 million. Additionally, on January 31, 2019, we made a $10.0 million cash payment to the joint venture partner for the Repeat Precision earn-out consideration, of which $7.0 million was classified as a financing activity to reflect the acquisition date fair value of the contingent consideration liability and $3.0 million was included in operating activities as the liability was settled at an amount greater than the acquisition date fair value. The decrease in net cash used in financing activities was partially offset by net repayments under the Senior Secured Credit Facility of $3.0 million.
On May 1, 2019, we entered into a Second Amended and Restated Credit Agreement (the “2019 Credit Agreement”) with Pioneer Investment, Inc., as U.S. borrower (the “U.S. Borrower”), NCS Multistage Inc., as Canadian borrower (the “Canadian Borrower”; together with the U.S. Borrower, the “Borrowers”), Pioneer Intermediate, Inc. (together with the Company, the “Parent Guarantors”), the lenders party thereto, Wells Fargo Bank, National Association as administrative agent (the “U.S. Agent”) in respect of the U.S. facility provided therein and Wells Fargo Bank, National Association, Canadian Branch, as administrative agent (the “Canadian Agent”) in respect of the Canadian Facility provided therein. The 2019 Credit Agreement amended and restated our prior credit agreement in its entirety. See “Note 8. Debt” to our unaudited condensed consolidated financial statements for additional details regarding our 2019 Credit Agreement.
On August 6, 2020, we entered into Amendment No. 1 to Second Amended and Restated Credit Agreement (the “Amendment”; the 2019 Credit Agreement, as amended by the Amendment, the “Amended Credit Agreement”) with the Borrowers, Pioneer Intermediate, Inc., certain subsidiaries of the Borrowers, the lenders party thereto, the U.S. Agent and the Canadian Agent. The facility provided pursuant to the Amended Credit Agreement is referred to herein as the “Senior Secured Credit Facility”.
The Senior Secured Credit Facility consists of a senior secured revolving credit facility in an aggregate principal amount of $25.0 million made available to the U.S. Borrower, of which up to $2.5 million may be made available for letters of credit and up to $2.5 million may be made available for swingline loans. The Canadian Borrower may make borrowings under the Senior Secured Credit
34
Facility, subject to a $15.0 million sublimit. Total borrowings available to the Borrowers under the Senior Secured Credit Facility is limited to a borrowing base calculated based on eligible receivables. The Senior Secured Credit Facility will mature on May 1, 2023.
Borrowings under the Senior Secured Credit Facility may be made in U.S. dollars for Adjusted Base Rate Advances, and in U.S. dollars, Canadian dollars or Euros for Eurocurrency Rate Advances (each as defined in the Amended Credit Agreement). Such advances bear interest at the Adjusted Base Rate or at the Eurocurrency Rate (each as defined in the Amended Credit Agreement) plus an applicable interest margin between 2.75% and 3.75%, depending on NCS’s leverage ratio. We incurred interest expense related to the Senior Secured Credit Facility, including commitment fees, of $0.1 million and $0.3 million for the three months ended September 30, 2020 and 2019, respectively, and $0.6 million and $0.5 million for the nine months ended September 30, 2020 and 2019, respectively.
The obligations of the Borrowers under the Senior Secured Credit Facility are guaranteed by the Parent Guarantors, as well as each of the other existing and future direct and indirect restricted subsidiaries of NCS organized under the laws of the United States and Canada (subject to certain exceptions), and are secured by substantially all of the assets of the Parent Guarantors, the Borrowers and such other subsidiary guarantors, in each case, subject to certain exceptions and permitted liens.
The Amended Credit Agreement requires us to (i) maintain liquidity (defined as availability under the Senior Secured Credit Facility plus certain cash deposits) of at least $7.5 million as of the date of each borrowing base certificate due to be delivered either monthly (if availability is greater than or equal to than 12%) or weekly (if availability is less than 12%) thereunder, (ii) maintain, for quarters during which availability is less than 20% of the borrowing base, a fixed charge coverage of at least 1.0 to 1.0 and (iii) on the last business day of each week, prepay advances to the extent that available cash exceeds $12.0 million. As of September 30, 2020, we were in compliance with these financial covenants. The Amended Credit Agreement also contains customary affirmative and negative covenants, including, among other things, restrictions on the creation of liens, the incurrence of indebtedness, investments, dividends and other restricted payments, dispositions and transactions with affiliates.
The Amended Credit Agreement includes customary events of default for facilities of this type (with customary materiality thresholds and grace periods, as applicable). If an event of default occurs, the lenders party to the Amended Credit Agreement may elect (after the expiration of any applicable notice or grace periods) to declare all outstanding borrowings under such facility, together with accrued and unpaid interest and other amounts payable thereunder, to be immediately due and payable. The lenders party to the Amended Credit Agreement also have the right upon an event of default thereunder to terminate any commitments they have to provide further borrowings and to proceed against the collateral securing the Senior Secured Credit Facility.
Except for the finance lease as discussed in “Note 5. Property and Equipment” and operating lease as discussed in “Note 9. Commitments and Contingencies” of our unaudited condensed consolidated financial statements, there have been no material changes in our contractual obligations and commitments disclosed in the Annual Report for the year ended December 31, 2019.
Off-Balance Sheet Arrangements
We have no off-balance sheet financing arrangements.
Critical Accounting Policies
There are no other material changes to our critical accounting policies from those included in the Annual Report for the year ended December 31, 2019.
Recently Issued Accounting Pronouncements
See “Note 1. Basis of Presentation” to our unaudited condensed consolidated financial statements for a discussion of the accounting pronouncements we recently adopted and the accounting pronouncements recently issued by the Financial Accounting Standards Board.
35
Emerging Growth Company and Smaller Reporting Company Status
We are an “emerging growth company” as defined in the Jumpstart Our Business Startups Act of 2012 (the “JOBS Act”). We will remain an emerging growth company until the earlier of (1) the last day of our fiscal year (a) following the fifth anniversary of the completion of our initial public offering, (b) in which we have total annual gross revenue of at least $1.07 billion, or (c) in which we are deemed to be a large accelerated filer, which means the market value of our common stock that is held by non-affiliates exceeds $700.0 million as of the last business day of our most recently completed second fiscal quarter, and (2) the date on which we have issued more than $1.0 billion in non-convertible debt securities during the prior three-year period. Additionally, we are also a “smaller reporting company” as defined by Section 12b-2 of the Securities Exchange Act of 1934, as amended (“Exchange Act”), meaning that we are not an investment company, an asset-backed issuer, or a majority-owned subsidiary of a parent company that is not a smaller reporting company and have a public float of less than $250 million. As an emerging growth company and a smaller reporting company, we may take advantage of specified reduced reporting and other burdens that are otherwise applicable generally to public companies that do not qualify for those classifications.
Cautionary Note Regarding Forward-Looking Statements
This Quarterly Report contains forward-looking statements within the meaning of the Private Securities Litigation Reform Act of 1995. Forward-looking statements can be identified by words such as “anticipates,” “intends,” “plans,” “seeks,” “believes,” “estimates,” “expects” and similar references to future periods, or by the inclusion of forecasts or projections. Examples of forward-looking statements include, but are not limited to, statements we make regarding the outlook for our future business and financial performance, including the effects of the COVID-19 pandemic thereon, such as those contained in this Item 2. “Management’s Discussion and Analysis of Financial Condition and Results of Operations.”
Forward-looking statements are based on our current expectations and assumptions regarding our business, the economy and other future conditions. Because forward-looking statements relate to the future, by their nature, they are subject to inherent uncertainties, risks and changes in circumstances that are difficult to predict. As a result, our actual results may differ materially from those contemplated by the forward-looking statements. Important factors that could cause our actual results to differ materially from those in the forward-looking statements include regional, national or global political, economic, business, competitive, market and regulatory conditions and the following:
|
· |
declines in the level of oil and natural gas exploration and production activity within Canada and the United States; |
|
· |
oil and natural gas price fluctuations; |
|
· |
the risks and uncertainties relating to public health crises, including the COVID-19 pandemic and its continuing impact on market conditions and our business, financial condition, results of operations, cash flows and stock price; |
|
· |
the reduction in our Senior Secured Credit Facility borrowing base or our inability to comply with the covenants in our debt agreements depending on the duration of the decline in market conditions primarily related to the COVID-19 pandemic and our ability to negotiate with our lenders; |
|
· |
risks and uncertainties relating to cost reduction efforts or savings we may realize from such cost reduction efforts; |
|
· |
risks and uncertainties related to the potential delisting of our common stock from NASDAQ Global Select Market; |
|
· |
loss of significant customers; |
|
· |
inability to successfully implement our strategy of increasing sales of products and services into the United States; |
|
· |
significant competition for our products and services that results in pricing pressures, reduced sales, or reduced market share; |
|
· |
competitive pressure resulting from a significant decline in industry activity; |
|
· |
our inability to accurately predict customer demand, which may result in us holding excess or obsolete inventory; |
|
· |
impairment in the carrying value of long-lived assets and goodwill; |
|
· |
our inability to successfully develop and implement new technologies, products and services; |
|
· |
our inability to protect and maintain critical intellectual property assets; |
|
· |
currency exchange rate fluctuations; |
|
· |
losses and liabilities from uninsured or underinsured business activities; |
|
· |
the financial health of our customers including their ability to pay for products or services provided; |
|
· |
our inability to obtain sufficient liquidity on reasonable terms, or at all; |
|
· |
our failure to identify and consummate potential acquisitions; |
36
|
· |
our inability to integrate or realize the expected benefits from acquisitions; |
|
· |
impact of severe weather conditions; |
|
· |
restrictions on the availability of our customers to obtain water essential to the drilling and hydraulic fracturing processes; |
|
· |
our inability to meet regulatory requirements for use of certain chemicals by our tracer diagnostics business; |
|
· |
change in trade policy, including the impact of additional tariffs; |
|
· |
changes in legislation or regulation governing the oil and natural gas industry, including restrictions on emissions of greenhouse gases; |
|
· |
failure to comply with or changes to federal, state and local and non-U.S. laws and other regulations, including anti-corruption and environmental regulations, the CARES Act and the 2017 Tax Act; |
|
· |
loss of our information and computer systems; |
|
· |
system interruptions or failures, including cyber-security breaches, identity theft or other disruptions that could compromise our information; |
|
· |
our failure to establish and maintain effective internal control over financial reporting; |
|
· |
our success in attracting and retaining qualified employees and key personnel; and |
|
· |
our inability to satisfy technical requirements and other specifications under contracts and contract tenders. |
For the reasons described above, as well as factors identified in “Item 1A. Risk Factors” in this Quarterly Report and the section of the Annual Report entitled “Risk Factors,” we caution you against relying on any forward-looking statements. Any forward-looking statement made by us in this Quarterly Report speaks only as of the date on which we make it. Factors or events that could cause our actual results to differ may emerge from time to time, and it is not possible for us to predict all of them. We undertake no obligation to publicly update or revise any forward-looking statement, whether as a result of new information, future developments or otherwise, except as may be required by law.
Item 3. Quantitative and Qualitative Disclosures About Market Risk
For our quantitative and qualitative disclosures about market risk, see Item 7A, “Quantitative and Qualitative Disclosures About Market Risk,” in our Annual Report for the year ended December 31, 2019. With the exception of the uncertainty that exists with respect to the economic impact of the global COVID-19 pandemic and our repayment of all outstanding variable rate debt under the amendment to our Senior Secured Credit Facility, our exposure to market risk has not changed materially since December 31, 2019.
Item 4. Controls and Procedures
Disclosure Controls and Procedures
Under the supervision and with the participation of our management, including the Chief Executive Officer and Chief Financial Officer, we conducted an evaluation of the effectiveness of our disclosure controls and procedures (as such term is defined in Rules 13a-15(e) and 15d-15(e) under the Exchange Act) as of the end of the period covered by this report. Based on this evaluation, our Chief Executive Officer and Chief Financial Officer concluded that, as of September 30, 2020, our disclosure controls and procedures were effective to provide reasonable assurance that information required to be disclosed in the reports we file or submit under the Exchange Act is recorded, processed, summarized and reported within the time periods specified in the SEC’s rules and forms and that such information is accumulated and communicated to management, including the Chief Executive Officer and Chief Financial Officer, to allow timely decisions regarding required disclosure.
Changes in Internal Control Over Financial Reporting
Although most of our employees and office-based workforce were working remotely due to COVID-19, there have been no changes to our internal controls during the quarter ended September 30, 2020 and we have not experienced any changes that have materially affected, or are reasonably likely to materially affect, our internal control over financial reporting. We continue to monitor the COVID-19 pandemic and its effects on the design and operating effectiveness of our internal controls.
37
In the ordinary course of our business, from time to time, we have various claims, lawsuits and administrative proceedings that are pending or threatened with respect to commercial, intellectual property and employee matters.
On July 24, 2018, we filed a patent infringement lawsuit against Kobold Corporation, Kobold Completions Inc. and 2039974 Alberta Ltd. (“Kobold”) in the Federal Court of Canada, alleging that Kobold’s fracturing tools and methods infringe on several of our Canadian patents. We previously filed a breach of contract lawsuit on March 16, 2018, against Kobold Corporation in the Court of Queen’s Bench of Alberta, alleging breach of a prior settlement agreement. Both of these lawsuits seek unspecified monetary damages and injunctive relief. On July 12, 2019, Kobold filed a counterclaim seeking unspecified damages alleging that our fracturing tools and methods infringe on their patent and that we made false and misleading statements about Kobold.
On April 3, 2020, the United States District Court for the Western District of Texas, Waco Division (“District Court”) issued a final judgment in connection with the litigation with Diamondback Industries, Inc (“Diamondback”) awarding Repeat Precision approximately $39.9 million (the “Award”) plus attorneys’ fees in connection with its breach of exclusive license, patent infringement and tortious interference claims. In its ruling, the District Court validated the terms of Repeat Precision’s exclusive license agreement with respect to the setting tool technology practicing U.S. Patent No. 9,810,035 (the “’035 Patent’) and enjoined Diamondback from selling its infringing SS line of setting tools. The judgment remains subject to appeal and, on April 21, 2020, Diamondback filed for Chapter 11 bankruptcy protection which stays any collection efforts. As of September 30, 2020, we have not recorded any amount in our condensed consolidated financial statements related to this gain contingency. In April 2020, we received $1.1 million of proceeds from our directors and officers liability insurance related to the reimbursement of legal expenses that we incurred to defend a director and officer in the Diamondback litigation, which was recorded in the condensed consolidated statements of operations under general and administrative expenses for the nine months ended September 30, 2020.
In October 2020, we entered into an agreement to settle the Award entered into by the District Court, which will be effectuated through a Chapter 11 plan of reorganization that was filed by Diamondback and is currently set for confirmation on November 12, 2020. The agreement terminates if the bankruptcy court does not approve the plan by December 31, 2020. In connection with Repeat Precision releasing Diamondback and Derrek Drury (“Drury”) from the monetary damages in the Award and certain other claims, Repeat Precision expects to receive: (i) an upfront cash payment of approximately $15.5 million, (ii) the transfer of the ‘035 Patent from Diamondback to Repeat Precision, (iii) payments for future sales of certain setting tool sold by Diamondback or its successor as restitution, until $5 million has been paid in total, and (iv) a note from Drury payable in two years in the principal amount of up to $5 million secured by certain properties and other collateral. Repeat Precision and another claimant in the Diamondback bankruptcy have also agreed to provide mutual releases of all claims in exchange for consideration to be received by Repeat Precision, which is also conditioned on the effectiveness of the Chapter 11 plan. There are no assurances that the terms of any settlement will become effective, including uncertainty as to whether a Chapter 11 plan will be approved by the bankruptcy court, or that we will receive any portion of the settlement consideration.
While the outcome of any legal proceeding cannot be predicted with any certainty, based on a consideration of relevant facts and circumstances, our management currently does not expect that the results of these legal proceedings would have a material adverse effect on our financial position, results of operations or cash flows.
There have been no material changes from the risk factors disclosed in our Annual Report for the year ended December 31, 2019, except as set forth below:
Our business, financial condition, results of operations, cash flows and stock price have been negatively impacted and may in the future be materially adversely affected by the COVID-19 pandemic.
Our business, financial condition, results of operations, cash flows and stock price have been negatively impacted and may in the future be materially adversely affected by the decline in market conditions primarily related to COVID-19 which has spread from China to many other countries including the United States. In March 2020, the WHO characterized COVID-19 as a pandemic, and the President of the United States declared the COVID-19 pandemic a national emergency. The pandemic has resulted in governments around the world implementing increasingly stringent measures to help control the spread of the virus, including quarantines, “shelter in place” and “stay at home” orders, travel restrictions, business curtailments, school closures, and other measures.
38
The demand for crude oil has been materially reduced as a result of such measures taken by governments around the world, which has resulted in excess supply of crude oil and a rapid and material reduction in crude oil prices. As a result, E&P companies have responded by significantly reducing their capital expenditure budgets for 2020, resulting in significant reductions in planned drilling and completion activity, which has led to and will lead to a decrease in demand by our customers for our products and services. For as long as we remain in a low commodity price environment, we would generally expect our customers and potential customers to continue to operate at these lower levels of drilling, completion and other production activities or, if conditions worsen, they may further reduce their capital expenditures. These lower capital expenditure levels have resulted in and will continue to result in a reduction in spending on our products and services and impact the prices we are able to charge our customers. Furthermore, if any of our significant customers decides not to continue to use our products and services, or if any of our key suppliers experiences a significant disruption that limits our ability to manufacture and sell certain of our products, as a result of the COVID-19 pandemic, our revenue would decline, which could have a material adverse effect on our business, financial condition and results of operations.
Our cash on hand, cash flows from operations and potential borrowings under our Senior Secured Credit Facility may not be sufficient to fund our capital expenditures and liquidity requirements, particularly if the decline in market conditions primarily related to the COVID-19 pandemic on the demand for crude oil, customer spending and the resulting demand for our products and services continues for an extended period of time or worsens. These negative impacts of the COVID-19 pandemic are likely to have a material negative impact on our financial performance, which could result in a breach of the covenants and a default under the Amended Credit Agreement. In the event of a default, the lenders may elect to declare all outstanding borrowings under the facility immediately due and payable. In addition, the total amount available to be drawn under our Senior Secured Credit Facility is substantially lower than the commitments due to borrowing limits imposed by our borrowing base that is calculated based on eligible receivables, and the amount available may decline if our business continues to be materially adversely impacted by the decline in market conditions primarily related to the COVID-19 pandemic. In the event of a reduction in liquidity as a result of a default under the Amended Credit Agreement or the reduction of our borrowing capacity as result of business conditions, we may not be able to obtain liquidity from additional indebtedness, the capital markets or otherwise on reasonable terms, or at all, and our business may not generate sufficient cash flow from operations to fund our debt obligations or capital requirements.
We are considered a critical infrastructure industry, as defined by the U.S. Department of Homeland Security. Although we have continued to operate our facilities to date consistent with federal guidelines and state and local orders, the COVID-19 pandemic and any preventive or protective actions taken by governmental authorities may have a material adverse effect on our operations, supply chain, customers and transportation networks, including business shutdowns or disruptions. To date, we have experienced delays in importation of certain chemical products from China, and temporary work-from-home orders have reduced operating capacity at the Repeat Precision machine shop operations in Mexico. We have also experienced delays in access to certain materials and products utilized in our research and development activities, which may lead to delays in new product introductions. Work-from-home orders and other restrictions have also led to delays in planned work in Argentina and China.
On March 31 and April 1, 2020, we also implemented, as of such date, a workforce reduction resulting in termination of over 80 employees, furloughs for certain employees and lower compensation levels for executives and employees not participating in furloughs and on May 4, 2020 and in July 2020, we implemented, as of such date, additional workforce reductions resulting in the termination of approximately 50 employees per each reduction in response to the current difficult market conditions primarily related to the COVID-19 pandemic, the recent fall in demand for, and the price of, crude oil and reductions in customer capital spending plans. The reductions result in the loss of longer-term employees, institutional knowledge and expertise and the reallocation and combination of certain roles and responsibilities across the organization. These reductions, or others which may be caused by, but not limited to, the temporary inability of our workforce to work due to illness, quarantine, or government action, may negatively impact our operations.
The increase in certain of our employees working remotely has amplified certain information technology risks to our business and increased the demand on our information technology resources and systems, including increased phishing and other cybersecurity attacks as cybercriminals attempt to exploit uncertainty surrounding the COVID-19 pandemic and an increase in the number of points of potential attack, including laptops and mobile devices, to be secured. Any failure to effectively manage these risks, including to identify and appropriately respond to any cyberattacks, may adversely affect our business.
The extent to which the COVID-19 pandemic may adversely impact our business depends on future developments, which are highly uncertain and unpredictable, depending upon the severity and duration of the pandemic and the effectiveness of actions taken globally to contain or mitigate its effects. Any resulting financial impact cannot be estimated reasonably at this time, but may materially adversely affect our business, financial condition, results of operations and cash flows. Even after the COVID-19 pandemic has subsided, we may experience materially adverse impacts to our business due to any resulting economic recession or depression. To the extent the COVID-19 pandemic adversely affects our business, financial results and results of operations, it may also have the effect of heightening many of the other risks described in our Annual Report for the year ended December 31, 2019.
39
Our failure to meet the continued listing requirements of NASDAQ could result in a delisting of our common stock.
On April 24, 2020, NCS received a notification letter from the Nasdaq Listing Qualifications Staff of The NASDAQ Stock Market LLC (“Nasdaq”) notifying us that the closing bid price for our common stock had been below $1.00 for the previous 30 consecutive business days and that NCS therefore is not in compliance with the minimum bid price requirement for continued inclusion on the Nasdaq Global Select Market under Nasdaq Listing Rule 5450(a)(1) (the “Minimum Bid Requirement”). The notification has no immediate effect on the listing of our common stock on the Nasdaq Global Select Market.
Under Nasdaq Listing Rule 5810(c)(3)(A), we have a period of 180 calendar days to regain compliance with the Minimum Bid Requirement. However, in response to the COVID-19 pandemic and related extraordinary market conditions, Nasdaq provided temporary relief from the Minimum Bid Requirement through June 30, 2020 such that companies will have additional time to regain compliance, and compliance periods for any newly identified non-compliance will not begin until July 1, 2020. Therefore, our compliance period is extended until December 28, 2020.
To regain compliance with the Minimum Bid Requirement, the closing bid price of our common stock must be at least $1.00 or higher for a minimum of ten consecutive business days, and in such case, Nasdaq will provide NCS with written confirmation of compliance. If NCS does not regain compliance before December 28, 2020, we may be eligible for an additional 180 calendar days to regain compliance with the Minimum Bid Requirement, if we elect to transfer to the Nasdaq Capital Market. To qualify, NCS would be required to meet the applicable market value of publicly held shares requirement for continued listing and all other applicable requirements for initial listing on the Nasdaq Capital Market (except for the Minimum Bid Requirement), and NCS will need to provide written notice to Nasdaq of our intention to cure the deficiency during the second compliance period. If we are not eligible or it appears to Nasdaq that we will not be able to cure the deficiency during the second compliance period, Nasdaq will provide written notice to NCS that our common stock will be subject to delisting. In the event of such notification, we may appeal Nasdaq’s determination to delist our securities, but there can be no assurance that Nasdaq would grant our request for continued listing.
On October 27, 2020, funds affiliated with Advent International Corporation, who beneficially hold 29,568,536 shares of our common stock as of such date, or approximately 62.6% of our shares of common stock, had executed and delivered to the Board of Directors a written consent approving a proposal to effect a reverse stock split of our issued and outstanding common stock, with a ratio of 1-for-20 (the “reverse stock split”) and to reduce the number of authorized shares of our common stock by the same ratio as the reverse split. Our Board of Directors also approved the above reverse stock split and authorized share reduction on October 27, 2020. We expect our common stock to begin trading on Nasdaq on a split-adjusted basis when the market opens on December 1, 2020. Our Board of Directors reserves its right to elect not to proceed and abandon the reverse stock split if it determines, in its sole discretion, that this reverse stock split is no longer in the best interests of our stockholders.
If we do not regain compliance during any applicable compliance periods, our common stock could be delisted from any or all of the Nasdaq market tiers. The failure to maintain our listing on Nasdaq could have an adverse effect on the liquidity and market price of our common stock. In the event of a delisting, we can provide no assurance that any action taken by us to restore compliance with listing requirements, including by effecting a reverse stock split, if necessary, would allow our common stock to become listed again, stabilize the market price or improve the liquidity of our common stock, prevent our common stock from dropping below the Nasdaq Minimum Bid Requirement or prevent future non-compliance with Nasdaq’s listing requirements.
40
|
|
|
|
|
|
Exhibit |
|
|
|
|
No. |
|
Description |
|
|
|
|
||
|
* |
|
Certification of Chief Executive Officer Pursuant to Section 302 of the Sarbanes-Oxley Act of 2002. |
|
|
* |
|
Certification of Chief Financial Officer Pursuant to Section 302 of the Sarbanes-Oxley Act of 2002. |
|
|
** |
|
Certification of Chief Executive Officer Pursuant to Section 906 of the Sarbanes-Oxley Act of 2002. |
|
|
** |
|
Certification of Chief Financial Officer Pursuant to Section 906 of the Sarbanes-Oxley Act of 2002. |
|
|
*** |
101.INS |
|
XBRL Instance Document |
|
*** |
101.SCH |
|
XBRL Taxonomy Extension Schema |
|
*** |
101.CAL |
|
XBRL Taxonomy Extension Calculation Linkbase |
|
*** |
101.DEF |
|
XBRL Taxonomy Extension Definition Linkbase |
|
*** |
101.LAB |
|
XBRL Taxonomy Extension Label Linkbase |
|
*** |
101.PRE |
|
XBRL Taxonomy Extension Presentation Linkbase |
|
|
|
|
|
|
* |
Filed herewith. |
||
|
** |
Furnished herewith. |
||
|
*** |
Submitted electronically with this Report. |
||
41
Pursuant to the requirements of the Securities Exchange Act of 1934, the registrant has duly caused this report to be signed on its behalf by the undersigned thereunto duly authorized.
|
|
|
|
|
|
|
|
|
|
|
Date: November 5, 2020 |
|
NCS Multistage Holdings, Inc. |
|
|
|
|
|
|
|
|
|
By: |
/s/ Ryan Hummer |
|
|
|
|
Ryan Hummer |
|
|
|
|
Chief Financial Officer and Treasurer |
|
|
|
|
|
|
|
|
|
(Principal Financial Officer and Authorized |
|
|
|
|
Signatory) |
42