Attached files
| file | filename |
|---|---|
| EX-99.1 - EX-99.1 - Magnolia Oil & Gas Corp | mgy-20201105xex99d1.htm |
| 8-K - 8-K - Magnolia Oil & Gas Corp | mgy-20201105x8k.htm |
Exhibit 99.2
| Third Quarter 2020 Earnings Presentation November 5, 2020 Stephen Chazen – Chairman, President & CEO Christopher Stavros – Executive Vice President & CFO Brian Corales – Vice President, Investor Relations |

| Disclaimer 2 FORWARD LOOKING STATEMENTS The information in this presentation and the oral statements made in connection therewith include “forward-looking statements” within the meaning of Section 27A of the Securities Act of 1933, as amended (the “Securities Act”), and Section 21E of the Securities Exchange Act of 1934, as amended. All statements, other than statements of present or historical fact included in this presentation, regarding Magnolia Oil & Gas Corporation’s (“Magnolia,” “we,” “us,” “our” or the “Company”) financial and production guidance, strategy, future operations, financial position, estimated revenues, and losses, projected costs, prospects, plans and objectives of management are forward-looking statements. When used in this presentation, including any oral statements made in connection therewith, the words “could,” “should,” “will,” “may,” “believe,” “anticipate,” “intend,” “estimate,” “expect,” “project,” the negative of such terms and other similar expressions are intended to identify forward-looking statements, although not all forward-looking statements contain such identifying words. These forward-looking statements are based on management’s current expectations and assumptions about future events. Except as otherwise required by applicable law, Magnolia disclaims any duty to update any forward-looking statements, all of which are expressly qualified by the statements in this section, to reflect events or circumstances after the date of this presentation. Magnolia cautions you that these forward-looking statements are subject to all of the risks and uncertainties, most of which are difficult to predict and many of which are beyond the control of Magnolia, incident to the development, production, gathering and sale of oil, natural gas and natural gas liquids. In addition, Magnolia cautions you that the forward looking statements contained in this press release are subject to the following factors: (i) the length, scope and severity of the ongoing coronavirus disease 2019 (“COVID-19”) pandemic, including the effects of related public health concerns and the impact of continued actions taken by governmental authorities and other third parties in response to the pandemic and its impact on commodity prices, supply and demand considerations, and storage capacity; (ii) the outcome of any legal proceedings that may be instituted against Magnolia; (iii) Magnolia’s ability to realize the anticipated benefits of its acquisitions, which may be affected by, among other things, competition and the ability of Magnolia to grow and manage growth profitably; (iv) changes in applicable laws or regulations; and (v) the possibility that Magnolia may be adversely affected by other economic, business, and/or competitive factors. Should one or more of the risks or uncertainties described in this press release occur, or should underlying assumptions prove incorrect, actual results and plans could differ materially from those expressed in any forward-looking statements. Additional information concerning these and other factors that may impact Magnolia's operations and projections can be found in its filings with the Securities and Exchange Commission (the "SEC"), its Annual Report on Form 10-K for the fiscal year ended December 31, 2019 filed with the SEC on February 26, 2020. Magnolia’s SEC filings are available publicly on the SEC’s website at www.sec.gov. NON-GAAP FINANCIAL MEASURES This presentation includes non-GAAP financial measures, including free cash flow, EBITDAX, adjusted EBITDAX, adjusted net income and adjusted earnings. Magnolia believes these metrics are useful because they allow Magnolia to more effectively evaluate its operating performance and compare the results of its operations from period to period and against its peers without regard to financing methods or capital structure. Magnolia does not consider these non-GAAP measures in isolation or as an alternative to similar financial measures determined in accordance with GAAP. The computations of these non-GAAP measures may not be comparable to other similarly titled measures of other companies. Magnolia excludes certain items from net income in arriving at adjusted net income and adjusted earnings because these amounts can vary substantially from company to company within its industry depending upon accounting methods, book values of assets and the method by which the assets were acquired. Adjusted EBITDAX, adjusted net income, and adjusted earnings should not be considered as alternatives to, or more meaningful than, net income as determined in accordance with GAAP. Certain items excluded from free cash flow, adjusted EBITDAX, adjusted net income, and adjusted earnings are significant components in understanding and assessing a company’s financial performance, and should not be construed as an inference that its results will be unaffected by unusual or non-recurring terms. As performance measures, adjusted EBITDAX, adjusted net income and adjusted earnings may be useful to investors in facilitating comparisons to others in the Company’s industry because certain items can vary substantially in the oil and gas industry from company to company depending upon accounting methods, book value of assets, and capital structure, among other factors. Management believes excluding these items facilitates investors and analysts in evaluating and comparing the underlying operating and financial performance of our business from period to period by eliminating differences caused by the existence and timing of certain expense and income items that would not otherwise be apparent on a GAAP basis. As a liquidity measure, management believes free cash flow is useful for investors and widely accepted by those following the oil and gas industry as financial indicators of a company’s ability to generate cash to internally fund drilling and completion activities, fund acquisitions, and service debt. Our presentation of adjusted EBITDAX, adjusted net income, free cash flow and adjusted earnings and may not be comparable to similar measures of other companies in our industry. A free cash flow reconciliation is shown on page 11, adjusted EBITDAX reconciliation is shown on page 12 of the presentation, adjusted net income reconciliation is shown on page 13 and adjusted earnings reconciliation is shown on page 14. INDUSTRY AND MARKET DATA This presentation has been prepared by Magnolia and includes market data and other statistical information from sources believed by Magnolia to be reliable, including independent industry publications, governmental publications or other published independent sources. Some data is also based on the good faith estimates of Magnolia, which are derived from its review of internal sources as well as the independent sources described above. Although Magnolia believes these sources are reliable, it has not independently verified the information and cannot guarantee its accuracy and completeness. |
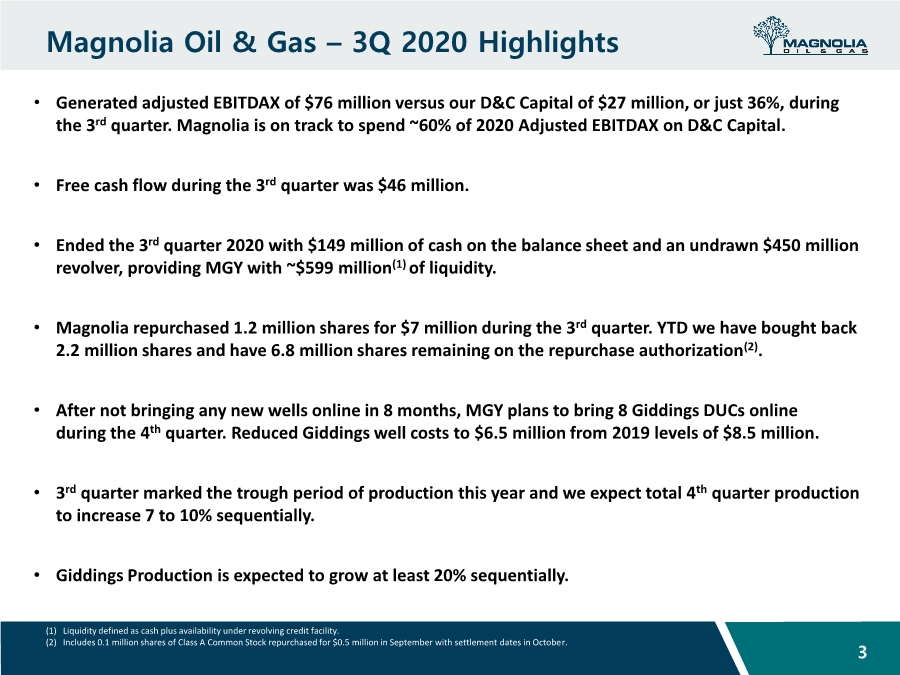
| Magnolia Oil & Gas – 3Q 2020 Highlights 3 • Generated adjusted EBITDAX of $76 million versus our D&C Capital of $27 million, or just 36%, during the 3rd quarter. Magnolia is on track to spend ~60% of 2020 Adjusted EBITDAX on D&C Capital. • Free cash flow during the 3rd quarter was $46 million. • Ended the 3rd quarter 2020 with $149 million of cash on the balance sheet and an undrawn $450 million revolver, providing MGY with ~$599 million(1) of liquidity. • Magnolia repurchased 1.2 million shares for $7 million during the 3rd quarter. YTD we have bought back 2.2 million shares and have 6.8 million shares remaining on the repurchase authorization(2). • After not bringing any new wells online in 8 months, MGY plans to bring 8 Giddings DUCs online during the 4th quarter. Reduced Giddings well costs to $6.5 million from 2019 levels of $8.5 million. • 3rd quarter marked the trough period of production this year and we expect total 4th quarter production to increase 7 to 10% sequentially. • Giddings Production is expected to grow at least 20% sequentially. (1) Liquidity defined as cash plus availability under revolving credit facility. (2) Includes 0.1 million shares of Class A Common Stock repurchased for $0.5 million in September with settlement dates in October. |
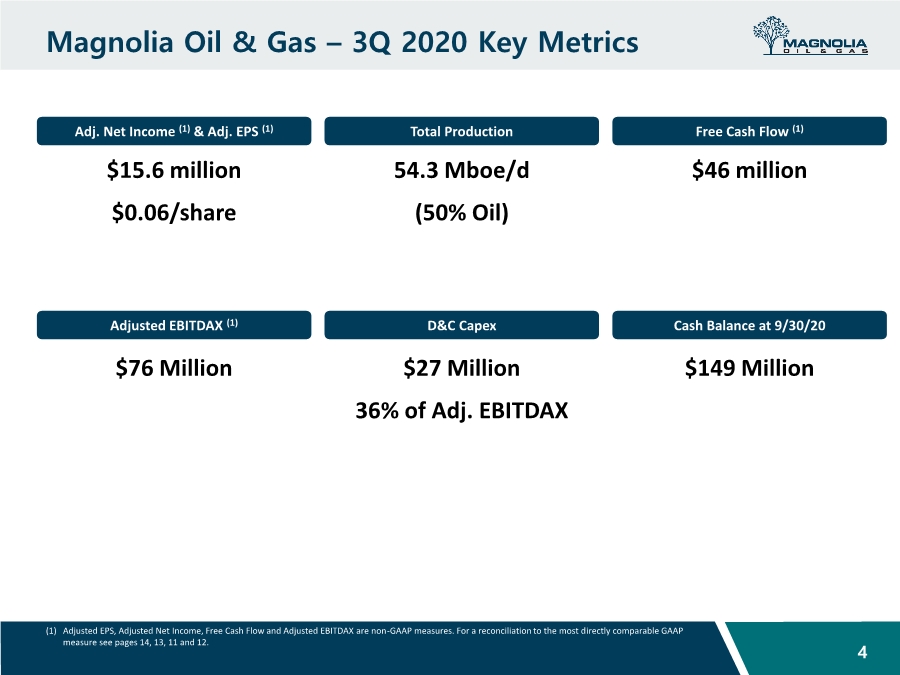
| Magnolia Oil & Gas – 3Q 2020 Key Metrics 4 Adj. Net Income (1) & Adj. EPS (1) Total Production 54.3 Mboe/d (50% Oil) Adjusted EBITDAX (1) $76 Million D&C Capex $27 Million 36% of Adj. EBITDAX Cash Balance at 9/30/20 $149 Million Free Cash Flow (1) $46 million (1) Adjusted EPS, Adjusted Net Income, Free Cash Flow and Adjusted EBITDAX are non-GAAP measures. For a reconciliation to the most directly comparable GAAP measure see pages 14, 13, 11 and 12. $15.6 million $0.06/share |
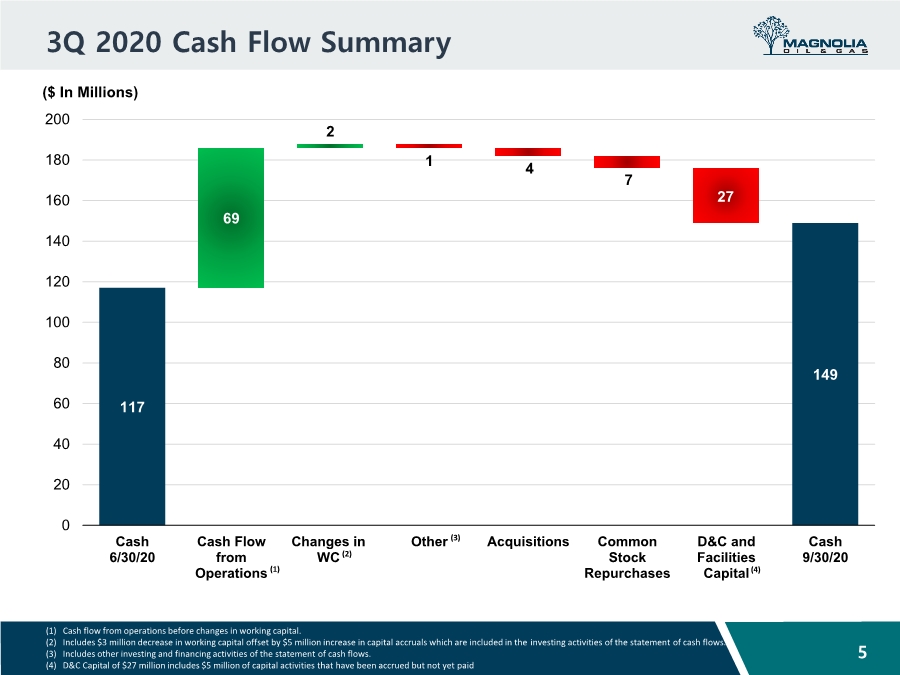
| 117 69 2 1 4 7 27 149 0 20 40 60 80 100 120 140 160 180 200 Cash 6/30/20 Cash Flow from Operations Changes in WC Other Acquisitions Common Stock Repurchases D&C and Facilities Capital Cash 9/30/20 3Q 2020 Cash Flow Summary ($ In Millions) 5 (1) Cash flow from operations before changes in working capital. (2) Includes $3 million decrease in working capital offset by $5 million increase in capital accruals which are included in the investing activities of the statement of cash flows. (3) Includes other investing and financing activities of the statement of cash flows. (4) D&C Capital of $27 million includes $5 million of capital activities that have been accrued but not yet paid (1) (2) (3) (4) |
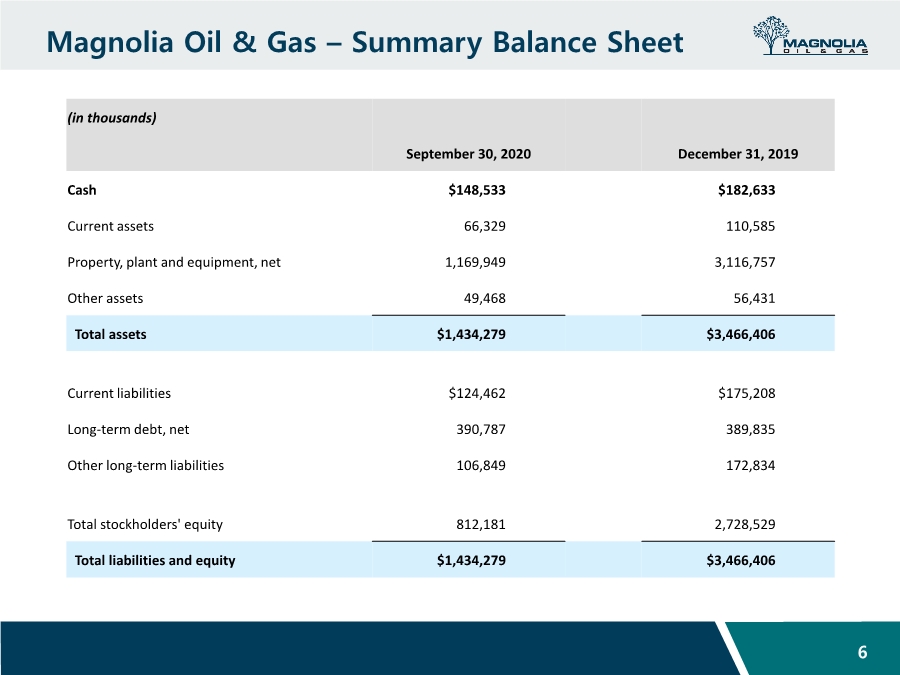
| Magnolia Oil & Gas – Summary Balance Sheet 6 (in thousands) September 30, 2020 December 31, 2019 Cash $148,533 $182,633 Current assets 66,329 110,585 Property, plant and equipment, net 1,169,949 3,116,757 Other assets 49,468 56,431 Total assets $1,434,279 $3,466,406 Current liabilities $124,462 $175,208 Long-term debt, net 390,787 389,835 Other long-term liabilities 106,849 172,834 Total stockholders' equity 812,181 2,728,529 Total liabilities and equity $1,434,279 $3,466,406 |
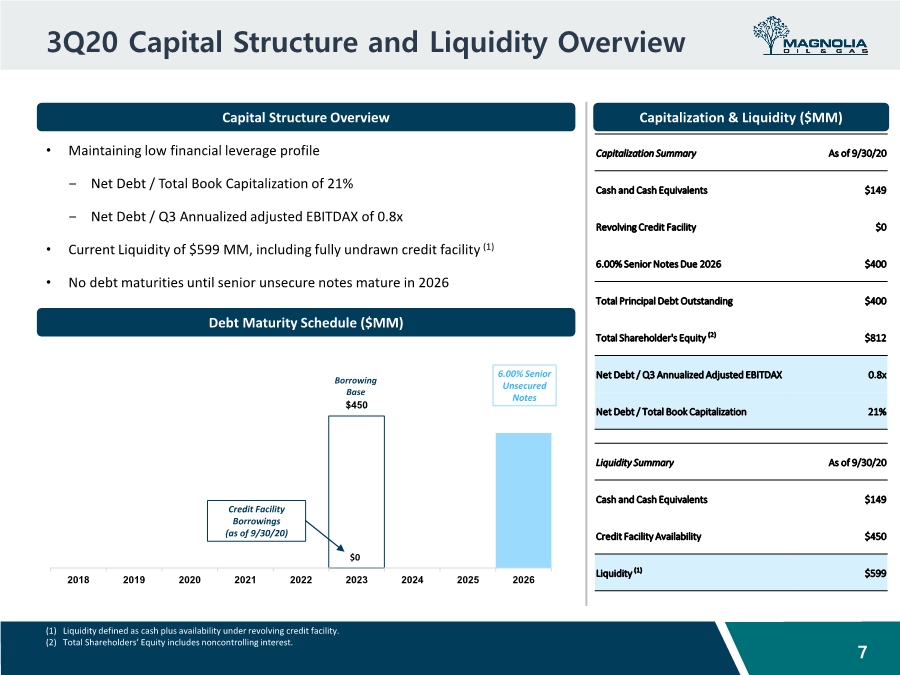
| $450 2018 2019 2020 2021 2022 2023 2024 2025 2026 3Q20 Capital Structure and Liquidity Overview 7 Capital Structure Overview • Maintaining low financial leverage profile ‒ Net Debt / Total Book Capitalization of 21% ‒ Net Debt / Q3 Annualized adjusted EBITDAX of 0.8x • Current Liquidity of $599 MM, including fully undrawn credit facility (1) • No debt maturities until senior unsecure notes mature in 2026 Debt Maturity Schedule ($MM) Borrowing Base Credit Facility Borrowings (as of 9/30/20) $0 6.00% Senior Unsecured Notes (1) Liquidity defined as cash plus availability under revolving credit facility. (2) Total Shareholders’ Equity includes noncontrolling interest. Capitalization & Liquidity ($MM) Capitalization Summary As of 9/30/20 Cash and Cash Equivalents $149 Revolving Credit Facility $0 6.00% Senior Notes Due 2026 $400 Total Principal Debt Outstanding $400 Total Shareholder's Equity (2) $812 Net Debt / Q3 Annualized Adjusted EBITDAX 0.8x Net Debt / Total Book Capitalization 21% Liquidity Summary As of 9/30/20 Cash and Cash Equivalents $149 Credit Facility Availability $450 Liquidity (1) $599 |
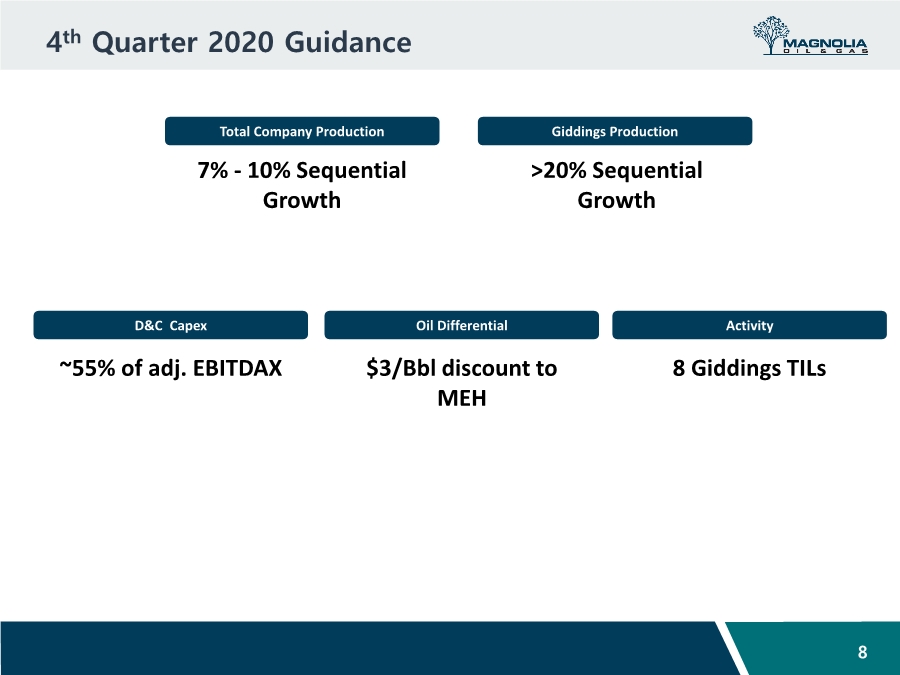
| 4th Quarter 2020 Guidance 8 Total Company Production D&C Capex ~55% of adj. EBITDAX Oil Differential $3/Bbl discount to MEH Activity 8 Giddings TILs Giddings Production >20% Sequential Growth 7% - 10% Sequential Growth |
| Appendix |
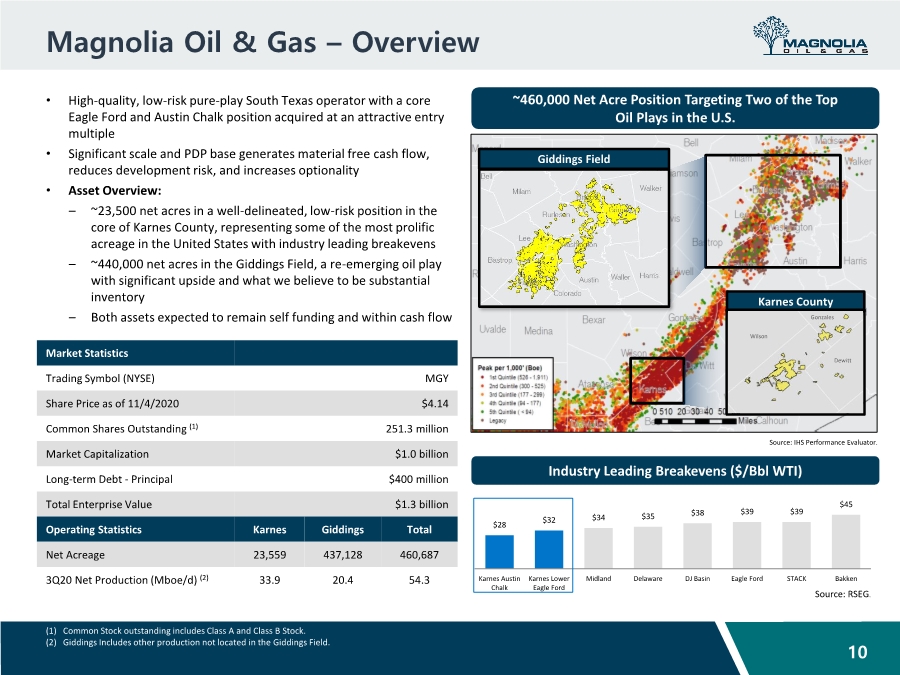
| Magnolia Oil & Gas – Overview • High-quality, low-risk pure-play South Texas operator with a core Eagle Ford and Austin Chalk position acquired at an attractive entry multiple • Significant scale and PDP base generates material free cash flow, reduces development risk, and increases optionality • Asset Overview: – ~23,500 net acres in a well-delineated, low-risk position in the core of Karnes County, representing some of the most prolific acreage in the United States with industry leading breakevens – ~440,000 net acres in the Giddings Field, a re-emerging oil play with significant upside and what we believe to be substantial inventory – Both assets expected to remain self funding and within cash flow 10 Karnes County Giddings Field ~460,000 Net Acre Position Targeting Two of the Top Oil Plays in the U.S. Market Statistics Trading Symbol (NYSE) MGY Share Price as of 11/4/2020 $4.14 Common Shares Outstanding (1) 251.3 million Market Capitalization $1.0 billion Long-term Debt - Principal $400 million Total Enterprise Value $1.3 billion Operating Statistics Karnes Giddings Total Net Acreage 23,559 437,128 460,687 3Q20 Net Production (Mboe/d) (2) 33.9 20.4 54.3 Industry Leading Breakevens ($/Bbl WTI) Source: IHS Performance Evaluator. $28 $32 $34 $35 $38 $39 $39 $45 Karnes Austin Chalk Karnes Lower Eagle Ford Midland Delaware DJ Basin Eagle Ford STACK Bakken Source: RSEG. Wilson Dewitt Gonzales (1) Common Stock outstanding includes Class A and Class B Stock. (2) Giddings Includes other production not located in the Giddings Field. |
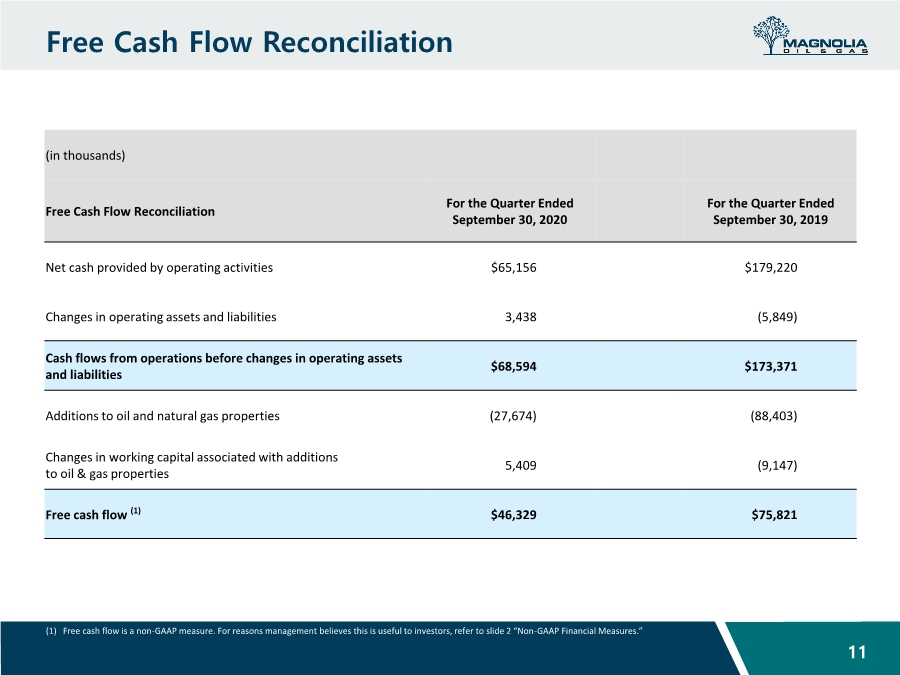
| Free Cash Flow Reconciliation 11 (1) Free cash flow is a non-GAAP measure. For reasons management believes this is useful to investors, refer to slide 2 “Non-GAAP Financial Measures.” (in thousands) Free Cash Flow Reconciliation For the Quarter Ended September 30, 2020 For the Quarter Ended September 30, 2019 Net cash provided by operating activities $65,156 $179,220 Changes in operating assets and liabilities 3,438 (5,849) Cash flows from operations before changes in operating assets and liabilities $68,594 $173,371 Additions to oil and natural gas properties (27,674) (88,403) Changes in working capital associated with additions to oil & gas properties 5,409 (9,147) Free cash flow (1) $46,329 $75,821 |
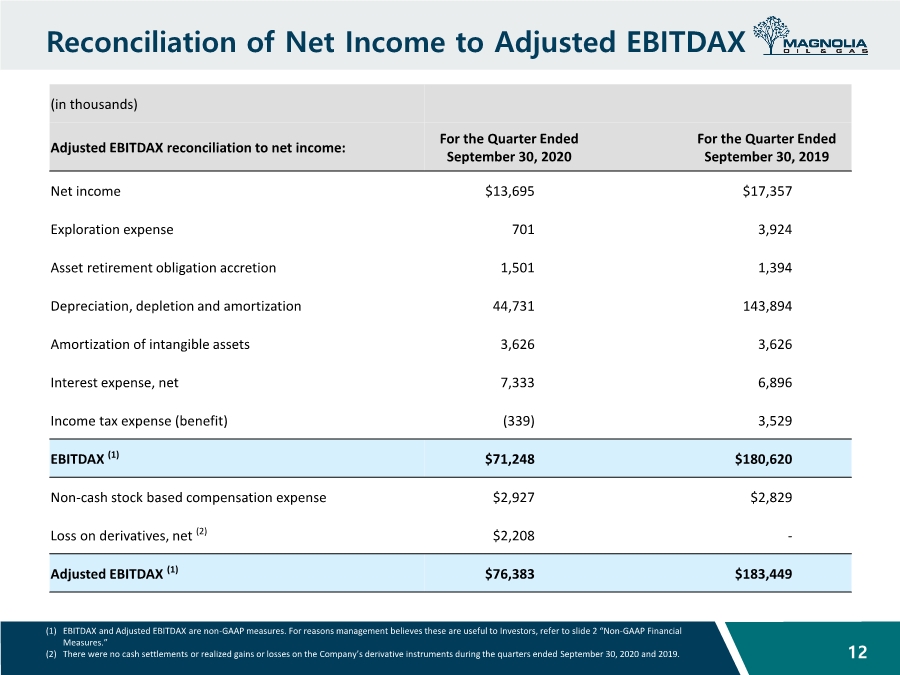
| Reconciliation of Net Income to Adjusted EBITDAX 12 (in thousands) Adjusted EBITDAX reconciliation to net income: For the Quarter Ended September 30, 2020 For the Quarter Ended September 30, 2019 Net income $13,695 $17,357 Exploration expense 701 3,924 Asset retirement obligation accretion 1,501 1,394 Depreciation, depletion and amortization 44,731 143,894 Amortization of intangible assets 3,626 3,626 Interest expense, net 7,333 6,896 Income tax expense (benefit) (339) 3,529 EBITDAX (1) $71,248 $180,620 Non-cash stock based compensation expense $2,927 $2,829 Loss on derivatives, net (2) $2,208 - Adjusted EBITDAX (1) $76,383 $183,449 (1) EBITDAX and Adjusted EBITDAX are non-GAAP measures. For reasons management believes these are useful to Investors, refer to slide 2 “Non-GAAP Financial Measures.” (2) There were no cash settlements or realized gains or losses on the Company’s derivative instruments during the quarters ended September 30, 2020 and 2019. |
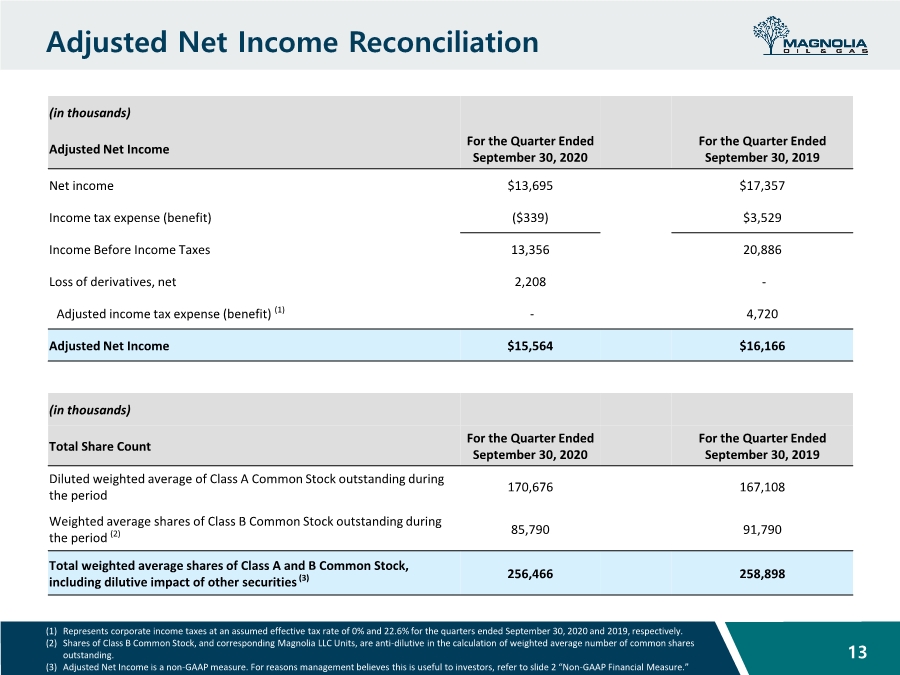
| Adjusted Net Income Reconciliation 13 (in thousands) Adjusted Net Income For the Quarter Ended September 30, 2020 For the Quarter Ended September 30, 2019 Net income $13,695 $17,357 Income tax expense (benefit) ($339) $3,529 Income Before Income Taxes 13,356 20,886 Loss of derivatives, net 2,208 - Adjusted income tax expense (benefit) (1) - 4,720 Adjusted Net Income $15,564 $16,166 (in thousands) Total Share Count For the Quarter Ended September 30, 2020 For the Quarter Ended September 30, 2019 Diluted weighted average of Class A Common Stock outstanding during the period 170,676 167,108 Weighted average shares of Class B Common Stock outstanding during the period (2) 85,790 91,790 Total weighted average shares of Class A and B Common Stock, including dilutive impact of other securities (3) 256,466 258,898 (1) Represents corporate income taxes at an assumed effective tax rate of 0% and 22.6% for the quarters ended September 30, 2020 and 2019, respectively. (2) Shares of Class B Common Stock, and corresponding Magnolia LLC Units, are anti-dilutive in the calculation of weighted average number of common shares outstanding. (3) Adjusted Net Income is a non-GAAP measure. For reasons management believes this is useful to investors, refer to slide 2 “Non-GAAP Financial Measure.” |
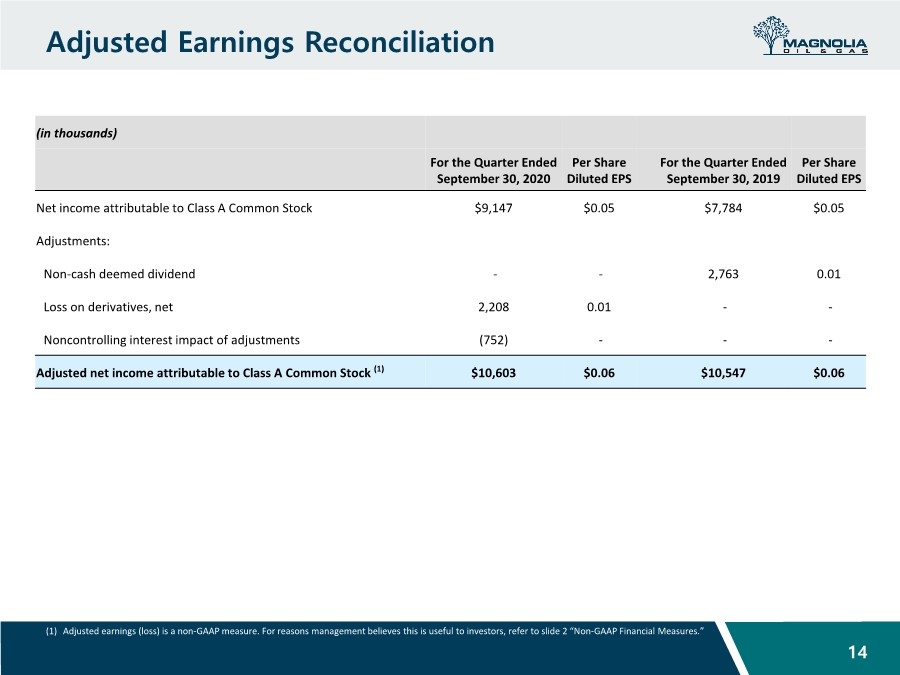
| Adjusted Earnings Reconciliation 14 (1) Adjusted earnings (loss) is a non-GAAP measure. For reasons management believes this is useful to investors, refer to slide 2 “Non-GAAP Financial Measures.” (in thousands) For the Quarter Ended September 30, 2020 Per Share Diluted EPS For the Quarter Ended September 30, 2019 Per Share Diluted EPS Net income attributable to Class A Common Stock $9,147 $0.05 $7,784 $0.05 Adjustments: Non-cash deemed dividend -- 2,763 0.01 Loss on derivatives, net 2,208 0.01 -- Noncontrolling interest impact of adjustments (752) --- Adjusted net income attributable to Class A Common Stock (1) $10,603 $0.06 $10,547 $0.06 |
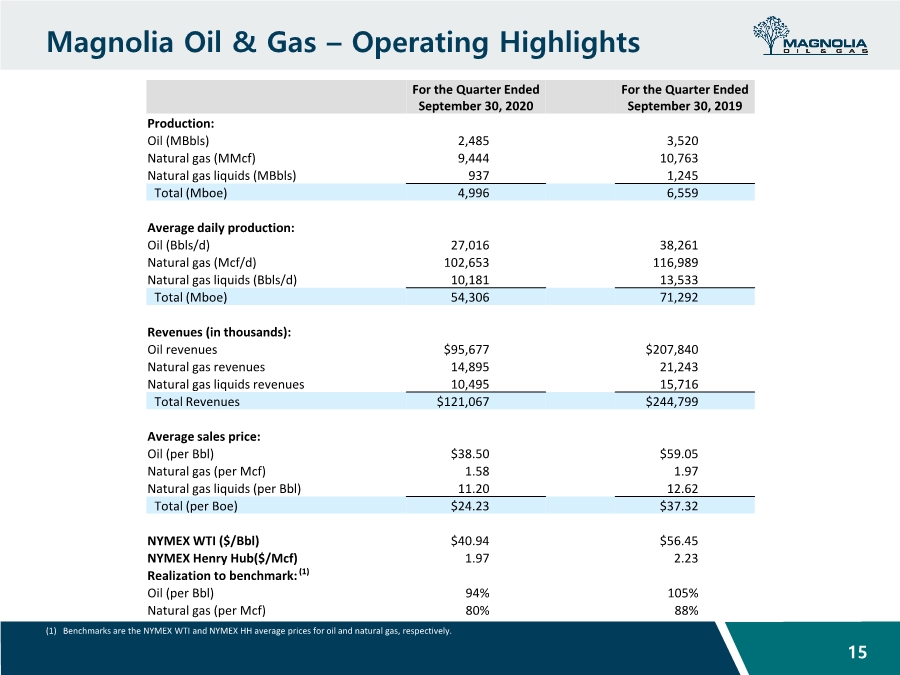
| Magnolia Oil & Gas – Operating Highlights 15 (1) Benchmarks are the NYMEX WTI and NYMEX HH average prices for oil and natural gas, respectively. For the Quarter Ended September 30, 2020 For the Quarter Ended September 30, 2019 Production: Oil (MBbls) 2,485 3,520 Natural gas (MMcf) 9,444 10,763 Natural gas liquids (MBbls) 937 1,245 Total (Mboe) 4,996 6,559 Average daily production: Oil (Bbls/d) 27,016 38,261 Natural gas (Mcf/d) 102,653 116,989 Natural gas liquids (Bbls/d) 10,181 13,533 Total (Mboe) 54,306 71,292 Revenues (in thousands): Oil revenues $95,677 $207,840 Natural gas revenues 14,895 21,243 Natural gas liquids revenues 10,495 15,716 Total Revenues $121,067 $244,799 Average sales price: Oil (per Bbl) $38.50 $59.05 Natural gas (per Mcf) 1.58 1.97 Natural gas liquids (per Bbl) 11.20 12.62 Total (per Boe) $24.23 $37.32 NYMEX WTI ($/Bbl) $40.94 $56.45 NYMEX Henry Hub($/Mcf) 1.97 2.23 Realization to benchmark: (1) Oil (per Bbl) 94% 105% Natural gas (per Mcf) 80% 88% |
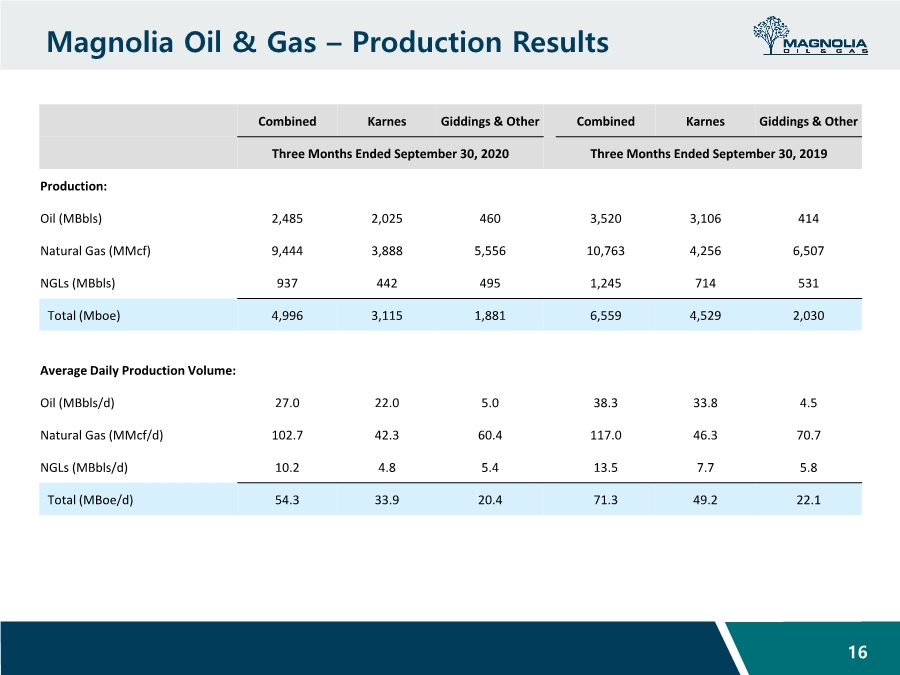
| Magnolia Oil & Gas – Production Results 16 Combined Karnes Giddings & Other Combined Karnes Giddings & Other Three Months Ended September 30, 2020 Three Months Ended September 30, 2019 Production: Oil (MBbls) 2,485 2,025 460 3,520 3,106 414 Natural Gas (MMcf) 9,444 3,888 5,556 10,763 4,256 6,507 NGLs (MBbls) 937 442 495 1,245 714 531 Total (Mboe) 4,996 3,115 1,881 6,559 4,529 2,030 Average Daily Production Volume: Oil (MBbls/d) 27.0 22.0 5.0 38.3 33.8 4.5 Natural Gas (MMcf/d) 102.7 42.3 60.4 117.0 46.3 70.7 NGLs (MBbls/d) 10.2 4.8 5.4 13.5 7.7 5.8 Total (MBoe/d) 54.3 33.9 20.4 71.3 49.2 22.1 |