Attached files
| file | filename |
|---|---|
| EX-99.1 - EXHIBIT 99.1 - MFA FINANCIAL, INC. | tm2032276d2_ex99-1.htm |
| 8-K - FORM 8-K - MFA FINANCIAL, INC. | tm2032276d2_8k.htm |
Exhibit 99.2
 |
Third Quarter 2020 Earnings Presentation |
 |
Forward looking statements When used in this press release or other written or oral communications, statements which are not historical in nature, including those containing words such as “will,” “believe,” “expect,” “anticipate,” “estimate,” “plan,” “continue,” “intend,” “should,” “could,” “would,” “may,” the negative of these words or similar expressions, are intended to identify “forward-looking statements” within the meaning of Section 27A of the Securities Act of 1933, as amended, and Section 21E of the Securities Exchange Act of 1934, as amended, and, as such, may involve known and unknown risks, uncertainties and assumptions. These forward-looking statements include information about possible or assumed future results with respect to our business, financial condition, liquidity, results of operations, plans and objectives. Statements regarding the following subjects, among others, may be forward-looking: risks related to the ongoing spread of the novel coronavirus and the COVID-19 pandemic, including its effect on the general economy and our business, financial position and results of operations (including, among other potential effects, increased delinquencies and greater than expected losses in our whole loan portfolio); changes in interest rates and the market (i.e., fair) value of MFA’s residential whole loans, MBS and other assets; changes in the prepayment rates on residential mortgage assets, an increase of which could result in a reduction of the yield on certain investments in its portfolio and could require MFA to reinvest the proceeds received by it as a result of such prepayments in investments with lower coupons, while a decrease in which could result in an increase in the interest rate duration of certain investments in MFA’s portfolio making their valuation more sensitive to changes in interest rates and could result in lower forecasted cash flows; credit risks underlying MFA’s assets, including changes in the default rates and management’s assumptions regarding default rates on the mortgage loans in MFA’s residential whole loan portfolio; MFA’s ability to borrow to finance its assets and the terms, including the cost, maturity and other terms, of any such borrowings; implementation of or changes in government regulations or programs affecting MFA’s business; MFA’s estimates regarding taxable income, the actual amount of which is dependent on a number of factors, including, but not limited to, changes in the amount of interest income and financing costs, the method elected by MFA to accrete the market discount on residential whole loans and the extent of prepayments, realized losses and changes in the composition of MFA’s residential whole loan portfolios that may occur during the applicable tax period, including gain or loss on any MBS disposals and whole loan modifications, foreclosures and liquidations; the timing and amount of distributions to stockholders, which are declared and paid at the discretion of MFA’s Board and will depend on, among other things, MFA’s taxable income, its financial results and overall financial condition and liquidity, maintenance of its REIT qualification and such other factors as MFA’s Board deems relevant; MFA’s ability to maintain its qualification as a REIT for federal income tax purposes; MFA’s ability to maintain its exemption from registration under the Investment Company Act of 1940, as amended (or the “Investment Company Act”), including statements regarding the concept release issued by the Securities and Exchange Commission (“SEC”) relating to interpretive issues under the Investment Company Act with respect to the status under the Investment Company Act of certain companies that are engaged in the business of acquiring mortgages and mortgage-related interests; MFA’s ability to continue growing its residential whole loan portfolio, which is dependent on, among other things, the supply of loans offered for sale in the market; expected returns on MFA’s investments in nonperforming residential whole loans (“NPLs”), which are affected by, among other things, the length of time required to foreclose upon, sell, liquidate or otherwise reach a resolution of the property underlying the NPL, home price values, amounts advanced to carry the asset (e.g., taxes, insurance, maintenance expenses, etc. on the underlying property) and the amount ultimately realized upon resolution of the asset; targeted or expected returns on MFA’s investments in recently-originated loans, the performance of which is, similar to MFA’s other mortgage loan investments, subject to, among other things, differences in prepayment risk, credit risk and financing cost associated with such investments; risks associated with MFA’s investments in MSR-related assets, including servicing, regulatory and economic risks, risks associated with our investments in loan originators, and risks associated with investing in real estate assets, including changes in business conditions and the general economy. These and other risks, uncertainties and factors, including those described in the annual, quarterly and current reports that MFA files with the SEC, could cause MFA’s actual results to differ materially from those projected in any forward-looking statements it makes. All forward-looking statements are based on beliefs, assumptions and expectations of MFA’s future performance, taking into account all information currently available. Readers are cautioned not to place undue reliance on these forward-looking statements, which speak only as of the date on which they are made. New risks and uncertainties arise over time and it is not possible to predict those events or how they may affect MFA. Except as required by law, MFA is not obligated to, and does not intend to, update or revise any forward-looking statements, whether as a result of new information, future events or otherwise. |
 |
Executive summary •2020 third quarter financial results •Non-QM securitizations •Paid off $500 million Apollo/Athene 11% senior secured term loan •Future expected securitization activity •Stock repurchase authorization |
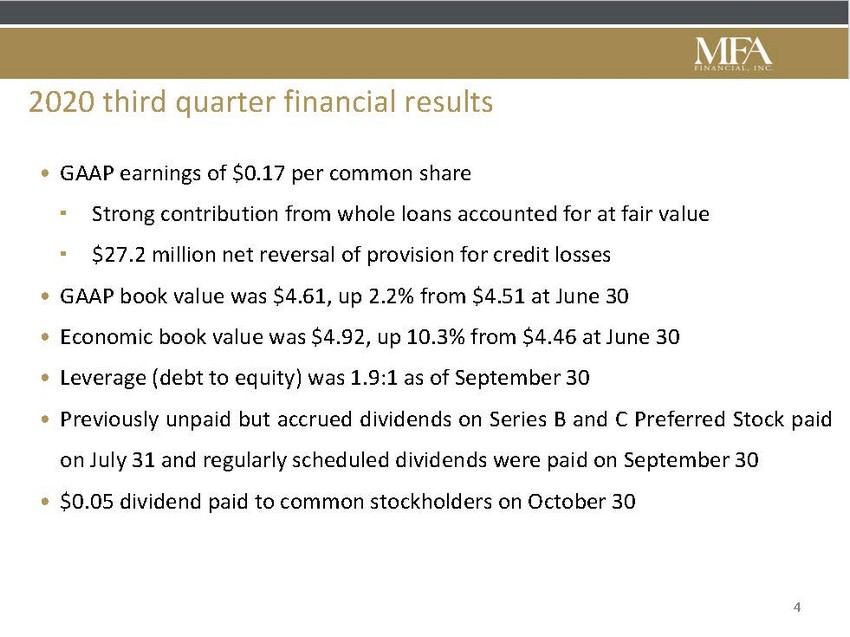 |
2020 third quarter financial results • GAAP earnings of $0.17 per common share ▪Strong contribution from whole loans accounted for at fair value ▪$27.2 million net reversal of provision for credit losses • GAAP book value was $4.61, up 2.2% from $4.51 at June 30 • Economic book value was $4.92, up 10.3% from $4.46 at June 30 • Leverage (debt to equity) was 1.9:1 as of September 30 • Previously unpaid but accrued dividends on Series B and C Preferred Stock paid on July 31 and regularly scheduled dividends were paid on September 30 • $0.05 dividend paid to common stockholders on October 30 |
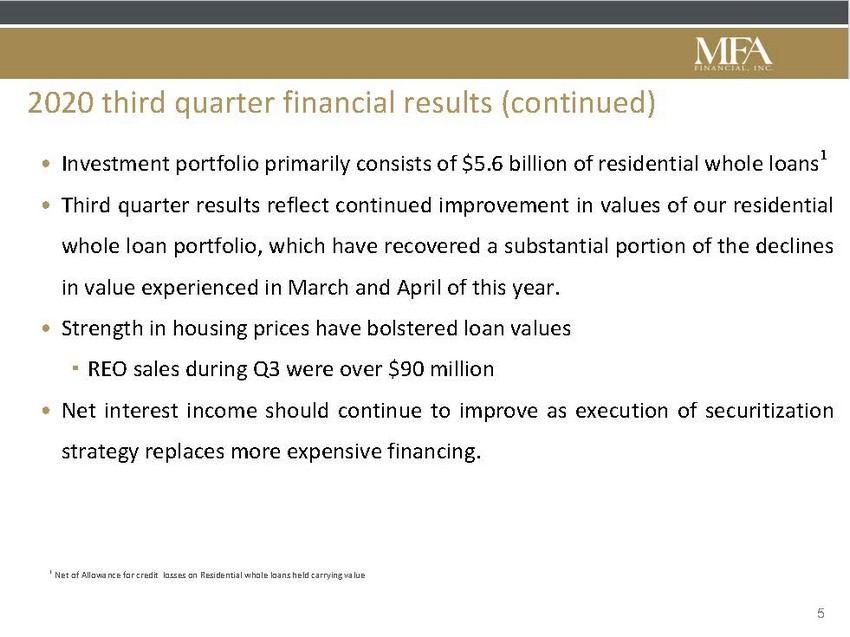 |
2020 third quarter financial results (continued) • Investment portfolio primarily consists of $5.6 billion of residential whole loans1 • Third quarter results reflect continued improvement in values of our residential whole loan portfolio, which have recovered a substantial portion of the declines in value experienced in March and April of this year. • Strength in housing prices have bolstered loan values ▪ REO sales during Q3 were over $90 million • Net interest income should continue to improve as execution of securitization strategy replaces more expensive financing. 1 Net of Allowance for credit losses on Residential whole loans held carrying value 5 |
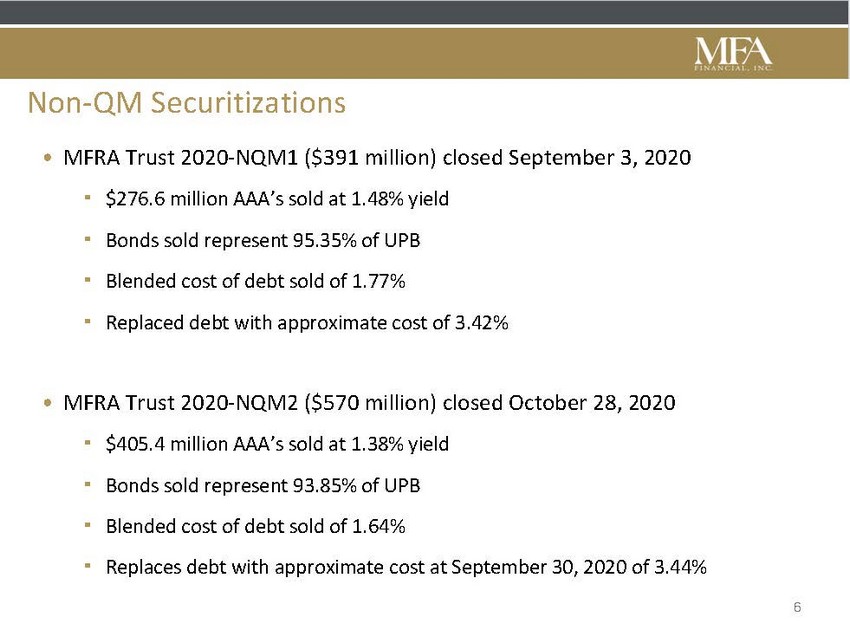 |
Non-QM Securitizations • MFRA Trust 2020-NQM1 ($391 million) closed September 3, 2020 ▪$276.6 million AAA’s sold at 1.48% yield ▪Bonds sold represent 95.35% of UPB ▪Blended cost of debt sold of 1.77% ▪Replaced debt with approximate cost of 3.42% • MFRA Trust 2020-NQM2 ($570 million) closed October 28, 2020 ▪$405.4 million AAA’s sold at 1.38% yield ▪Bonds sold represent 93.85% of UPB ▪Blended cost of debt sold of 1.64% ▪Replaces debt with approximate cost at September 30, 2020 of 3.44% 6 |
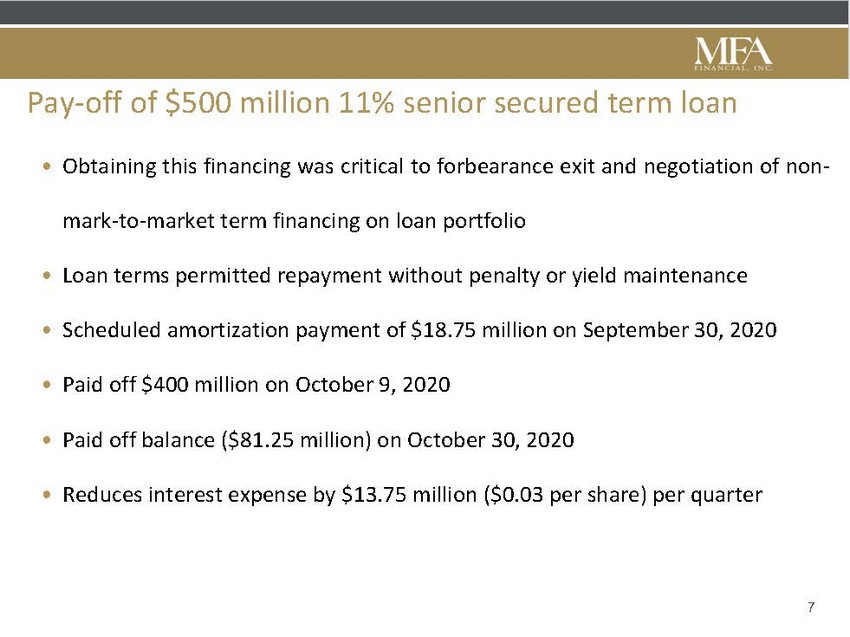 |
Pay-off of $500 million 11% senior secured term loan • Obtaining this financing was critical to forbearance exit and negotiation of non-mark-to-market term financing on loan portfolio • Loan terms permitted repayment without penalty or yield maintenance • Scheduled amortization payment of $18.75 million on September 30, 2020 • Paid off $400 million on October 9, 2020 • Paid off balance ($81.25 million) on October 30, 2020 • Reduces interest expense by $13.75 million ($0.03 per share) per quarter 7 |
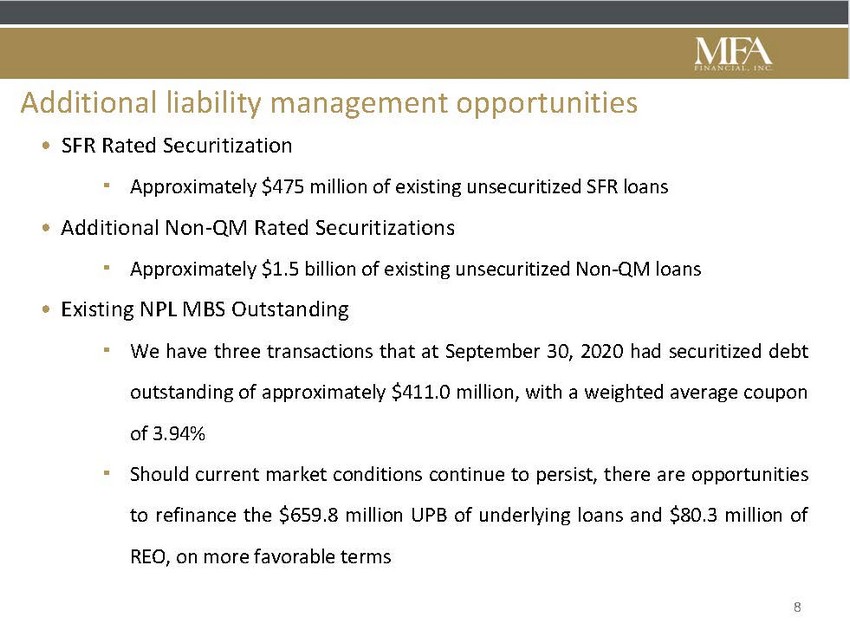 |
Additional liability management opportunities • SFR Rated Securitization ▪Approximately $475 million of existing unsecuritized SFR loans • Additional Non-QM Rated Securitizations ▪Approximately $1.5 billion of existing unsecuritized Non-QM loans • Existing NPL MBS Outstanding ▪We have three transactions that at September 30, 2020 had securitized debt outstanding of approximately $411.0 million, with a weighted average coupon of 3.94% ▪Should current market conditions continue to persist, there are opportunities to refinance the $659.8 million UPB of underlying loans and $80.3 million of REO, on more favorable terms |
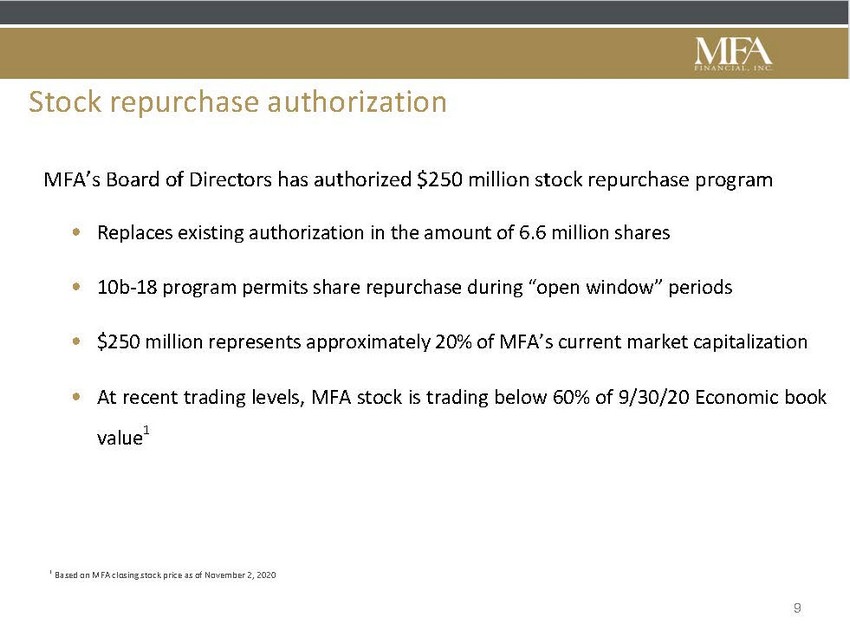 |
Stock repurchase authorization MFA’s Board of Directors has authorized $250 million stock repurchase program •Replaces existing authorization in the amount of 6.6 million shares •10b-18 program permits share repurchase during “open window” periods •$250 million represents approximately 20% of MFA’s current market capitalization •At recent trading levels, MFA stock is trading below 60% of 9/30/20 Economic book value1 1 Based on MFA closing stock price as of November 2, 2020 |
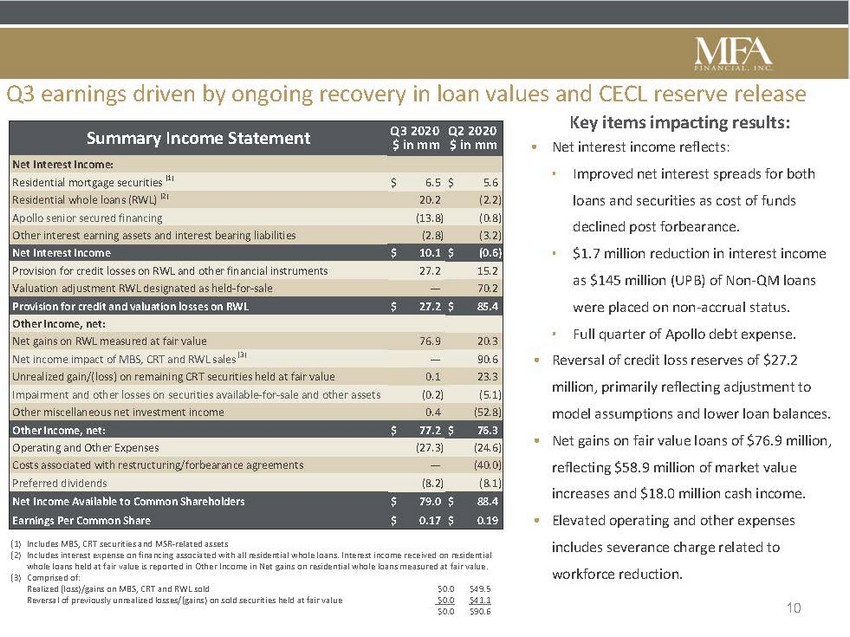 |
Q3 earnings driven by ongoing recovery in loan values and CECL reserve release $ in mm Q2 2020 $ in mm Key items impacting results: •Net interest income reflects: Net Interest Income: Residential mortgage securities (1) $ 6.5 $ 5.6 Residential whole loans (RWL) (2) 20.2 (2.2) Apollo senior secured financing (13.8) (0.8) Other interest earning assets and interest bearing liabilities (2.8) (3.2) Net Interest Income $ 10.1 $ (0.6) Provision for credit losses on RWL and other financial instruments 27.2 15.2 Valuation adjustment RWL designated as held-for-sale — 70.2 Provision for credit and valuation losses on RWL $ 27.2 $ 85.4 Other Income, net: Net gains on RWL measured at fair value 76.9 20.3 Net income impact of MBS, CRT and RWL sales (3) — 90.6 Unrealized gain/(loss) on remaining CRT securities held at fair value 0.1 23.3 Impairment and other losses on securities available-for-sale and other assets (0.2) (5.1) Other miscellaneous net investment income 0.4 (52.8) Other Income, net: $ 77.2 $ 76.3 Operating and Other Expenses (27.3) (24.6) Costs associated with restructuring/forbearance agreements — (40.0) Preferred dividends (8.2) (8.1) Net Income Available to Common Shareholders $ 79.0 $ 88.4 Earnings Per Common Share $ 0.17 $ 0.19 (1) Includes MBS, CRT securities and MSR-related assets (2) Includes interest expense on financing associated with all residential whole loans. Interest income received on residential whole loans held at fair value is reported in Other Income in Net gains on residential whole loans measured at fair value. Realized (loss)/gains on MBS, CRT and RWL sold $0.0 $49.5 Reversal of previously unrealized losses/(gains) on sold securities held at fair value $0.0 $41.1 $0.0 $90.6 ▪Improved net interest spreads for both loans and securities as cost of funds declined post forbearance. ▪$1.7 million reduction in interest income as $145 million (UPB) of Non-QM loans were placed on non-accrual status. ▪Full quarter of Apollo debt expense. • Reversal of credit loss reserves of $27.2 million, primarily reflecting adjustment to model assumptions and lower loan balances. • Net gains on fair value loans of $76.9 million, reflecting $58.9 million of market value increases and $18.0 million cash income. • Elevated operating and other expenses includes severance charge related to workforce reduction. 10 |
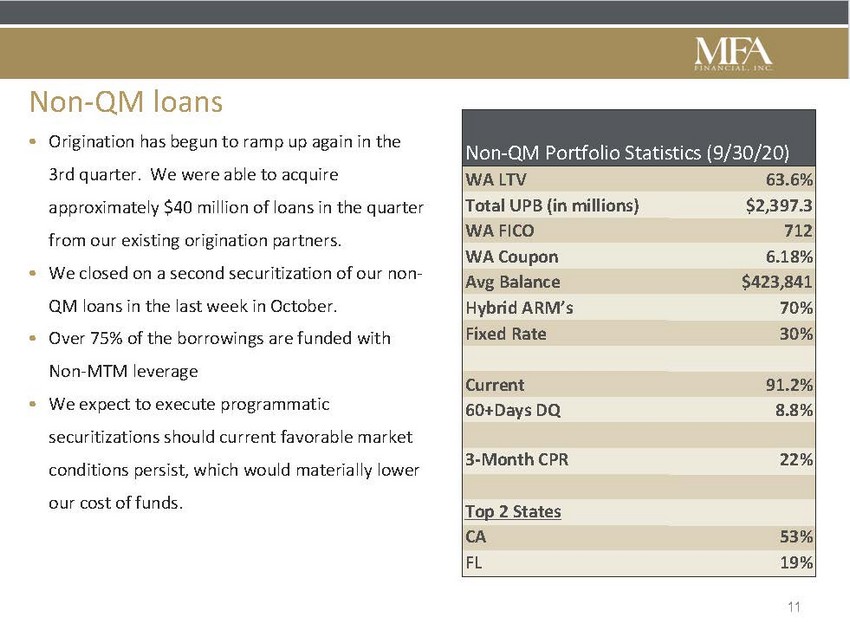 |
Non-QM Portfolio Statistics (9/30/20) WA LTV63.6% Total UPB (in millions)$2,397.3 WA FICO712 WA Coupon6.18% Avg Balance$423,841 Hybrid ARM’s70% Fixed Rate30% Current91.2% 60+Days DQ8.8% 3-Month CPR22% Top 2 States CA53% FL19% •Origination has begun to ramp up again in the 3rd quarter. We were able to acquire approximately $40 million of loans in the quarter from our existing origination partners. •We closed on a second securitization of our non-QM loans in the last week in October. •Over 75% of the borrowings are funded with Non-MTM leverage •We expect to execute programmatic securitizations should current favorable market conditions persist, which would materially lower our cost of funds. |
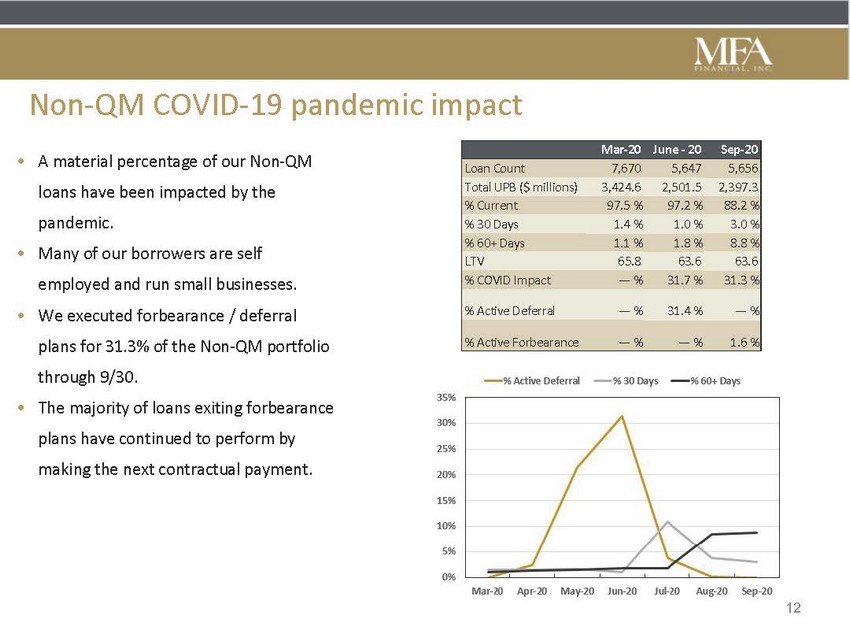 |
Non-QM COVID-19 pandemic impact •A material percentage of our Non-QM loans have been impacted by the pandemic. •Many of our borrowers are self employed and run small businesses. •We executed forbearance / deferral plans for 31.3% of the Non-QM portfolio through 9/30. •The majority of loans exiting forbearance plans have continued to perform by making the next contractual payment. Mar-20June - 20Sep-20 Loan Count7,6705,6475,656 Total UPB ($ millions)3,424.62,501.52,397.3 % Current97.5 %97.2 %88.2 % % 30 Days1.4 %1.0 %3.0 % % 60+ Days1.1 %1.8 %8.8 % LTV 65.863.6 63.6 % COVID Impact— %31.7 %31.3 % % Active Deferral— %31.4 %— % % Active Forbearance— %— %1.6 % |
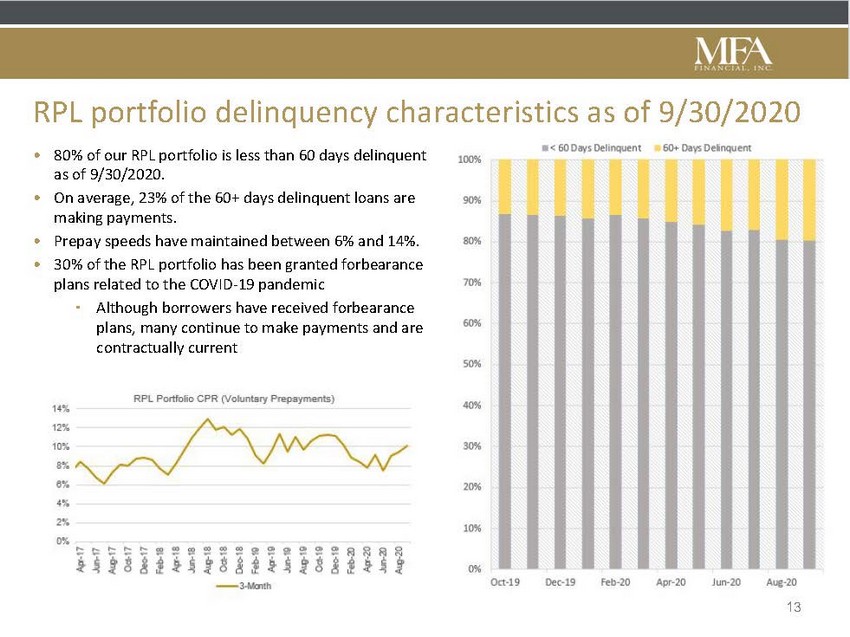 |
RPL portfolio delinquency characteristics as of 9/30/2020 •80% of our RPL portfolio is less than 60 days delinquent as of 9/30/2020. •On average, 23% of the 60+ days delinquent loans are making payments. •Prepay speeds have maintained between 6% and 14%. •30% of the RPL portfolio has been granted forbearance plans related to the COVID-19 pandemic ▪Although borrowers have received forbearance plans, many continue to make payments and are contractually current 13 |
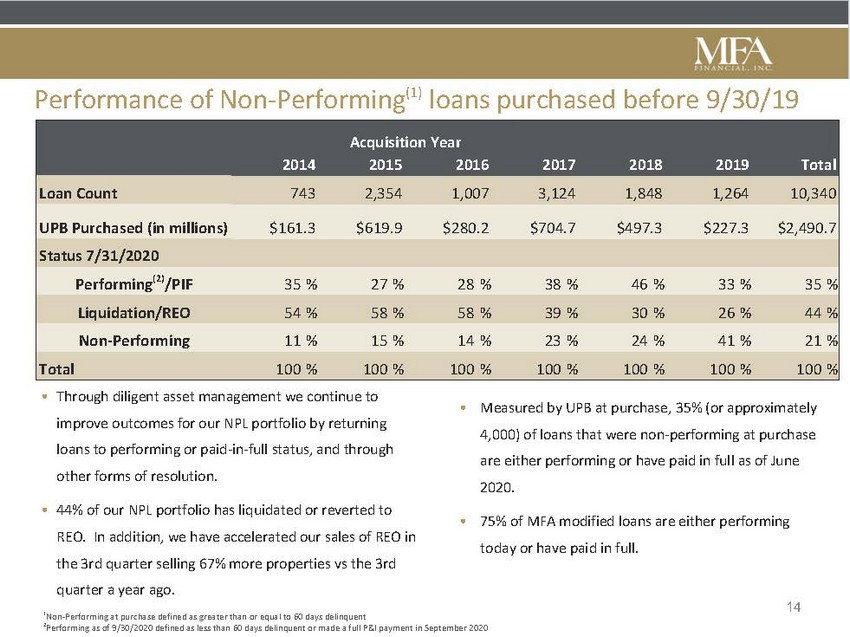 |
Performance of Non-Performing(1) loans purchased before 9/30/19 Acquisition Year 201420152016201720182019Total Loan Count7432,3541,0073,1241,8481,26410,340 UPB Purchased (in millions)$161.3$619.9$280.2$704.7$497.3$227.3$2,490.7 Status 7/31/2020 Performing(2)/PIF 35 % 27 % 28 % 38 % 46 % 33 % 35 % Liquidation/REO 54 % 58 % 58 % 39 % 30 % 26 % 44 % Non-Performing 11 % 15 % 14 % 23 % 24 % 41 % 21 % Total100 %100 %100 %100 %100 %100 %100 % • Through diligent asset management we continue to improve outcomes for our NPL portfolio by returning loans to performing or paid-in-full status, and through other forms of resolution. • 44% of our NPL portfolio has liquidated or reverted to REO. In addition, we have accelerated our sales of REO in the 3rd quarter selling 67% more properties vs the 3rd quarter a year ago. 1Non-Performing at purchase defined as greater than or equal to 60 days delinquent •Measured by UPB at purchase, 35% (or approximately 4,000) of loans that were non-performing at purchase are either performing or have paid in full as of June 2020. •75% of MFA modified loans are either performing today or have paid in full. 14 2Performing as of 9/30/2020 defined as less than 60 days delinquent or made a full P&I payment in September 2020 |
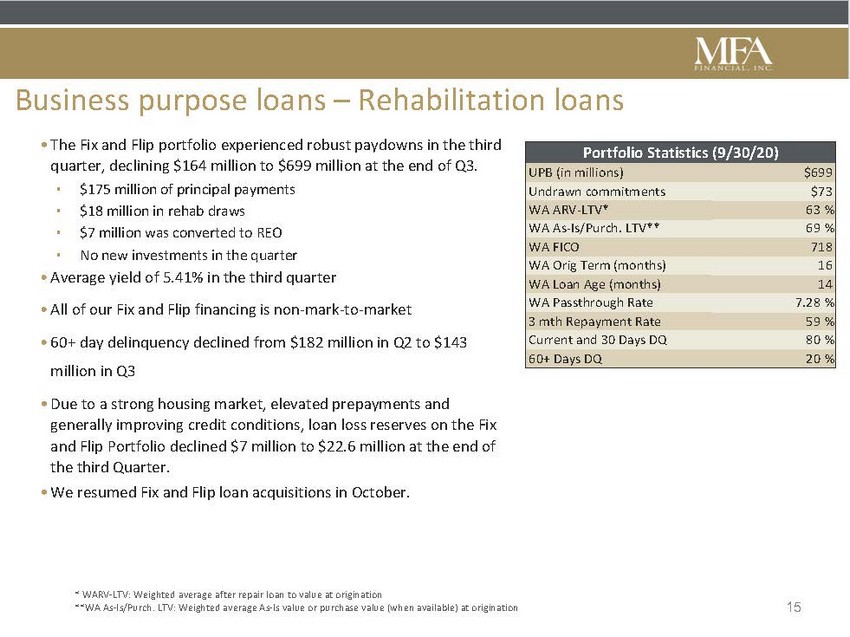 |
Business purpose loans – Rehabilitation loans Portfolio Statistics (9/30/20) UPB (in millions)$699 Undrawn commitments$73 WA ARV-LTV*63 % WA As-Is/Purch. LTV**69 % WA FICO718 WA Orig Term (months)16 WA Loan Age (months)14 WA Passthrough Rate7.28 % 3 mth Repayment Rate59 % Current and 30 Days DQ80 % 60+ Days DQ20 % ▪$175 million of principal payments ▪$18 million in rehab draws ▪$7 million was converted to REO ▪No new investments in the quarter • Average yield of 5.41% in the third quarter • All of our Fix and Flip financing is non-mark-to-market • 60+ day delinquency declined from $182 million in Q2 to $143 million in Q3 • Due to a strong housing market, elevated prepayments and generally improving credit conditions, loan loss reserves on the Fix and Flip Portfolio declined $7 million to $22.6 million at the end of the third Quarter. • We resumed Fix and Flip loan acquisitions in October. * WARV-LTV: Weighted average after repair loan to value at origination **WA As-Is/Purch. LTV: Weighted average As-Is value or purchase value (when available) at origination15 |
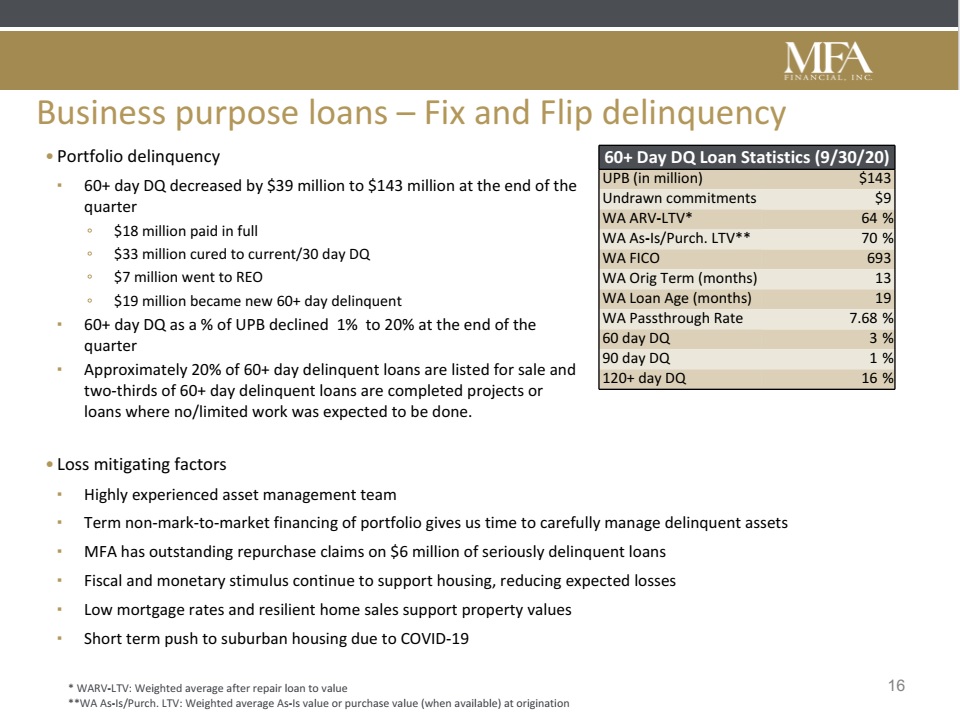 |
Business purpose loans – Fix and Flip delinquency • Portfolio delinquency ▪60+ day DQ % as decreased by $39 million to $143 million at the end of the quarter ◦$18 million paid in full ◦$33 million cured to current/30 day DQ ◦$7 million went to REO ◦$19 million became new 60+ day delinquent ▪60+ day DQ as a % of UPB declined 1% to 20% at the end of the quarter ▪Approximately 20% of 60+ day delinquent loans are listed for sale and two-thirds of 60+ day delinquent loans are completed projects or loans where no/limited work was expected to be done. 60+ Day DQ Loan Statistics (9/30/20) UPB (in million) $143 Undrawn commitments $9 WA ARV-LTV* 64 % WA As-Is/Purch. LTV** 70 % WA FICO 693 WA Orig Term (months) 13 WA Loan Age (months) 19 WA Passthrough Rate 7.68 % 60 day DQ 3 % 90 day DQ 1 % 120+ day DQ 16 % • Loss mitigating factors ▪Highly experienced asset management team ▪Term non-mark-to-market financing of portfolio gives us time to carefully manage delinquent assets ▪MFA has outstanding repurchase claims on $6 million of seriously delinquent loans ▪Fiscal and monetary stimulus continue to support housing, reducing expected losses ▪Low mortgage rates and resilient home sales support property values ▪Short term push to suburban housing due to COVID-19 * WARV-LTV: Weighted average after repair loan to value16 **WA As-Is/Purch. LTV: Weighted average As-Is value or purchase value (when available) at origination |
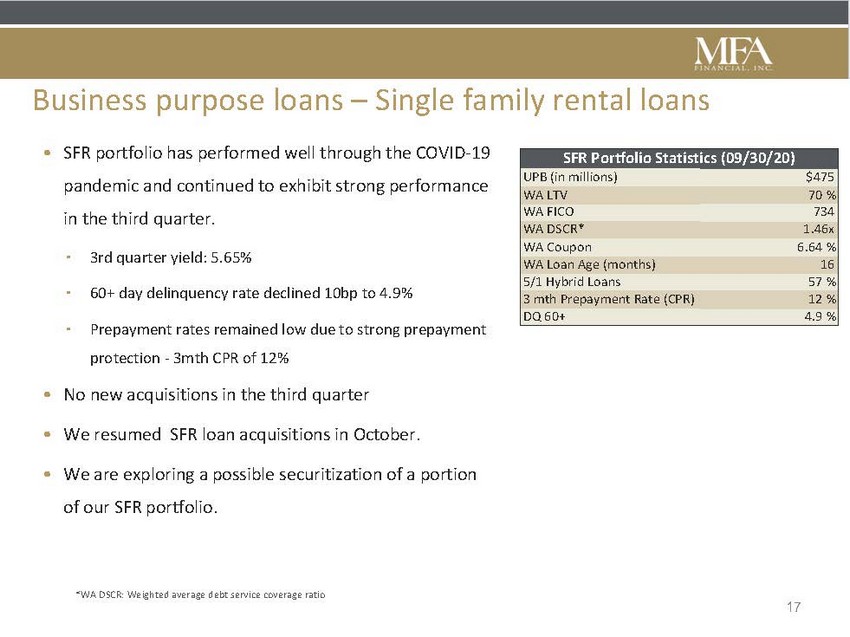 |
Business purpose loans – Single family rental loans SFR Portfolio Statistics (09/30/20) UPB (in millions)$475 WA LTV70 % WA FICO734 WA DSCR*1.46x WA Coupon6.64 % WA Loan Age (months)16 5/1 Hybrid Loans57 % 3 mth Prepayment Rate (CPR)12 % DQ 60+4.9 % ▪3rd quarter yield: 5.65% ▪60+ day delinquency rate declined 10bp to 4.9% ▪Prepayment rates remained low due to strong prepayment protection - 3mth CPR of 12% •No new acquisitions in the third quarter •We resumed SFR loan acquisitions in October. •We are exploring a possible securitization of a portion of our SFR portfolio. *WA DSCR: Weighted average debt service coverage ratio 17 |
 |
Summary • Third quarter results and book value primarily reflect the continued recovery in residential mortgage asset prices and a net reversal of CECL credit loss reserves. • Executing on strategies to optimize the “right side” of the balance sheet through securitization has generated substantial additional liquidity and should meaningfully lower our cost of funds, with the added benefit of being non-recourse financing without mark-to-market collateral maintenance. • Repayment of the $500 million secured term loan should significantly lower interest expense going forward. We expect to continue our relationship with Apollo and Athene which offers opportunities for our future investment and financing strategy. • For the short to medium-term, given current market uncertainties, we anticipate that normalization in our financing costs and operating expenses, and continued optimization of our liability and capital structure, should drive earnings and return on equity. 18 |
 |
Additional Information |
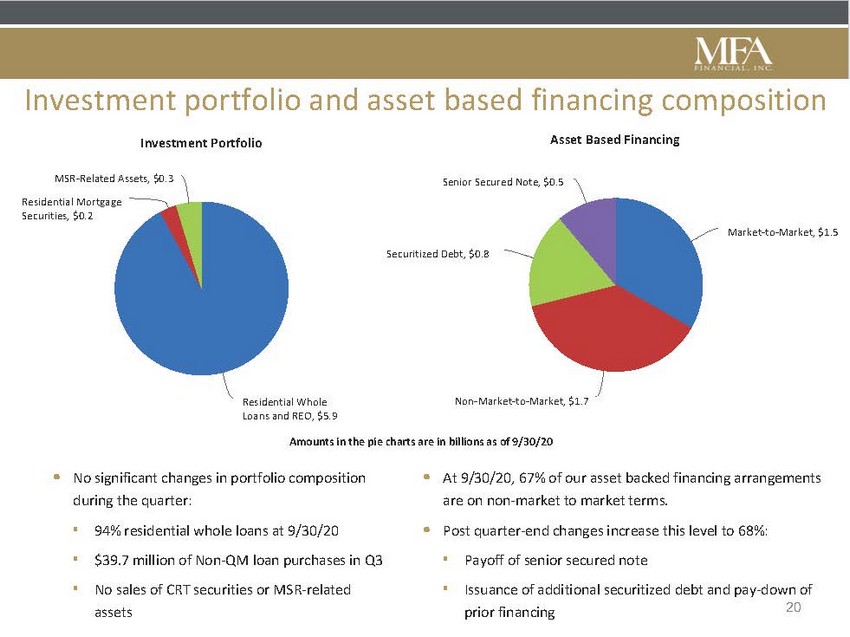 |
Investment portfolio and asset based financing composition Investment Portfolio Asset Based Financing MSR-Related Assets, $0.3 Residential Mortgage Securities, $0.2 Senior Secured Note, $0.5 Securitized Debt, $0.8 Market-to-Market, $1.5 Residential Whole Loans and REO, $5.9 Non-Market-to-Market, $1.7 Amounts in the pie charts are in billions as of 9/30/20 •No significant changes in portfolio composition during the quarter: ▪94% residential whole loans at 9/30/20 ▪$39.7 million of Non-QM loan purchases in Q3 ▪No sales of CRT securities or MSR-related assets •At 9/30/20, 67% of our asset backed financing arrangements are on non-market to market terms. •Post quarter-end changes increase this level to 68%: ▪Payoff of senior secured note ▪Issuance of additional securitized debt and pay-down of prior financing20 |
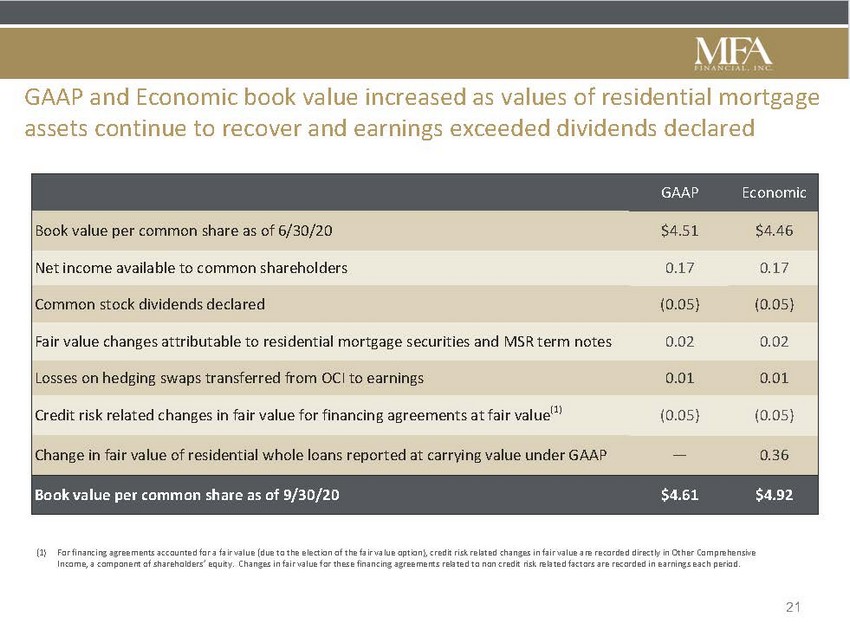 |
GAAP and Economic book value increased as values of residential mortgage assets continue to recover and earnings exceeded dividends declared GAAPEconomic Book value per common share as of 6/30/20$4.51$4.46 Net income available to common shareholders0.170.17 Common stock dividends declared(0.05)(0.05) Fair value changes attributable to residential mortgage securities and MSR term notes0.020.02 Losses on hedging swaps transferred from OCI to earnings0.010.01 Credit risk related changes in fair value for financing agreements at fair value(1) (0.05)(0.05) Change in fair value of residential whole loans reported at carrying value under GAAP—0.36 Book value per common share as of 9/30/20$4.61$4.92 (1) For financing agreements accounted for a fair value (due to the election of the fair value option), credit risk related changes in fair value are recorded directly in Other Comprehensive Income, a component of shareholders’ equity. Changes in fair value for these financing agreements related to non credit risk related factors are recorded in earnings each period. |
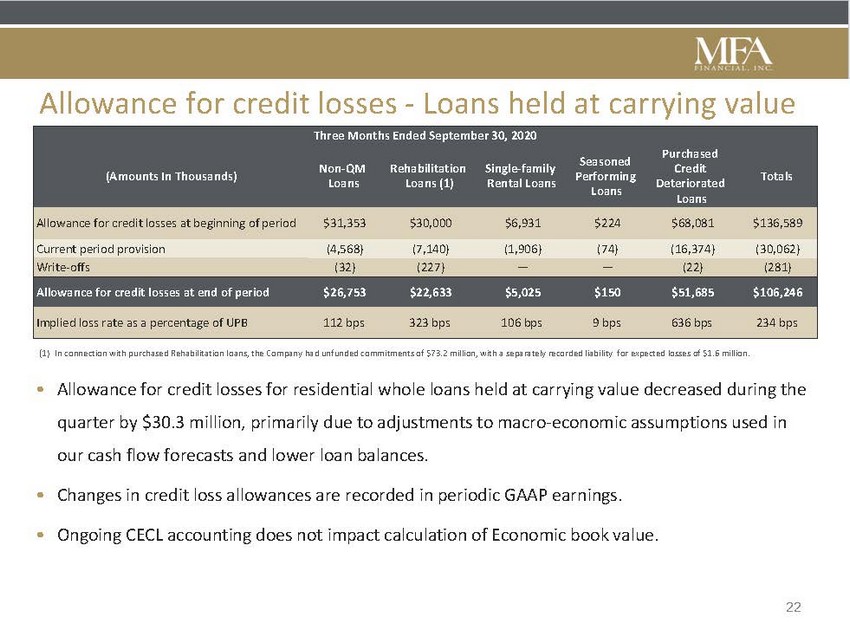 |
Allowance for credit losses - Loans held at carrying value Three Months Ended September 30, 2020 (Amounts In Thousands)Non-QM Loans Rehabilitation Loans (1) Single-family Rental Loans Seasoned Performing Loans Purchased Credit Deteriorated Loans Totals (1) In connection with purchased Rehabilitation loans, the Company had unfunded commitments of $73.2 million, with a separately recorded liability for expected losses of $1.6 million. •Allowance for credit losses for residential whole loans held at carrying value decreased during the quarter by $30.3 million, primarily due to adjustments to macro-economic assumptions used in our cash flow forecasts and lower loan balances. •Changes in credit loss allowances are recorded in periodic GAAP earnings. •Ongoing CECL accounting does not impact calculation of Economic book value. |
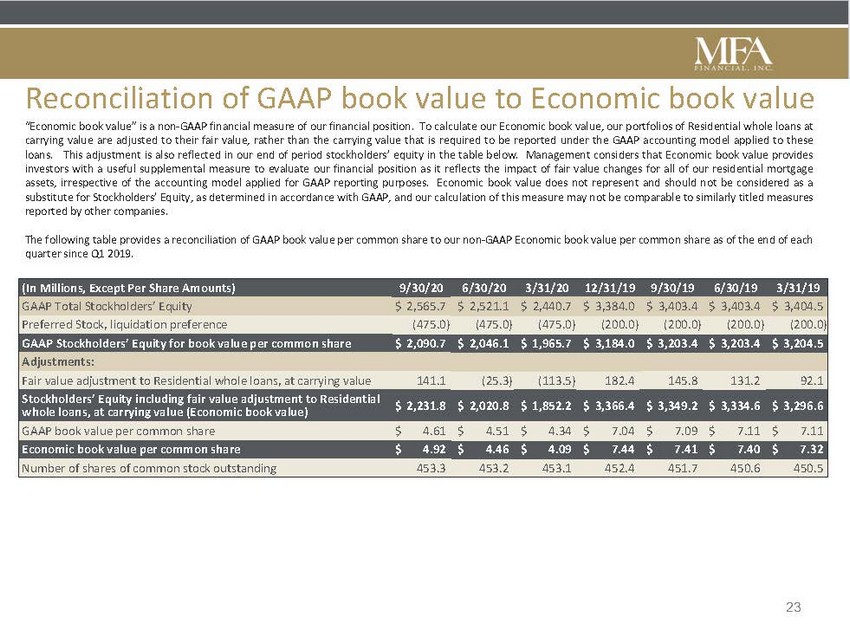 |
Reconciliation of GAAP book value to Economic book value “Economic book value” is a non-GAAP financial measure of our financial position. To calculate our Economic book value, our portfolios of Residential whole loans at carrying value are adjusted to their fair value, rather than the carrying value that is required to be reported under the GAAP accounting model applied to these loans. This adjustment is also reflected in our end of period stockholders’ equity in the table below. Management considers that Economic book value provides investors with a useful supplemental measure to evaluate our financial position as it reflects the impact of fair value changes for all of our residential mortgage assets, irrespective of the accounting model applied for GAAP reporting purposes. Economic book value does not represent and should not be considered as a substitute for Stockholders’ Equity, as determined in accordance with GAAP, and our calculation of this measure may not be comparable to similarly titled measures reported by other companies. The following table provides a reconciliation of GAAP book value per common share to our non-GAAP Economic book value per common share as of the end of each quarter since Q1 2019. (In Millions, Except Per Share Amounts)9/30/206/30/203/31/2012/31/199/30/196/30/193/31/19 GAAP Total Stockholders’ Equity$ 2,565.7 $ 2,521.1 $ 2,440.7 $ 3,384.0 $ 3,403.4 $ 3,403.4 $ 3,404.5 Preferred Stock, liquidation preference(475.0)(475.0)(475.0)(200.0)(200.0)(200.0)(200.0) GAAP Stockholders’ Equity for book value per common share$ 2,090.7 $ 2,046.1 $ 1,965.7 $ 3,184.0 $ 3,203.4 $ 3,203.4 $ 3,204.5 Adjustments: Fair value adjustment to Residential whole loans, at carrying value141.1(25.3)(113.5)182.4145.8131.292.1 Stockholders’ Equity including fair value adjustment to Residential whole loans, at carrying value (Economic book value)$ 2,231.8 $ 2,020.8 $ 1,852.2 $ 3,366.4 $ 3,349.2 $ 3,334.6 $ 3,296.6 GAAP book value per common share$4.61 $4.51 $4.34 $7.04 $7.09 $7.11 $7.11 Economic book value per common share$4.92 $4.46 $4.09 $7.44 $7.41 $7.40 $7.32 Number of shares of common stock outstanding453.3453.2453.1452.4451.7450.6450.5 |