Attached files
| file | filename |
|---|---|
| 8-K - 8-K - BP Midstream Partners LP | bpmp-20201105.htm |
| FOR IMMEDIATE RELEASE |  | ||||
BP Midstream Partners LP (NYSE: BPMP) Exhibit 99.1
BP MIDSTREAM PARTNERS
REPORTS THIRD QUARTER 2020 RESULTS
Focused on safe operations and delivering financial stability
•Another challenging quarter, dominated by continuing COVID-19 concerns and an elevated number of storms in the Gulf of Mexico
•Remaining focused on our two priorities - safe operations and financial strength of the Partnership
•Underlying business continues to perform well, underpinning our expectation to hold the current distribution level flat through the remainder of 2020, delivering unitholders full year distribution growth of 5%
•Agreed new three-year minimum volume commitment arrangements with BP relating to the onshore pipelines
•Full year 2020 Adjusted EBITDA guidance of $190-200 million and Cash available for distribution of $180-190 million; continuing to evaluate impacts of hurricanes in October - may result in low end, or slightly below, guided ranges
•Declared quarterly cash distribution of 34.75 cents per unit for the third quarter 2020, consistent with the distribution in the second quarter, as previously announced
HOUSTON, November 5, 2020 - BP Midstream Partners LP (“BPMP” or the “Partnership”) today reported financial results for the third quarter 2020.
Commenting on the results, CEO Rip Zinsmeister said: “We have navigated yet another challenging quarter, dominated by continuing COVID-19 concerns and an elevated number of storms in the Gulf of Mexico. While these storms impacted our third quarter results, our underlying business continues to perform well. It’s in times like these, that the strength of our high-quality portfolio is highlighted – demonstrating stability and resilience in a turbulent period. And our new three-year minimum volume commitment arrangements with BP underpin already stable, reliable cash flows - securing protection from significant disruptions and maintenance at the Whiting refinery and the onshore pipeline network.”
Liquidity position
The Partnership has maintained a strong balance sheet and liquidity position, and has a conservative financial framework.
At the end of the third quarter 2020, the Partnership had:
•Cash on hand of $123.8 million, an increase of $25.0 million since year end 2019.
•Receivables of $10.9 million, of which $10.7 million was with affiliates of our investment grade sponsor, BP.
•Long-term debt of $468.0 million, with an available revolver capacity of $132.0 million.
•No principal payments due until 2025.
•Gross debt to Adjusted EBITDA ratio of 2.5 times, well below the 3.5 times target.
•Distribution coverage ratio of 1.14 times, within our target range of 1.1 to 1.2 times.
Operational results
Total pipeline gross throughput was approximately 1.5 million barrels of oil equivalent per day in the third quarter, around 5% lower compared to the second quarter of 2020.
Gross throughput on our offshore pipelines was around 8% lower compared to the second quarter. The Atlantic hurricane season this year has been a historic season in terms of the number of named storms. Multiple weather events in the Gulf of Mexico during the quarter negatively impacted throughput on the offshore pipelines. The third quarter lower throughput was mainly driven by impacts from Hurricanes Laura and Sally. The estimated quarterly gross impact on throughput was in the range of 150-200 thousand barrels of oil equivalent per day. This was partially offset by higher production from
1
| FOR IMMEDIATE RELEASE | | ||||
some offshore platforms as production from new major projects and wells ramped up. Hurricanes Delta and Zeta in October are also expected to impact fourth quarter throughput on the offshore pipelines.
Gross throughput on the onshore pipelines was around 2% higher compared to the second quarter, primarily driven by higher throughput on River Rouge. This reflected recovery in refined products demand during the quarter, with demand returning to levels last seen in the first quarter of 2020 before the full effects of the pandemic on product demand were felt. This was partially offset by lower volume on BP2 due to refinery supply optimization by BP.
Financial results
GAAP Measures:
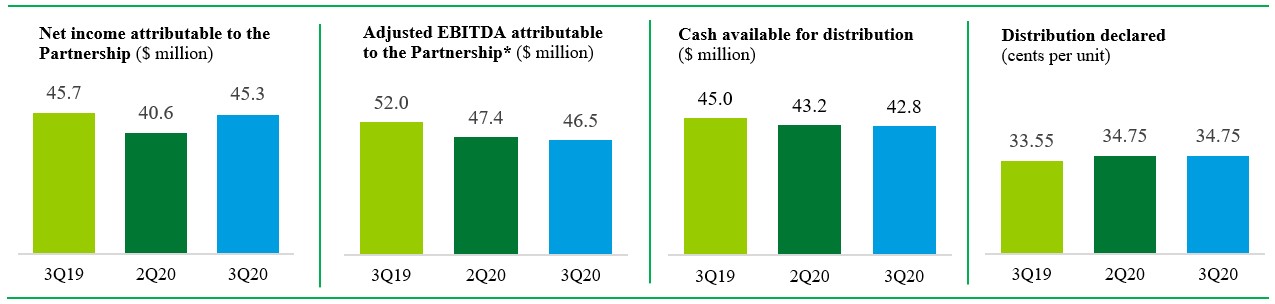
•Net income attributable to the Partnership in the third quarter was $45.3 million (or $0.42 per unit).
•Cash from operating activities was $48.8 million for the third quarter.
•Cash on hand was $123.8 million at September 30, 2020.
•Outstanding borrowings were $468.0 million under our unsecured term loan facility with an affiliate of BP, at September 30, 2020.
Non-GAAP Measures:
•Adjusted EBITDA* attributable to the Partnership in the third quarter was $46.5 million.
•Cash available for distribution* attributable to the Partnership generated in the third quarter was $42.8 million.
•Quarterly cash distribution: On October 15, 2020, the board of directors of the general partner of BPMP declared a quarterly cash distribution of $0.3475 per unit for the third quarter of 2020.
•Distribution coverage ratio was 1.14 times for the third quarter.
* Adjusted EBITDA and cash available for distribution are Non-GAAP supplemental financial measures. See reconciliation tables later in this press release.
Net income attributable to the Partnership
Net income attributable to the Partnership for the third quarter was $45.3 million, around 12% higher compared with the second quarter of 2020, and around 1% lower than the same period in 2019. Compared with the second quarter 2020, the result reflected:
•Higher throughput on River Rouge, as previously mentioned;
•Higher fixed loss allowance revenue in relation to BP2, due to a higher realized oil price in the quarter;
•Lower pipeline maintenance expenses; and
•Higher income from equity method investments, primarily due to demand recovery in the quarter favorably impacting the contribution from KM Phoenix joint venture.
These favorable impacts were partially offset by:
•The absence of first quarter 2020 deficiency revenue recognized in the second quarter.
2
| FOR IMMEDIATE RELEASE | | ||||
Adjusted EBITDA attributable to the Partnership
Adjusted EBITDA attributable to the Partnership for the third quarter was $46.5 million, 2% lower compared with the second quarter of 2020, and around 11% lower than the same period in 2019. Compared with the second quarter 2020, the lower result in the third quarter was primarily due to lower distributions from offshore pipeline joint ventures.
Cash available for distribution
Cash available for distribution for the third quarter was $42.8 million, only slightly lower compared with the second quarter of 2020 and around 5% lower than the same period in 2019.
Guidance
Full year 2020
| Distribution growth | 5% 1 | ||||
| Adjusted EBITDA attributable to the Partnership | $190-200 million 2 | ||||
| Cash available for distribution | $180-190 million 2 | ||||
1 Compared with full year 2019 distribution.
2 Excludes fourth quarter 2020 weather impacts.
We are still evaluating the impacts of Hurricanes Delta and Zeta in October 2020. Actual full year 2020 results may be right at the low end margin, or slightly below, our guided ranges.
Fourth quarter 2020
Pipeline gross throughput | Higher than 3Q20 | ||||
| Adjusted EBITDA attributable to the Partnership | Broadly flat with 3Q20 | ||||
| Cash available for distribution | Higher than 3Q20 | ||||
Throughput and Deficiency Agreements
On November 3, 2020, the Partnership entered into throughput and deficiency agreements with BP Products with respect to volumes transported on the following lines (i) BP2 crude oil pipeline system and related assets; (ii) River Rouge refined products pipeline system and related assets; and (iii) Diamondback diluent pipeline system and related assets (each a “Throughput and Deficiency Agreement” and collectively, the “Throughput and Deficiency Agreements”).
Pursuant to the Throughput and Deficiency Agreements, the Partnership will provide transportation services to BP Products, and BP Products will commit to pay the Partnership for minimum volumes of crude oil, refined products and diluent, regardless of whether such volumes are physically shipped by BP Products through the Partnership’s pipelines during the term of the agreements. BP Products will have the right to terminate these agreements if the Partnership fails to perform any of its material obligations and fails to correct such non-performance within specified periods, or in the event of a change of control of the Partnership’s general partner.
3
| FOR IMMEDIATE RELEASE | | ||||
Summary of new MVC arrangements
| Pipeline | Minimum volume commitments (thousands barrels per day) | ||||||||||
| Year | |||||||||||
| 2021 | 2022 | 2023 | |||||||||
| BP2 | 300 | 290 | 280 | ||||||||
Diamondback 1 | 33 | 33 | 33 | ||||||||
| River Rouge | 60 | 60 | 60 | ||||||||
1 One of the Diamondback MVC arrangements was automatically renewed in June 2020 at 23kbd for 1 year and the second MVC arrangement was agreed at 10kbd for 3 years commencing January 1, 2021. The total of 33kbd assumes renewal of the 23kbd contract for 2021 onwards.
Webcast and conference call
A webcast and conference call will be held at 9:00 a.m. CST on November 5, 2020, hosted by Robert Zinsmeister, chief executive officer; Craig Coburn, chief financial officer; and Brian Sullivan, vice president investor relations, to discuss BPMP’s performance in the third quarter 2020. Interested parties may listen to the presentation at www.bpmidstreampartners.com, by clicking on the “2020 Third Quarter Results Webcast” link, found in the "Events & Presentations" section under the Investor Relations menu option. A replay of the webcast will be available following the live event. The Partnership has also posted an investor presentation to its website. Information on the Partnership's website does not constitute a portion of this press release.
About BP Midstream Partners
BPMP is a fee-based, growth-oriented master limited partnership formed by BP Pipelines (North America), Inc. (“BP Pipelines”) to own, operate, develop and acquire pipelines and other midstream assets. BPMP’s assets consist of interests in entities that own crude oil, natural gas, refined products and diluent pipelines, and refined product terminals, serving as key infrastructure for BP and other customers to transport onshore crude oil production to BP’s Whiting Refinery and offshore crude oil and natural gas production to key refining markets and trading and distribution hubs. Certain of BPMP’s assets deliver refined products and diluent from the Whiting Refinery and other U.S. supply hubs to major demand centers.
For more information on BPMP and the assets owned by BPMP, please visit www.bpmidstreampartners.com.
Cautionary statement
Certain statements contained in this news release constitute “forward-looking statements” within the meaning of Section 27A of the Securities Act of 1933, as amended, and Section 21E of the Securities Exchange Act of 1934, as amended. Forward-looking statements include, among other things, statements concerning management’s expectations, beliefs, estimates, forecasts, projections and assumptions. You can identify our forward-looking statements by words such as “anticipate”, “believe”, “estimate”, “budget”, “continue”, “potential”, “guidance”, “effort”, “expect”, “forecast”, “goals”, “objectives”, “outlook”, “intend”, “plan”, “predict”, “project”, “seek”, “target”, “begin”, “could”, “may”, “should” or “would” or other similar expressions that convey the uncertainty of future events or outcomes. In accordance with “safe
harbor” provisions of the Private Securities Litigation Reform Act of 1995, these statements are accompanied by cautionary language identifying important factors, though not necessarily all such factors, which could cause future outcomes to differ materially from those set forth in forward-looking statements. In particular, expressed or implied statements concerning future growth, future actions, the continued effects of the global COVID-19 pandemic on demand, the effects of the continued volatility of commodity prices and the related macroeconomic and political environment, volumes, capital requirements, conditions or events, future operating results or the ability to generate sales, the potential exposure of the Partnership to market risks, and statements relating to the expected amount of cash available for distribution and level of distributions are forward-looking statements. These forward-looking statements represent BPMP’s expectations or beliefs concerning future events, and it is possible that the results described in this news release
4
| FOR IMMEDIATE RELEASE | | ||||
will not be achieved. These forward-looking statements are subject to risks, uncertainties and other factors, many of which are outside of BPMP’s control. These risks include, but are not limited to, the following:
•the decline in global crude oil demand and crude oil prices for an uncertain period of time that may lead to a significant reduction of domestic crude oil and natural gas production, which in turn could result in significant declines in the actual or expected volumes transported through our pipelines and/or the reduction of commercial opportunities that might otherwise be available to us.
•uncertainty regarding the easing of restrictions on various commercial and economic activities by applicable authorities, as well as the potential reinstatement of such restrictions, in response to the spread of COVID-19; such restrictions are designed to protect public health but also have the effect of significantly reducing demand for crude oil, natural gas, refined products and diluent.
•uncertainty regarding the future actions of foreign oil producers such as Saudi Arabia and Russia and the risk that they take actions that will prolong or exacerbate the current over-supply of crude oil.
•uncertainty regarding the timing, pace and extent of an economic recovery in the United States and elsewhere, which in turn will likely affect demand for crude oil and therefore the demand for the midstream services we provide and the commercial opportunities available to us.
•the effect of an overhang of significant amounts of crude oil inventory stored in the United States and elsewhere and the impact that such inventory overhang ultimately has on our customers' operations as well as the timing of a return to market conditions that support increased drilling and production activities in the United States.
•the effect of severe weather disruptions on our operations or expansion projects, including on our offshore pipelines in the Gulf of Mexico.
•our inability to perform our obligations under our contracts, whether due to non-performance by third parties, including our customers or counterparties, market constraints, third-party constraints, legal constraints (including governmental orders or guidance), or other factors;
•the impact of current and future laws, rulings, governmental regulations, accounting standards and statements, and related interpretations; and
•other factors and uncertainties inherent in our business, as discussed in the “Cautionary Note Regarding Forward-Looking Statements,” “Risk Factors” and other cautionary statements found in BPMP’s filings with the SEC, including the annual report on Form 10-K for the year ended December 31, 2019 filed with SEC on February 27, 2020 and the quarterly report on Form 10-Q for the period ended September 30, 2020 filed with SEC on November 5, 2020.
Any forward-looking statement speaks only as of the date on which it is made, and, except as required by law, BPMP does not undertake any obligation to update or revise any forward-looking statement, whether as a result of new information, future events or otherwise. New factors emerge from time to time, and it is not possible for BPMP to predict all such factors.
Non-GAAP financial measures
This press release includes the terms Adjusted EBITDA and cash available for distribution. Adjusted EBITDA and cash available for distribution are non-GAAP supplemental financial measures that management and external users of our consolidated financial statements, such as industry analysts, investors, lenders and rating agencies, may use to assess:
•our operating performance as compared to other publicly traded partnerships in the midstream energy industry, without regard to historical cost basis;
•the ability of our business to generate sufficient cash to support our decision to make distributions to our unitholders;
•our ability to incur and service debt and fund capital expenditures; and
•the viability of acquisitions and other capital expenditure projects and the returns on investment of various investment opportunities.
We believe that the presentation of Adjusted EBITDA and cash available for distribution provides useful information to investors in assessing our financial condition and results of operations. The GAAP measures most directly comparable to Adjusted EBITDA and cash available for distribution are net income and net cash provided by operating activities,
5
| FOR IMMEDIATE RELEASE | | ||||
respectively. Adjusted EBITDA and cash available for distribution should not be considered as an alternative to GAAP net income or net cash provided by operating activities.
Adjusted EBITDA and cash available for distribution have important limitations as analytical tools because they exclude some but not all items that affect net income and net cash provided by operating activities. You should not consider Adjusted EBITDA or cash available for distribution in isolation or as a substitute for analysis of our results as reported under GAAP. Additionally, because Adjusted EBITDA and cash available for distribution may be defined differently by other companies in our industry, our definitions of Adjusted EBITDA and cash available for distribution may not be comparable to similarly titled measures of other companies, thereby diminishing their utility.
References to Adjusted EBITDA refer to net income before net interest expense, income taxes, gain or loss from disposition of property, plant and equipment and depreciation and amortization, plus cash distributed to the Partnership from equity method investments for the applicable period, less income from equity method investments. We define Adjusted EBITDA attributable to the Partnership as Adjusted EBITDA less Adjusted EBITDA attributable to non-controlling interests. We define cash available for distribution as Adjusted EBITDA attributable to the Partnership plus net adjustments from volume deficiency agreements and maintenance capital recovery less maintenance capital expenditures, net interest paid/received, cash reserves, and income taxes paid. Cash available for distribution does not reflect changes in working capital balances.
The Partnership is unable to provide financial guidance for projected net income or net cash provided by operating activities without unreasonable effort, and, therefore, is unable to provide a reconciliation of its Adjusted EBITDA and cash available for distributions projections to net income or net cash provided by operating activities, the most comparable financial measures calculated in accordance with GAAP.
The Partnership has not included a reconciliation of projected cash available for distribution to the nearest GAAP financial measure for 2020 because it cannot do so without unreasonable effort and any attempt to do so would be inherently imprecise.
Further Information
BP Press Office: uspress@bp.com
BPMP Investor Relations: bpmpir@bp.com
6
| FOR IMMEDIATE RELEASE | | ||||
RESULTS OF OPERATIONS (UNAUDITED)
| Three Months Ended September 30, | Nine Months Ended September 30, | ||||||||||||||||||||||
| (in millions of dollars, unless otherwise indicated) | 2020 | 2019 | 2020 | 2019 | |||||||||||||||||||
| Revenue | $ | 33.7 | $ | 34.6 | $ | 95.9 | $ | 93.4 | |||||||||||||||
| Costs and expenses | |||||||||||||||||||||||
| Operating expenses | 4.9 | 5.3 | 14.5 | 14.9 | |||||||||||||||||||
| Maintenance expenses | 0.4 | 0.3 | 2.2 | 1.3 | |||||||||||||||||||
| General and administrative | 3.9 | 4.1 | 13.0 | 12.6 | |||||||||||||||||||
| Depreciation | 0.7 | 0.7 | 2.0 | 2.0 | |||||||||||||||||||
| Impairment and other, net | — | — | — | 1.0 | |||||||||||||||||||
| Property and other taxes | 0.2 | 0.1 | 0.5 | 0.4 | |||||||||||||||||||
| Total costs and expenses | 10.1 | 10.5 | 32.2 | 32.2 | |||||||||||||||||||
| Operating income | 23.6 | 24.1 | 63.7 | 61.2 | |||||||||||||||||||
| Income from equity method investments | 27.6 | 30.1 | 85.7 | 83.3 | |||||||||||||||||||
| Interest expense, net | 1.5 | 3.8 | 6.8 | 11.3 | |||||||||||||||||||
| Net income | 49.7 | 50.4 | 142.6 | 133.2 | |||||||||||||||||||
| Less: Net income attributable to non-controlling interests | 4.4 | 4.7 | 15.0 | 13.0 | |||||||||||||||||||
| Net income attributable to the Partnership | $ | 45.3 | $ | 45.7 | $ | 127.6 | $ | 120.2 | |||||||||||||||
| Net income attributable to the Partnership per limited partner unit - basic and diluted (in dollars): | |||||||||||||||||||||||
| Common units | $ | 0.42 | $ | 0.43 | $ | 1.19 | $ | 1.13 | |||||||||||||||
| Subordinated units | $ | 0.42 | $ | 0.43 | $ | 1.19 | $ | 1.13 | |||||||||||||||
| Distributions declared per limited partner unit (in dollars): | |||||||||||||||||||||||
| Common units | $ | 0.3475 | $ | 0.3355 | $ | 1.0425 | $ | 0.9718 | |||||||||||||||
| Subordinated units | $ | 0.3475 | $ | 0.3355 | $ | 1.0425 | $ | 0.9718 | |||||||||||||||
| Weighted average number of limited partner units outstanding - basic and diluted (in millions): | |||||||||||||||||||||||
| Common units – public | 47.8 | 47.8 | 47.8 | 47.8 | |||||||||||||||||||
| Common units – BP Holdco | 4.6 | 4.6 | 4.6 | 4.6 | |||||||||||||||||||
| Subordinated units – BP Holdco | 52.4 | 52.4 | 52.4 | 52.4 | |||||||||||||||||||
7
| FOR IMMEDIATE RELEASE | | ||||
ADDITIONAL FINANCIAL DATA
| (in millions of dollars, except per-unit data and ratio data) | Three Months Ended September 30, 2020 | Nine Months Ended September 30, 2020 | |||||||||
| Quarterly distribution declared per unit (in dollars) | $ | 0.3475 | $ | 1.0425 | |||||||
| Adjusted EBITDA attributable to the Partnership | 46.5 | 141.7 | |||||||||
| Cash available for distribution attributable to the Partnership | 42.8 | 130.1 | |||||||||
| Distribution declared: | |||||||||||
| Limited partner units – public | 16.6 | 49.8 | |||||||||
| Limited partner units – BP Holdco | 19.8 | 59.4 | |||||||||
| General partner | 1.2 | 3.6 | |||||||||
| Total distribution declared | 37.6 | 112.8 | |||||||||
Coverage ratio(1) | 1.14 | 1.15 | |||||||||
(1)Coverage ratio is equal to Cash available for distribution attributable to the Partnership divided by Total distribution declared.
| September 30, 2020 | |||||
| Gross debt | $ | 468.0 | |||
Annualized Adjusted EBITDA attributable to the Partnership(1) | 186.0 | ||||
| Gross debt to Adjusted EBITDA ratio | 2.5 | ||||
(1)Calculated by multiplying Adjusted EBITDA for the quarter by 4.
8
| FOR IMMEDIATE RELEASE | | ||||
RECONCILIATION OF ADJUSTED EBITDA AND CASH AVAILABLE FOR DISTRIBUTION TO NET INCOME
| Three Months Ended September 30, | Nine Months Ended September 30, | ||||||||||||||||||||||
| (in millions of dollars) | 2020 | 2019 | 2020 | 2019 | |||||||||||||||||||
| Net income | $ | 49.7 | $ | 50.4 | $ | 142.6 | $ | 133.2 | |||||||||||||||
| Add: | |||||||||||||||||||||||
| Depreciation | 0.7 | 0.7 | 2.0 | 2.0 | |||||||||||||||||||
| Interest expense, net | 1.5 | 3.8 | 6.8 | 11.3 | |||||||||||||||||||
| Cash distribution received from equity method investments | 27.2 | 32.5 | 93.2 | 94.8 | |||||||||||||||||||
| Less: | |||||||||||||||||||||||
| Income from equity method investments | 27.6 | 30.1 | 85.7 | 83.3 | |||||||||||||||||||
| Adjusted EBITDA | 51.5 | 57.3 | 158.9 | 158.0 | |||||||||||||||||||
| Less: | |||||||||||||||||||||||
| Adjusted EBITDA attributable to non-controlling interests | 5.0 | 5.3 | 17.2 | 15.9 | |||||||||||||||||||
| Adjusted EBITDA attributable to the Partnership | 46.5 | 52.0 | 141.7 | 142.1 | |||||||||||||||||||
| Add: | |||||||||||||||||||||||
| Net adjustments from volume deficiency agreements | (2.1) | (3.1) | (3.7) | (2.8) | |||||||||||||||||||
Maintenance capital recovery(1) | 0.1 | — | 0.7 | — | |||||||||||||||||||
| Less: | |||||||||||||||||||||||
| Net interest paid/(received) | 2.1 | (0.1) | 10.1 | 11.3 | |||||||||||||||||||
| Maintenance capital expenditures | 0.3 | 0.1 | 1.5 | 0.4 | |||||||||||||||||||
Cash reserves(2) | (0.7) | 3.9 | (3.0) | — | |||||||||||||||||||
| Cash available for distribution attributable to the Partnership | $ | 42.8 | $ | 45.0 | $ | 130.1 | $ | 127.6 | |||||||||||||||
(1)Relates to the portion of maintenance capital for the Griffith Station Incident reimbursable by insurance.
(2)Reflects cash reserved due to timing of interest payments(s).
9
| FOR IMMEDIATE RELEASE | | ||||
RECONCILIATION OF ADJUSTED EBITDA AND CASH AVAILABLE FOR DISTRIBUTION TO NET CASH PROVIDED BY OPERATING ACTIVITIES
| Three Months Ended September 30, | Nine Months Ended September 30, | ||||||||||||||||||||||
| (in millions of dollars) | 2020 | 2019 | 2020 | 2019 | |||||||||||||||||||
| Net cash provided by operating activities | $ | 48.8 | $ | 55.0 | $ | 148.3 | $ | 142.3 | |||||||||||||||
| Add: | |||||||||||||||||||||||
| Interest expense, net | 1.5 | 3.8 | 6.8 | 11.3 | |||||||||||||||||||
| Distributions in excess of earnings from equity method investments | 2.1 | 1.7 | 7.4 | 8.3 | |||||||||||||||||||
| Less: | |||||||||||||||||||||||
| Change in other assets and liabilities | 0.8 | 3.1 | 3.4 | 2.7 | |||||||||||||||||||
| Non-cash adjustments | 0.1 | 0.1 | 0.2 | 0.2 | |||||||||||||||||||
| Impairment and other, net* | — | — | — | 1.0 | |||||||||||||||||||
| Adjusted EBITDA | 51.5 | 57.3 | 158.9 | 158.0 | |||||||||||||||||||
| Less: | |||||||||||||||||||||||
| Adjusted EBITDA attributable to non-controlling interests | 5.0 | 5.3 | 17.2 | 15.9 | |||||||||||||||||||
| Adjusted EBITDA attributable to the Partnership | 46.5 | 52.0 | 141.7 | 142.1 | |||||||||||||||||||
| Add: | |||||||||||||||||||||||
| Net adjustments from volume deficiency agreements | (2.1) | (3.1) | (3.7) | (2.8) | |||||||||||||||||||
Maintenance capital recovery(1) | 0.1 | — | 0.7 | — | |||||||||||||||||||
| Less: | |||||||||||||||||||||||
| Net interest paid/(received) | 2.1 | (0.1) | 10.1 | 11.3 | |||||||||||||||||||
| Maintenance capital expenditures | 0.3 | 0.1 | 1.5 | 0.4 | |||||||||||||||||||
Cash reserves(2) | (0.7) | 3.9 | (3.0) | — | |||||||||||||||||||
| Cash available for distribution attributable to the Partnership | $ | 42.8 | $ | 45.0 | $ | 130.1 | $ | 127.6 | |||||||||||||||
*Includes $3.1 million of costs related to the Griffith Station Incident (impairment charge of $2.3 million and $0.8 million for the response expense), net of $(2.1)
million in offsetting insurance receivable. The net charge of $1.0 million reflects our insurance deductible.
(1)Relates to the portion of maintenance capital for the Griffith Station Incident reimbursable by insurance.
(2)Reflects cash reserved due to timing of interest payment(s).
10
| FOR IMMEDIATE RELEASE | | ||||
SELECTED OPERATING DATA
| Three Months Ended September 30, | Nine Months Ended September 30, | ||||||||||||||||||||||
Pipeline throughput (thousands of barrels per day)(1) | 2020 | 2019 | 2020 | 2019 | |||||||||||||||||||
| BP2 | 253 | 316 | 266 | 299 | |||||||||||||||||||
| Diamondback | 59 | 59 | 67 | 65 | |||||||||||||||||||
| River Rouge | 75 | 72 | 69 | 71 | |||||||||||||||||||
| Total Wholly Owned Assets | 387 | 447 | 402 | 435 | |||||||||||||||||||
| Mars | 479 | 519 | 506 | 548 | |||||||||||||||||||
| Caesar | 143 | 176 | 162 | 198 | |||||||||||||||||||
Cleopatra(2) | 15 | 21 | 18 | 24 | |||||||||||||||||||
| Proteus | 200 | 191 | 211 | 158 | |||||||||||||||||||
| Endymion | 200 | 191 | 211 | 158 | |||||||||||||||||||
| Mardi Gras Joint Ventures | 558 | 579 | 602 | 538 | |||||||||||||||||||
| Ursa | 57 | 104 | 80 | 112 | |||||||||||||||||||
Average revenue per barrel ($ per barrel)(3) | |||||||||||||||||||||||
| Total Wholly Owned Assets | $ | 0.80 | $ | 0.78 | $ | 0.77 | $ | 0.77 | |||||||||||||||
| Mars | 1.17 | 1.36 | 1.31 | 1.24 | |||||||||||||||||||
| Mardi Gras Joint Ventures | 0.59 | 0.63 | 0.59 | 0.67 | |||||||||||||||||||
| Ursa | 0.93 | 0.89 | 0.90 | 0.87 | |||||||||||||||||||
(1)Pipeline throughput is defined as the volume of delivered barrels.
(2)Natural gas is converted to oil equivalent at 5.8 million cubic feet per one thousand barrels.
(3)Based on reported revenues from transportation and allowance oil divided by delivered barrels over the same time period.
11
| FOR IMMEDIATE RELEASE | | ||||
CAPITAL EXPENDITURES(1) (UNAUDITED)
| Three Months Ended September 30, | Nine Months Ended September 30, | ||||||||||||||||||||||
| (in millions of dollars) | 2020 | 2019 | 2020 | 2019 | |||||||||||||||||||
| Cash spent on expansion capital expenditures | $ | 0.4 | $ | — | $ | 0.5 | $ | — | |||||||||||||||
| Cash spent on maintenance capital expenditures | 0.3 | 0.1 | 1.5 | 0.4 | |||||||||||||||||||
| Increase/(decrease) in accrued capital expenditures | 1.0 | 0.2 | 1.3 | 0.2 | |||||||||||||||||||
| Total capital expenditures incurred | $ | 1.7 | $ | 0.3 | $ | 3.3 | $ | 0.6 | |||||||||||||||
(1)Capital expenditures presented above are related to the Wholly Owned Assets.
SELECTED BALANCE SHEET DATA (UNAUDITED)
| (in millions of dollars) | September 30, 2020 | December 31, 2019 | |||||||||
| Cash and cash equivalents | $ | 123.8 | $ | 98.8 | |||||||
| Property, plant and equipment, net | 64.0 | 62.7 | |||||||||
| Total assets | 733.6 | 722.1 | |||||||||
| Long-term debt | 468.0 | 468.0 | |||||||||
| Total equity | 253.0 | 240.2 | |||||||||
November 5, 2020
The information in this release reflects the unaudited consolidated financial position and results of BP Midstream Partners LP.
12