Attached files
| file | filename |
|---|---|
| EX-99.1 - EX-99.1 - TPG RE Finance Trust, Inc. | d69526dex991.htm |
| 8-K - 8-K - TPG RE Finance Trust, Inc. | d69526d8k.htm |

November 4, 2020 Third Quarter 2020 Supplemental Information Exhibit 99.2
Forward-Looking Statements and Other Disclosures The information contained in this earnings presentation contains “forward‐looking statements” within the meaning of Section 27A of the Securities Act of 1933, as amended, and Section 21E of the Securities Exchange Act of 1934, as amended. These forward‐looking statements are subject to various risks and uncertainties, including, without limitation, statements relating to the performance of the investments of TPG RE Finance Trust, Inc. (the “Company” or “TRTX”); the ultimate geographic spread, severity and duration of pandemics such as the recent outbreak of novel coronavirus (“COVID-19”), actions that may be taken by governmental authorities to contain or address the impact of such pandemics, and the potential negative impacts of such pandemics on the global economy and the Company’s financial condition and results of operations; the Company’s ability to originate loans that are in the pipeline and under evaluation by the Company; and financing needs and arrangements. Forward‐looking statements are generally identifiable by use of forward‐looking terminology such as “may,” “will,” “should,” “potential,” “intend,” “expect,” “endeavor,” “seek,” “anticipate,” “estimate,” “believe,” “could,” “project,” “predict,” “continue” or other similar words or expressions. Forward‐looking statements are based on certain assumptions, discuss future expectations, describe existing or future plans and strategies, contain projections of results of operations, liquidity and/or financial condition or state other forward‐looking information. Statements, among others, relating to the continuing impact of COVID-19 on the Company’s business, financial condition and results of operations and the Company’s ability to generate future growth and deliver returns are forward-looking statements, and the Company cannot assure you that TRTX will achieve such results. The ability of TRTX to predict future events or conditions or their impact or the actual effect of existing or future plans or strategies is inherently uncertain. Although the Company believes that such forward‐looking statements are based on reasonable assumptions, actual results and performance in the future could differ materially from those set forth in or implied by such forward‐looking statements. You are cautioned not to place undue reliance on these forward‐looking statements, which reflect the Company’s views only as of the date of this earnings presentation. Except as required by law, neither the Company nor any other person assumes responsibility for the accuracy and completeness of the forward‐looking statements appearing in this earnings presentation. The Company does not undertake any obligation to update any forward-looking statements contained in this earnings presentation as a result of new information, future events or otherwise. Past performance is not indicative nor a guarantee of future returns. Yield data are shown for illustrative purposes only and have limitations when used for comparison or for other purposes due to, among other matters, volatility, credit or other factors.
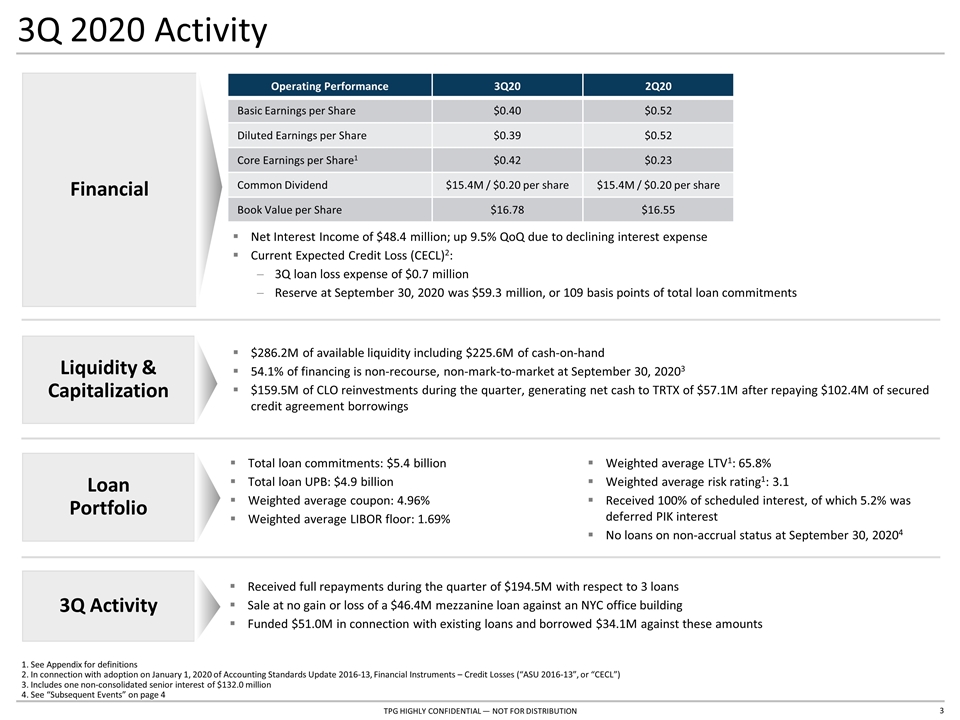
3Q 2020 Activity Financial 3Q Activity Loan Portfolio Liquidity & Capitalization 1. See Appendix for definitions 2. In connection with adoption on January 1, 2020 of Accounting Standards Update 2016-13, Financial Instruments – Credit Losses (“ASU 2016-13”, or “CECL”) 3. Includes one non-consolidated senior interest of $132.0 million 4. See “Subsequent Events” on page 4 $286.2M of available liquidity including $225.6M of cash-on-hand 54.1% of financing is non-recourse, non-mark-to-market at September 30, 20203 $159.5M of CLO reinvestments during the quarter, generating net cash to TRTX of $57.1M after repaying $102.4M of secured credit agreement borrowings Received full repayments during the quarter of $194.5M with respect to 3 loans Sale at no gain or loss of a $46.4M mezzanine loan against an NYC office building Funded $51.0M in connection with existing loans and borrowed $34.1M against these amounts Total loan commitments: $5.4 billion Total loan UPB: $4.9 billion Weighted average coupon: 4.96% Weighted average LIBOR floor: 1.69% Weighted average LTV1: 65.8% Weighted average risk rating1: 3.1 Received 100% of scheduled interest, of which 5.2% was deferred PIK interest No loans on non-accrual status at September 30, 20204 Net Interest Income of $48.4 million; up 9.5% QoQ due to declining interest expense Current Expected Credit Loss (CECL)2: 3Q loan loss expense of $0.7 million Reserve at September 30, 2020 was $59.3 million, or 109 basis points of total loan commitments Operating Performance 3Q20 2Q20 Basic Earnings per Share $0.40 $0.52 Diluted Earnings per Share $0.39 $0.52 Core Earnings per Share1 $0.42 $0.23 Common Dividend $15.4M / $0.20 per share $15.4M / $0.20 per share Book Value per Share $16.78 $16.55
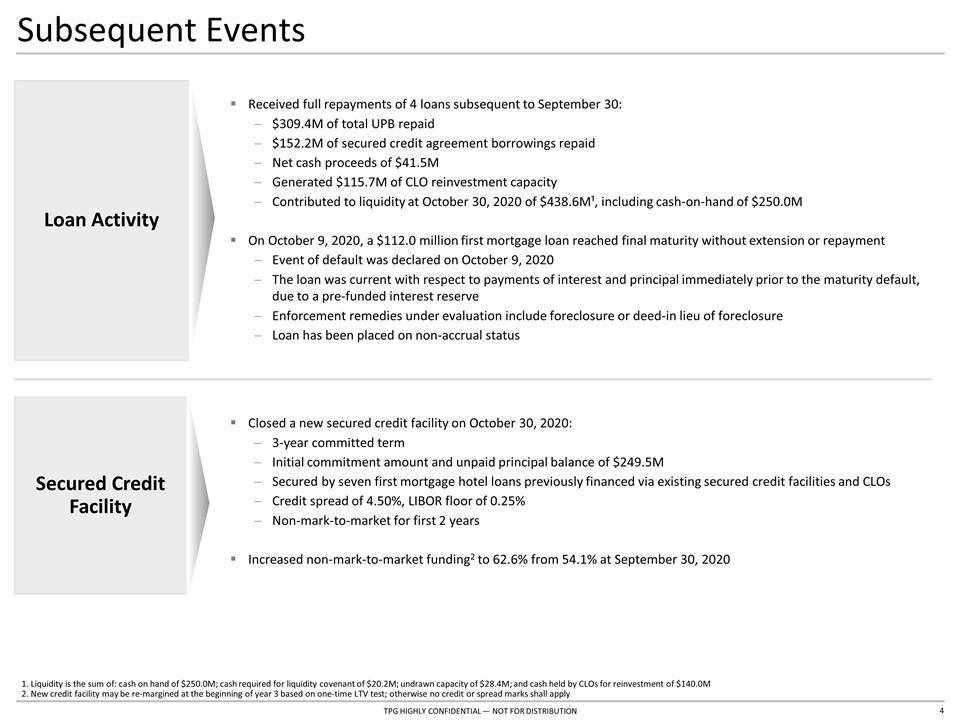
Subsequent Events Loan Activity Secured Credit Facility Received full repayments of 4 loans subsequent to September 30: $309.4M of total UPB repaid $152.2M of secured credit agreement borrowings repaid Net cash proceeds of $41.5M Generated $115.7M of CLO reinvestment capacity Contributed to liquidity at October 30, 2020 of $438.6M¹, including cash-on-hand of $250.0M On October 9, 2020, a $112.0 million first mortgage loan reached final maturity without extension or repayment Event of default was declared on October 9, 2020 The loan was current with respect to payments of interest and principal immediately prior to the maturity default, due to a pre-funded interest reserve Enforcement remedies under evaluation include foreclosure or deed-in lieu of foreclosure Loan has been placed on non-accrual status Closed a new secured credit facility on October 30, 2020: 3-year committed term Initial commitment amount and unpaid principal balance of $249.5M Secured by seven first mortgage hotel loans previously financed via existing secured credit facilities and CLOs Credit spread of 4.50%, LIBOR floor of 0.25% Non-mark-to-market for first 2 years Increased non-mark-to-market funding2 to 62.6% from 54.1% at September 30, 2020 1. Liquidity is the sum of: cash on hand of $250.0M; cash required for liquidity covenant of $20.2M; undrawn capacity of $28.4M; and cash held by CLOs for reinvestment of $140.0M 2. New credit facility may be re-margined at the beginning of year 3 based on one-time LTV test; otherwise no credit or spread marks shall apply
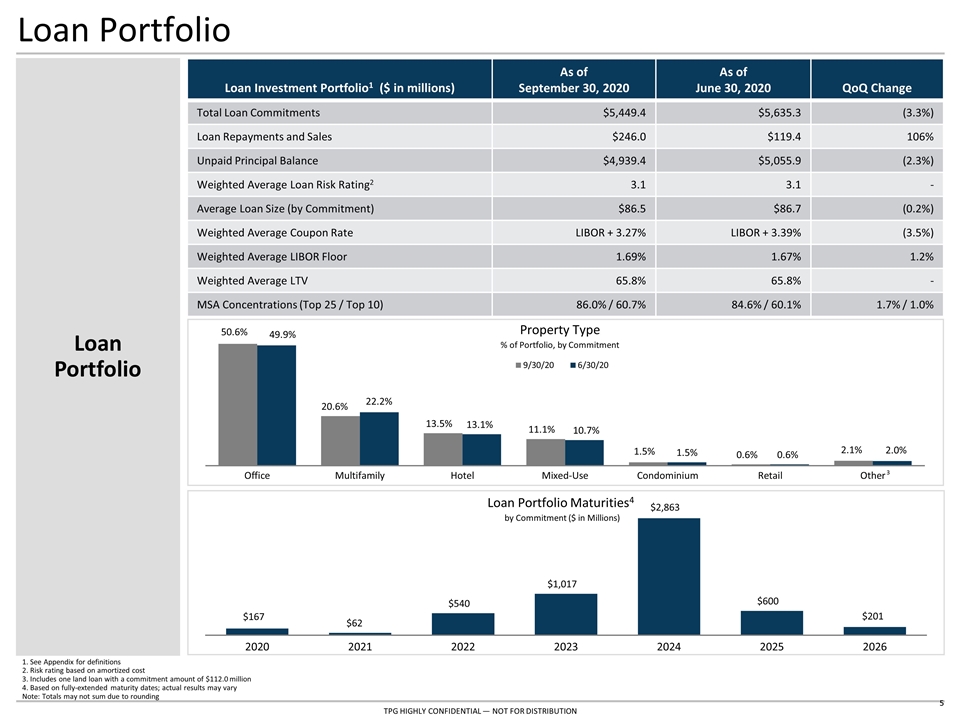
Loan Portfolio Loan Portfolio 1. See Appendix for definitions 2. Risk rating based on amortized cost 3. Includes one land loan with a commitment amount of $112.0 million 4. Based on fully-extended maturity dates; actual results may vary Note: Totals may not sum due to rounding Loan Investment Portfolio1 ($ in millions) As of September 30, 2020 As of June 30, 2020 QoQ Change Total Loan Commitments $5,449.4 $5,635.3 (3.3%) Loan Repayments and Sales $246.0 $119.4 106% Unpaid Principal Balance $4,939.4 $5,055.9 (2.3%) Weighted Average Loan Risk Rating2 3.1 3.1 - Average Loan Size (by Commitment) $86.5 $86.7 (0.2%) Weighted Average Coupon Rate LIBOR + 3.27% LIBOR + 3.39% (3.5%) Weighted Average LIBOR Floor 1.69% 1.67% 1.2% Weighted Average LTV 65.8% 65.8% - MSA Concentrations (Top 25 / Top 10) 86.0% / 60.7% 84.6% / 60.1% 1.7% / 1.0% Property Type % of Portfolio, by Commitment Loan Portfolio Maturities4 by Commitment ($ in Millions) 3
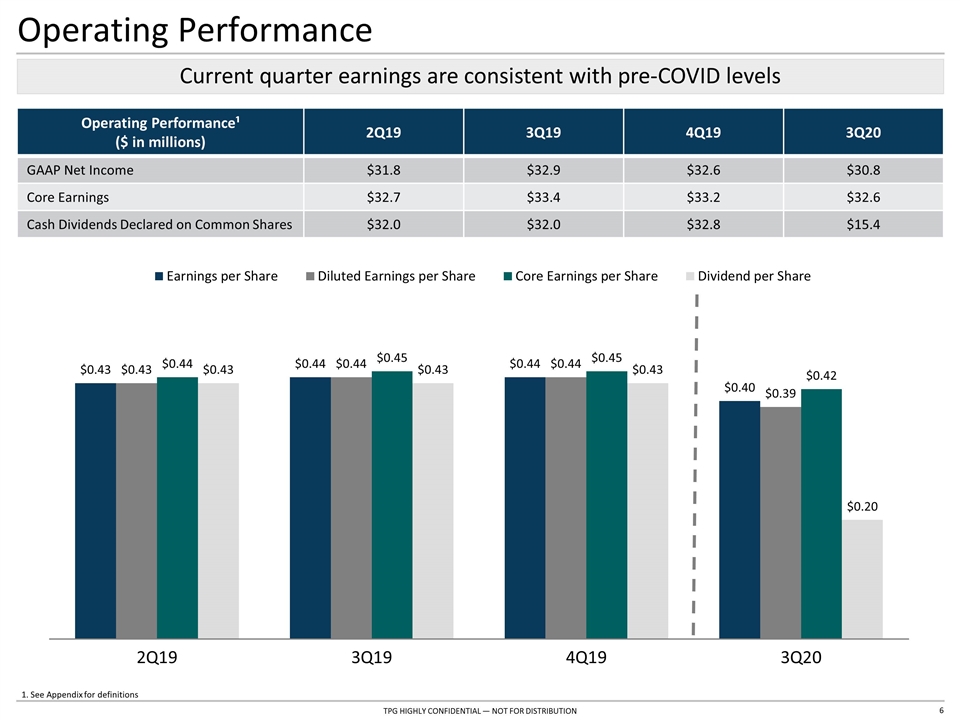
Current quarter earnings are consistent with pre-COVID levels Operating Performance Operating Performance¹ ($ in millions) 2Q19 3Q19 4Q19 3Q20 GAAP Net Income $31.8 $32.9 $32.6 $30.8 Core Earnings $32.7 $33.4 $33.2 $32.6 Cash Dividends Declared on Common Shares $32.0 $32.0 $32.8 $15.4 1. See Appendix for definitions
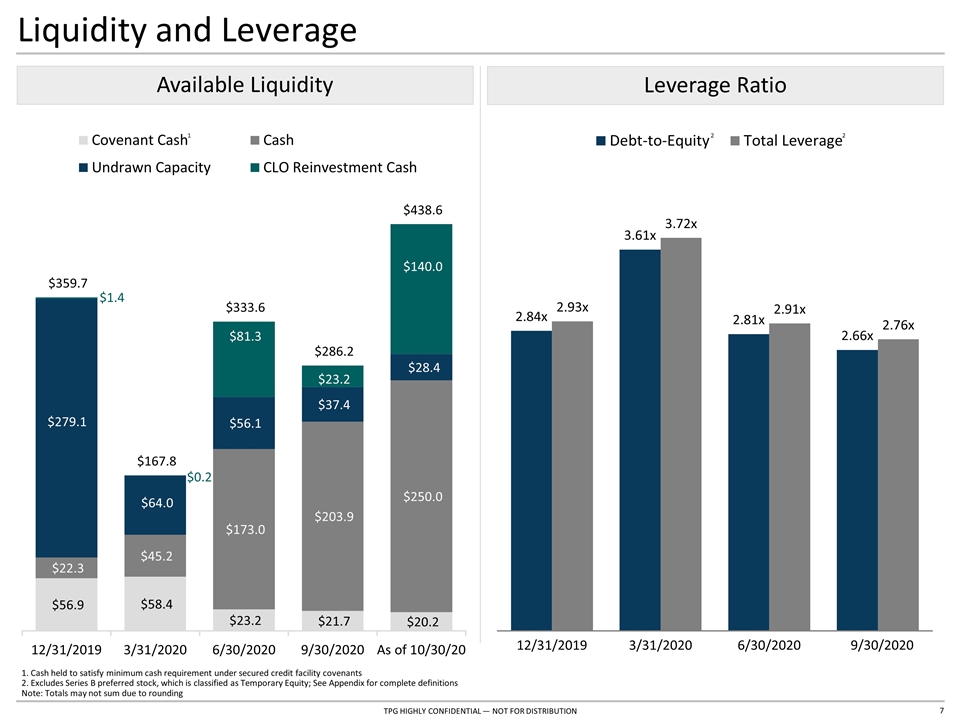
Liquidity and Leverage Available Liquidity Leverage Ratio 1. Cash held to satisfy minimum cash requirement under secured credit facility covenants 2. Excludes Series B preferred stock, which is classified as Temporary Equity; See Appendix for complete definitions Note: Totals may not sum due to rounding 2 9/30/2020 2 1
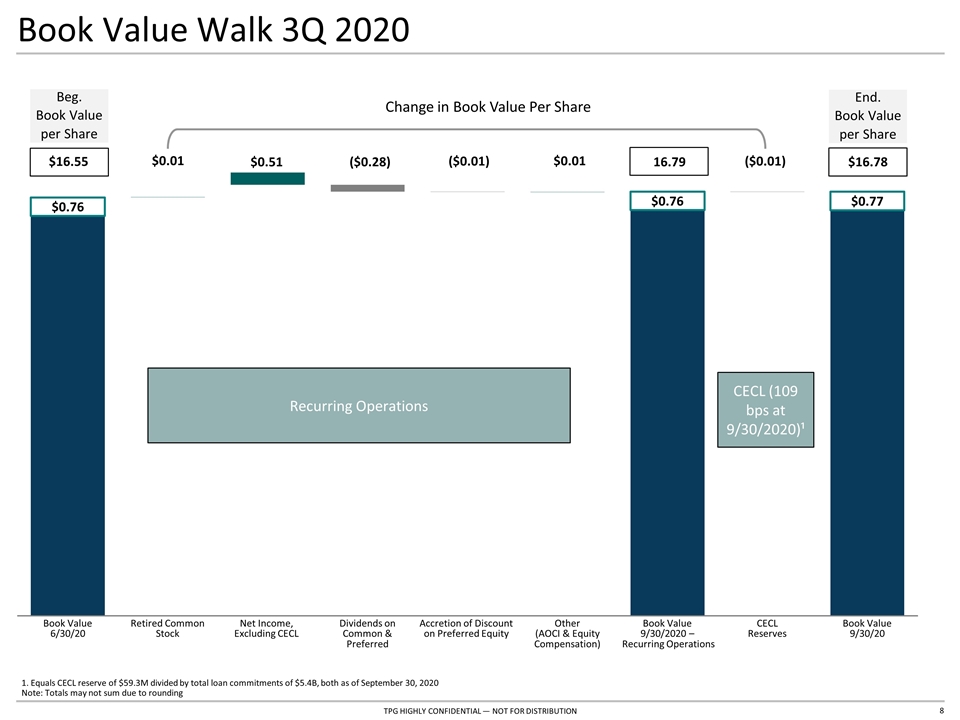
Book Value Walk 3Q 2020 $16.78 1. Equals CECL reserve of $59.3M divided by total loan commitments of $5.4B, both as of September 30, 2020 Note: Totals may not sum due to rounding $16.55 $0.01 $0.51 ($0.28) $0.01 ($0.01) 16.79 Change in Book Value Per Share Beg. Book Value per Share End. Book Value per Share ($0.01) CECL (109 bps at 9/30/2020)¹ Recurring Operations
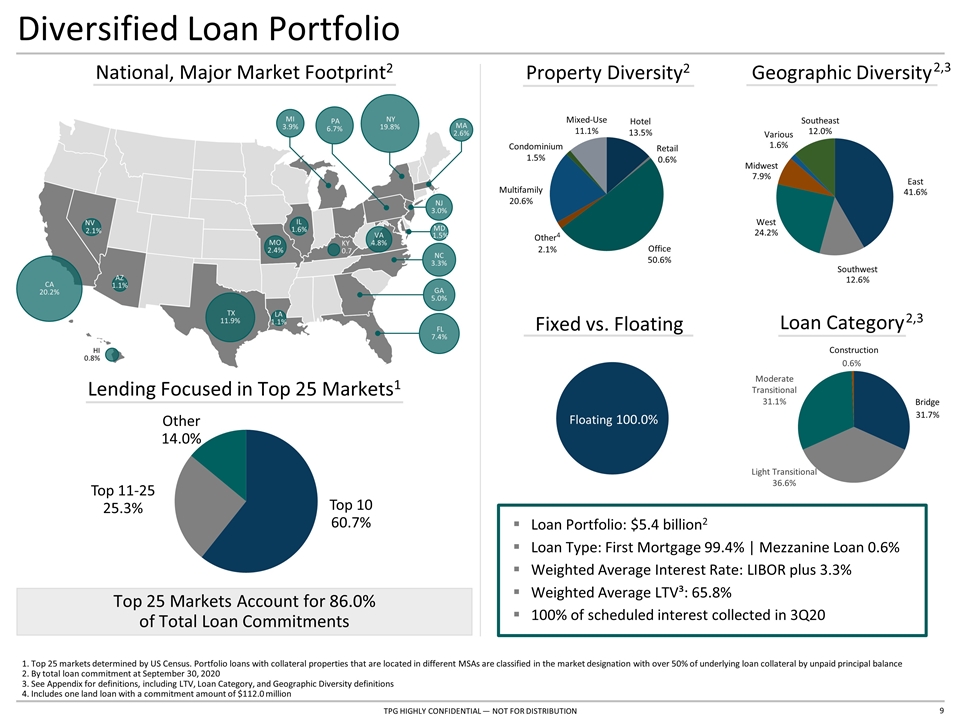
National, Major Market Footprint2 Lending Focused in Top 25 Markets1 Top 25 Markets Account for 86.0% of Total Loan Commitments Loan Category Geographic Diversity Diversified Loan Portfolio Property Diversity2 1. Top 25 markets determined by US Census. Portfolio loans with collateral properties that are located in different MSAs are classified in the market designation with over 50% of underlying loan collateral by unpaid principal balance 2. By total loan commitment at September 30, 2020 3. See Appendix for definitions, including LTV, Loan Category, and Geographic Diversity definitions 4. Includes one land loan with a commitment amount of $112.0 million 2,3 Loan Portfolio: $5.4 billion2 Loan Type: First Mortgage 99.4% | Mezzanine Loan 0.6% Weighted Average Interest Rate: LIBOR plus 3.3% Weighted Average LTV³: 65.8% 100% of scheduled interest collected in 3Q20 2,3 Fixed vs. Floating Data at 9/30/20 CA 20.2% NY 19.8% TX 11.9% PA 6.7% FL 7.4% NC 3.3% GA 5.0% MI 3.9% NJ 3.0% VA 4.8% MA 2.6% MO 2.4% IL 1.6% AZ 1.1% LA 1.1% HI 0.8% KY 0.7 NV 2.1% MD 1.5% Construction Bridge 31.7%
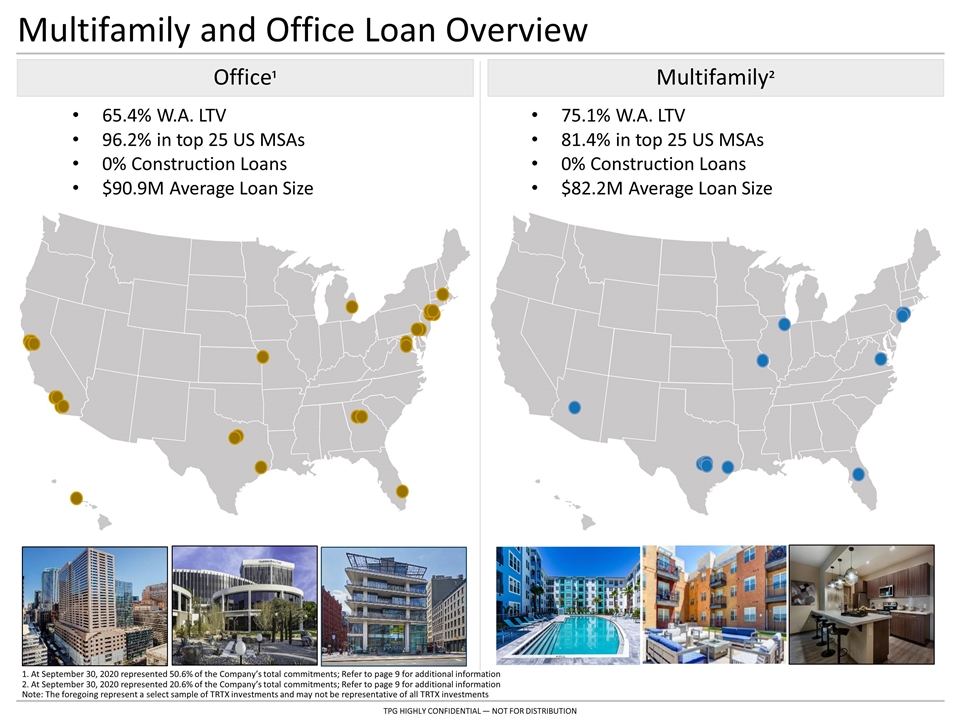
Multifamily and Office Loan Overview Office¹ 65.4% W.A. LTV 96.2% in top 25 US MSAs 0% Construction Loans $90.9M Average Loan Size Multifamily² 75.1% W.A. LTV 81.4% in top 25 US MSAs 0% Construction Loans $82.2M Average Loan Size 1. At September 30, 2020 represented 50.6% of the Company’s total commitments; Refer to page 9 for additional information 2. At September 30, 2020 represented 20.6% of the Company’s total commitments; Refer to page 9 for additional information Note: The foregoing represent a select sample of TRTX investments and may not be representative of all TRTX investments
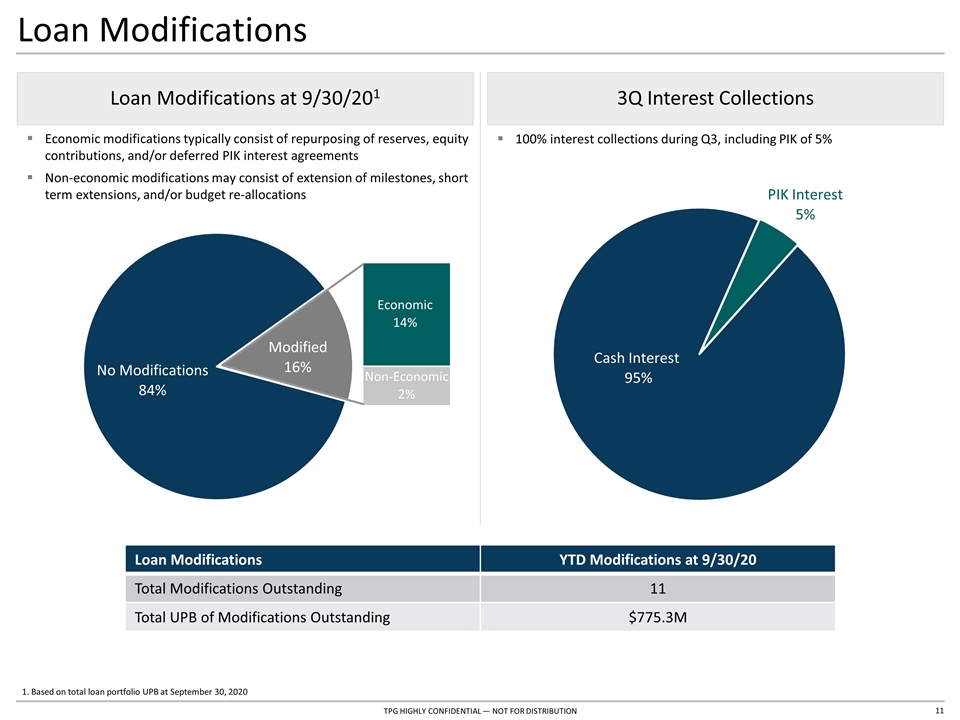
Loan Modifications Loan Modifications YTD Modifications at 9/30/20 Total Modifications Outstanding 11 Total UPB of Modifications Outstanding $775.3M Loan Modifications at 9/30/201 3Q Interest Collections 100% interest collections during Q3, including PIK of 5% Economic modifications typically consist of repurposing of reserves, equity contributions, and/or deferred PIK interest agreements Non-economic modifications may consist of extension of milestones, short term extensions, and/or budget re-allocations 1. Based on total loan portfolio UPB at September 30, 2020
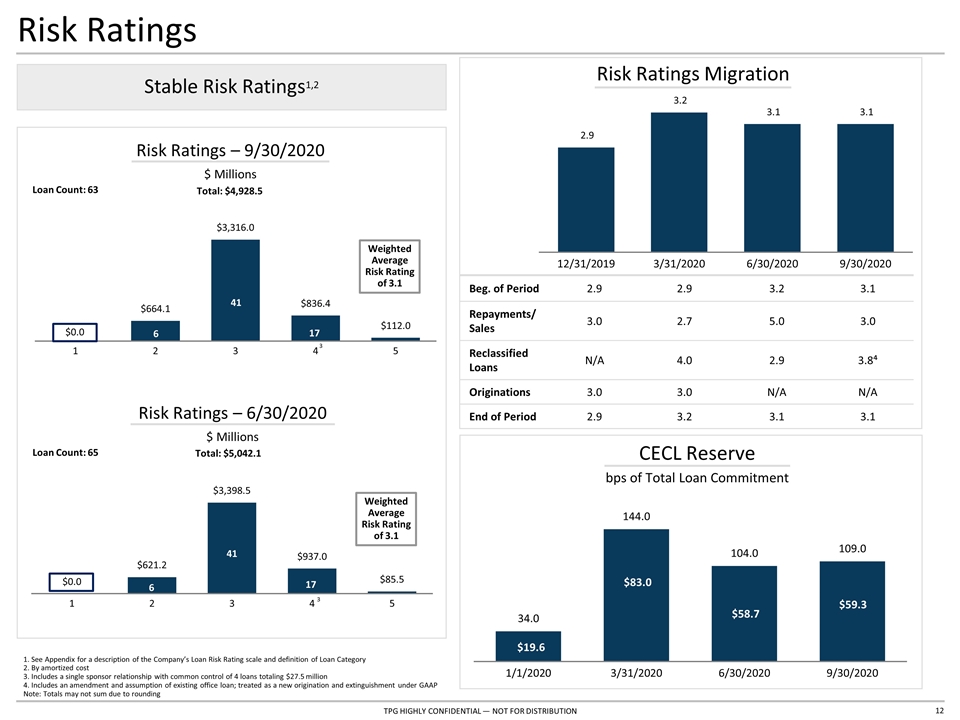
$0.0 Risk Ratings Risk Ratings – 9/30/2020 $ Millions Total: $4,928.5 Loan Count: 63 1. See Appendix for a description of the Company’s Loan Risk Rating scale and definition of Loan Category 2. By amortized cost 3. Includes a single sponsor relationship with common control of 4 loans totaling $27.5 million 4. Includes an amendment and assumption of existing office loan; treated as a new origination and extinguishment under GAAP Note: Totals may not sum due to rounding Stable Risk Ratings1,2 Beg. of Period 2.9 2.9 3.2 3.1 Repayments/Sales 3.0 2.7 5.0 3.0 Reclassified Loans N/A 4.0 2.9 3.8⁴ Originations 3.0 3.0 N/A N/A End of Period 2.9 3.2 3.1 3.1 Risk Ratings Migration 6 41 17 CECL Reserve bps of Total Loan Commitment $19.6 $58.7 3 Risk Ratings – 6/30/2020 $ Millions Total: $5,042.1 Loan Count: 65 6 41 17 3 $83.0 $59.3
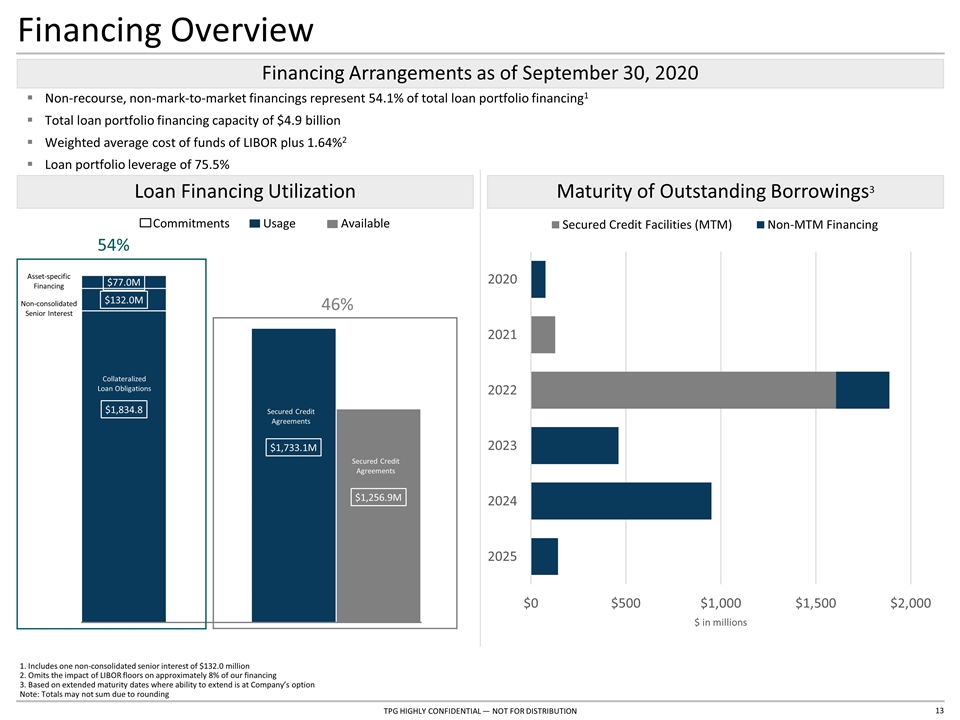
Financing Overview 1. Includes one non-consolidated senior interest of $132.0 million 2. Omits the impact of LIBOR floors on approximately 8% of our financing 3. Based on extended maturity dates where ability to extend is at Company’s option Note: Totals may not sum due to rounding Financing Arrangements as of September 30, 2020 Non-recourse, non-mark-to-market financings represent 54.1% of total loan portfolio financing1 Total loan portfolio financing capacity of $4.9 billion Weighted average cost of funds of LIBOR plus 1.64%2 Loan portfolio leverage of 75.5% Loan Financing Utilization Maturity of Outstanding Borrowings3 2.54x 2.64x Asset-specific Financing Secured Credit Agreements Secured Credit Agreements Commitments Usage Available 3.38x 3.49x 54% 46%
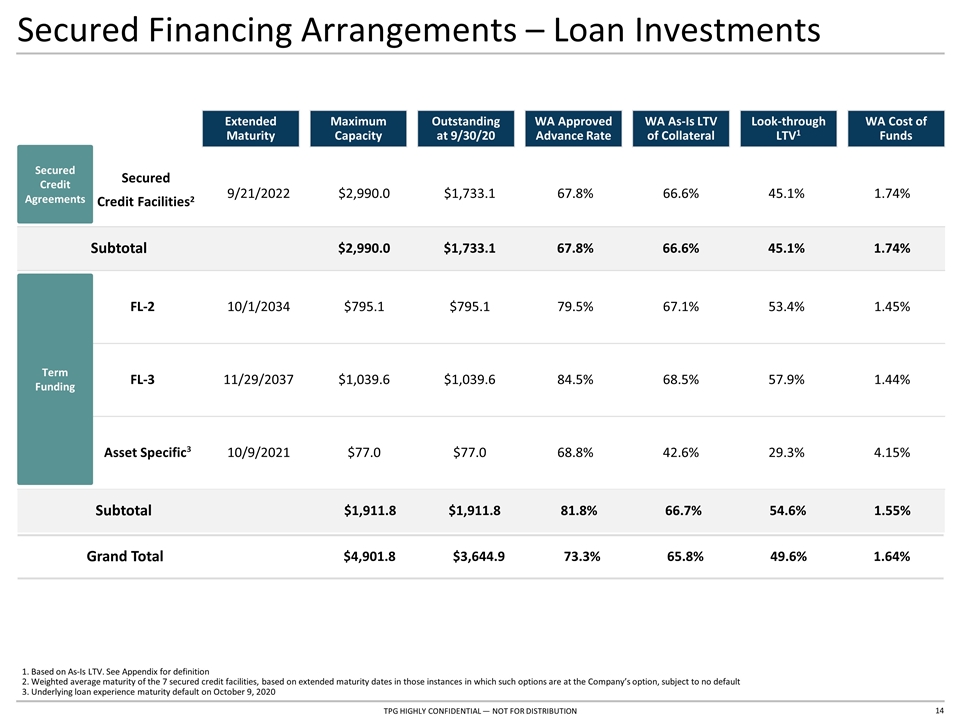
Secured Financing Arrangements – Loan Investments Secured Credit Facilities2 9/21/2022 $2,990.0 $1,733.1 67.8% 66.6% 45.1% 1.74% Subtotal $2,990.0 $1,733.1 67.8% 66.6% 45.1% 1.74% FL-2 10/1/2034 $795.1 $795.1 79.5% 67.1% 53.4% 1.45% FL-3 11/29/2037 $1,039.6 $1,039.6 84.5% 68.5% 57.9% 1.44% Asset Specific³ 10/9/2021 $77.0 $77.0 68.8% 42.6% 29.3% 4.15% Maximum Capacity WA As-Is LTV of Collateral WA Approved Advance Rate Term Funding Outstanding at 9/30/20 WA Cost of Funds Look-through LTV1 Subtotal $1,911.8 $1,911.8 81.8% 66.7% 54.6% 1.55% Grand Total $4,901.8 $3,644.9 73.3% 65.8% 49.6% 1.64% 1. Based on As-Is LTV. See Appendix for definition 2. Weighted average maturity of the 7 secured credit facilities, based on extended maturity dates in those instances in which such options are at the Company’s option, subject to no default 3. Underlying loan experience maturity default on October 9, 2020 Secured Credit Agreements Extended Maturity
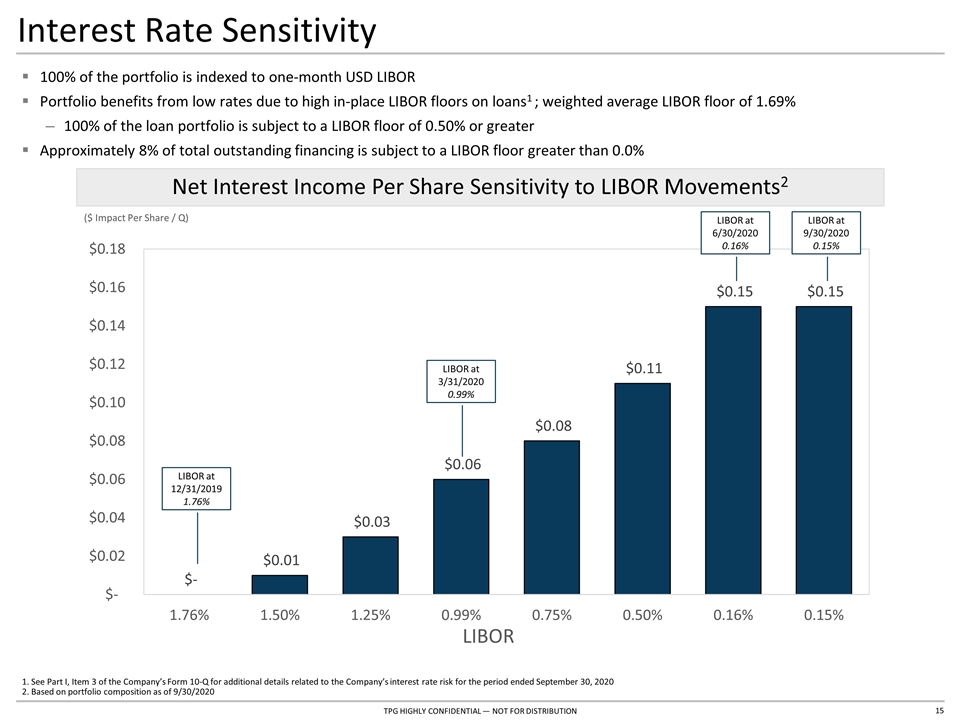
Interest Rate Sensitivity LIBOR Net Interest Income Per Share Sensitivity to LIBOR Movements2 100% of the portfolio is indexed to one-month USD LIBOR Portfolio benefits from low rates due to high in-place LIBOR floors on loans1 ; weighted average LIBOR floor of 1.69% 100% of the loan portfolio is subject to a LIBOR floor of 0.50% or greater Approximately 8% of total outstanding financing is subject to a LIBOR floor greater than 0.0% 1. See Part I, Item 3 of the Company’s Form 10-Q for additional details related to the Company’s interest rate risk for the period ended September 30, 2020 2. Based on portfolio composition as of 9/30/2020 LIBOR at 12/31/2019 1.76% LIBOR at 3/31/2020 0.99% LIBOR at 6/30/2020 0.16% LIBOR at 9/30/2020 0.15%
Appendix
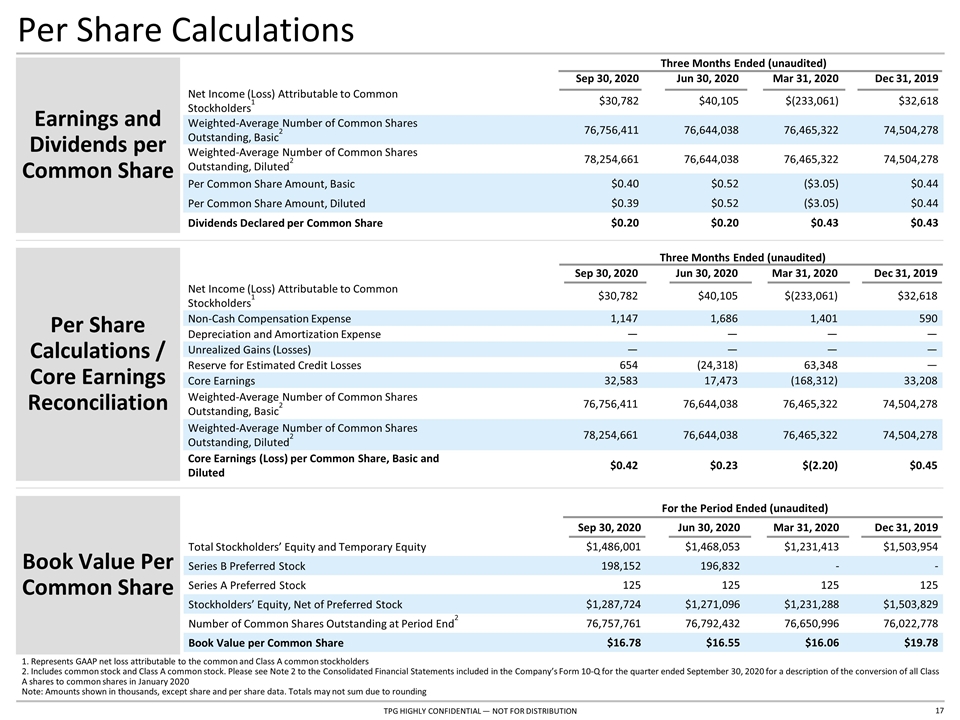
Per Share Calculations Per Share Calculations / Core Earnings Reconciliation Earnings and Dividends per Common Share Three Months Ended (unaudited) Sep 30, 2020 Jun 30, 2020 Mar 31, 2020 Dec 31, 2019 Net Income (Loss) Attributable to Common Stockholders1 $30,782 $40,105 $(233,061) $32,618 Weighted-Average Number of Common Shares Outstanding, Basic2 76,756,411 76,644,038 76,465,322 74,504,278 Weighted-Average Number of Common Shares Outstanding, Diluted2 78,254,661 76,644,038 76,465,322 74,504,278 Per Common Share Amount, Basic $0.40 $0.52 ($3.05) $0.44 Per Common Share Amount, Diluted $0.39 $0.52 ($3.05) $0.44 Dividends Declared per Common Share $0.20 $0.20 $0.43 $0.43 Three Months Ended (unaudited) Sep 30, 2020 Jun 30, 2020 Mar 31, 2020 Dec 31, 2019 Net Income (Loss) Attributable to Common Stockholders1 $30,782 $40,105 $(233,061) $32,618 Non-Cash Compensation Expense 1,147 1,686 1,401 590 Depreciation and Amortization Expense — — — — Unrealized Gains (Losses) — — — — Reserve for Estimated Credit Losses 654 (24,318) 63,348 — Core Earnings 32,583 17,473 (168,312) 33,208 Weighted-Average Number of Common Shares Outstanding, Basic2 76,756,411 76,644,038 76,465,322 74,504,278 Weighted-Average Number of Common Shares Outstanding, Diluted2 78,254,661 76,644,038 76,465,322 74,504,278 Core Earnings (Loss) per Common Share, Basic and Diluted $0.42 $0.23 $(2.20) $0.45 1. Represents GAAP net loss attributable to the common and Class A common stockholders 2. Includes common stock and Class A common stock. Please see Note 2 to the Consolidated Financial Statements included in the Company’s Form 10-Q for the quarter ended September 30, 2020 for a description of the conversion of all Class A shares to common shares in January 2020 Note: Amounts shown in thousands, except share and per share data. Totals may not sum due to rounding Book Value Per Common Share For the Period Ended (unaudited) Sep 30, 2020 Jun 30, 2020 Mar 31, 2020 Dec 31, 2019 Total Stockholders’ Equity and Temporary Equity $1,486,001 $1,468,053 $1,231,413 $1,503,954 Series B Preferred Stock 198,152 196,832 - - Series A Preferred Stock 125 125 125 125 Stockholders’ Equity, Net of Preferred Stock $1,287,724 $1,271,096 $1,231,288 $1,503,829 Number of Common Shares Outstanding at Period End2 76,757,761 76,792,432 76,650,996 76,022,778 Book Value per Common Share $16.78 $16.55 $16.06 $19.78
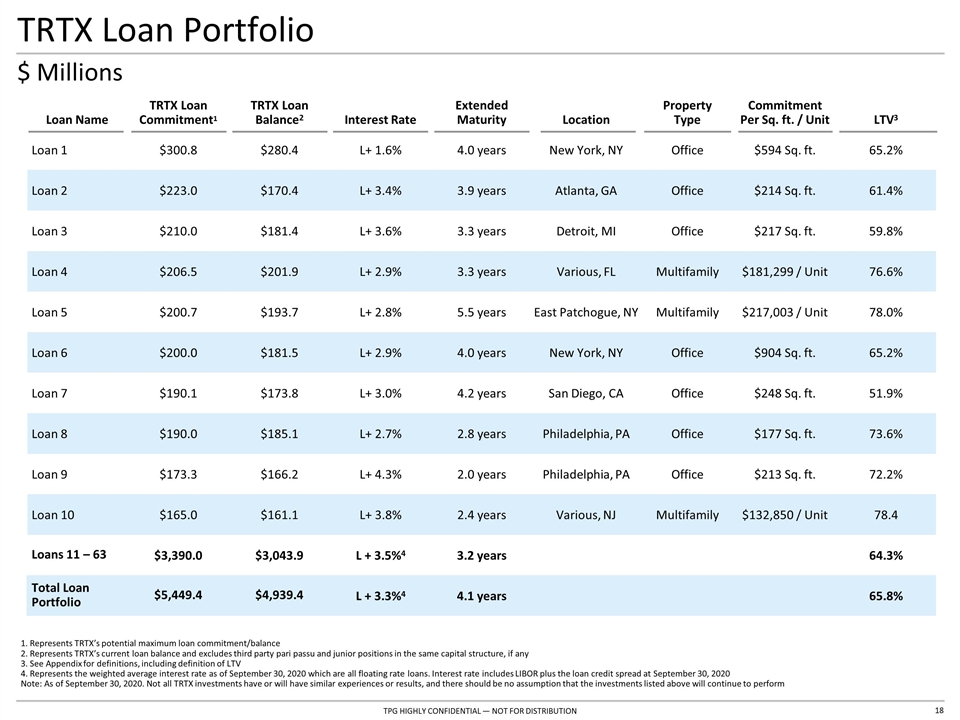
TRTX Loan Portfolio Loan Name TRTX Loan Commitment1 TRTX Loan Balance2 Interest Rate Extended Maturity Location Property Type Commitment Per Sq. ft. / Unit LTV3 Loan 1 $300.8 $280.4 L+ 1.6% 4.0 years New York, NY Office $594 Sq. ft. 65.2% Loan 2 $223.0 $170.4 L+ 3.4% 3.9 years Atlanta, GA Office $214 Sq. ft. 61.4% Loan 3 $210.0 $181.4 L+ 3.6% 3.3 years Detroit, MI Office $217 Sq. ft. 59.8% Loan 4 $206.5 $201.9 L+ 2.9% 3.3 years Various, FL Multifamily $181,299 / Unit 76.6% Loan 5 $200.7 $193.7 L+ 2.8% 5.5 years East Patchogue, NY Multifamily $217,003 / Unit 78.0% Loan 6 $200.0 $181.5 L+ 2.9% 4.0 years New York, NY Office $904 Sq. ft. 65.2% Loan 7 $190.1 $173.8 L+ 3.0% 4.2 years San Diego, CA Office $248 Sq. ft. 51.9% Loan 8 $190.0 $185.1 L+ 2.7% 2.8 years Philadelphia, PA Office $177 Sq. ft. 73.6% Loan 9 $173.3 $166.2 L+ 4.3% 2.0 years Philadelphia, PA Office $213 Sq. ft. 72.2% Loan 10 $165.0 $161.1 L+ 3.8% 2.4 years Various, NJ Multifamily $132,850 / Unit 78.4 Loans 11 – 63 $3,390.0 $3,043.9 L + 3.5%4 3.2 years 64.3% Total Loan Portfolio $5,449.4 $4,939.4 L + 3.3%4 4.1 years 65.8% 1. Represents TRTX’s potential maximum loan commitment/balance 2. Represents TRTX’s current loan balance and excludes third party pari passu and junior positions in the same capital structure, if any 3. See Appendix for definitions, including definition of LTV 4. Represents the weighted average interest rate as of September 30, 2020 which are all floating rate loans. Interest rate includes LIBOR plus the loan credit spread at September 30, 2020 Note: As of September 30, 2020. Not all TRTX investments have or will have similar experiences or results, and there should be no assumption that the investments listed above will continue to perform $ Millions
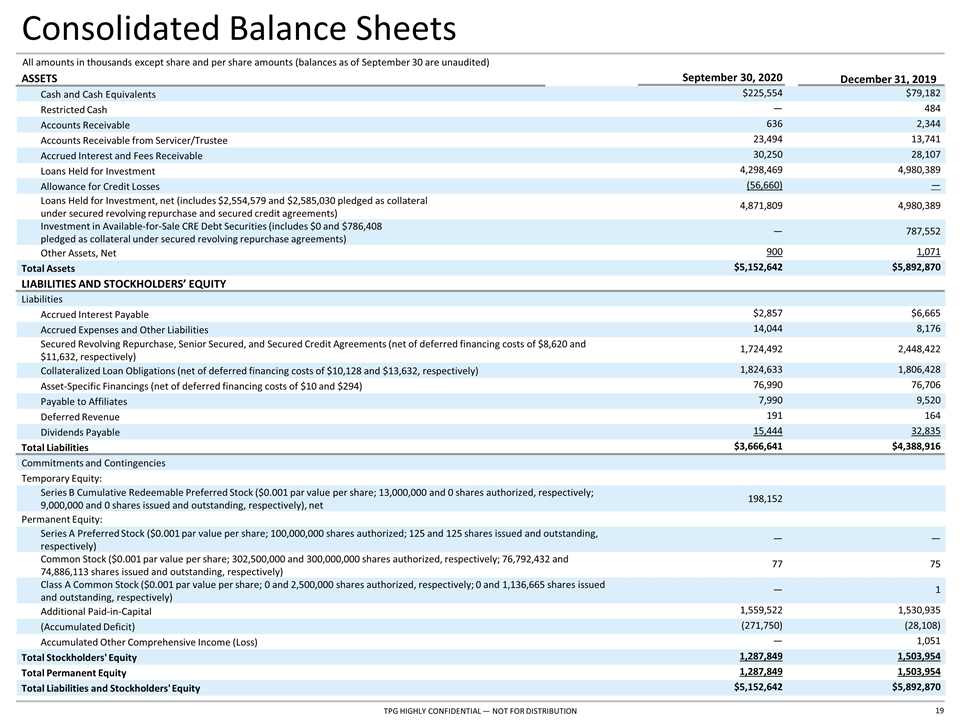
All amounts in thousands except share and per share amounts (balances as of September 30 are unaudited) ASSETS September 30, 2020 December 31, 2019 Cash and Cash Equivalents $225,554 $79,182 Restricted Cash — 484 Accounts Receivable 636 2,344 Accounts Receivable from Servicer/Trustee 23,494 13,741 Accrued Interest and Fees Receivable 30,250 28,107 Loans Held for Investment 4,298,469 4,980,389 Allowance for Credit Losses (56,660) — Loans Held for Investment, net (includes $2,554,579 and $2,585,030 pledged as collateral under secured revolving repurchase and secured credit agreements) 4,871,809 4,980,389 Investment in Available-for-Sale CRE Debt Securities (includes $0 and $786,408 pledged as collateral under secured revolving repurchase agreements) — 787,552 Other Assets, Net 900 1,071 Total Assets $5,152,642 $5,892,870 LIABILITIES AND STOCKHOLDERS’ EQUITY Liabilities Accrued Interest Payable $2,857 $6,665 Accrued Expenses and Other Liabilities 14,044 8,176 Secured Revolving Repurchase, Senior Secured, and Secured Credit Agreements (net of deferred financing costs of $8,620 and $11,632, respectively) 1,724,492 2,448,422 Collateralized Loan Obligations (net of deferred financing costs of $10,128 and $13,632, respectively) 1,824,633 1,806,428 Asset-Specific Financings (net of deferred financing costs of $10 and $294) 76,990 76,706 Payable to Affiliates 7,990 9,520 Deferred Revenue 191 164 Dividends Payable 15,444 32,835 Total Liabilities $3,666,641 $4,388,916 Commitments and Contingencies Temporary Equity: Series B Cumulative Redeemable Preferred Stock ($0.001 par value per share; 13,000,000 and 0 shares authorized, respectively; 9,000,000 and 0 shares issued and outstanding, respectively), net 198,152 Permanent Equity: Series A Preferred Stock ($0.001 par value per share; 100,000,000 shares authorized; 125 and 125 shares issued and outstanding, respectively) — — Common Stock ($0.001 par value per share; 302,500,000 and 300,000,000 shares authorized, respectively; 76,792,432 and 74,886,113 shares issued and outstanding, respectively) 77 75 Class A Common Stock ($0.001 par value per share; 0 and 2,500,000 shares authorized, respectively; 0 and 1,136,665 shares issued and outstanding, respectively) — 1 Additional Paid-in-Capital 1,559,522 1,530,935 (Accumulated Deficit) (271,750) (28,108) Accumulated Other Comprehensive Income (Loss) — 1,051 Total Stockholders' Equity 1,287,849 1,503,954 Total Permanent Equity 1,287,849 1,503,954 Total Liabilities and Stockholders' Equity $5,152,642 $5,892,870 Consolidated Balance Sheets
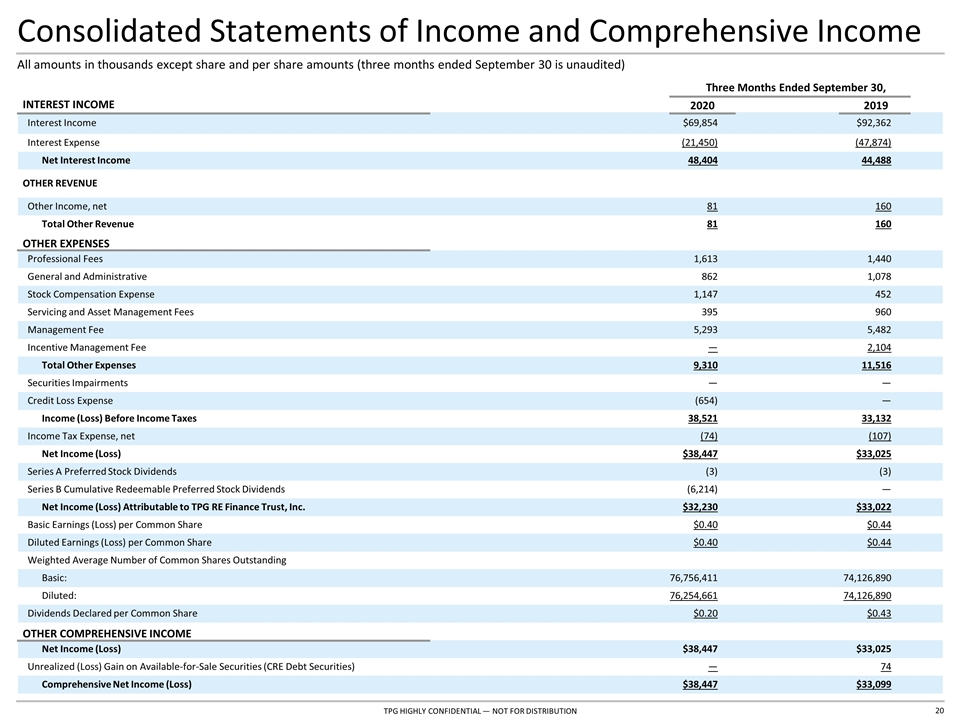
Consolidated Statements of Income and Comprehensive Income All amounts in thousands except share and per share amounts (three months ended September 30 is unaudited) Three Months Ended September 30, INTEREST INCOME 2020 2019 Interest Income $69,854 $92,362 Interest Expense (21,450) (47,874) Net Interest Income 48,404 44,488 OTHER REVENUE Other Income, net 81 160 Total Other Revenue 81 160 OTHER EXPENSES Professional Fees 1,613 1,440 General and Administrative 862 1,078 Stock Compensation Expense 1,147 452 Servicing and Asset Management Fees 395 960 Management Fee 5,293 5,482 Incentive Management Fee — 2,104 Total Other Expenses 9,310 11,516 Securities Impairments — — Credit Loss Expense (654) — Income (Loss) Before Income Taxes 38,521 33,132 Income Tax Expense, net (74) (107) Net Income (Loss) $38,447 $33,025 Series A Preferred Stock Dividends (3) (3) Series B Cumulative Redeemable Preferred Stock Dividends (6,214) — Net Income (Loss) Attributable to TPG RE Finance Trust, Inc. $32,230 $33,022 Basic Earnings (Loss) per Common Share $0.40 $0.44 Diluted Earnings (Loss) per Common Share $0.40 $0.44 Weighted Average Number of Common Shares Outstanding Basic: 76,756,411 74,126,890 Diluted: 76,254,661 74,126,890 Dividends Declared per Common Share $0.20 $0.43 OTHER COMPREHENSIVE INCOME Net Income (Loss) $38,447 $33,025 Unrealized (Loss) Gain on Available-for-Sale Securities (CRE Debt Securities) — 74 Comprehensive Net Income (Loss) $38,447 $33,099
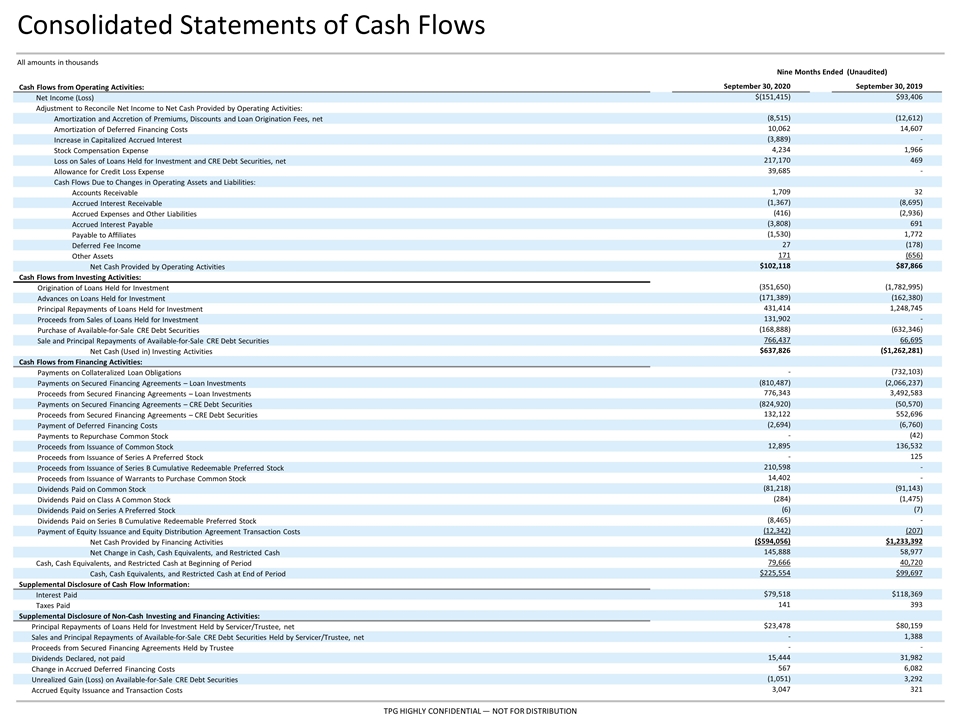
Cash Flows from Operating Activities: September 30, 2020 September 30, 2019 Net Income (Loss) $(151,415) $93,406 Adjustment to Reconcile Net Income to Net Cash Provided by Operating Activities: Amortization and Accretion of Premiums, Discounts and Loan Origination Fees, net (8,515) (12,612) Amortization of Deferred Financing Costs 10,062 14,607 Increase in Capitalized Accrued Interest (3,889) - Stock Compensation Expense 4,234 1,966 Loss on Sales of Loans Held for Investment and CRE Debt Securities, net 217,170 469 Allowance for Credit Loss Expense 39,685 - Cash Flows Due to Changes in Operating Assets and Liabilities: Accounts Receivable 1,709 32 Accrued Interest Receivable (1,367) (8,695) Accrued Expenses and Other Liabilities (416) (2,936) Accrued Interest Payable (3,808) 691 Payable to Affiliates (1,530) 1,772 Deferred Fee Income 27 (178) Other Assets 171 (656) Net Cash Provided by Operating Activities $102,118 $87,866 Cash Flows from Investing Activities: Origination of Loans Held for Investment (351,650) (1,782,995) Advances on Loans Held for Investment (171,389) (162,380) Principal Repayments of Loans Held for Investment 431,414 1,248,745 Proceeds from Sales of Loans Held for Investment 131,902 - Purchase of Available-for-Sale CRE Debt Securities (168,888) (632,346) Sale and Principal Repayments of Available-for-Sale CRE Debt Securities 766,437 66,695 Net Cash (Used in) Investing Activities $637,826 ($1,262,281) Cash Flows from Financing Activities: Payments on Collateralized Loan Obligations - (732,103) Payments on Secured Financing Agreements – Loan Investments (810,487) (2,066,237) Proceeds from Secured Financing Agreements – Loan Investments 776,343 3,492,583 Payments on Secured Financing Agreements – CRE Debt Securities (824,920) (50,570) Proceeds from Secured Financing Agreements – CRE Debt Securities 132,122 552,696 Payment of Deferred Financing Costs (2,694) (6,760) Payments to Repurchase Common Stock - (42) Proceeds from Issuance of Common Stock 12,895 136,532 Proceeds from Issuance of Series A Preferred Stock - 125 Proceeds from Issuance of Series B Cumulative Redeemable Preferred Stock 210,598 - Proceeds from Issuance of Warrants to Purchase Common Stock 14,402 - Dividends Paid on Common Stock (81,218) (91,143) Dividends Paid on Class A Common Stock (284) (1,475) Dividends Paid on Series A Preferred Stock (6) (7) Dividends Paid on Series B Cumulative Redeemable Preferred Stock (8,465) - Payment of Equity Issuance and Equity Distribution Agreement Transaction Costs (12,342) (207) Net Cash Provided by Financing Activities ($594,056) $1,233,392 Net Change in Cash, Cash Equivalents, and Restricted Cash 145,888 58,977 Cash, Cash Equivalents, and Restricted Cash at Beginning of Period 79,666 40,720 Cash, Cash Equivalents, and Restricted Cash at End of Period $225,554 $99,697 Supplemental Disclosure of Cash Flow Information: Interest Paid $79,518 $118,369 Taxes Paid 141 393 Supplemental Disclosure of Non-Cash Investing and Financing Activities: Principal Repayments of Loans Held for Investment Held by Servicer/Trustee, net $23,478 $80,159 Sales and Principal Repayments of Available-for-Sale CRE Debt Securities Held by Servicer/Trustee, net - 1,388 Proceeds from Secured Financing Agreements Held by Trustee - - Dividends Declared, not paid 15,444 31,982 Change in Accrued Deferred Financing Costs 567 6,082 Unrealized Gain (Loss) on Available-for-Sale CRE Debt Securities (1,051) 3,292 Accrued Equity Issuance and Transaction Costs 3,047 321 Consolidated Statements of Cash Flows All amounts in thousands Nine Months Ended (Unaudited)
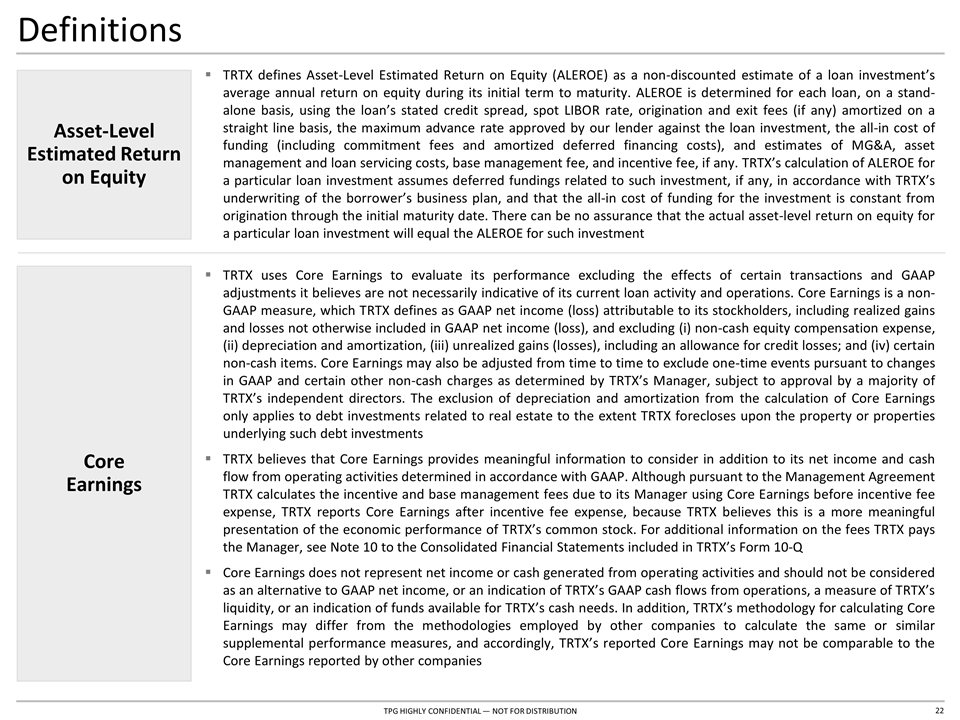
Definitions TRTX uses Core Earnings to evaluate its performance excluding the effects of certain transactions and GAAP adjustments it believes are not necessarily indicative of its current loan activity and operations. Core Earnings is a non-GAAP measure, which TRTX defines as GAAP net income (loss) attributable to its stockholders, including realized gains and losses not otherwise included in GAAP net income (loss), and excluding (i) non-cash equity compensation expense, (ii) depreciation and amortization, (iii) unrealized gains (losses), including an allowance for credit losses; and (iv) certain non-cash items. Core Earnings may also be adjusted from time to time to exclude one-time events pursuant to changes in GAAP and certain other non-cash charges as determined by TRTX’s Manager, subject to approval by a majority of TRTX’s independent directors. The exclusion of depreciation and amortization from the calculation of Core Earnings only applies to debt investments related to real estate to the extent TRTX forecloses upon the property or properties underlying such debt investments TRTX believes that Core Earnings provides meaningful information to consider in addition to its net income and cash flow from operating activities determined in accordance with GAAP. Although pursuant to the Management Agreement TRTX calculates the incentive and base management fees due to its Manager using Core Earnings before incentive fee expense, TRTX reports Core Earnings after incentive fee expense, because TRTX believes this is a more meaningful presentation of the economic performance of TRTX’s common stock. For additional information on the fees TRTX pays the Manager, see Note 10 to the Consolidated Financial Statements included in TRTX’s Form 10-Q Core Earnings does not represent net income or cash generated from operating activities and should not be considered as an alternative to GAAP net income, or an indication of TRTX’s GAAP cash flows from operations, a measure of TRTX’s liquidity, or an indication of funds available for TRTX’s cash needs. In addition, TRTX’s methodology for calculating Core Earnings may differ from the methodologies employed by other companies to calculate the same or similar supplemental performance measures, and accordingly, TRTX’s reported Core Earnings may not be comparable to the Core Earnings reported by other companies Core Earnings Asset-Level Estimated Return on Equity TRTX defines Asset-Level Estimated Return on Equity (ALEROE) as a non-discounted estimate of a loan investment’s average annual return on equity during its initial term to maturity. ALEROE is determined for each loan, on a stand-alone basis, using the loan’s stated credit spread, spot LIBOR rate, origination and exit fees (if any) amortized on a straight line basis, the maximum advance rate approved by our lender against the loan investment, the all-in cost of funding (including commitment fees and amortized deferred financing costs), and estimates of MG&A, asset management and loan servicing costs, base management fee, and incentive fee, if any. TRTX’s calculation of ALEROE for a particular loan investment assumes deferred fundings related to such investment, if any, in accordance with TRTX’s underwriting of the borrower’s business plan, and that the all-in cost of funding for the investment is constant from origination through the initial maturity date. There can be no assurance that the actual asset-level return on equity for a particular loan investment will equal the ALEROE for such investment
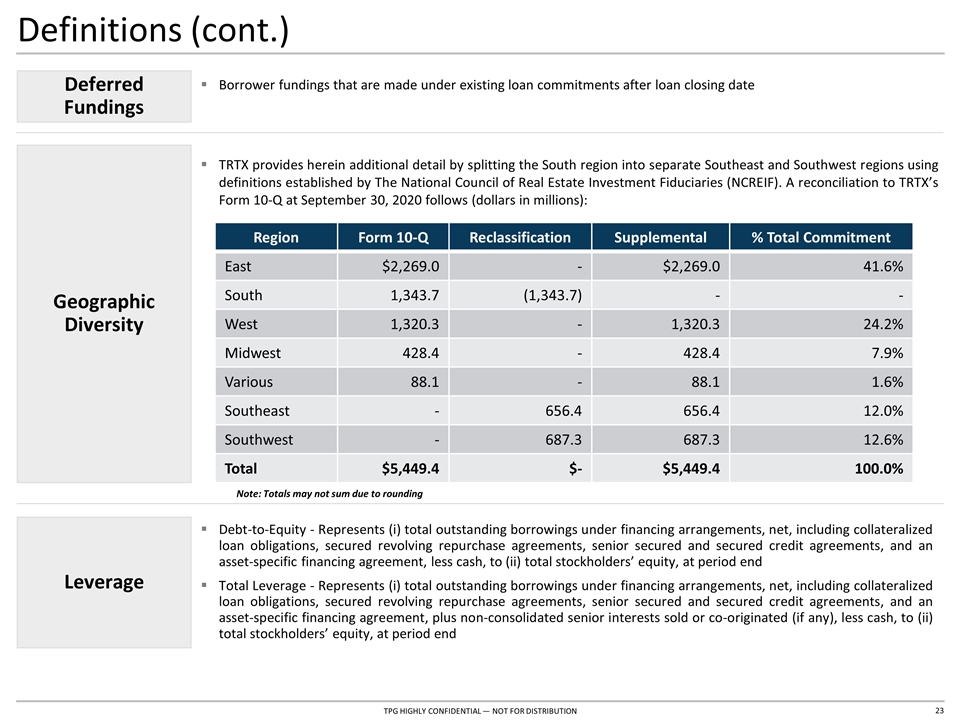
Definitions (cont.) Debt-to-Equity - Represents (i) total outstanding borrowings under financing arrangements, net, including collateralized loan obligations, secured revolving repurchase agreements, senior secured and secured credit agreements, and an asset-specific financing agreement, less cash, to (ii) total stockholders’ equity, at period end Total Leverage - Represents (i) total outstanding borrowings under financing arrangements, net, including collateralized loan obligations, secured revolving repurchase agreements, senior secured and secured credit agreements, and an asset-specific financing agreement, plus non-consolidated senior interests sold or co-originated (if any), less cash, to (ii) total stockholders’ equity, at period end Leverage Borrower fundings that are made under existing loan commitments after loan closing date Deferred Fundings Geographic Diversity TRTX provides herein additional detail by splitting the South region into separate Southeast and Southwest regions using definitions established by The National Council of Real Estate Investment Fiduciaries (NCREIF). A reconciliation to TRTX’s Form 10-Q at September 30, 2020 follows (dollars in millions): Region Form 10-Q Reclassification Supplemental % Total Commitment East $2,269.0 - $2,269.0 41.6% South 1,343.7 (1,343.7) - - West 1,320.3 - 1,320.3 24.2% Midwest 428.4 - 428.4 7.9% Various 88.1 - 88.1 1.6% Southeast - 656.4 656.4 12.0% Southwest - 687.3 687.3 12.6% Total $5,449.4 $- $5,449.4 100.0% Note: Totals may not sum due to rounding
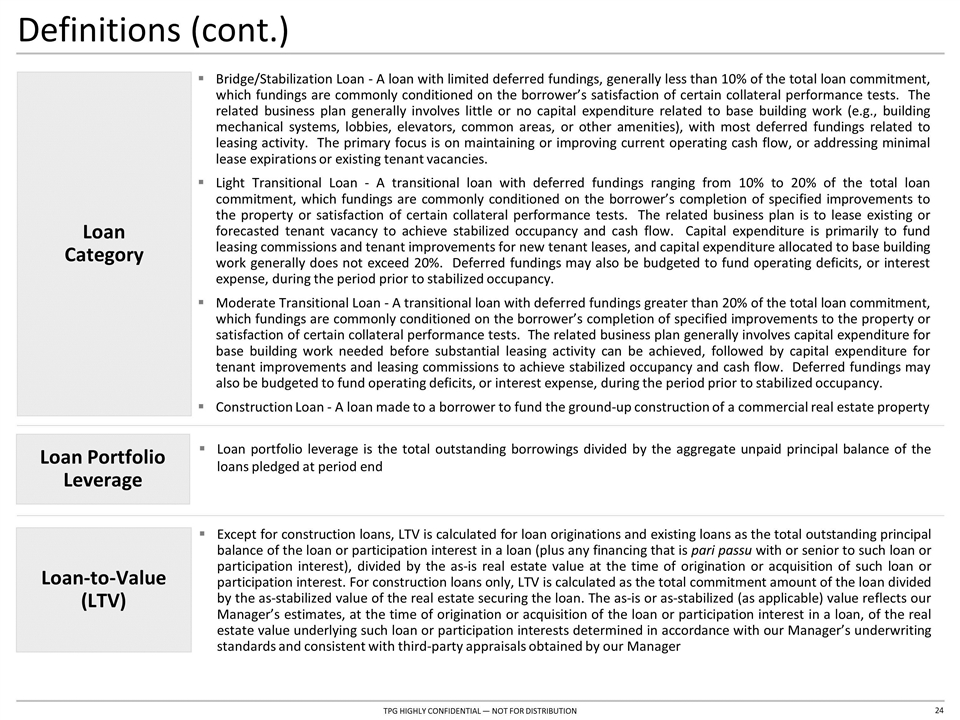
Definitions (cont.) Bridge/Stabilization Loan - A loan with limited deferred fundings, generally less than 10% of the total loan commitment, which fundings are commonly conditioned on the borrower’s satisfaction of certain collateral performance tests. The related business plan generally involves little or no capital expenditure related to base building work (e.g., building mechanical systems, lobbies, elevators, common areas, or other amenities), with most deferred fundings related to leasing activity. The primary focus is on maintaining or improving current operating cash flow, or addressing minimal lease expirations or existing tenant vacancies. Light Transitional Loan - A transitional loan with deferred fundings ranging from 10% to 20% of the total loan commitment, which fundings are commonly conditioned on the borrower’s completion of specified improvements to the property or satisfaction of certain collateral performance tests. The related business plan is to lease existing or forecasted tenant vacancy to achieve stabilized occupancy and cash flow. Capital expenditure is primarily to fund leasing commissions and tenant improvements for new tenant leases, and capital expenditure allocated to base building work generally does not exceed 20%. Deferred fundings may also be budgeted to fund operating deficits, or interest expense, during the period prior to stabilized occupancy. Moderate Transitional Loan - A transitional loan with deferred fundings greater than 20% of the total loan commitment, which fundings are commonly conditioned on the borrower’s completion of specified improvements to the property or satisfaction of certain collateral performance tests. The related business plan generally involves capital expenditure for base building work needed before substantial leasing activity can be achieved, followed by capital expenditure for tenant improvements and leasing commissions to achieve stabilized occupancy and cash flow. Deferred fundings may also be budgeted to fund operating deficits, or interest expense, during the period prior to stabilized occupancy. Construction Loan - A loan made to a borrower to fund the ground-up construction of a commercial real estate property Loan Category Except for construction loans, LTV is calculated for loan originations and existing loans as the total outstanding principal balance of the loan or participation interest in a loan (plus any financing that is pari passu with or senior to such loan or participation interest), divided by the as-is real estate value at the time of origination or acquisition of such loan or participation interest. For construction loans only, LTV is calculated as the total commitment amount of the loan divided by the as-stabilized value of the real estate securing the loan. The as-is or as-stabilized (as applicable) value reflects our Manager’s estimates, at the time of origination or acquisition of the loan or participation interest in a loan, of the real estate value underlying such loan or participation interests determined in accordance with our Manager’s underwriting standards and consistent with third-party appraisals obtained by our Manager Loan-to-Value (LTV) Loan Portfolio Leverage Loan portfolio leverage is the total outstanding borrowings divided by the aggregate unpaid principal balance of the loans pledged at period end
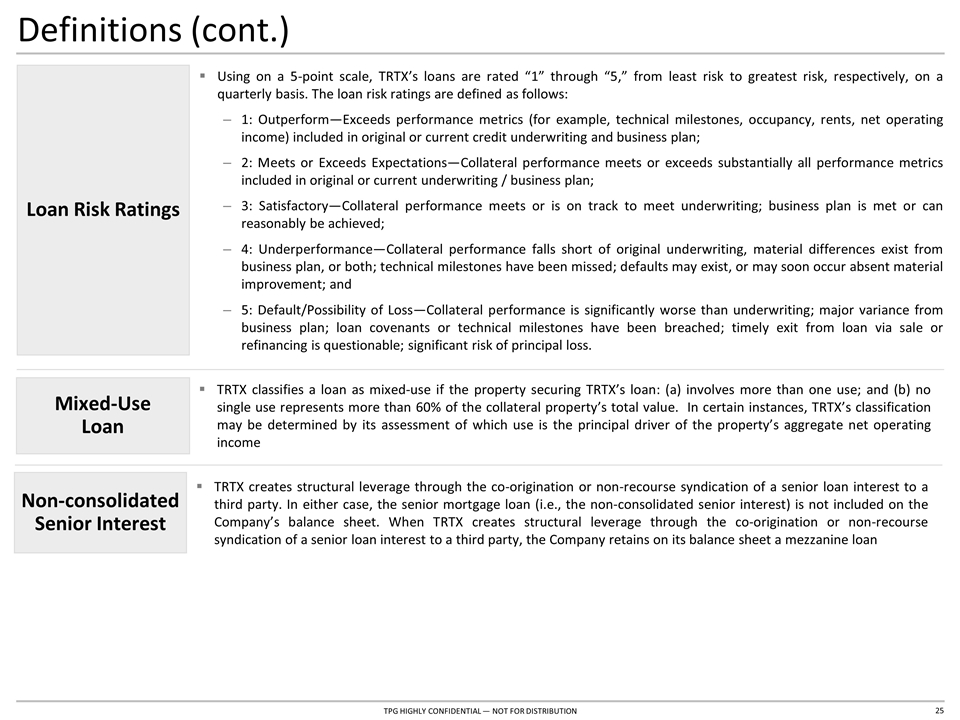
Definitions (cont.) Loan Risk Ratings Using on a 5-point scale, TRTX’s loans are rated “1” through “5,” from least risk to greatest risk, respectively, on a quarterly basis. The loan risk ratings are defined as follows: 1: Outperform—Exceeds performance metrics (for example, technical milestones, occupancy, rents, net operating income) included in original or current credit underwriting and business plan; 2: Meets or Exceeds Expectations—Collateral performance meets or exceeds substantially all performance metrics included in original or current underwriting / business plan; 3: Satisfactory—Collateral performance meets or is on track to meet underwriting; business plan is met or can reasonably be achieved; 4: Underperformance—Collateral performance falls short of original underwriting, material differences exist from business plan, or both; technical milestones have been missed; defaults may exist, or may soon occur absent material improvement; and 5: Default/Possibility of Loss—Collateral performance is significantly worse than underwriting; major variance from business plan; loan covenants or technical milestones have been breached; timely exit from loan via sale or refinancing is questionable; significant risk of principal loss. Non-consolidated Senior Interest TRTX creates structural leverage through the co-origination or non-recourse syndication of a senior loan interest to a third party. In either case, the senior mortgage loan (i.e., the non-consolidated senior interest) is not included on the Company’s balance sheet. When TRTX creates structural leverage through the co-origination or non-recourse syndication of a senior loan interest to a third party, the Company retains on its balance sheet a mezzanine loan Mixed-Use Loan TRTX classifies a loan as mixed-use if the property securing TRTX’s loan: (a) involves more than one use; and (b) no single use represents more than 60% of the collateral property’s total value. In certain instances, TRTX’s classification may be determined by its assessment of which use is the principal driver of the property’s aggregate net operating income
Company Information Contact Information Headquarters: 888 Seventh Avenue 35th Floor New York, NY 10106 New York Stock Exchange: Symbol: TRTX TPG RE Finance Trust, Inc. Bob Foley Chief Financial Officer +1 (212) 430-4111 bfoley@tpg.com Investor Relations: +1 (212) 405-8500 IR@tpgrefinance.com Media Contact: TPG RE Finance Trust, Inc. Courtney Power +1 (415) 743-1550 media@tpg.com Analyst Coverage Citigroup Arren Cyganovich +1 (212) 816-3733 JP Morgan Richard Shane +1 (415) 315-6701 Raymond James Stephen Laws +1 (901) 579-4868 JMP Securities Steven DeLaney +1 (212) 906-3517 Wells Fargo Donald Fandetti +1 (212) 214-8069 Transfer Agent American Stock Transfer & Trust Company, LLC +1 (800) 937-5449 help@astfinancial.com TPG RE Finance Trust, Inc. is a commercial real estate finance company that originates, acquires, and manages primarily first mortgage loans secured by institutional properties located in primary and select secondary markets in the United States. The Company is externally managed by TPG RE Finance Trust Management, L.P., a part of TPG Real Estate, which is the real estate investment platform of global alternative asset firm TPG. For more information regarding TRTX, visit www.tpgrefinance.com.
