Attached files
| file | filename |
|---|---|
| 8-K - 8-K - FIRST BUSINESS FINANCIAL SERVICES, INC. | fbiz-20201104.htm |

Exhibit 99.1 INVESTOR PRESENTATION THIRD QUARTER 2020 Nasdaq: FBIZ

Forward-Looking Statements When used in this presentation, and in any other oral statements made with the approval of an authorized executive officer, the words or phrases “may,” “could,” “should,” “hope,” “might,” “believe,” “expect,” “plan,” “assume,” “intend,” “estimate,” “anticipate,” “project,” “likely,” or similar expressions are intended to identify “forward-looking statements” within the meaning of such term in the Private Securities Litigation Reform Act of 1995. Such statements are subject to risks and uncertainties, including among other things: (i) Adverse changes in the economy or business conditions, either nationally or in our markets, including, without limitation, the adverse effects of the COVID-19 pandemic on the global, national, and local economy. (ii) The effect of the COVID-19 pandemic on the Corporation’s credit quality, revenue, and business operations. (iii) Competitive pressures among depository and other financial institutions nationally and in our markets. (iv) Increases in defaults by borrowers and other delinquencies. (v) Our ability to manage growth effectively, including the successful expansion of our client support, administrative infrastructure, and internal management systems. (vi) Fluctuations in interest rates and market prices. (vii) The consequences of continued bank acquisitions and mergers in our markets, resulting in fewer but much larger and financially stronger competitors. (viii) Changes in legislative or regulatory requirements applicable to us and our subsidiaries. (ix) Changes in tax requirements, including tax rate changes, new tax laws, and revised tax law interpretations. (x) Fraud, including client and system failure or breaches of our network security, including our internet banking activities. (xi) Failure to comply with the applicable SBA regulations in order to maintain the eligibility of the guaranteed portions of SBA loans. These risks could cause actual results to differ materially from what FBIZ has anticipated or projected. These risks could cause actual results to differ materially from what we have anticipated or projected. These risk factors and uncertainties should be carefully considered by our stockholders and potential investors. For further information about the factors that could affect the Corporation’s future results, please see the Corporation’s annual report on Form 10-K for the year ended December 31, 2019, the Corporation’s quarterly report on Form 10-Q for the quarter ended March 31, 2020, and other filings with the Securities and Exchange Commission. Investors should not place undue reliance on any such forward-looking statement, which speaks only as of the date on which it was made. The factors described within the filings could affect our financial performance and could cause actual results for future periods to differ materially from any opinions or statements expressed with respect to future periods. Where any such forward-looking statement includes a statement of the assumptions or bases underlying such forward-looking statement, FBIZ cautions that, while its management believes such assumptions or bases are reasonable and are made in good faith, assumed facts or bases can vary from actual results, and the differences between assumed facts or bases and actual results can be material, depending on the circumstances. Where, in any forward- looking statement, an expectation or belief is expressed as to future results, such expectation or belief is expressed in good faith and believed to have a reasonable basis, but there can be no assurance that the statement of expectation or belief will be achieved or accomplished. FBIZ does not intend to, and specifically disclaims any obligation to, update any forward-looking statements.

Table of Contents Company Overview.......................................................................... 4 COVID-19 Update............................................................................. 8 Quarterly Update.............................................................................. 15 Value Drivers.................................................................................... 22 Strategic Plan................................................................................... 30 Investment Rationale....................................................................... 34 Appendix........................................................................................... 43

COMPANY OVERVIEW
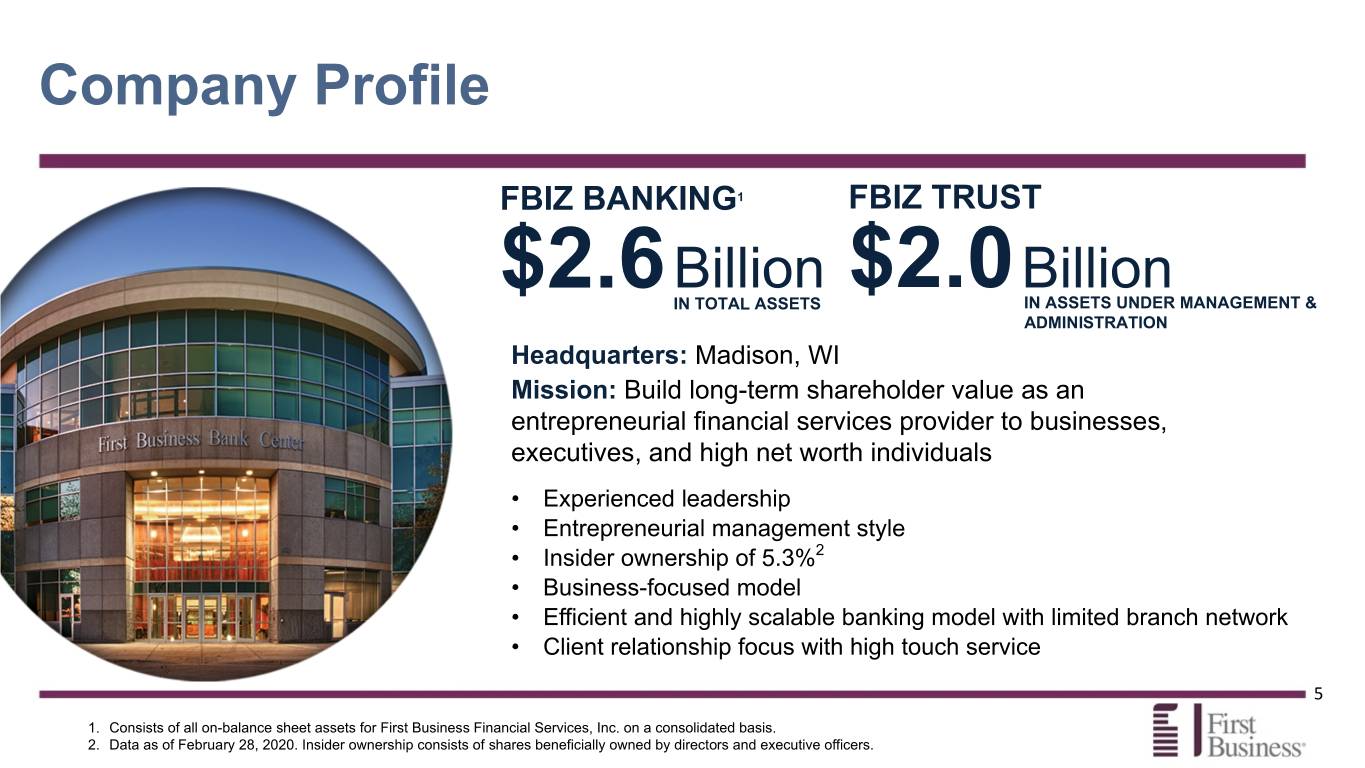
Company Profile FBIZ BANKING1 FBIZ TRUST $2.6 Billion $2.0 Billion IN TOTAL ASSETS IN ASSETS UNDER MANAGEMENT & ADMINISTRATION Headquarters: Madison, WI Mission: Build long-term shareholder value as an entrepreneurial financial services provider to businesses, executives, and high net worth individuals • Experienced leadership • Entrepreneurial management style • Insider ownership of 5.3%2 • Business-focused model • Efficient and highly scalable banking model with limited branch network • Client relationship focus with high touch service 5 1. Consists of all on-balance sheet assets for First Business Financial Services, Inc. on a consolidated basis. 2. Data as of February 28, 2020. Insider ownership consists of shares beneficially owned by directors and executive officers.

Evolution of Success Aligned with the Financial Needs of Our Niche Client Base 6

Evolution of Success Aligned with the Financial Needs of Our Niche Client Base 7

COVID-19 UPDATE

Paycheck Protection Program ("PPP") Active Participation Propelled by SBA Expertise & Proactive Investments in Technology Leveraged a 700+ applications $8.7 MILLION As of 11/2/20, proprietary client processed and in processing fees $117.1 MILLION, or portal to create an expected to be efficient and user $332 MILLION 35% of total PPP recognized as yield friendly PPP portal funds approved and loans have been enhancement through within days of the disbursed within 10 submitted to the SBA net interest margin plan’s announcement business days of for forgiveness and ($2.0 million SBA approval clients have started to recognized YTD) receive reimbursement 9

Robust Liquidity Position Primary & Secondary Sources Provide Ample Liquidity During Uncertain Environment Primary Sources: As of 6/30/20 As of 9/30/20 • Short-Term Investments (Primarily excess cash held 8% 4% 9% 4% at the Federal Reserve) • Collateral Value of 16% Unencumbered Loans (FHLB 21% Advances) • Market Value of Unencumbered Securities $665M 45% $610M 49% (FHLB Advances and FRB Discount Window) 27% 18% Secondary Sources: • Paycheck Protection Short-term investments Short-term investments PPPLF availability PPPLF Availability Program Liquidity Facility Collateral Value of Unencumbered Pledged Loans Collateral value of Unencumbered Pledged Loans Market Value of Unencumbered Securities Market Value of Unencumbered Securities ("PPPLF") Fed Fund Lines Fed Fund Lines • Fed Fund Lines 10
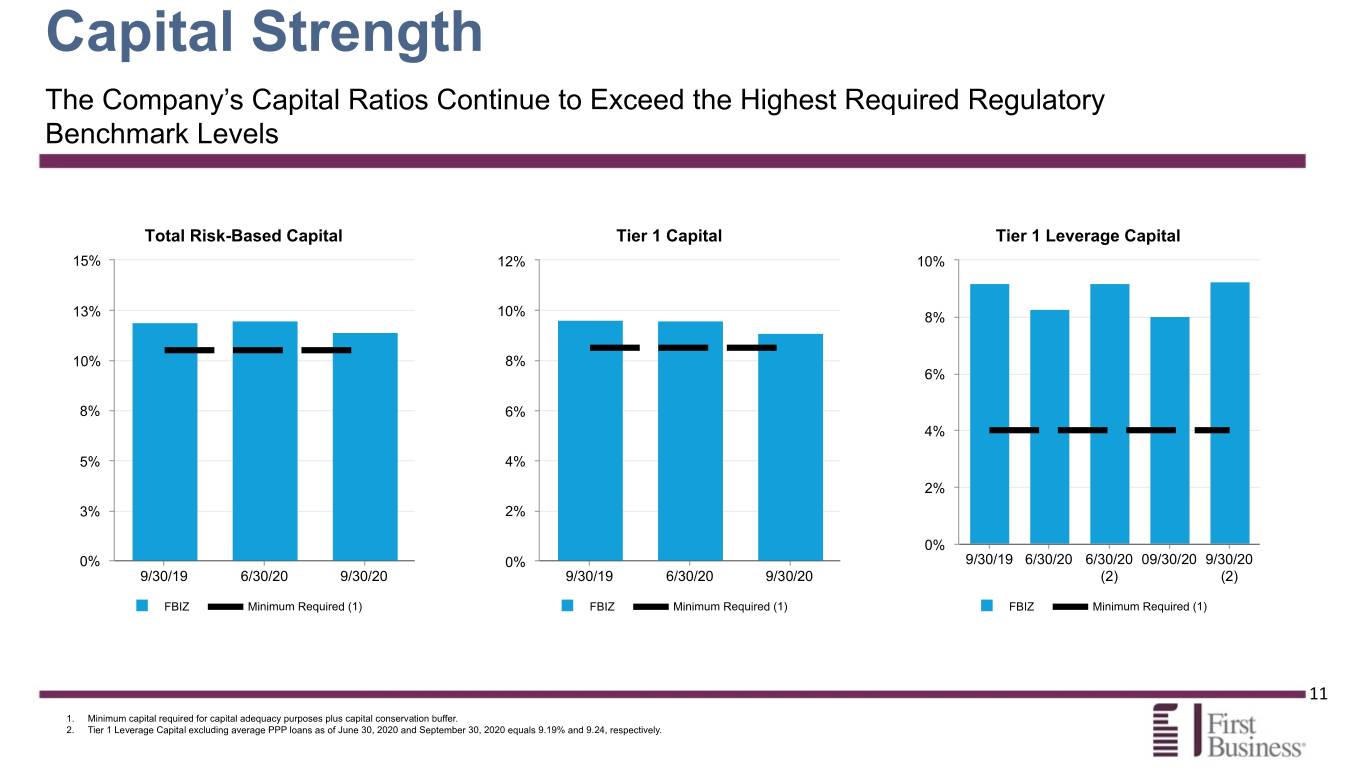
Capital Strength The Company’s Capital Ratios Continue to Exceed the Highest Required Regulatory Benchmark Levels Total Risk-Based Capital Tier 1 Capital Tier 1 Leverage Capital 15% 12% 10% 13% 10% 8% 10% 8% 6% 8% 6% 4% 5% 4% 2% 3% 2% 0% 0% 0% 9/30/19 6/30/20 6/30/20 09/30/20 9/30/20 9/30/19 6/30/20 9/30/20 9/30/19 6/30/20 9/30/20 (2) (2) FBIZ Minimum Required (1) FBIZ Minimum Required (1) FBIZ Minimum Required (1) 11 1. Minimum capital required for capital adequacy purposes plus capital conservation buffer. 2. Tier 1 Leverage Capital excluding average PPP loans as of June 30, 2020 and September 30, 2020 equals 9.19% and 9.24, respectively.

Credit Quality Modest Overall Exposure to Industries Most Impacted by COVID-19 and No Retail Consumer Portfolio Exposure to Stressed Industries Loan Modification Trend As of $360 480 ($ in millions) September 30, 2020 $300 400 % Gross Loans and Industries: Balance Leases (2) Retail (1) $ 75.2 4.1 % $240 320 Hospitality 78.8 4.3 % Entertainment 7.8 0.4 % $180 240 Restaurants & food service 26.7 1.4 % ($ in millions) Total outstanding exposure $ 188.5 10.2 % $120 160 • As of September 30, 2020, the Company had no meaningful direct exposure to the energy sector, airline industry or retail consumer, and $60 80 does not participate in shared national credits. • Because of the significant uncertainties related to the ultimate $0 0 duration of the COVID-19 pandemic and its effects on our clients and 3/31/20 4/30/20 6/30/20 9/30/20 prospects, and on the national and local economy as a whole, there can be no assurances as to how the crisis may ultimately affect the Balance Outstanding Deferral Requests Company’s loan portfolio. 12 1. Includes $52.0 million in loans secured by commercial real estate. 2. Excluding PPP loans.

Credit Quality As of October 20, 2020, 95% of clients whose first deferral concluded during the quarter resumed their scheduled payments The following table and chart represent a breakdown of the deferred loan balances by industry segment, collateral type, and credit quality indicators: As of (Dollars in thousands) September 30, 2020 Collateral Type Loan Deferrals by Credit Quality Indicator (1) % of Deferred 0.8% of Total Real Non Real Industries Description Balance Industry Estate Estate 15.2% Real Estate and Rental and Leasing $ 67,214 7.7 % $ 67,214 $ — Accommodation and Food Services 26,884 25.3 % 26,884 — Manufacturing 17,807 9.6 % 10,506 7,301 Health Care and Social Assistance 8,867 6.9 % 8,855 12 Transportation and Warehousing 256 1.9 % — 256 Retail Trade 6,781 14.7 % 6,781 — 53.2% Information — — % — — Utilities — — % — — Construction 427 0.7 % 427 — 30.7% Wholesale Trade 711 0.3 % 450 261 Other Services (except Public Administration) 402 0.8 % 212 190 Professional, Scientific, and Technical Services 364 0.4 % — 364 Administrative and Support and Waste Management and Remediation Services 145 1.6 % — 145 Finance and Insurance — — % — — Category I Category II Category III Category IV Arts, Entertainment, and Recreation 1,350 7.9 % 1,350 — Agriculture, Forestry, Fishing and Hunting 261 0.8 % — 261 Total deferred loan balances $ 131,469 $ 122,679 $ 8,790 1. Category I — Loans and leases in this category are performing in accordance with the terms of the contract and generally exhibit no immediate concerns regarding the security and viability of the underlying collateral, financial stability of the borrower, integrity or strength of the 13 borrowers’ management team, or the industry in which the borrower operates. Category II — Loans and leases in this category are beginning to show signs of deterioration in one or more of the Corporation’s core underwriting criteria such as financial stability, management strength, industry trends, or collateral values. Category III — Loans and leases in this category are identified by management as warranting special attention. However, the balance in this category is not intended to represent the amount of adversely classified assets held by the Bank. Please refer to Note 6 — Loan and Lease Receivables, Impaired Loans and Leases and Allowance for Loan and Lease Losses in the September 30, 2020 Form 10-Q for the complete risk category definitions. Category IV — Loans and leases in this category are considered impaired. However, the balance in this category is not intended to represent the amount of adversely classified assets held by the Bank. Please refer to Note 6 — Loan and Lease Receivables, Impaired Loans and Leases and Allowance for Loan and Lease Losses in the September 30, 2020 Form 10-Q for the complete risk category definitions.

Credit Quality Breakdown of Deferrals in the Real Estate and Rental and Leasing Industry and the Accommodation and Food Service Industry The following table is a further breakdown of the deferred loan balances and collateral type for the Real Estate and Rental and Leasing and Accommodation and Food Service industries: As of As of (Dollars in thousands) September 30, 2020 (Dollars in thousands) September 30, 2020 Collateral Type Collateral Type % % Deferred Deferred of Sub- Real Non Real of Sub- Real Non Real Real Estate and Rental and Leasing Detail: Balance Industry Estate Estate Accommodation and Food Services Detail: Balance Industry Estate Estate Office - Class A $ 7,922 4.8 % $ 7,922 $ — Hotel - Flag $ 25,082 34.1 % $ 25,082 $ — Retail - Non-Credit Tenant - Shopping Center 9,326 30.4 % 9,326 — Hotel - No Flag — — % — — Office - Class B 5,738 10.2 % 5,738 — Other 1,802 14.5 % 1,802 — 1-4 Family 185 0.7 % 185 — Retail - Restaurant/Bar — — % — — Multi-Family - Market Rent 26,888 12.1 % 26,888 — Total Accommodation and Food Service $ 26,884 $ 26,884 $ — Retail - Non-Credit Tenant - Strip Center 4,944 26.3 % 4,944 — Multi-Family - Student Housing 8,466 20.3 % 8,466 — Retail - Non-Credit Tenant - Restaurant 1,004 9.9 % 1,004 — Retail - Other 986 7.1 % 986 — Retail - Non-Credit-Tenant - Big Box 1,755 31.2 % 1,755 — Other — — % — — Total Real Estate and Rental and Leasing $ 67,214 $ 67,214 $ — 14

QUARTERLY UPDATE
Third Quarter 2020 Summary REVENUE - Loan Growth and Record Fee Income Lead to Record Top Line Revenue Driven by Commercial Lending, Private Wealth, and SBA Lending EARNINGS - Robust Operating Performance Tempered by 12% Reserve Build BALANCE SHEET - Record Loan Growth and In-Market Deposits OFF BALANCE SHEET - Trust Assets Surpass the $2 Billion Mark KEY OPERATING TRENDS - Consistent Net Operating Income Growth 16

Quarterly Update - Revenue Record Fee Income Driven by Commercial Lending, Private Wealth, and SBA Lending $8,400 30.00% $7,408 $7,200 $6,319 28.00% $6,000 $5,792 26.00% $4,800 $3,600 24.00% $ (Thousands) $2,400 22.00% $1,200 $0 20.00% Q3 2019 Q2 2020 Q3 2020 Total Non Interest Income % of Top Line Revenue Long Term Target % of Top Line Revenue 17

Quarterly Update - Earnings Performance Tempered by 12% Reserve Build and $3.8 Million Loan Loss Provision $0.70 1.05% 14.00% 0.97% $0.60 $0.59 0.90% 12.00% 10.68% $0.50 $0.50 0.75% 10.00% 0.68% 8.58% $0.40 $0.38 0.60% 0.55% 8.00% 6.70% $0.30 0.45% 6.00% $0.20 0.30% 4.00% $0.10 0.15% 2.00% $0.00 0.00% 0.00% Q3 2019 Q2 2020 Q3 2020 Q3 2019 Q2 2020 Q3 2020 Diluted EPS ROAA (1) ROAE (1) 18 1. Calculations are annualized.

Quarterly Update - Balance Sheet Record Loan Growth and In-Market Deposits Primarily Due to Client Receipt of PPP Loan Proceeds $2,000 $350 $1,845 $1,737 $313 $1,750 $1,721 $1,621 $1,667 $300 $1,500 $1,321 $250 $1,250 $213 $218 $200 $1,000 $ (Millions) $150 $750 $ (Millions) $500 $100 $250 $50 $0 Q3 2019 Q2 2020 Q3 2020 $0 Q3 2019 Q2 2020 Q3 2020 Period-End Loans & Leases (1) Period-End In-Market Deposits (2) Line of Credit Utilization 19 1. Q3 2020 and Q2 2020 "Period-End Loans & Leases" exclude net PPP loans. Net PPP loans outstanding as of September 30, 2020 and June 30, 2020, were and $325.4 million and $320.0 million, respectively. Q3 2019 did not have any net PPP loans outstanding. 2. "Period-End In-Market Deposits" represents transaction accounts plus non-transaction accounts.

Quarterly Update - Key Operating Trends Modest Adjusted Net Interest Margin Compression Amid Low Rate Environment Adjusted Net Interest Margin Drivers of NIM Change NIM, Yields, and Costs 5.53% 3.34% —% 0.07% —% 3.14% (0.02)%(0.13)% 4.35% (0.13)% 3.95% 3.40% 3.34% 3.14% 2.49% 2.09% 1.99% 3.24% 3.32% 3.24% 1.69% 0.61% 0.54% Loans Q3 2019 Q2 2020 Q3 2020 Deposits 2Q20 NIM Securities 3Q20 NIM Borrowings Average Loan Yield Net Interest Margin Q3 2019 Q2 2020 Q3 2020 ST Investments Fees in Lieu (3) Securities Yield Cost of Funds (4) Net interest margin and loan yields temporarily impacted by PPP loans with 1% rate. 20 1. "Adjusted Net Interest Margin" is a non-GAAP measurement. See appendix for non-GAAP reconciliation schedules. 2. "Recurring, volatile components" is defined as fees in lieu of interest, PPP loan interest income, FRB interest income, FHLB dividend income, and Federal Reserve PPPLF interest expense. Calculation also excludes average PPP loans, average FRB cash, average FHLB stock, and average non-accrual loans. 3. "Fees in lieu of interest" is defined as prepayment fees, asset-based loan fees, non-accrual interest, and loan fee amortization. 4. "Cost of Funds" is defined as total interest expense on deposits, FHLB advances, and Federal Reserve PPPLF advances divided by the sum of total average deposits, average FHLB advances, and average Federal Reserve PPPLF advances.

Quarterly Update - Key Operating Trends Operating Fundamentals Demonstrate Earnings Power $105.0 Net Operating Income 10YR CAGR = 12% $90.0 $75.0 Operating Expense Pure Net Interest Income ¹ $60.0 Trust Fee Income Other Fee Income Service Charges on Deposits $ (Millions) $45.0 $32.5 Fees in Lieu of Interest ³ $26.6 $28.1 Gain on Sale of SBA Loans $30.0 Swap Fees Net Tax Credits ² $10.5 Net Operating Income ¹ $15.0 $7.6 $9.3 $0.0 2017 2018 2019 Q1 Q2 Q3 2020 2020 2020 21 Note: Net interest income is the sum of "Pure Net Interest Income" and "Fees in Lieu of Interest". Non-interest income is the sum of "Trust Fee Income", "Other Fee Income", "Service Charges", "SBA Gains", and "Swap Fees". 1. "Pure Net Interest Income" and "Net Operating Income" are non-GAAP measurements. See appendix for non-GAAP reconciliation schedules. 2. "Net Tax Credits" represent managements estimate of the after-tax contribution related to the investment in tax credits as of the reporting period disclosed. 3. "Fees in Lieu of Interest" is defined as prepayment fees, asset-based loan fees, non-accrual interest, and loan fee amortization. $30.0 $25.0 $20.0 $15.0 $ (Millions) $10.0 $9.0 $7.9 $7.8 $7.6 $5.0 $0.0 Q2 Q3 Q4 Q1 2019 2019 2019 2020

LONG-TERM VALUE DRIVERS

Long-Term Value Drivers Areas of Focus Growth - Emphasis on Delivery of Above Average Organic Growth Through Expert Business Banking and Specialty Finance Teams Asset Quality - Proven Financial Performance through Credit Cycles Profitability - Return to Above Average Profitability through Maturation of Commercial Business Lines Operating Efficiency - Leverage Branch-Lite Model, Business-Banking Niche, and Proactive Investment in Technology 23

Growth Emphasis on Delivery of Above Average Organic Growth Through Expert Business Banking and Specialty Finance Teams Core Deposit Growth (3) Revenue Growth 10.8% 40% 11.9% 40% 30% 30% 20% 20% 10% 4.6% 10% 0% 3.0% 0% -10% -20% -10% '11 '12 '13 '14 '15 '16 '17 '18 '19 '20 '11 '12 '13 '14 '15 '16 '17 '18 '19 '20 (1) 10-YR CAGR (1) 10-YR CAGR FBIZ Peer Group (2) FBIZ Peer Group (2) 24 1. 2020 represents growth for the three months ended June 30, 2020 compared to the three months ended June 30, 2019. 2. Peer Group defined as U.S. Commercial Banks with total assets between $1 billion and $3 billion. 3. Core Deposits represents deposits excluding time deposits over $250,000 and brokered deposits of $250,000 or less. Prior to reporting period March 31, 2017, represents deposits excluding time deposits of $100,000 or more and brokered deposits of $100,000 to $250,000.

Asset Quality Maximize Financial Performance through Credit Cycles with Industry Expertise, Premier Clients, & Consistent Underwriting Net Charge-Offs / Average Loans 2.50% 2.00% 1.50% 1.00% 0.50% 0.00% -0.50% 2007 2008 2009 2010 2011 2012 FBIZ Peer Group (1) Great Recession 25 1. Peer Group defined as U.S. Commercial Banks with total assets between $1 billion and $3 billion. Stock Performance 1/1/2007 - 12/31/2012 No data to display In dex Value FBIZ S&P 500 Bank Index

Profitability Return to Above Average Profitability Through Maturation of Commercial Business Lines Business Life Cycles Early Stage Adolescent Mature Very High Growth & Operating High Growth & Positive Sustainable Growth & Highly Losses Contribution Profitable Commercial Business Lines Vendor Financing Accounts Receivable Financing Business Banking Bank Consulting SBA Lending Asset-Based Lending Floorplan Financing Private Wealth 26 Commercial Business Lines Business Banking Asset-Based Lending Private Wealth Return on Average Assets Accounts Receivable Financing 2.00% 1. 2020 represents annualized data for the three months ended March 31, 2020. 2. Peer Group defined as U.S. Commercial Banks with total assets between $1 billion and $3 billion. 1.50% Co st Center Profit Vendor Financing SBA Lending 1.00% Bank Consulting Floorplan Financing 0.50% Early Stage Mature 0.00% -0.50% -1.00% '05 '06 '07 '08 '09 '10 '11 '12 '13 '14 '15 '16 '17 '18 '19 '20 (1) Great Recession FBIZ Peer Group (2)

Profitability Return to Above Average Profitability Through Maturation of Commercial Business Lines Return on Average Equity Tangible Book Value Growth 20.00% 11.2% TBV 10YR CAGR = 8% 15.00% 9.6% $20.00 10.00% 8.0% $15.00 5.00% 6.4% $10.00 0.00% 4.8% $5.00 -5.00% 3.2% -10.00% $0.00 1.6% '05 '06 '07 '08 '09 '10 '11 '12 '13 '14 '15 '16 '17 '18 '19 '20 '06 '07 '08 '09 '10 '11 '12 '13 '14 '15 '16 '17 '18 '19 '20 (1) (2) Great Recession FBIZ Peer Group (3) Great Recession TBV/Share TCE/TA 27 1. 2020 represents annualized data for the six months ended June 30, 2020. 2. 2020 represents data as of September 30, 2020. TCE/TA excludes PPP loans of $325.4 million. 3. Peer Group defined as U.S. Commercial Banks with total assets between $1 billion and $3 billion.

Operating Efficiency Leverage Branch-Lite Model and Business-Banking Niche Total Deposits per Branch Total Revenue per FTE $500,000 $400 $350 $400,000 $300 $300,000 $250 $200 $200,000 $150 $( Thousands) $ (Thousands) $100 $100,000 $50 $0 $0 '11 '12 '13 '14 '15 '16 '17 '18 '19 '20 '11 '12 '13 '14 '15 '16 '17 '18 '19 '20 (1) (1) FBIZ Peer Group (2) FBIZ Peer Group (2) 28 1. 2020 represents annualized data as of June 30, 2020. 2. Peer Group defined as U.S. Commercial Banks with total assets between $1 billion and $3 billion.

Operating Efficiency Proactive Investment in Technology First Business IT Strategy - Digital Transformation Solutions are Built on Top of Salesforce, Which is at the Core of our IT Strategy 2018 2019 2020 SBA Lending Portal SBA Lending Portal Align with First Business 5-Year Strategic Plan Quick 5-minute pre-qualification Loan documentation and quality control module (Automate all of our lending processes by 2023) Complete their detailed SBA application Exchange financial documents Equipment Finance - Loan Automation 2020 Areas of Focus: Generate government forms Invoice automation Commercial Lending, Private Wealth, Accounts ACH/wire automation Receivable Financing, and Shared Services Equipment Finance - Loan Origination Improved booking functionality Automated underwriting process Internal workflow approval process Treasury Management Defect tracking module The COVID-19 Pandemic has proven the prior investments made in our IT Strategy allowed us to be extremely agile and responsive to our Clients. It has also reinforced the fact our Business & IT Strategy is aligned with the future and sometimes unanticipated needs of our Clients. 29

STRATEGIC PLAN
FBIZ Strategic Plan 2019-2023 Objective 31

FBIZ Strategic Plan 2019-2023 4 Strategies Designed to Navigate the Company over a 5-Year Time Horizon 32

FBIZ Strategic Plan 2019-2023 We Define Success as Delivering Above Average Shareholder Return Total Shareholder Return - 1 Year Actual 20% Goal Actual YTD Goal 2019 2020 2023 10% Return on average equity (1) 12.55% 7.49% 13.50% 0% Return on average assets (1) 1.14% 0.62% 1.15% -10% ≥ 10% per Top line revenue growth (1) 9.1% 10.48% year -20% In-market deposits to total bank funding 75.5% 73.11% ≥ 70% -30% Employee engagement (3) 82% N/A ≥ 80% -40% Client satisfaction (3) 93% 96% ≥ 90% -50% FBIZ Peer Group (2) 33 1. 2020 represents annualized data for the nine months ended September, 2020. 2. Peer Group defined as publicly-traded banks with total assets between $1 billion and $4 billion. 3. Surveys conducted annually.

INVESTMENT RATIONALE

Investment Rationale TRADING AT DISCOUNT TO PEER GROUP DIVIDEND YIELD HIGHER THAN PEER GROUP COMPETITIVE ADVANTAGE DRIVEN BY NICHE FOCUS, EMPLOYEE ENGAGEMENT, AND CLIENT SATISFACTION DIVERSIFIED MARGIN AND FEE REVENUE SCALABLE FRANCHISE POSITIONED FOR SUSTAINABLE GROWTH 35

Trading at Discount to Peer Group Price / Tangible Book Value 36 Note: Peer Group defined as publicly-traded banks with total assets between $1 billion and $4 billion.
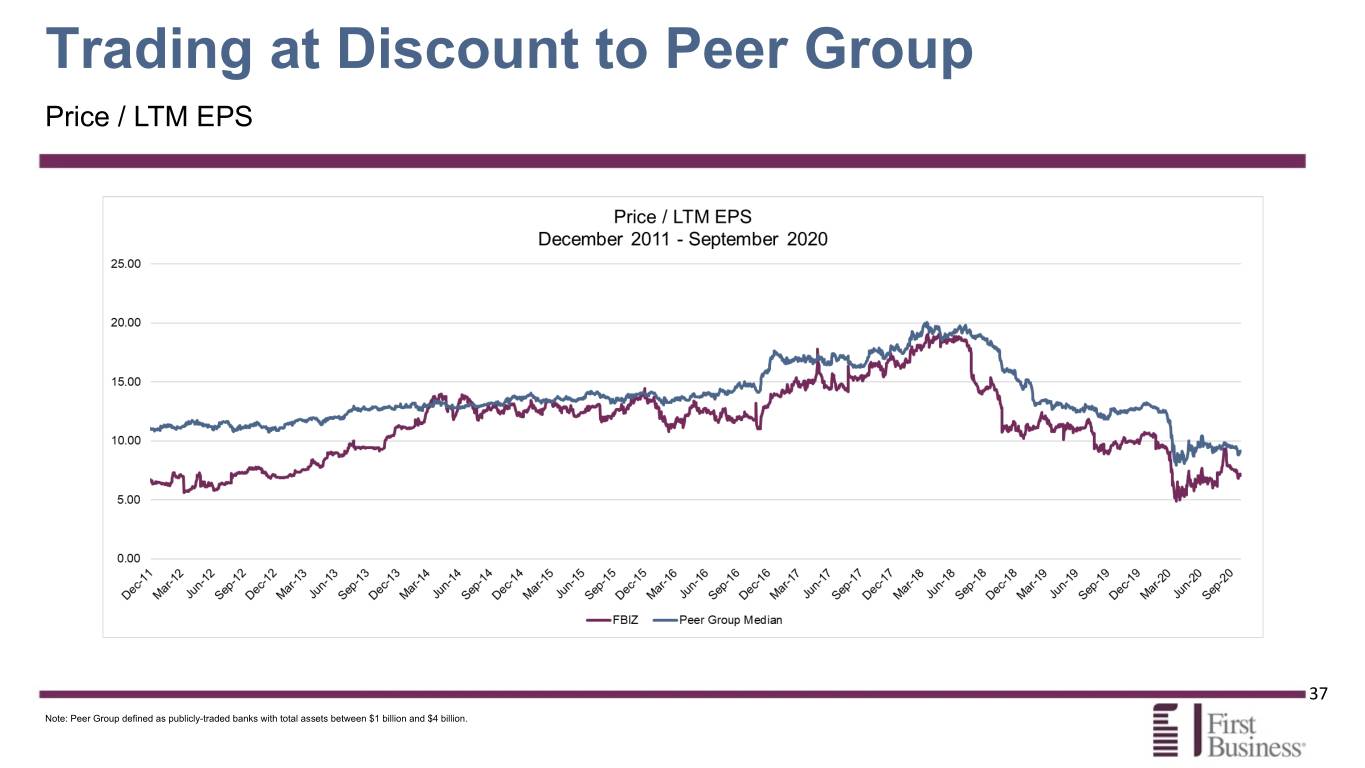
Trading at Discount to Peer Group Price / LTM EPS 37 Note: Peer Group defined as publicly-traded banks with total assets between $1 billion and $4 billion.

Dividend Yield Above Peer Group Median 38 Note: Peer Group defined as publicly-traded banks with total assets between $1 billion and $4 billion.

Competitive Advantage Driven by Niche Business and Client-Centric Focus 39

Competitive Advantage Employee Engagement & Client Satisfaction The Best Team Wins Engaged Employees = Happy Clients Net Promoter Score 62 Business Banking Satisfaction 97 % Private Wealth Satisfaction 93 % COVID-19 Responsiveness 90 % Company Retirement Satisfaction 97 % 40 Note: Client satisfaction data represents 2020 survey results.
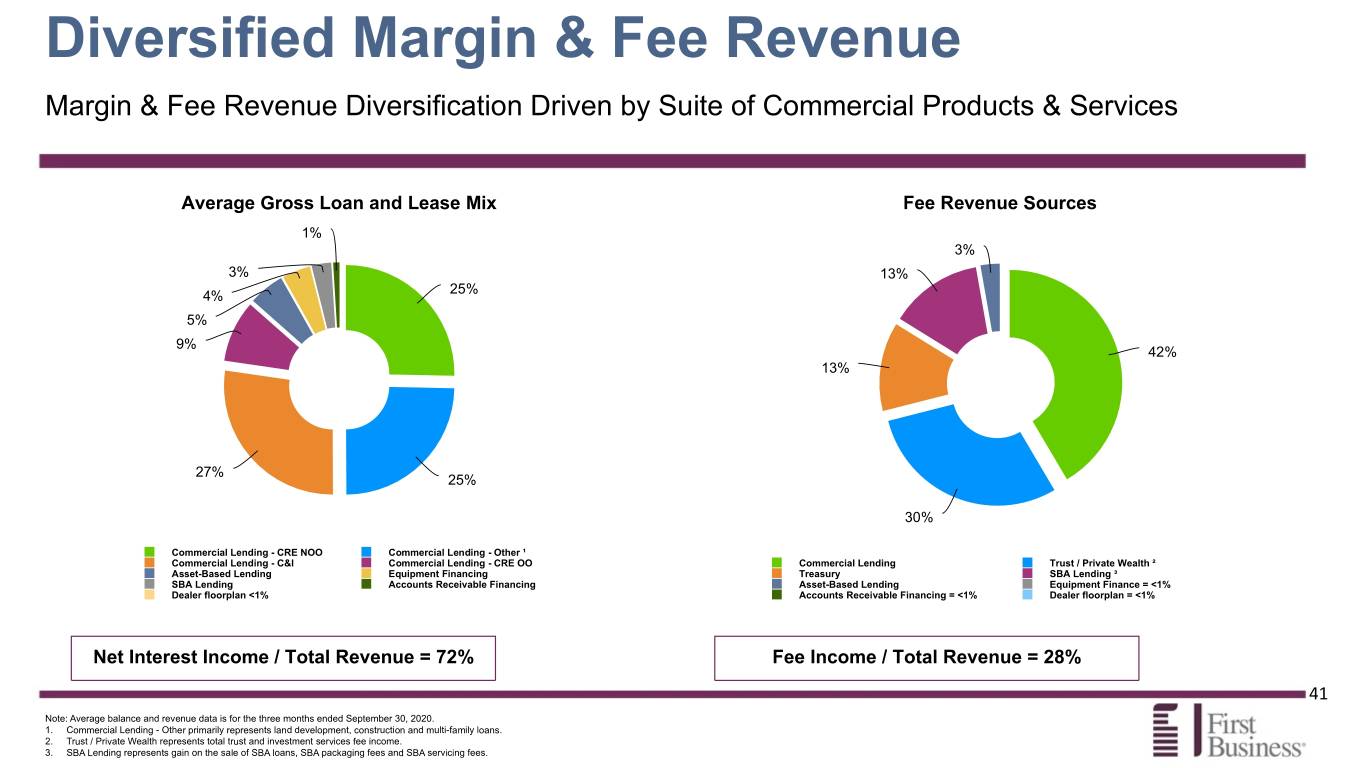
Diversified Margin & Fee Revenue Margin & Fee Revenue Diversification Driven by Suite of Commercial Products & Services Average Gross Loan and Lease Mix Fee Revenue Sources 1% 3% 3% 13% 25% 4% 5% 9% 42% 13% 27% 25% 30% Commercial Lending - CRE NOO Commercial Lending - Other ¹ Commercial Lending - C&I Commercial Lending - CRE OO Commercial Lending Trust / Private Wealth ² Asset-Based Lending Equipment Financing Treasury SBA Lending ³ SBA Lending Accounts Receivable Financing Asset-Based Lending Equipment Finance = <1% Dealer floorplan <1% Accounts Receivable Financing = <1% Dealer floorplan = <1% Net Interest Income / Total Revenue = 72% Fee Income / Total Revenue = 28% 41 Note: Average balance and revenue data is for the three months ended September 30, 2020. 1. Commercial Lending - Other primarily represents land development, construction and multi-family loans. 2. Trust / Private Wealth represents total trust and investment services fee income. 3. SBA Lending represents gain on the sale of SBA loans, SBA packaging fees and SBA servicing fees.

Scalable Franchise Positioned for Sustainable Growth • Organic growth remains the foundation for the future • Scale Private Wealth Management business in current markets outside of Madison • Significant commercial loan growth opportunity augmented by niche specialty finance lending programs • Demonstrated ability to grow in-market deposits commensurate with robust loan growth • Opportunity to increase market share in the Kansas City metro, Northeast and Southeast Wisconsin regions 42

APPENDIX SUPPLEMENTAL DATA & NON-GAAP RECONCILIATIONS

FINANCIAL PERFORMANCE

Net Interest Margin 2Q20 and 3Q20 net Quarterly Trend interest margin Annual Trend temporarily 4.00% impacted by PPP 4.00% loans with 1% rate 3.50% 3.50% 3.00% 3.00% 2.50% 2.50% 2.00% 2.00% 1.50% 1.50% 1.00% 1.00% 0.50% 0.50% 0.00% 0.00% 3Q19 4Q19 1Q20 2Q20 3Q20 2011 2012 2013 2015 2016 2017 2018 2019 Net Interest Margin Long-Term Goal Net Interest Margin Long-Term Goal 45
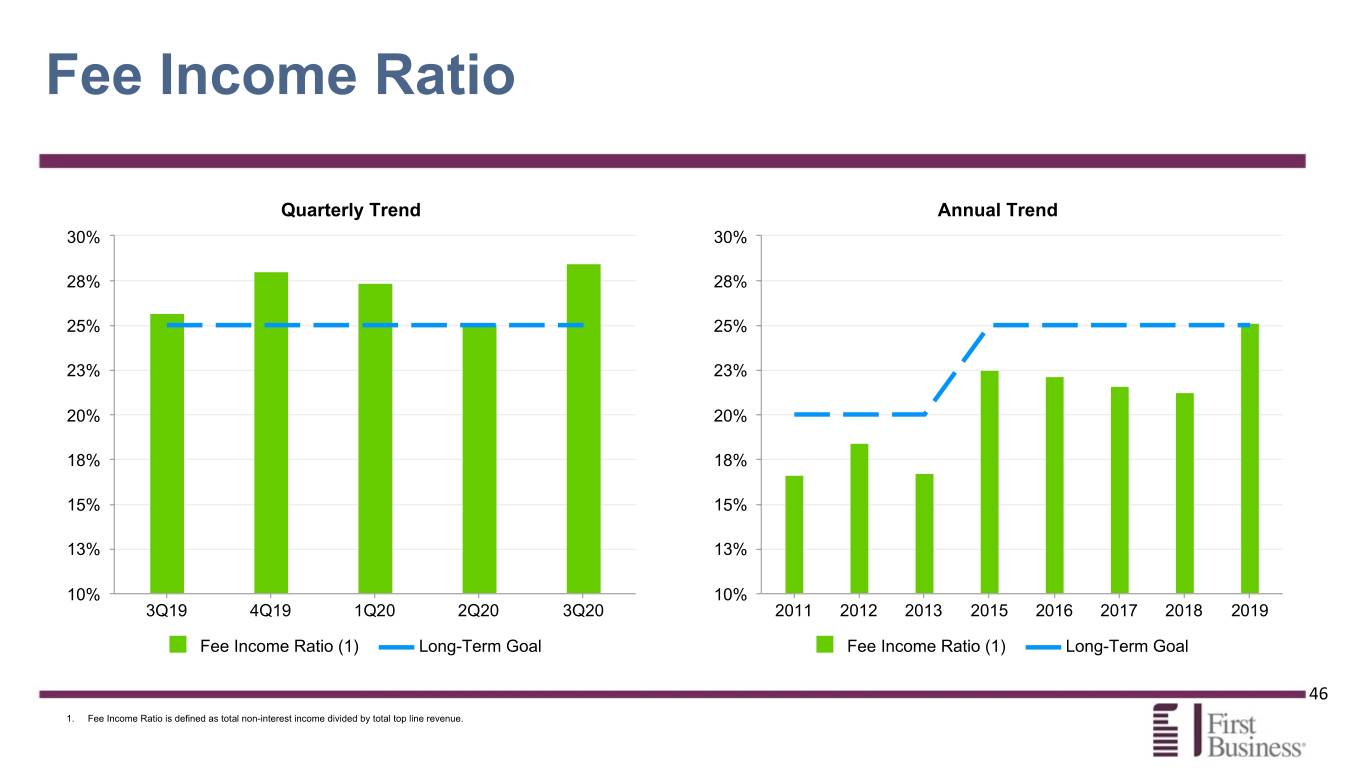
Fee Income Ratio Quarterly Trend Annual Trend 30% 30% 28% 28% 25% 25% 23% 23% 20% 20% 18% 18% 15% 15% 13% 13% 10% 10% 3Q19 4Q19 1Q20 2Q20 3Q20 2011 2012 2013 2015 2016 2017 2018 2019 Fee Income Ratio (1) Long-Term Goal Fee Income Ratio (1) Long-Term Goal 46 1. Fee Income Ratio is defined as total non-interest income divided by total top line revenue.

Efficiency Ratio Quarterly Trend Annual Trend 80% 80% 70% 70% 60% 60% 50% 50% 40% 40% 30% 30% 20% 20% 10% 10% 0% 0% 3Q19 4Q19 1Q20 2Q20 3Q20 2011 2012 2013 2015 2016 2017 2018 2019 Efficiency Ratio (1) Long-Term Goal Efficiency Ratio (1) Long-Term Goal 47 1. Efficiency ratio is a non-GAAP measure defined as total operating expense divided by total operating revenue. See appendix for non-GAAP reconciliation schedule.

In-Market Deposits / Total Bank Funding (1) Quarterly Trend Annual Trend 100% 100% 90% 90% 80% 80% 70% 70% 60% 60% 50% 50% 40% 40% 30% 30% 20% 20% 10% 10% 0% 0% 3Q19 4Q19 1Q20 2Q20 3Q20 2011 2012 2013 2015 2016 2017 2018 2019 Transaction Accounts Non-Transaction Accounts Transaction Accounts Non-Transaction Accounts Bank Wholesale Funding Bank Wholesale Funding 48 1. In-Market Deposits represents transaction accounts plus non-transaction accounts. Total bank funding represents total deposits plus FHLB advances and Federal Reserve PPPLF advances.

Loan & Deposit Composition (1) Total Gross Loans & Leases Total Deposits 36% 27% 35% 26% 1% 11% 2% 8% 2% 25% 2% 5% 13% 7% CRE NOO C&I CRE OO Money Market Accounts IB Transaction Accounts Multi-Family Construction Land Development NIB Transaction Accounts In-Market CDs Consumer & Other 1-4 Family Direct Financing Leases Wholesale deposits 49 1. Period-end balances as of September 30, 2020.

COMMERCIAL BANKING PRODUCTS & SERVICES
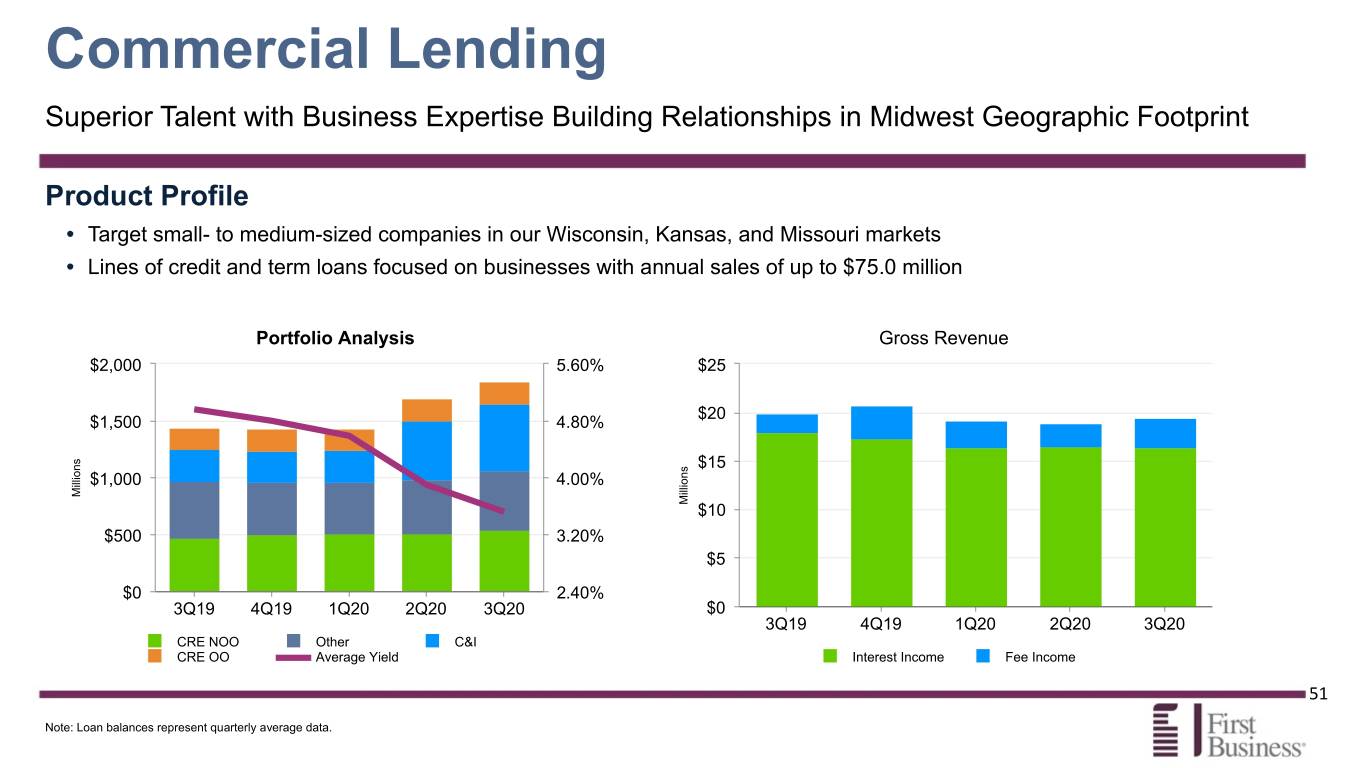
Commercial Lending Superior Talent with Business Expertise Building Relationships in Midwest Geographic Footprint Product Profile • Target small- to medium-sized companies in our Wisconsin, Kansas, and Missouri markets • Lines of credit and term loans focused on businesses with annual sales of up to $75.0 million Portfolio Analysis Gross Revenue $2,000 5.60% $25 $20 $1,500 4.80% $15 $1,000 4.00% Mi llions Mi llions $10 $500 3.20% $5 $0 2.40% 3Q19 4Q19 1Q20 2Q20 3Q20 $0 3Q19 4Q19 1Q20 2Q20 3Q20 CRE NOO Other C&I CRE OO Average Yield Interest Income Fee Income 51 Note: Loan balances represent quarterly average data.
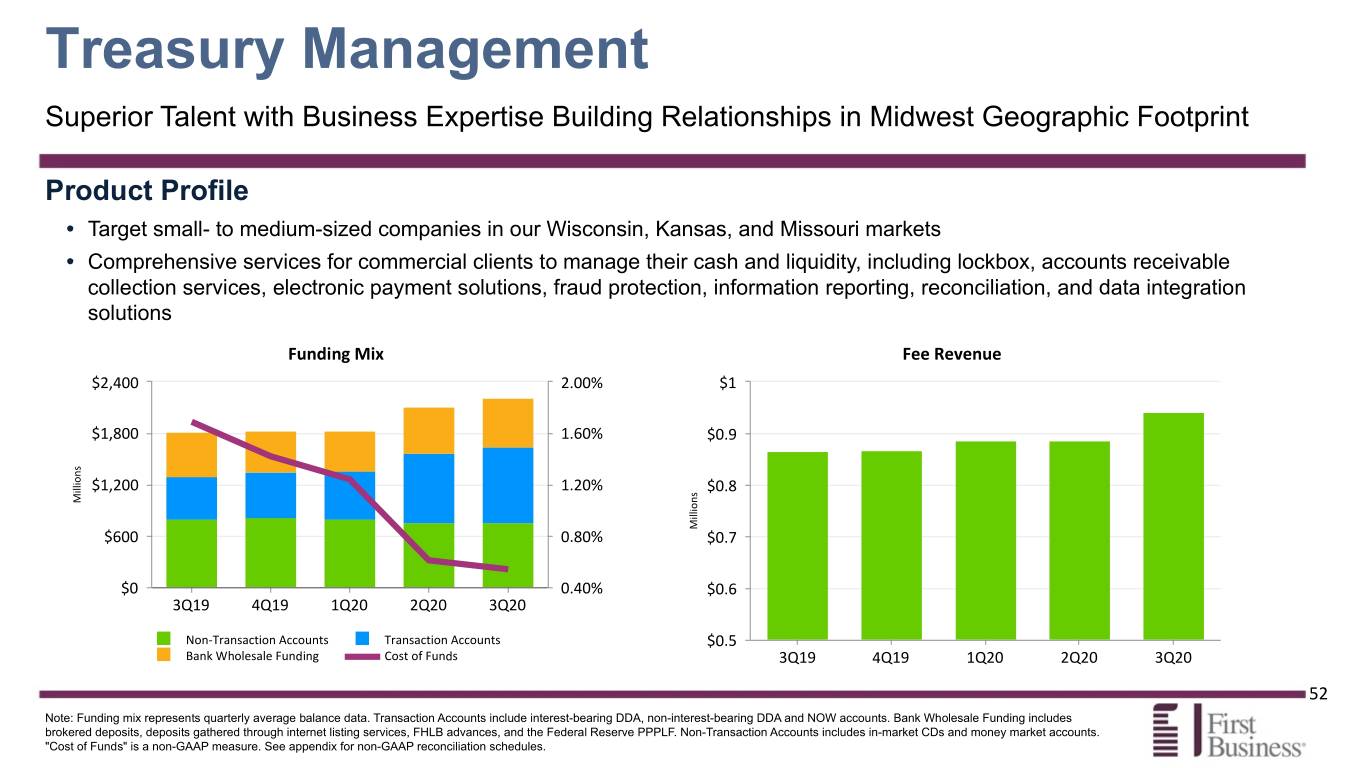
Treasury Management Superior Talent with Business Expertise Building Relationships in Midwest Geographic Footprint Product Profile • Target small- to medium-sized companies in our Wisconsin, Kansas, and Missouri markets • Comprehensive services for commercial clients to manage their cash and liquidity, including lockbox, accounts receivable collection services, electronic payment solutions, fraud protection, information reporting, reconciliation, and data integration solutions Funding Mix Fee Revenue $2,400 2.00% $1 $1,800 1.60% $0.9 $1,200 1.20% $0.8 Mi llions Mi llions $600 0.80% $0.7 $0 0.40% $0.6 3Q19 4Q19 1Q20 2Q20 3Q20 Non-Transaction Accounts Transaction Accounts $0.5 Bank Wholesale Funding Cost of Funds 3Q19 4Q19 1Q20 2Q20 3Q20 52 Note: Funding mix represents quarterly average balance data. Transaction Accounts include interest-bearing DDA, non-interest-bearing DDA and NOW accounts. Bank Wholesale Funding includes brokered deposits, deposits gathered through internet listing services, FHLB advances, and the Federal Reserve PPPLF. Non-Transaction Accounts includes in-market CDs and money market accounts. "Cost of Funds" is a non-GAAP measure. See appendix for non-GAAP reconciliation schedules.
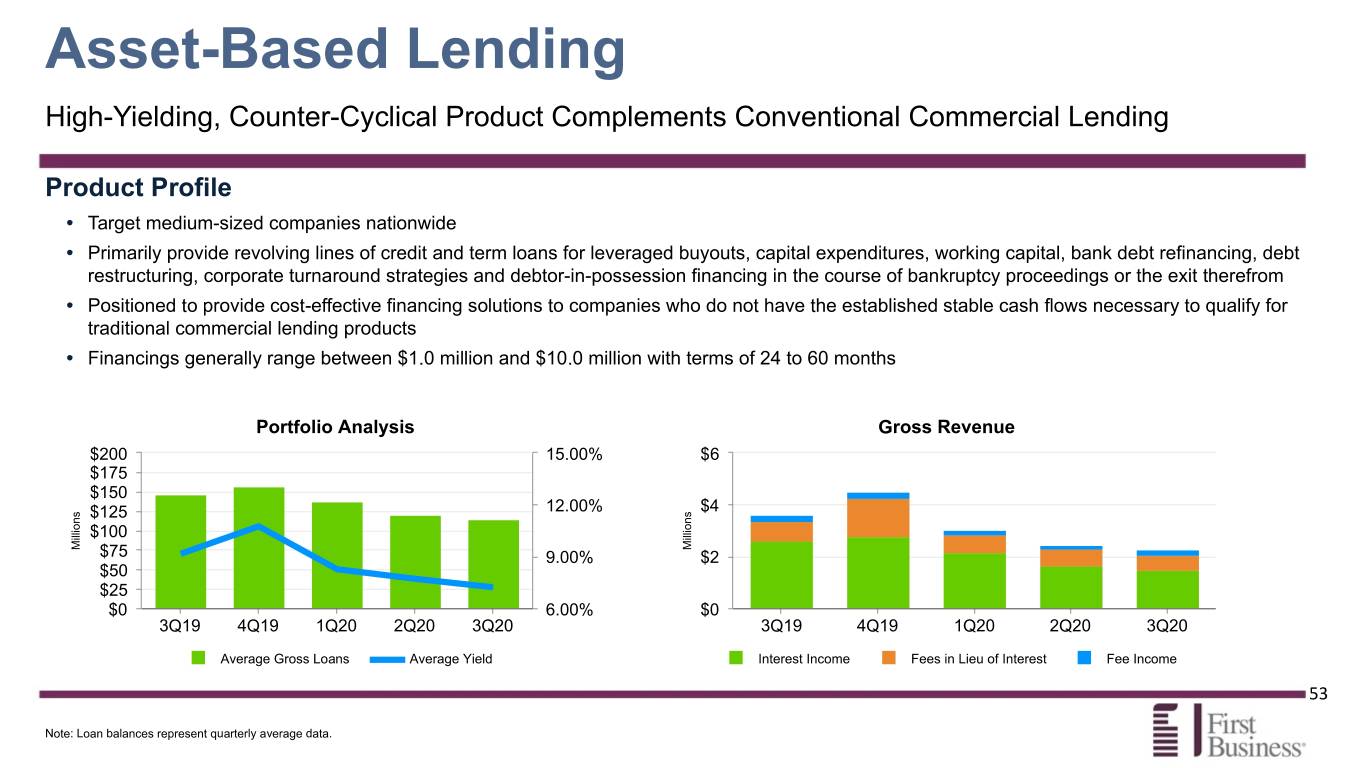
Asset-Based Lending High-Yielding, Counter-Cyclical Product Complements Conventional Commercial Lending Product Profile • Target medium-sized companies nationwide • Primarily provide revolving lines of credit and term loans for leveraged buyouts, capital expenditures, working capital, bank debt refinancing, debt restructuring, corporate turnaround strategies and debtor-in-possession financing in the course of bankruptcy proceedings or the exit therefrom • Positioned to provide cost-effective financing solutions to companies who do not have the established stable cash flows necessary to qualify for traditional commercial lending products • Financings generally range between $1.0 million and $10.0 million with terms of 24 to 60 months Portfolio Analysis Gross Revenue $200 15.00% $6 $175 $150 $125 12.00% $4 $100 Mi llions $75 Mi llions 9.00% $2 $50 $25 $0 6.00% $0 3Q19 4Q19 1Q20 2Q20 3Q20 3Q19 4Q19 1Q20 2Q20 3Q20 Average Gross Loans Average Yield Interest Income Fees in Lieu of Interest Fee Income 53 Note: Loan balances represent quarterly average data.

Accounts Receivable Financing High-Yielding, Counter-Cyclical Product Complements Conventional Commercial Lending Product Profile • Target small- to medium-sized companies nationwide • Primarily provide funding to clients by purchasing accounts receivable on a full recourse basis • Positioned to provide competitive rates to clients starting up, seeking growth, and needing cash flow support, or who are experiencing financial issues • Similar to asset-based lending, receivable financing typically generates higher yields than conventional commercial lending and complements our conventional commercial portfolio Portfolio Analysis Gross Revenue $30 14.00% $1 $25 $0.75 $20 12.00% $15 $0.5 Mi llions Mi llions $10 10.00% $0.25 $5 $0 8.00% $0 3Q19 4Q19 1Q20 2Q20 3Q20 3Q19 4Q19 1Q20 2Q20 3Q20 Average NFE Average Yield Interest Income Fees in Lieu of Interest Fee Income 54 Note: Average Net Funds Employed balances represent quarterly average data.

Equipment Financing Aligned with the Equipment Loan and Lease Needs of our Niche Client Base Product Profile • Includes broad range of equipment finance products to address the financing needs of commercial clients in a variety of industries • Focus includes manufacturing equipment, industrial assets, construction, and transportation equipment, and a wide variety of other commercial equipment • Financings generally range between $250,000 and $5.0 million with terms of 36 to 84 months (Vendor Finance Program financings are generally < $250,000) Portfolio Analysis Gross Revenue $100 5.80% $1.5 $90 $80 5.60% $70 $1 $60 $50 5.40% Mi llions $40 Mi llions $30 $0.5 5.20% $20 $10 $0 5.00% $0 3Q19 4Q19 1Q20 2Q20 3Q20 3Q19 4Q19 1Q20 2Q20 3Q20 Average Gross Loans & Leases Average Yield Interest Income Fee Income 55 Note: Loan and lease balances represent quarterly average data.

Trust / Private Wealth Wealth Management Services for Businesses, Executives, and High Net Worth Individuals Product Profile • Fiduciary and investment manager for individual and corporate clients, creating, and executing asset allocation strategies tailored to each client’s unique situation • Full fiduciary powers and offers trust, estate, financial planning, and investment services, acting in a trustee or agent capacity as well as Employee Benefit/Retirement Plan services • Also includes brokerage and custody-only services, for which we administer and safeguard assets but do not provide investment advice Assets Under Management & Administration Fee Revenue $2,500 $2.5 $2,000 $2 $1,500 Private Wealth $1.5 Employee Benefits Mi llions Other Mi llions $1,000 $1 $500 $0.5 $0 $0 3Q19 4Q19 1Q20 2Q20 3Q20 3Q19 4Q19 1Q20 2Q20 3Q20 56 Note: Total Assets Under Management & Administration represent period-end balances.

SBA Lending & Servicing Full Client Acquisition Strategy for Small Businesses Product Profile • Primarily originate variable rate term loans through the 7(a) program which typically provides a guaranty of 75% of principal and interest • Product offering is designed to generate new business opportunities by meeting the needs of clients whose borrowing needs cannot be met with conventional bank loans • Sources of revenue include interest income on the retained portion of loan, gain on sale of the guaranteed portion of loan, loan packaging fee income, and loan servicing fee income Portfolio Analysis Gross Revenue Non-accrual $200 8.00% $2 interest recovery $175 of $340K in 2Q20 $150 7.20% $1.5 $125 $100 6.40% $1 Mi llions Mi llions $75 $0.5 $50 5.60% $25 $0 $0 4.80% 3Q19 4Q19 1Q20 2Q20 3Q20 3Q19 4Q19 1Q20 2Q20 3Q20 Interest Income Gain on Sale Servicing Fees Total Retained Total Sold Average Yield Packaging Fees 57 Note: Total Retained and Total Sold represent period-end balances. Excludes PPP loans and related interest income and loan fee amortization.

NON-GAAP RECONCILIATIONS

Efficiency Ratio Non-GAAP Reconciliation “Efficiency Ratio” is a non-GAAP measure representing non-interest expense excluding the effects of the SBA recourse provision, impairment of tax credit investments, losses or gains on foreclosed properties, amortization of other intangible assets, and other discrete items, if any, divided by operating revenue, which is equal to net interest income plus non-interest income less realized gains or losses on securities, if any. We believe the efficiency ratio allows investors and analysts to better assess the Company’s operating expenses in relation to its top line revenue by removing the volatility that is associated with certain one-time and other discrete items. The information provided below reconciles the efficiency ratio to its most comparable GAAP measure. (Unaudited) For the Three Months Ended (Dollars in thousands) September 30, 2019 December 31, 2019 March 31, 2020 June 30, 2020 September 30, 2020 Non-interest expense $ 14,716 $ 16,773 $ 16,146 $ 18,343 $ 16,758 Net gain (loss) on foreclosed properties (262) 17 (102) (348) 121 Amortization of other intangible assets (11) (7) (9) (9) (9) SBA recourse (provision) benefit 427 (21) (25) 30 (57) Tax credit investment (impairment) recovery 120 (113) (113) (1,841) (113) Loss on early extinguishment of debt — — — (744) — Total operating expense $ 14,990 $ 16,649 $ 15,897 $ 15,431 $ 16,700 Net interest income $ 16,776 $ 18,474 $ 17,050 $ 18,888 $ 18,621 Non-interest income 5,792 7,189 6,414 6,319 7,408 Net loss on sale of securities 4 42 4 — — Total operating revenue $ 22,572 $ 25,705 $ 23,468 $ 25,207 $ 26,029 Efficiency ratio 66.41 % 64.77 % 67.74 % 61.22 % 64.16 % 59

Cost of Funds Non-GAAP Reconciliation ‘‘Cost of Funds’’ is defined as total interest expense on deposits, FHLB advances, and Federal Reserve PPPLF advances, divided by the sum of total average deposits, average FHLB advances, and average Federal Reserve PPPLF advances. We believe that this measure is important to many investors in the marketplace who are interested in the trends in our bank funding costs. The information provided below reconciles the cost of funds to its most comparable GAAP measure. For the Three Months Ended (Dollars in thousands) September 30, 2019 December 31, 2019 March 31, 2020 June 30, 2020 September 30, 2020 Interest expense on total interest-bearing deposits $ 6,006 $ 4,898 $ 4,116 $ 1,924 $ 1,623 Interest expense on FHLB advances 1,673 1,590 1,559 1,283 1,356 Interest expense on Federal Reserve PPPLF — — — 18 26 Total interest expense on deposits, FHLB advances, and Federal Reserve PPPLF $ 7,679 $ 6,488 $ 5,675 $ 3,225 $ 3,005 Average interest-bearing deposits $ 1,225,878 $ 1,215,862 $ 1,207,481 $ 1,235,736 $ 1,359,526 Average non-interest-bearing deposits 283,675 306,278 291,129 440,413 445,245 Average FHLB advances 307,060 304,049 325,929 409,281 379,915 Average Federal Reserve PPPLF — — — 20,821 29,605 Total average deposits, total average FHLB advances, and total average Federal Reserve PPPLF $ 1,816,613 $ 1,826,189 $ 1,824,539 $ 2,106,251 $ 2,214,291 Cost of funds 1.69 % 1.42 % 1.24 % 0.61 % 0.54 % 60

Adjusted Net Interest Margin Non-GAAP Reconciliation “Adjusted Net Interest Margin” is a non-GAAP measure representing net interest income excluding the fees in lieu of interest, PPP loan interest income, FRB interest income, FHLB dividend income, and FRB PPPLF interest expense, divided by adjusted average interest-earning assets. Fees in lieu of interest are defined as prepayment fees, asset-based loan fees, non-accrual interest, and loan fee amortization. In the judgment of the Company’s management, the adjustments made to net interest income allow investors and analysts to better assess the Company’s net interest income in relation to its core loan and deposit rate changes by removing the volatility that is associated with these recurring fees. The information provided below reconciles the net interest margin to its most comparable GAAP measure. For the Three Months Ended (Dollars in Thousands) September 30, 2019 December 31, 2019 March 31, 2020 June 30, 2020 September 30, 2020 Interest income $ 25,438 $ 25,613 $ 23,372 $ 22,761 $ 22,276 Interest expense 8,662 7,139 6,322 3,873 3,655 Net interest income (a) 16,776 18,474 17,050 18,888 18,621 Less fees in lieu of interest 1,090 1,840 798 2,257 1,511 Less PPP loan interest income — — — 647 833 Less FRB interest income and FHLB dividend income 278 208 301 134 167 Add FRB PPPLF interest expense — — — 18 26 Adjusted net interest income (b) $ 15,408 $ 16,426 $ 15,951 $ 15,868 $ 16,136 Average interest-earning assets (c) $ 1,971,696 $ 1,980,922 $ 1,981,887 $ 2,258,759 $ 2,374,891 Less Average PPP loans — — — 252,834 323,082 Less Average FRB cash and FHLB stock 42,040 34,565 37,989 69,176 33,756 Less Average non-accrual loans and leases 25,331 21,738 22,209 25,386 26,931 Adjusted average interest-earning assets (d) $ 1,904,325 $ 1,924,619 $ 1,921,689 $ 1,911,363 $ 1,991,122 Net interest margin (a / c) 3.40 % 3.73 % 3.44 % 3.34 % 3.14 % Adjusted net interest margin (b / d) 3.24 % 3.41 % 3.32 % 3.32 % 3.24 % 61

Pure Net Interest Income Non-GAAP Reconciliation "Pure Net Interest Income" is defined as net interest income less fees in lieu of interest. "Fees in Lieu of Interest" is defined as prepayment fees, asset-based loan fees, non-accrual interest, and loan fee amortization. We believe that this measure is important to many investors in the marketplace who are interested in the trends in our net interest margin. In compliance with applicable rules of the SEC, this non-GAAP measure is reconciled to net interest income, which is the most directly comparable GAAP financial measure. For the Year Ended For the Three Months Ended (Dollars in Thousands) December 31, 2017 December 31, 2018 December 31, 2019 March 31, 2020 June 30, 2020 September 30, 2020 Net interest income $ 60,609 $ 67,342 $ 69,856 $ 17,050 $ 18,888 $ 18,621 Less fees in lieu of interest 4,213 5,592 6,479 798 2,257 1,511 Pure net interest income (non-GAAP) $ 56,396 $ 61,750 $ 63,377 $ 16,252 $ 16,631 $ 17,110 62

Net Operating Income Non-GAAP Reconciliation "Net Operating Income" is a non-GAAP financial measure. We believe net operating income allows investors to better assess the Company’s operating expenses in relation to its top line revenue by removing the volatility that is associated with certain one-time and other discrete items. In compliance with applicable rules of the SEC, this non-GAAP measure is reconciled to net income, which is the most directly comparable GAAP financial measure. For the Year Ended For the Three Months Ended December 31, December 31, December 31, September 30, (Dollars in thousands) 2017 2018 2019 March 31, 2020 June 30, 2020 2020 Net income $ 11,905 $ 16,303 $ 23,324 $ 3,278 $ 3,323 $ 4,293 Less income tax (expense) benefit (2,326) (1,351) (1,175) (858) 1,928 (1,143) Less provision for loan and lease losses (6,172) (5,492) (2,085) (3,182) (5,469) (3,835) Income before taxes and provision for loan and lease losses (non-GAAP) 20,403 23,146 26,584 7,318 6,864 9,271 Less non-operating income Net loss on sale of securities (403) (4) (46) (4) — — Total non-operating income (non-GAAP) (403) (4) (46) (4) — — Less non-operating expense Net (gain) loss on foreclosed properties (143) 367 224 102 348 (121) Amortization of other intangible assets 54 47 40 9 9 9 SBA recourse provision (benefit) 2,240 1,913 188 25 (30) 57 Tax credit investment impairment 2,784 2,083 4,094 113 1,841 113 Loss on early extinguishment of debt — — — — 744 — Deconversion fees 300 — — — — — Total non-operating expense (non-GAAP) 5,235 4,410 4,546 249 2,912 58 Add net tax credit benefit (non-GAAP) 526 494 1,352 8 698 6 Net operating income $ 26,567 $ 28,054 $ 32,528 $ 7,579 $ 10,474 $ 9,335 63

