Attached files
| file | filename |
|---|---|
| 8-K - FORM 8-K - CF Industries Holdings, Inc. | tm2034735d1_8k.htm |
Exhibit 99.1
 |
1 22001270TThhirirddQQuuaarrteterr FFininaanncciaial lRReessuultlsts November 1, 2017 vember 4, 2020 NoNYSE: CF NYSE: CF 1 |
 |
All statements in this communication by CF Industries Holdings, Inc. (together with its subsidiaries, the “Company”), other t han those relating to historical facts, are forward-looking statements. Forward-looking statements can generally be identified by their use of terms such as “anticipate,” “believe,” “could,” “estimate,” “expect,” “intend,” “may,” “plan,” “predict,” “project,” “will” or “would” and similar terms and phrases, including reference s to assumptions. Forward-looking statements are not guarantees of future performance and are subject to a number of assumptions, risks and uncertainties, many of which are beyond the Company’s control, which could cause actual results to differ materially from such statements. These statements may include, but are not limited to, statements about strategic plans and management’s expectations with respect to the production of green and low-carbon ammonia, the development of carbon capture and sequestration projects, the transition to and growth of a hydrogen economy, greenhouse gas reduction targets, projected capit al expenditures, statements about future financial and operating results, and other items described in this communication. Important factors that could cause actual results to differ materially from our expectations include, but are not limited to, the failure of cost competitive global renewable energy capacity to increase si gnificantly; realization of technological improvements required to increase the efficiency and lower the costs of production of green and low-carbon ammonia; development and growth of end market demand and applications for low-carbon hydrogen and ammonia; government regulation, incentives, and initiatives; cost overruns; performance of third parties; permitting matters; and other unforeseen difficulties. Important factors that could cause actual results more generally to differ materially from those in the forward-looking statements include, among others, the impact of the novel coronavirus disease 2019 (COVID-19) pandemic, including measures taken by governmental authorities to slow the spread of the virus, on our business and operations; the cyclical nature of the Company’s business and the impact of global supply and demand on the Company’s selling prices; the global commodity nature of the Company’s fertilizer products, the conditions in the international market for nitrogen products, and the intense global competition from other fertilizer producers; conditions in the United States, Europe and other agricultural areas; the volatility of natural gas prices in North America and Europe; difficulties in securing the supply and delivery of raw materials, increases in their costs or delays or interruptions in their delivery; reliance on third party providers of transportation services and equipment; the significant risks and hazards involved in producing and handling the Company’s products against which the Company may not be fully insured; the Company’s ability to manage its indebtedness and any additional indebtedness that may be incurred; the Company's ability to maintain compliance with covenants under its revolving credit agreement and the agreements governing its indebtedness; downgrades of the Company’s credit ratings; risks associated with cyber security; weather conditions; risks associated with changes in tax laws and disagreements with taxing authorities; the Company’s reliance on a limited number of key facilities; potential liabilities and expenditures related to environmental , health and safety laws and regulations and permitting requirements; future regulatory restrictions and requirements related t o greenhouse gas emissions; risks associated with expansions of the Company’s business, including unanticipated adverse consequences and the significant resour ces that could be required; the seasonality of the fertilizer business; the impact of changing market conditions on the Company’s forward sales programs; ris ks involving derivatives and the effectiveness of the Company’s risk measurement and hedging activities; risks associated with the operation or management of the strategic venture with CHS Inc. (the "CHS Strategic Venture"), risks and uncertainties relating to the market prices of the fertilizer products that are the subject of the supply agreement with CHS Inc. over the life of the supply agreement and the risk that any challenges related to the CHS Strategic Venture will harm th e Company's other business relationships; risks associated with the Company’s Point Lisas Nitrogen Limited joint venture; acts of terrorism and regulations to combat terrorism; risks associated with international operations; and deterioration of global market and economic conditions. More detailed information about factors that may affect the Company’s performance and could cause actual results to differ materially from those in any forward-looking statements may be found in CF Industries Holdings, Inc.’s filings with the Securities and Exchange Commission, including CF Industries Holdings, Inc.’s most recent annual and quarterly report s on Form 10-K and Form 10-Q, which are available in the Investor Relations section of the Company’s website. It is not possible to predict or identify all risks and uncertainties that might affect the accuracy of our forward-looking statements and, consequently, our descriptions of such risks and uncertainties should not be con sidered exhaustive. There is no guarantee that any of the events, plans or goals anticipated by these forward-looking statements will occur, and if any of the events do occur, there is no guarantee what effect they will have on our business, results of operations, cash flows, financial condition and future prospects. Forward-looking statements are given only as of the date of this presentation and the Company disclaims any obligation to update or revise the forward-looking statements, whether as a result of new information, future events or otherwise, except as required by law. |
 |
The Company reports its financial results in accordance with U.S. generally accepted accounting principles (GAAP). Management believes that EBITDA, adjusted EBITDA, free cash flow, free cash flow to adjusted EBITDA conversion, and free cash flow yield, which are non-GAAP financial measures, provide additional meaningful information regarding the Company's performance and financial strength. Non-GAAP financial measures should be viewed in addition to, and not as an alternative for, the Company's reported results prepared in accordance with GAAP. In addition, because not all companies use identical calculations, EBITDA, adjusted EBITDA, free cash flow, and free cash flow yield included in this presentation may not be comparable to similarly titled measures of other companies. Reconciliations of EBITDA, adjusted EBITDA, free cash flow, and free cash flow yield to the most directly comparable GAAP measures are provided in the tables accompanying this presentation. EBITDA is defined as net (loss) earnings attributable to common stockholders plus interest expense - net, income taxes, and depreciation and amortization. Other adjustments include the elimination of loan fee amortization that is included in both interest and amortization, and the portion of depreciation that is included in noncontrolling interest. The Company has presented EBITDA because management uses the measure to track performance and believes that it is frequently used by securities analysts, investors and other interested parties in the evaluation of companies in the industry. Adjusted EBITDA is defined as EBITDA adjusted with the selected items included in EBITDA as summarized in the tables accompanying this presentation. The Company has presented adjusted EBITDA because management uses adjusted EBITDA, and believes it is useful to investors, as a supplemental financial measure in the comparison of year-over-year performance. Free cash flow is defined as net cash provided by operating activities, as stated in the consolidated statements of cash flows, reduced by capital expenditures and distributions to noncontrolling interest. Free cash flow to adjusted EBITDA conversion is defined as free cash flow divided by adjusted EBITDA. Free cash flow yield is defined as free cash flow divided by market value of equity (market cap). The Company has presented free cash flow, free cash flow to adjusted EBITDA conversion, and free cash flow yield because management uses these measures and believes they are useful to investors, as indications of the strength of the Company and its ability to generate cash and to evaluate the Company’s cash generation ability relative to its industry competitors. It should not be inferred that the entire free cash flow amount is available for discretionary expenditures. |
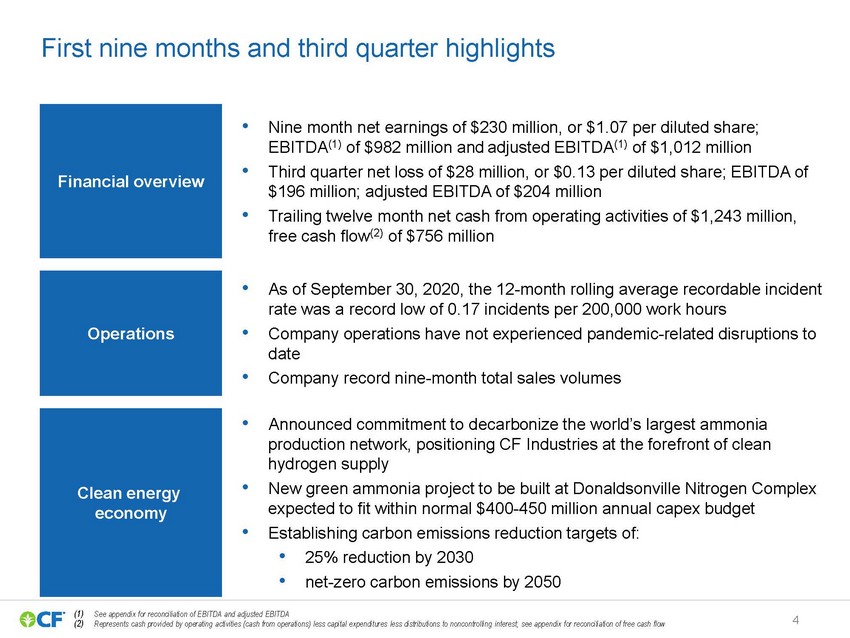 |
Financial overview •Nine month net earnings of $230 million, or $1.07 per diluted share; EBITDA(1) of $982 million and adjusted EBITDA(1) of $1,012 million •Third quarter net loss of $28 million, or $0.13 per diluted share; EBITDA of $196 million; adjusted EBITDA of $204 million •Trailing twelve month net cash from operating activities of $1,243 million, free cash flow(2) of $756 million Operations •As of September 30, 2020, the 12-month rolling average recordable incident rate was a record low of 0.17 incidents per 200,000 work hours •Company operations have not experienced pandemic-related disruptions to date •Company record nine-month total sales volumes Clean energy economy •Announced commitment to decarbonize the world’s largest ammonia production network, positioning CF Industries at the forefront of clean hydrogen supply •New green ammonia project to be built at Donaldsonville Nitrogen Complex expected to fit within normal $400-450 million annual capex budget •Establishing carbon emissions reduction targets of: •25% reduction by 2030 •net-zero carbon emissions by 2050 (1) See appendix for reconciliation of EBITDA and adjusted EBITDA (2) Represents cash provided by operating activities (cash from operations) less capital expenditures less distributions to noncontrolling interest; see appendix for reconciliation of free cash flow4 |
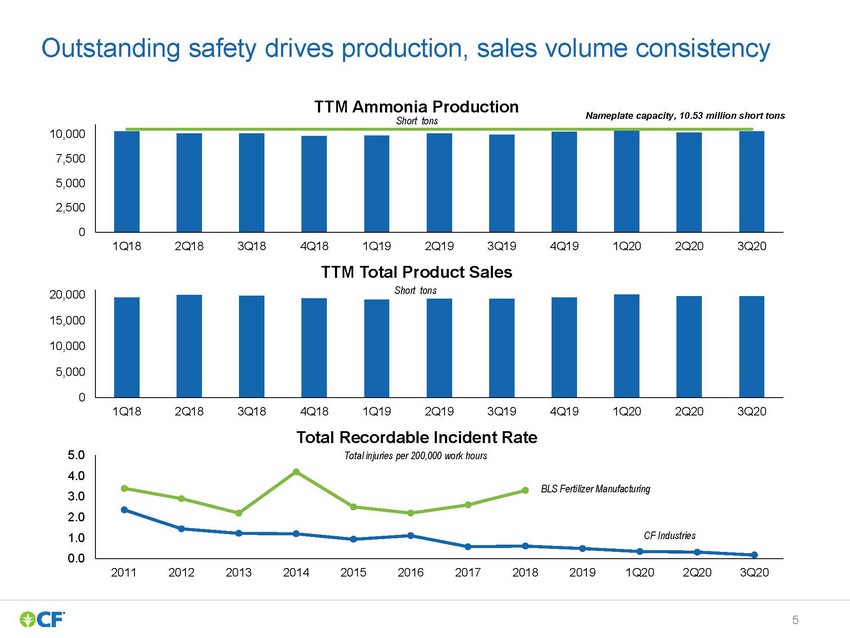 |
10,000 TTM Ammonia Production Short tonsNameplate capacity, 10.53 million short tons 7,500 5,000 2,500 0 20,000 1Q182Q183Q184Q181Q192Q193Q194Q191Q202Q203Q20 TTM Total Product Sales Short tons 15,000 10,000 5,000 0 5.0 4.0 3.0 2.0 1.0 0.0 1Q182Q183Q184Q181Q192Q193Q194Q191Q202Q203Q20 Total Recordable Incident Rate Total injuries per 200,000 work hours BLS Fertilizer Manufacturing CF Industries 2011201220132014201520162017201820191Q202Q203Q20 |
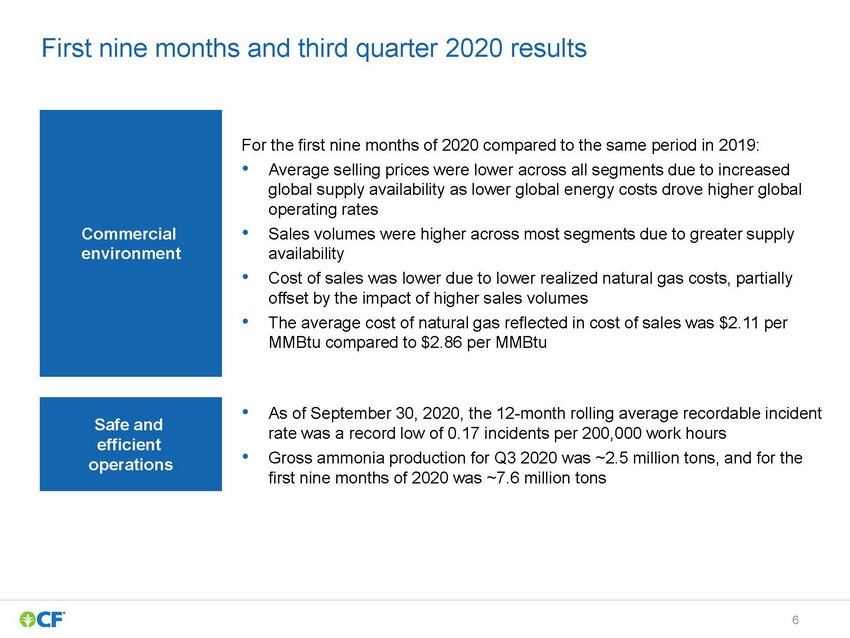 |
Commercial environment For the first nine months of 2020 compared to the same period in 2019: •Average selling prices were lower across all segments due to increased global supply availability as lower global energy costs drove higher global operating rates •Sales volumes were higher across most segments due to greater supply availability •Cost of sales was lower due to lower realized natural gas costs, partially offset by the impact of higher sales volumes •The average cost of natural gas reflected in cost of sales was $2.11 per MMBtu compared to $2.86 per MMBtu Safe and efficient operations •As of September 30, 2020, the 12-month rolling average recordable incident rate was a record low of 0.17 incidents per 200,000 work hours •Gross ammonia production for Q3 2020 was ~2.5 million tons, and for the first nine months of 2020 was ~7.6 million tons |
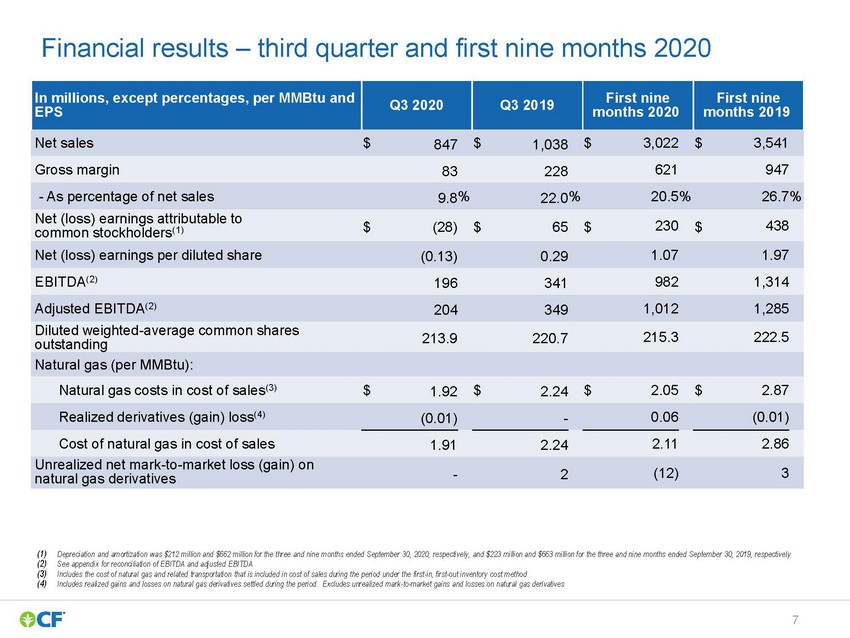 |
(1) Depreciation and amortization was $212 million and $662 million for the three and nine months ended September 30, 2020, respectively, and $223 million and $663 million for the three and nine months ended September 30, 2019, respectively (2) See appendix for reconciliation of EBITDA and adjusted EBITDA (3) Includes the cost of natural gas and related transportation that is included in cost of sales during the period under the first-in, first-out inventory cost method (4) Includes realized gains and losses on natural gas derivatives settled during the period. Excludes unrealized mark -to-market gains and losses on natural gas derivatives |
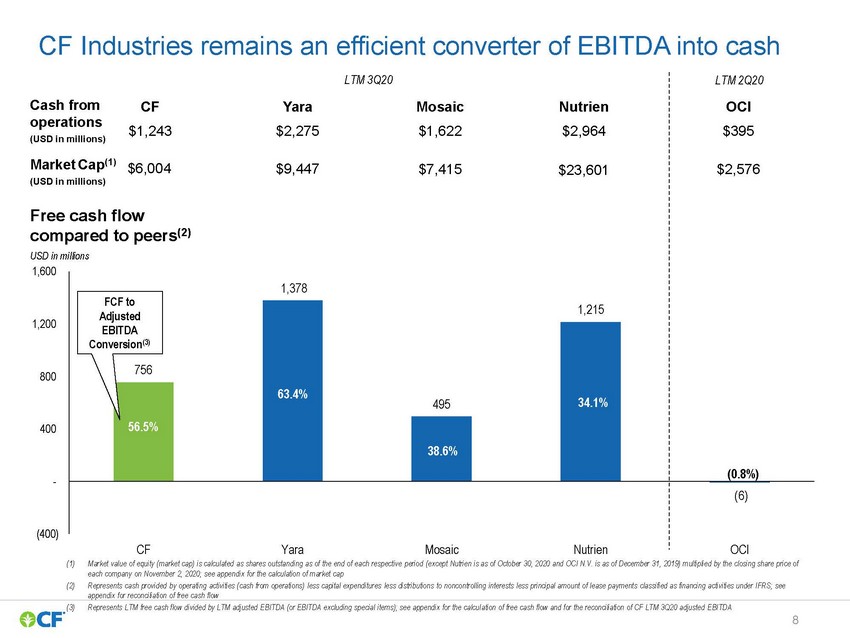 |
CF Industries remains an efficient converter of EBITDA into cash (USD in millions) Free cash flow compared to peers(2) USD in millions 1,600 FCF to 1,378 1,215 1,200 800 400 - Adjusted EBITDA Conversion(3) 756 56.5% 63.4% 495 38.6% 34.1% (0.8%) (6) (400) CFYaraMosaicNutrienOCI (1)Market value of equity (market cap) is calculated as shares outstanding as of the end of each respective period (except Nutrien is as of October 30, 2020 and OCI N.V. is as of December 31, 2019) multiplied by the closing share price of each company on November 2, 2020; see appendix for the calculation of market cap (2)Represents cash provided by operating activities (cash from operations) less capital expenditures less distributions to noncontrolling interests less principal amount of lease payments classified as financing activities under IFRS; see appendix for reconciliation of free cash flow (3)Represents LTM free cash flow divided by LTM adjusted EBITDA (or EBITDA excluding special items); see appendix for the calcul ation of free cash flow and for the reconciliation of CF LTM 3Q20 adjusted EBITDA |
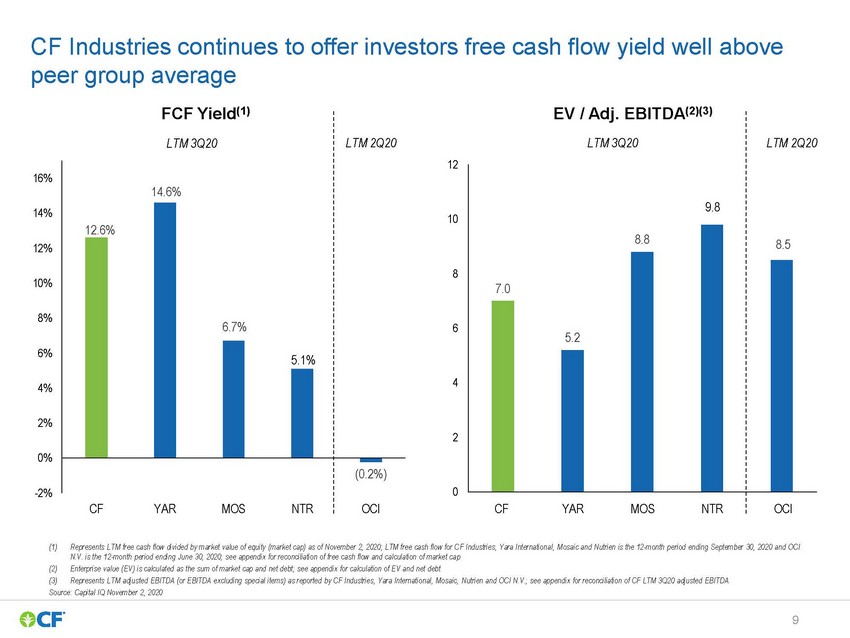 |
CF Industries continues to offer investors free cash flow yield well above peer group average FCF Yield(1) EV / Adj. EBITDA(2)(3) 16% 14% 12.6% LTM 3Q20 14.6% LTM 2Q20 12 10 LTM 3Q20 9.8 LTM 2Q20 12% 8.88.5 10% 8 7.0 8% 6.7% 6% 4% 5.1% 6 5.2 4 2% 0% -2% (0.2%) CFYARMOSNTROCI 2 0 CFYARMOSNTROCI (1)Represents LTM free cash flow divided by market value of equity (market cap) as of November 2, 2020; LTM free cash flow for C F Industries, Yara International, Mosaic and Nutrien is the 12-month period ending September 30, 2020 and OCI N.V. is the 12-month period ending June 30, 2020; see appendix for reconciliation of free cash flow and calculation of market cap (2)Enterprise value (EV) is calculated as the sum of market cap and net debt; see appendix for calculation of EV and net debt (3)Represents LTM adjusted EBITDA (or EBITDA excluding special items) as reported by CF Industries, Yara International, Mosaic, Nutrien and OCI N.V.; see appendix for reconciliation of CF LTM 3Q20 adjusted EBITDA Source: Capital IQ November 2, 2020 |
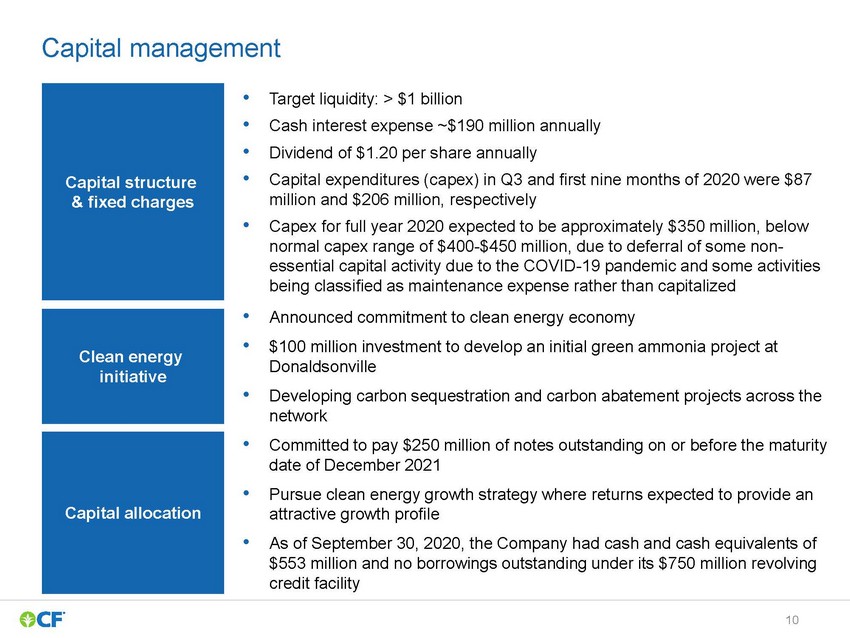 |
Capital structure & fixed charges Clean energy initiative Capital allocation •Target liquidity: > $1 billion •Cash interest expense ~$190 million annually •Dividend of $1.20 per share annually •Capital expenditures (capex) in Q3 and first nine months of 2020 were $87 million and $206 million, respectively •Capex for full year 2020 expected to be approximately $350 million, below normal capex range of $400-$450 million, due to deferral of some non-essential capital activity due to the COVID-19 pandemic and some activities being classified as maintenance expense rather than capitalized •Announced commitment to clean energy economy •$100 million investment to develop an initial green ammonia project at Donaldsonville •Developing carbon sequestration and carbon abatement projects across the network •Committed to pay $250 million of notes outstanding on or before the maturity date of December 2021 •Pursue clean energy growth strategy where returns expected to provide an attractive growth profile •As of September 30, 2020, the Company had cash and cash equivalents of $553 million and no borrowings outstanding under its $750 million revolving credit facility |
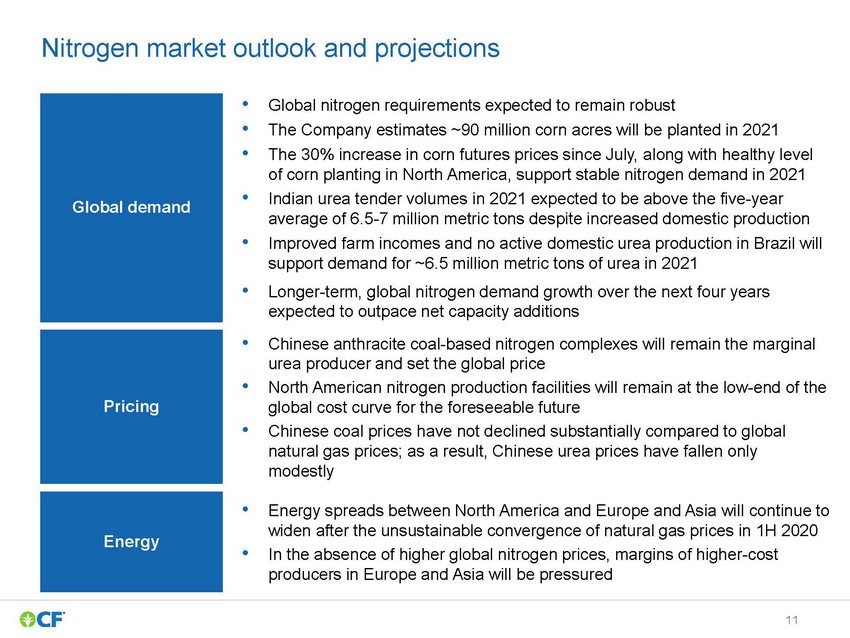 |
Global demand Pricing Energy •Global nitrogen requirements expected to remain robust •The Company estimates ~90 million corn acres will be planted in 2021 •The 30% increase in corn futures prices since July, along with healthy level of corn planting in North America, support stable nitrogen demand in 2021 •Indian urea tender volumes in 2021 expected to be above the five-year average of 6.5-7 million metric tons despite increased domestic production •Improved farm incomes and no active domestic urea production in Brazil will support demand for ~6.5 million metric tons of urea in 2021 •Longer-term, global nitrogen demand growth over the next four years expected to outpace net capacity additions •Chinese anthracite coal-based nitrogen complexes will remain the marginal urea producer and set the global price •North American nitrogen production facilities will remain at the low-end of the global cost curve for the foreseeable future •Chinese coal prices have not declined substantially compared to global natural gas prices; as a result, Chinese urea prices have fallen only modestly •Energy spreads between North America and Europe and Asia will continue to widen after the unsustainable convergence of natural gas prices in 1H 2020 •In the absence of higher global nitrogen prices, margins of higher-cost producers in Europe and Asia will be pressured |
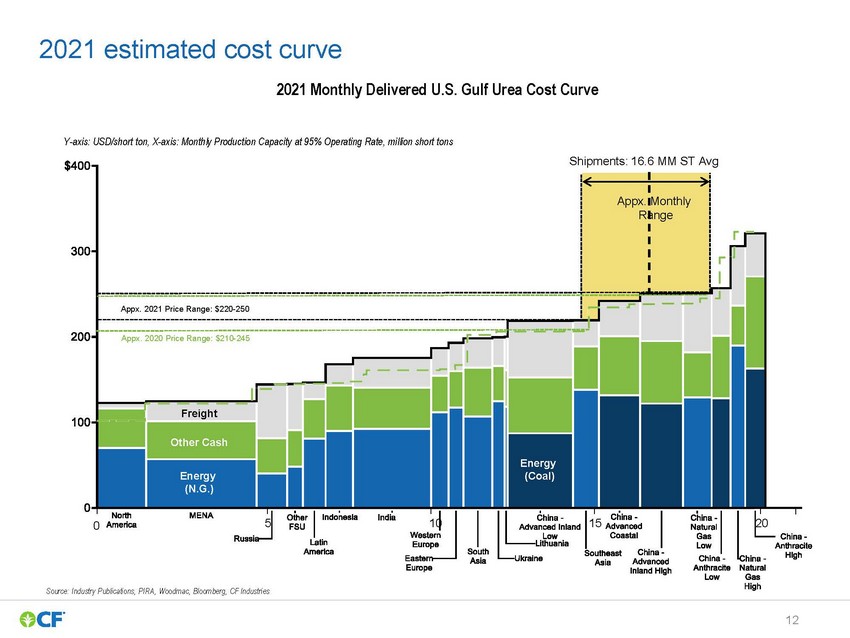 |
2021 estimated cost curve 2021 Monthly Delivered U.S. Gulf Urea Cost Curve Y-axis: USD/short ton, X-axis: Monthly Production Capacity at 95% Operating Rate, million short tons Shipments: 16.6 MM ST Avg Appx. Monthly Range Appx. 2021 Price Range: $220-250 Appx. 2020 Price Range: $210-245 Freight Other Cash Energy (N.G.) Energy (Coal) 05101520 Source: Industry Publications, PIRA, Woodmac, Bloomberg, CF Industries 12 |
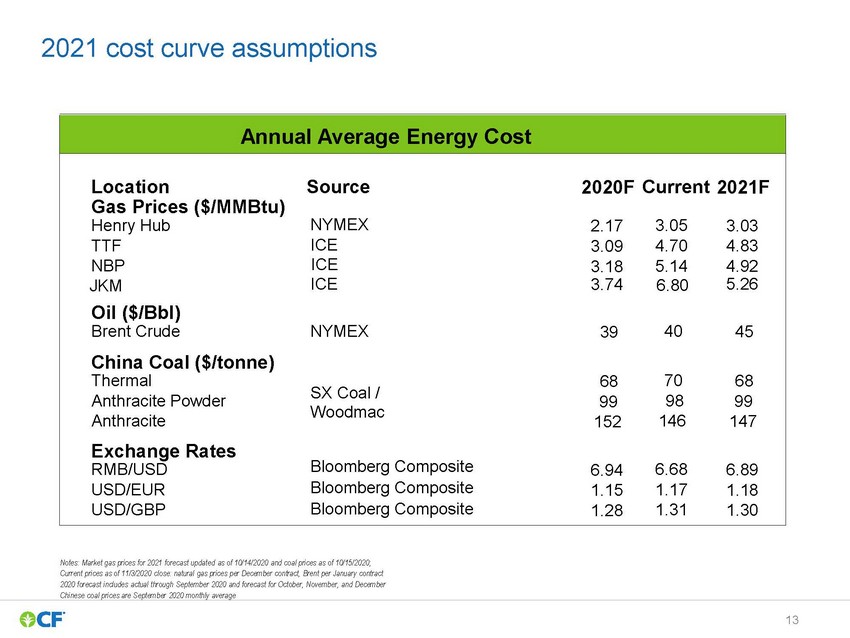 |
2021 cost curve assumptions Annual Average Energy Cost Location Gas Prices ($/MMBtu) Henry Hub TTF NBP Source NYMEX ICE ICE 2020F 2.17 3.09 3.18 Current 3.05 4.70 5.14 2021F 3.03 4.83 4.92 JKMICE3.74 Oil ($/Bbl) 6.80 5.26 Brent Crude China Coal ($/tonne) NYMEX 394045 Thermal687068 Anthracite Powder Anthracite Exchange Rates RMB/USD USD/EUR SX Coal / Woodmac Bloomberg Composite Bloomberg Composite 99 152 6.94 1.15 98 146 6.68 1.17 99 147 6.89 1.18 USD/GBP Bloomberg Composite1.28 1.31 1.30 Notes: Market gas prices for 2021 forecast updated as of 10/14/2020 and coal prices as of 10/15/2020; Current prices as of 11/3/2020 close: natural gas prices per December contract, Brent per January contract 2020 forecast includes actual through September 2020 and forecast for October, November, and December Chinese coal prices are September 2020 monthly average |
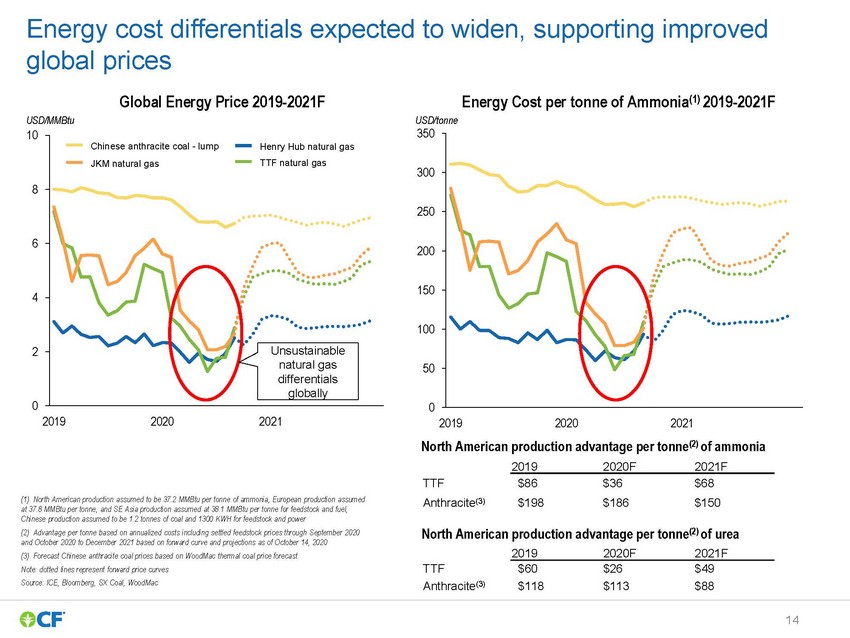 |
Energy cost differentials expected to widen, supporting improved global prices USD/MMBtu 10 Global Energy Price 2019-2021F USD/tonne 350 Energy Cost per tonne of Ammonia(1) 2019-2021F Chinese anthracite coal - lump JKM natural gas 8 6 Henry Hub natural gas TTF natural gas 300 250 200 4150 2Unsustainable natural gas differentials globally 0 201920202021 100 50 0 201920202021 (1) North American production assumed to be 37.2 MMBtu per tonne of ammonia, European production assumed at 37.8 MMBtu per tonne, and SE Asia production assumed at 38.1 MMBtu per tonne for feedstock and fuel, Chinese production assumed to be 1.2 tonnes of coal and 1300 KWH for feedstock and power (2) Advantage per tonne based on annualized costs including settled feedstock prices through September 2020 and October 2020 to December 2021 based on forward curve and projections as of October 14, 2020 (3) Forecast Chinese anthracite coal prices based on WoodMac thermal coal price forecast Note: dotted lines represent forward price curves Source: ICE, Bloomberg, SX Coal, WoodMac North American production advantage per tonne(2) of ammonia 2019 2020F 2021F TTF$86$36$68 Anthracite(3)$198$186$150 North American production advantage per tonne(2) of urea TTF $60 $26 $49 Anthracite(3) $118 $113 $88 |
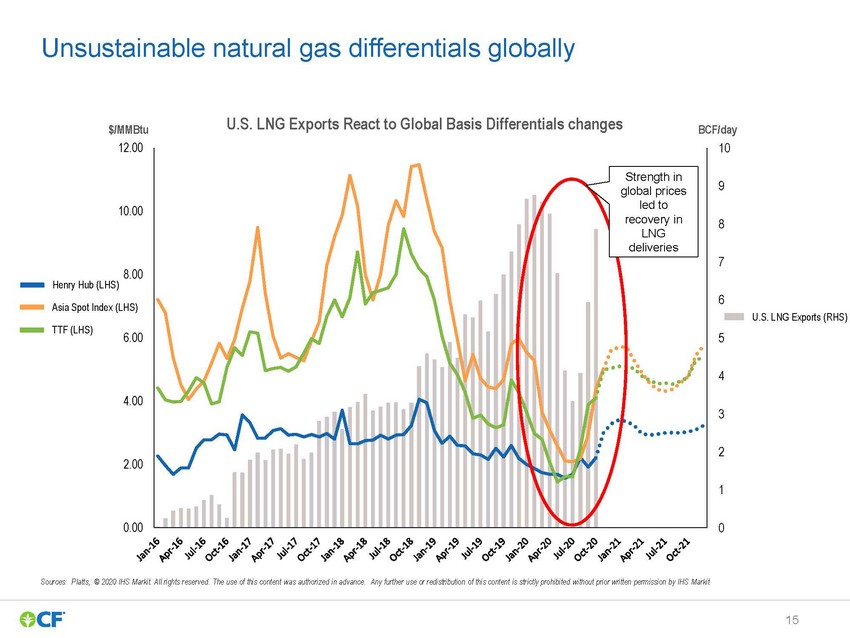 |
Unsustainable natural gas differentials globally $/MMBtuU.S. LNG Exports React to Global Basis Differentials changes 12.00 BCF/day 10 10.00 8.00 Strength in global prices9 led to recovery in8 LNG deliveries 7 Henry Hub (LHS) Asia Spot Index (LHS) TTF (LHS) 6.00 6 U.S. LNG Exports (RHS) 5 4 4.00 3 2 2.00 1 0.000 Sources: Platts,: © 2020 IHS Markit. All rights reserved. The use of this content was authorized in advance. Any further use or redistribution of this content is str ictly prohibited without prior written permission by IHS Markit |
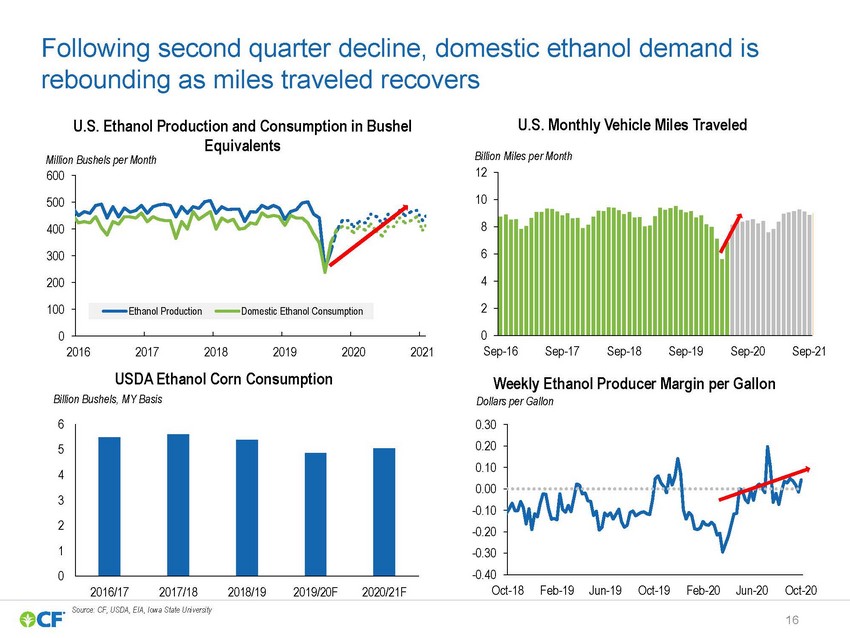 |
Following second quarter decline, domestic ethanol demand is rebounding as miles traveled recovers U.S. Ethanol Production and Consumption in Bushel Equivalents Million Bushels per Month 600 500 400 300 200 U.S. Monthly Vehicle Miles Traveled Billion Miles per Month 12 10 8 6 4 100 0 Ethanol ProductionDomestic Ethanol Consumption 201620172018201920202021 USDA Ethanol Corn Consumption 2 0 Sep-16Sep-17Sep-18Sep-19Sep-20Sep-21 Weekly Ethanol Producer Margin per Gallon Billion Bushels, MY Basis 6 5 4 3 2 1 0 Dollars per Gallon 0.30 0.20 0.10 0.00 -0.10 -0.20 -0.30 -0.40 2016/17 2017/18 2018/19 2019/20F 2020/21F Oct-18Feb-19Jun-19Oct-19Feb-20Jun-20Oct-20 Source: CF, USDA, EIA, Iowa State University |
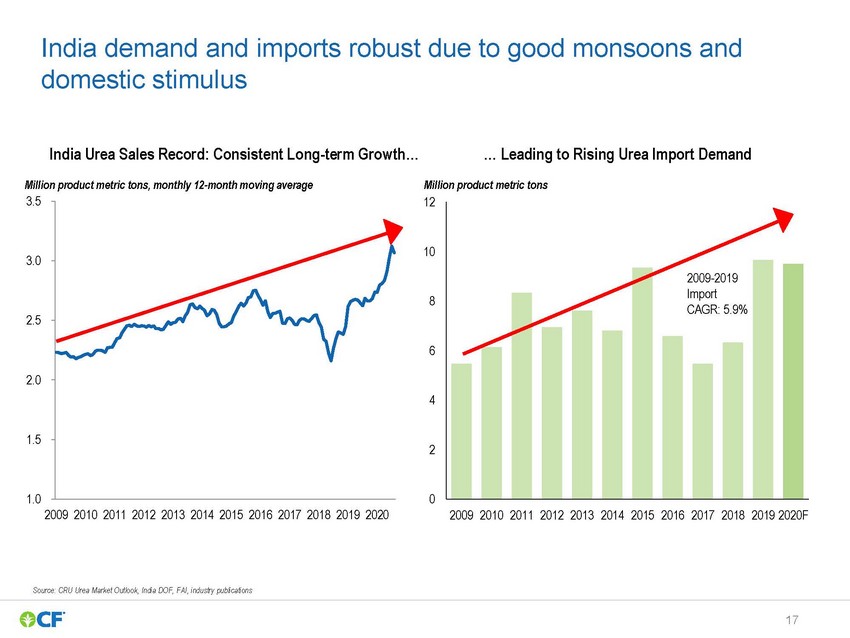 |
India demand and imports robust due to good monsoons and domestic stimulus India Urea Sales Record: Consistent Long-term Growth… … Leading to Rising Urea Import Demand Million product metric tons, monthly 12-month moving average 3.5 Million product metric tons 12 3.0 2.5 10 2009-2019 8Import CAGR: 5.9% 6 2.0 4 1.5 2 1.0 2009 2010 2011 2012 2013 2014 2015 2016 2017 2018 2019 2020 0 2009 2010 2011 2012 2013 2014 2015 2016 2017 2018 2019 2020F Source: CRU Urea Market Outlook, India DOF, FAI, industry publications |
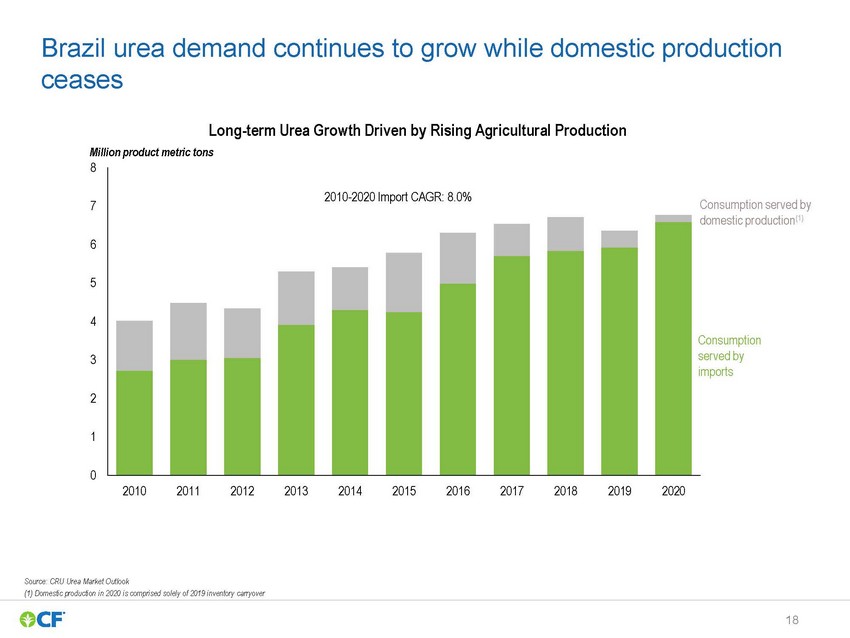 |
Brazil urea demand continues to grow while domestic production ceases Long-term Urea Growth Driven by Rising Agricultural Production Million product metric tons 8 2010-2020 Import CAGR: 8.0% 7 6 Consumption served by domestic production(1) 5 4 Consumption 3served by imports 2 1 0 20102011201220132014201520162017201820192020 Source: CRU Urea Market Outlook (1) Domestic production in 2020 is comprised solely of 2019 inventory carryover |
 |
Do It / Right! |
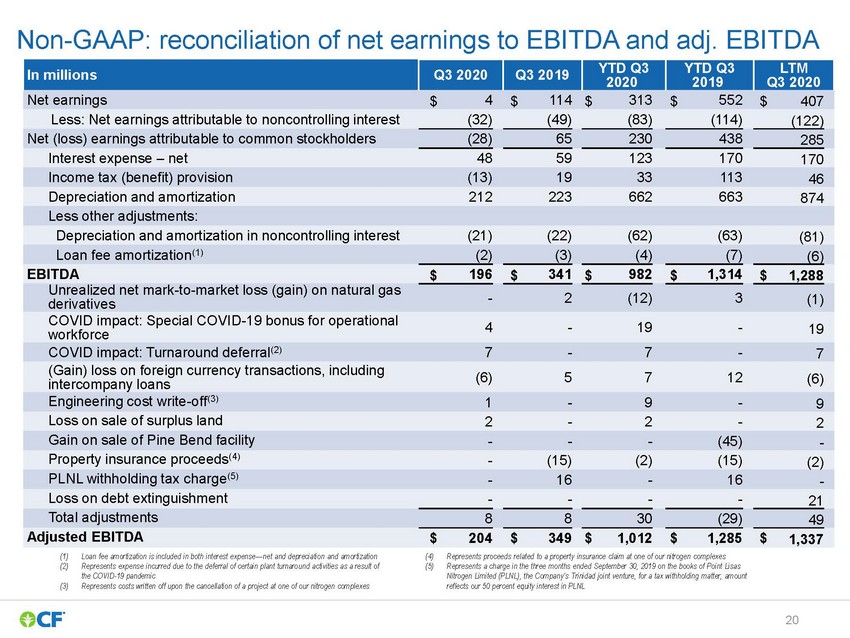 |
Non-GAAP: reconciliation of net earnings to EBITDA and adj. EBITDA (1)Loan fee amortization is included in both interest expense—net and depreciation and amortization (2)Represents expense incurred due to the deferral of certain plant turnaround activities as a result of the COVID-19 pandemic (3)Represents costs written off upon the cancellation of a project at one of our nitrogen complexes (4)Represents proceeds related to a property insurance claim at one of our nitrogen complexes (5)Represents a charge in the three months ended September 30, 2019 on the books of Point Lisas Nitrogen Limited (PLNL), the Company’s Trinidad joint venture, for a tax withholding matter; amount reflects our 50 percent equity interest in PLNL |
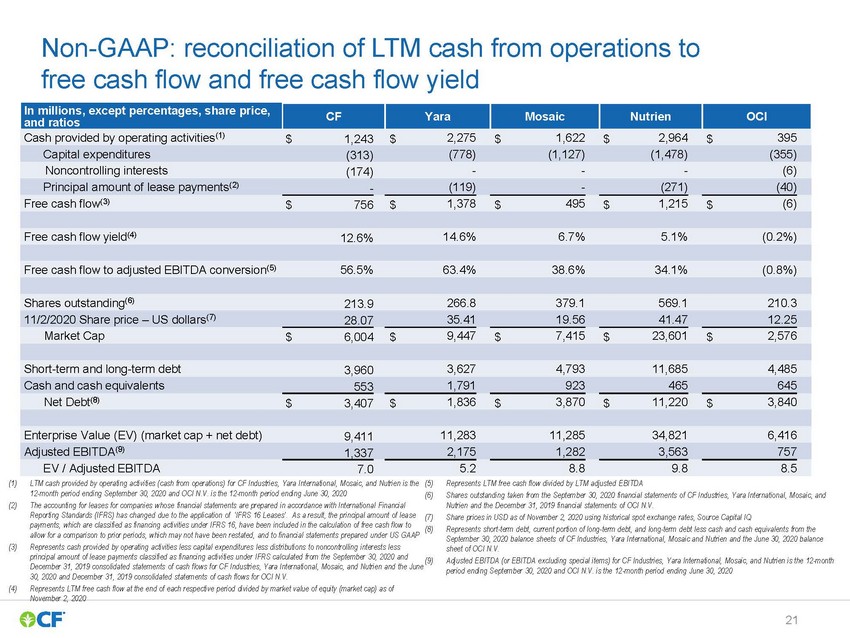 |
Non-GAAP: reconciliation of LTM cash from operations to free cash flow and free cash flow yield (1)LTM cash provided by operating activities (cash from operations) for CF Industries, Yara International, Mosaic, and Nutrien is the 12-month period ending September 30, 2020 and OCI N.V. is the 12-month period ending June 30, 2020 (2)The accounting for leases for companies whose financial statements are prepared in accordance with International Financial Reporting Standards (IFRS) has changed due to the application of ‘IFRS 16 Leases’. As a result, the principal amount of lease payments, which are classified as financing activities under IFRS 16, have been included in the calculation of free cash flow to allow for a comparison to prior periods, which may not have been restated, and to financial statements prepared under US GAAP (3)Represents cash provided by operating activities less capital expenditures less distributions to noncontrolling interests less principal amount of lease payments classified as financing activities under IFRS calculated from the September 30, 2020 and December 31, 2019 consolidated statements of cash flows for CF Industries, Yara International, Mosaic, and Nutrien and the June 30, 2020 and December 31, 2019 consolidated statements of cash flows for OCI N.V. (4)Represents LTM free cash flow at the end of each respective period divided by market value of equity (market cap) as of (5)Represents LTM free cash flow divided by LTM adjusted EBITDA (6)Shares outstanding taken from the September 30, 2020 financial statements of CF Industries, Yara International, Mosaic, and Nutrien and the December 31, 2019 financial statements of OCI N.V. (7)Share prices in USD as of November 2, 2020 using historical spot exchange rates, Source Capital IQ (8)Represents short-term debt, current portion of long-term debt, and long-term debt less cash and cash equivalents from the September 30, 2020 balance sheets of CF Industries, Yara International, Mosaic and Nutrien and the June 30, 2020 balance sheet of OCI N.V. (9)Adjusted EBITDA (or EBITDA excluding special items) for CF Industries, Yara International, Mosaic, and Nutrien is the 12-month period ending September 30, 2020 and OCI N.V. is the 12-month period ending June 30, 2020 November 2, 2020 |
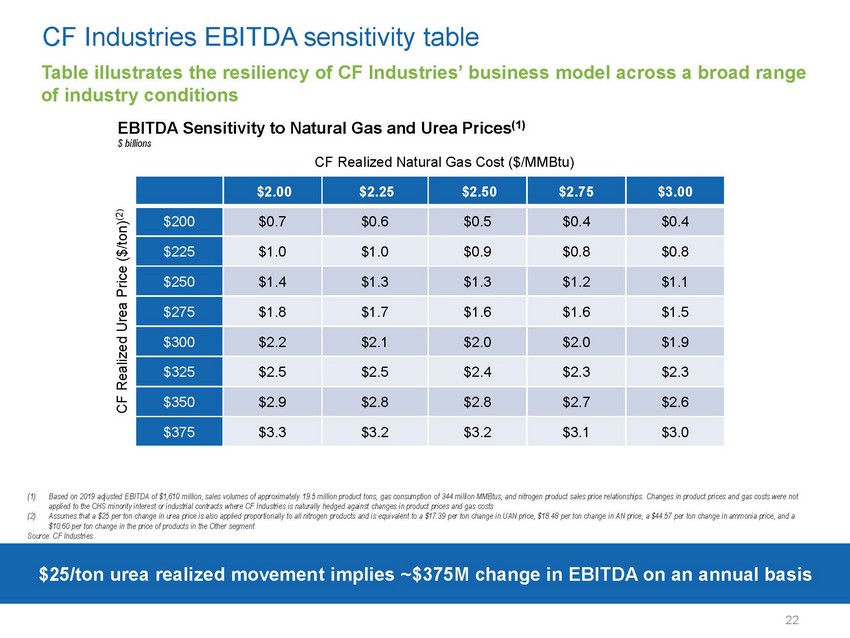 |
CF Industries EBITDA sensitivity table Table illustrates the resiliency of CF Industries’ business model across a broad range of industry conditions EBITDA Sensitivity to Natural Gas and Urea Prices(1) $ billions CF Realized Urea Price ($/ton)(2) (1)Based on 2019 adjusted EBITDA of $1,610 million, sales volumes of approximately 19.5 million product tons, gas consumption of 344 million MMBtus, and nitrogen product sales price relationships. Changes in product prices and gas costs were not applied to the CHS minority interest or industrial contracts where CF Industries is naturally hedged against changes in product prices and gas costs (2)Assumes that a $25 per ton change in urea price is also applied proportionally to all nitrogen products and is equivalent to a $17.39 per ton change in UAN price, $18.48 per ton change in AN price, a $44.57 per ton change in ammonia price, and a $10.60 per ton change in the price of products in the Other segment Source: CF Industries $25/ton urea realized movement implies ~$375M change in EBITDA on an annual basis |