Attached files
| file | filename |
|---|---|
| 8-K - FORM 8-K - American Finance Trust, Inc | tm2034934d1_8k.htm |
Exhibit 99.1
November 2020 Third Quarter 2020 Investor Presentation (NASDAQ: AFIN)

American Finance Trust, Inc. Q3 2020 COMPANY HIGHLIGHTS Service - Oriented Retail Focus AFIN’s portfolio consists of 70% Service Retail or Experiential Retail tenants that are more resistant to e - commerce vs. Traditional Retail (1) High Portfolio Occupancy 94% portfolio Occupancy (1) with a balance of Service Retail (1) single - tenant assets featuring long - term leases and retail centers focused on Experiential Retail (1) tenants High - Quality Portfolio 80 % of top - ten tenants are actual or implied Investment Grade (1) Strong Balance Sheet Liquidity (1) of $151 million with Net Leverage (1) of 42.0% and weighted average debt maturity of 5.0 years Robust Acquisition Program Robust acquisition program of $157 million closed year - to - date (2) featuring 1.7% weighted average annual Rent Escalators (1) Substantial Rent Collection AFIN received 92% of third quarter Cash Rent (1) due, including over 97% of Cash Rent due from our top 20 tenants (3) 1) See Definitions in the appendix for a full description. 2) See slide 9 for additional information. 3) See slides 6 and 8 for additional information. 2

80% 20% 45% 11% 10% 34% 82% 13% 5% 49% 10% 10% 31% American Finance Trust, Inc. $3.9 billion portfolio of high - quality, mostly Investment Grade rated tenants featuring contractually embedded rental income growth 1) See Definitions in the appendix for a full description. 2) Based on annualized straight - line rent as of the respective quarter end. For Q3 2020, ratings information as of September 30, 20 20. AFIN’s top 10 tenants were 72% actual Investment Grade rated and 8% implied Investment Grade. For Q3 2019, ratings information is as of September 30, 20 19. AFIN’s top 10 tenants were 54% actual investment grade rated and 28% implied investment grade. Portfolio Metrics Q3 2020 Q3 2019 Real Estate Investments, at cost $3.9 billion $3.8 billion Number of Properties 885 771 Square Feet (SF) 19.0 million 18.2 million Annualized Straight Line Rent (1) (SLR) $274 million $264 million Occupancy (%) 94.2% 95.2% Executed Occupancy (1) (%) 94.3% 95.6% Weighted Average Remaining Lease Term (1) 8.8 Years 8.9 Years Weighted Average Annual Rent Escalator 1.2% 1.3% BEST - IN - CLASS PORTFOLIO Annualized Straight - Line Rent by Industry 3 Q3’19 $264 million Q3’20 $274 million Single - Tenant Retail Distribution Office Multi - Tenant Retail Investment Grade % (Top Ten Tenants) (2) Investment Grade Non - Investment Grade Not Rated Q3’20 Q3’19

American Finance Trust, Inc. 4 QUARTERLY HIGHLIGHTS – Q3 2020 Substantial Rent Collection (1) Robust Acquisition Program (3) ▪ Year - to - date, AFIN has acquired 72 single - tenant properties for $157 million at a 8.4% weighted average Cap Rate (4) . ▪ Acquisition pipeline of $63 million, focused on service oriented single - tenant retail assets. ▪ Total closed and pipeline acquisitions of $220 million with a weighted average Cash Cap Rate (4) of 7.9% and a weighted average Cap Rate of 8.6%. AFIN continues to receive substantial Cash Rent throughout the COVID - 19 pandemic while enhancing its superior portfolio of high - quality Necessity - Based (4) real estate assets ▪ AFIN’s rigorous underwriting and focus on credit worthy tenants continues to result in substantial rent collection with 92% of third quarter Cash Rent collected. ▪ Collected over 97% of third quarter Cash Rent due from our top 20 tenants. ▪ Collected 97% of third quarter Cash Rent due from our single - tenant portfolio. ▪ Continued rent collection success into the fourth quarter with 94% of October Cash Rent collected. ▪ Since 2017, AFIN’s redeployment initiative has accretively recycled assets through the disposition of 96 single - tenant properties with a weighted average Remaining Lease Term of 6 years (5) and the acquisition of 495 single - tenant properties with a weighted average Remaining Lease Term of 16 years. ▪ Multi - tenant Occupancy of 85.9% and Executed Occupancy of 86.1%. ▪ Multi - tenant Leasing Pipeline (4) of 14 new leases with executed letters of intent for nearly 121,000 square feet. 1) As of October 31, 2020. Refer to slides 5 and 7 for additional information. 2) Refer to slides 5 and 17 for additional information. 3) Refer to slide 9 for additional information. 4) See Definitions in the appendix for a full description. 5) Refer to slide 10 for additional information. Portfolio Enhancement Strong Balance Sheet ▪ AFIN is focused on maintaining ample Liquidity (3) and prudent leverage throughout COVID - 19 pandemic. ▪ In the third quarter, AFIN completed a $715 million CMBS refinancing at a 3.79% effective interest rate and a $125 million refinancing of the Company’s Sanofi CMBS debt at a 3.27% effective interest rate. ▪ The combined refinancings extended AFIN’s weighted average debt maturity from 3.3 to 5.0 years (2) .

$840 MILLION QUARTERLY REFINANCINGS 5 In the AFIN completed a refinancing of the Company’s $497 million loan with two-months until maturity, and certain properties on the Company’s credit facility, with a new $715 million CMBS loan x The CMBS Loan is secured by 368 single-tenant properties, 223 of which were properties previously collateralized on the prior CMBS loan, 144 properties previously on the Company’s credit facility, and one previously unencumbered property x Effective interest rate of 3.79% as compared to 4.36% on the prior CMBS loan x AFIN also refinanced a $125 Million CMBS Loan with a four-month maturity into a new, five-year syndicated bank balance sheet loan at a lower interest rate x The Loan is secured by three buildings leased to Sanofi, a multinational, investment-grade pharmaceutical company. The property serves as a mission critical campus to Sanofi’s United States operations x Effective interest rate of 3.27% as compared to 5.16% on the prior loan x Collectively, the refinancings represent over $840 million of near-term maturing debt that also extended the Company’s weighted average debt maturity from 3.3 to 5.0 years x AFIN leveraged the Company’s long-standing relationship with its banking partners to ensure superior execution and pricing during the COVID-19 global pandemic $840 Million Refinancings Pushed 45% of Debt Maturities Past 2024(2) Prior to Refinancings (as of June 30, 2020) Post Refinancings (as of September 30, 2020) Weighted Average Debt Maturity (Portfolio) 3.3 Years 5.0 Years % of Debt Maturing in 2020 (Portfolio) 29.5% 2.0% Effective Interest Rate ($497 Million CMBS Loan) 4.4% 3.8% Effective Interest Rate(1) ($125 Million Sanofi Loan) 5.2% 3.3% Summary of Financing Deal Terms 29% 11% 0% 28% 1% 31% 2% 4% 0% 17% 1% 76% 2020 2021 2022 2023 2024 Thereafter Prior to Refinancings Post Refinancings 1) Interest rate fixed by swap. 2) Based on total debt outstanding as of June 30, 2020 for “Prior to Refinancings” and September 30, 2020 for “Post Refinancings”. For purposes of the revolving credit facility, the chart uses debt outstanding or drawn under the facility at each date and not the total commitment.

American Finance Trust, Inc. CASH RENT COLLECTION SUMMARY 6 AFIN’s proactive response during the COVID - 19 pandemic continues to result in tremendous success as we’ve collected 92% of third quarter and 94% of October original Cash Rent due Note: Collection data as of October 31, 2020, includes both Cash Rent paid in full and in part pursuant to an Approved Agreem ent or otherwise. Excludes Cash Rent paid or Approved Agreements approved after October 31, 2020 that would apply to third quarte r or second quarter Cash Rent. With respect to third quarter Cash Rent as compared to data previously reported on October 8, 2020, the amount of thi rd quarter Cash Rent increased as a result of additional payments of third quarter Cash Rent. This information may not be ind ica tive of any future period and remains subject to changes based ongoing collection efforts and negotiation of additional agreements. The impact of the C OVI D - 19 pandemic on our rental revenue for the fourth quarter of 2020 and thereafter cannot be determined at present. The ultimate impact on our future results of operations and liquidity will depend on the overall length and severity of the COVID - 19 pandemic, which management is unable to predict. 1) Approved Agreements include Deferral Agreements as well as amendments granting the tenant a rent credit for some portion of C ash Rent due. The most common arrangements represent deferral of some or all of the rent due for the second or third quarter of 2 02 0 with such amounts to be paid in the latter part of 2020 or early part of 2021. The rent credit is generally coupled with an extension o f t he lease. As of October 31, 2020, we granted rent credits with respect to 4% of second quarter and 2% of third quarter Cash R ent due. The terms of the lease amendments providing for rent credits differ by tenant in terms of the length and amount of the credit. A "Deferral Agr eem ent" is an executed or approved amendment to an existing lease agreement to defer a certain portion of Cash Rent due. 2) Represents active tenant discussions where no Approved Agreement has yet been reached. There can be no assurance that we will be able to enter into an Approved Agreement on favorable terms, or at all. 3) Consists of tenants who have not paid Cash Rent in full and there is not an Approved Agreement. There can be no assurance tha t s uch Cash Rent will be collected. Third Quarter Cash Rent Collection 92% 5% 2% 1% Cash Rent Collected Approved Agreement Agreement Negotiation Other Third Quarter Cash Rent Status Single Tenant Multi Tenant Total Portfolio Third Quarter Cash Rent Collected 97% 82% 92% Approved Agreement (1) 2% 13% 5% Agreement Negotiation (2) 0% 4% 2% Other (3) 1% 1% 1% Total 100% 100% 100% Increasing Portfolio Cash Rent Collection 94% 93% 92% 92% 86% October September August July Q2'2020
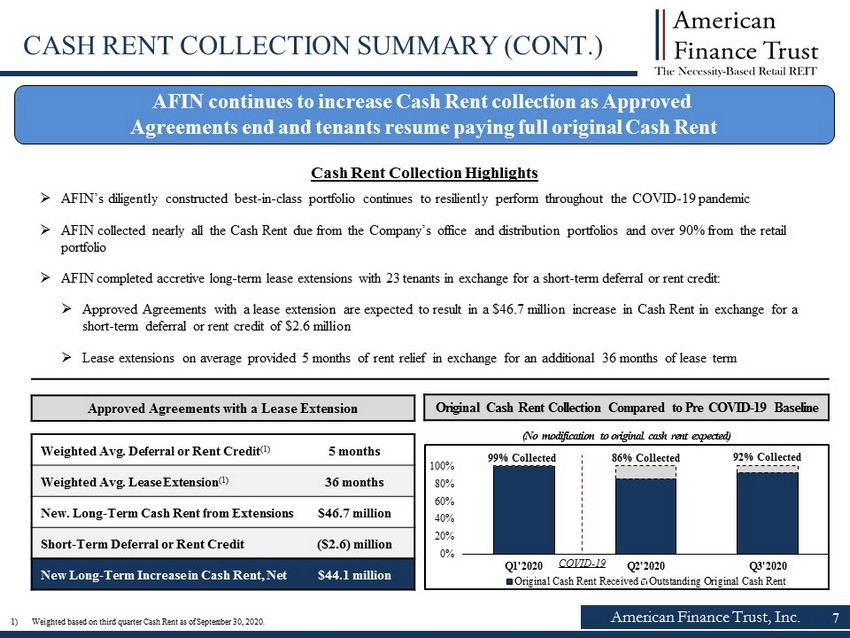
American Finance Trust, Inc. CASH RENT COLLECTION SUMMARY (CONT.) 7 AFIN continues to increase Cash Rent collection as Approved Agreements end and tenants resume paying full original Cash Rent Weighted Avg. Deferral or Rent Credit (1) 5 months Weighted Avg. Lease Extension (1) 36 months New. Long - Term Cash Rent from Extensions $46.7 million Short - Term Deferral or Rent Credit ($2.6) million New Long - Term Increase in Cash Rent, Net $44.1 million Approved Agreements with a Lease Extension » AFIN’s diligently constructed best - in - class portfolio continues to resiliently perform throughout the COVID - 19 pandemic » AFIN collected nearly all the Cash Rent due from the Company’s office and distribution portfolios and over 90% from the retai l portfolio » AFIN completed accretive long - term lease extensions with 23 tenants in exchange for a short - term deferral or rent credit: » Approved Agreements with a lease extension are expected to result in a $46.7 million increase in Cash Rent in exchange for a short - term deferral or rent credit of $2.6 million » Lease extensions on average provided 5 months of rent relief in exchange for an additional 36 months of lease term Cash Rent Collection Highlights 1) Weighted based on third quarter Cash Rent as of September 30, 2020. 0% 20% 40% 60% 80% 100% Q1'2020 Q2'2020 Q3'2020 Original Cash Rent Received Outstanding Original Cash Rent Original Cash Rent Collection Compared to Pre COVID - 19 Baseline COVID - 19 99% Collected 86% Collected 92% Collected (No modification to original cash rent expected)

American Finance Trust, Inc. Q3’20 CASH RENT COLLECTION - TOP 20 TENANTS 8 AFIN received over 97% of third quarter Cash Rent due from our top 20 tenants (1) , representing 56% of third quarter Cash Rent AFIN’s best - in - class portfolio features a high percentage of Necessity - Based retail tenants Tenant Credit Rating (2) Q3’20 Cash Rent Received (1) Percent of Third Quarter Cash Rent Industry Truist Bank A2 100% 6% Retail Banking Sanofi US A1 100% 6% Pharmaceuticals AmeriCold Baa3 100% 5% Refrigerated Warehousing Mountain Express Oil Co. Ba1* 100% 4% Gas/Convenience Fresenius Baa3 99% 4% Healthcare Stop & Shop Baa1* 100% 3% Grocery Bob Evans Ba3* 99% (3) 3% Full - Service Restaurant Dollar General Baa2 100% 3% Discount Retail Home Depot A2 100% 2% Home Improvement United Health A3 100% 2% Healthcare FedEx Ground Baa2* 100% 2% Freight Burger King n.a. 50% (3) 2% Quick Service Restaurant Lowes Baa1 100% 2% Home Improvement DaVita Inc. Ba2 85% 2% Healthcare Best Buy Baa1 100% 2% Wireless / Electronics Walgreen Co. Baa2 97% 2% Pharmacy Kohl's Corporation Baa2 90% (3) 1% Department Store O'Charley's n.a. 100% 1% Full - Service Restaurant Pizza Hut Ba1* 100% 1% Quick Service Restaurant IMTAA Ba3* 100% 1% Gas/Convenience Top 20 Tenants 74% I G Rated (2) 97% 56% *Represents Moody’s Implied Rating 1) Based on third quarter Cash Rent as of October 31, 2020. Excludes Cash Rent or Approved Agreements approved after October 31, 2020 that would apply to third quarter Cash Rent. 2) Ratings information as of September 30, 2020. AFIN’s top 20 tenants are 64% actual Investment Grade rated and 10% implied Inv est ment Grade. 3) As agreed upon in the Approved Agreement with respective tenant. (October = 100%) (October = 100%)

American Finance Trust, Inc. ACQUISITION ACTIVITY Year - to - date, AFIN closed on 72 single - tenant assets for $157 million at an 8.4% weighted average Cap Rate plus a $ 63 million pipeline with a weighted average Cap Rate of 9.1 % ($ in millions, square feet in thousands, lease term remaining in years) 1) Weighted average based on square feet. See Definitions in the appendix for a full description. 2) Includes pipeline as of October 15, 2020 . Pipeline excludes the potential $2 million acquisition of a parcel adjacent to one of our multi - tenant assets. PSAs are subject to conditions. There can be no assurance these pipeline acquisitions will be completed on their current terms, or at all. 3) Represents the contract purchase price and excludes acquisition costs which are capitalized per GAAP. 4) Weighted average remaining lease term is based on square feet as of the respective acquisition date for closed transactions a nd estimated acquisition date for pipeline. Closed Transactions Property Type Number of Properties Square Feet Purchase Price (3) Wgt. Avg. Cap Rate (1) Lease Term Remaining (4) Closed Advanced Auto Traditional Retail 1 7 $1.5 9.5 Q1’20 IMTAA (Gas & Convenience) Service Retail 1 3 $3.8 19.3 Q1’20 DaVita Service Retail 1 7 $2.6 9.6 Q1’20 Pizza Hut Service Retail 2 5 $1.2 20.0 Q1’20 American Car Center Traditional Retail 16 178 $40.9 20.0 Q1’20 BJ’s Wholesale Club Traditional Retail 1 110 $11.2 10.6 Q1’20 Mammoth Car Wash Service Retail 9 56 $28.8 20.0 Q1’20 Mammoth Car Wash Service Retail 2 22 $10.6 20.0 Q2’20 DaVita Service Retail 1 10 $1.6 11.2 Q2’20 GPM (Gas & Convenience) Service Retail 32 107 $32.5 15.8 Q3’20 IMTAA (Gas & Convenience) Service Retail 6 34 $22.3 15.0 Q3’20 2020: Total Closed 72 547 $157.0 8.4% 16.5 Pipeline (2) Property Type Number of Properties Square Feet Purchase Price (3) Wgt. Avg. Cap Rate (1) Lease Term Remaining (4) Status IMTAA (Gas & Convenience) Service Retail 4 21 $11.4 15.0 Signed PSA Dialysis Portfolio (Fresenius & DaVita) Service Retail 16 140 $24.7 4.8 Signed PSA Fresenius Service Retail 6 46 $15.8 9.9 Signed PSA Kamla Kaur Service Retail 10 41 $11.2 20.0 Signed PSA Total Q3’20 Pipeline 36 248 $63.1 9.1% 9.1 2020: Total Closed + Pipeline 108 795 $220.1 8.6% (1) 14.2 9

American Finance Trust, Inc. AFIN continues to enhance its portfolio of high - quality assets by opportunistically acquiring service - oriented retail properties with long term, net leases Note: Data reflects closed dispositions and acquisitions during the period from January 1, 2017 through September 30, 2020 excluding the multi - tenant properties acquired in the American Realty Capital Retail Centers of America, Inc. merger in February 2017 . All data weighted by annualized straight - line rent as of September 30, 2020 . 1) Weighted average lease term remaining based on disposition date for dispositions and acquisition date for acquisitions. 10 Metrics Dispositions Acquisitions Number of Properties 96 495 Wgt . Avg. Remaining Lease Term (1) 6 Years 16 Years Service Retail 21% 79% Traditional Retail 1% 17% Distribution 33% 3% Office 44% 1% 2017 Through Q3 2020 Transaction Summary Wgt. Average Lease Term Remaining (1) Service Retail Acquisition Focus Acquired Properties Increasing Service Retail Concentration Increasing Lease Duration 21% 79% Non-Service Retail Service Retail 6 Years 16 Years 2017 Through Q3 2020 Dispositions 2017 Through Q3 2020 Acquisitions ACQUISITION & STRATEGIC DISPOSITION PROGRAM

Service - oriented retail focused portfolio with embedded long - term rental increases to Investment Grade rated tenants Portfolio Metrics Q3 2020 Q3 2019 Real Estate Investments, at cost $2.5 billion $2.3 billion Number of Properties 852 738 Total Square Feet (SF) 11.9 million 11.0 million Annualized Straight - Line Rent (SLR) $190 million $175 million Occupancy (%) 99.2% 99.3% Weighted Average Remaining Lease Term 10.6 Years 10.9 Years Investment Grade (2) (%) 62% 75% Weighted Average Annual Rent Escalator 1.3% 1.3% American Finance Trust, Inc. 11 SINGLE - TENANT PORTFOLIO 1) Based on annualized straight - line rent. 2) Based on annualized straight - line for the respective quarter end. AFIN’s Q3 2020 single - tenant portfolio tenants were 50% actual and 12% implied Investment Grade rated. For Q3 2019, AFIN’s single - tenant portfolio tenants were 46% actual and 29% implied Investment Grade Rated. Weighted by a nnualized straight - line rent as of September 30, 2020 and September 30, 2019, respectively. Single - Tenant Property and Tenant Type (1) Retail Service Retail Gas/Convenience 12% 59% Retail Banking 10% Healthcare 9% Quick - Service Restaurant 8% Fast Casual 5% Grocery 5% Auto Services 4% Pharmacy 3% Full - Service Restaurant 3% Traditional Retail Discount Retail 4% 12% Auto Retail 3% Home Improvement 3% Specialty Retail 1% Furniture 1% Distribution 15% Office 14% Geographic Exposure

62% 48% 37% 23% 18% n.a. n.a. AFIN O VER SRC NNN EPRT STOR 32% 30% 21% 16% 10% 4% 3% EPRT AFIN STOR NNN O SRC VER 12 American Finance Trust, Inc. x Single - tenant portfolio mostly leased to actual or implied Investment Grade rated tenants, supporting our successful 97% third quarter Cash Rent collection x AFIN’s single - tenant portfolio features minimal near - term lease expirations with 90% of leases expiring after 2024 x 82% of AFIN’s single - tenant portfolio is leased to Service Retail properties that we believe to be Necessity - Based in nature and more resistant to e - commerce Higher percentage of Investment Grade, service - oriented retail tenants compared to peers Service as % of Retail Exposure (3) (Single - Tenant) % Investment Grade Tenants (1) (2) (Single - Tenant) Source: Company filings, Green Street Advisors. Note: Company metrics as of September 30, 2020. Peer metrics as of the last reporting period of June 30, 2020 unless otherwis e n oted. See definitions in the appendix for a full description. 1) Base on annualized straight - line rent. 2) AFIN’s single - tenant portfolio is comprised of 50 % actual Investment Grade rated and 12% implied Investment Grade rated tenants. Peers report tenants with actual Investment Grade ratings. STORE Capital and Essential Properties do not disclose tenant credit ratings. National Retail Properties as of December 31, 2019. 3) Peer metrics, except for Essential Properties, are as of December 31, 2019. Essential Properties metrics are as of June 30, 2 020 . Peers may define service retail differently than AFIN. % of Rent Expiring through 2024 (1) (Single - Tenant) ATTRACTIVE SINGLE - TENANT PORTFOLIO Single - Tenant Highlights 96% 82% 77% 72% 58% 55% 48% EPRT AFIN STOR NNN O SRC VER

American Finance Trust, Inc. MULTI - TENANT PORTFOLIO Diversified multi - tenant portfolio with substantial leasing upside and robust rent collection Portfolio Metrics Q3 2020 Q3 2019 Real Estate Investments, at cost $1.4 billion $1.5 billion Number of Properties 33 33 Total Square Feet (SF) 7.2 million 7.2 million Annualized Straight Line Rent (SLR) $85 million $89 million Occupancy (%) 85.9% 89.1% Executed Occupancy (%) 86.2% 90.2% Weighted Average Remaining Lease Term 4.7 Years 4.9 Years Weighted Average Annual Rent Escalator 1.0% 1.3% Multi - Tenant Property / Tenant Type (1) Experiential / E - Commerce Defensive Entertainment 10% 50% Discount Retail 9% Full - Service Restaurant 8% Salon / Beauty 6% Fast Casual 5% Grocery 4% Healthcare 3% Other 5% Other Traditional Retail Specialty Retail 14% 50% Apparel Retail 8% Wireless / Electronics 6% Department Store 5% Sporting Goods / Fitness 4% Home Furnishing Retail 4% Pet Supplies 4% Other 5% Geographic Exposure 13 1) Base on annualized straight - line rent as of September 30, 2020.
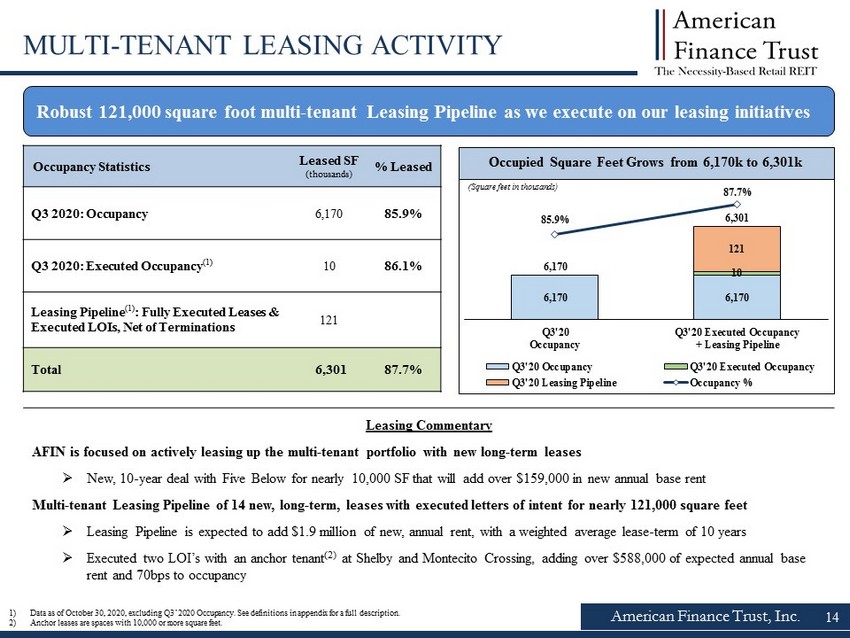
6,170 6,170 10 121 6,170 6,301 85.9% 87.7% 81.0% 82.0% 83.0% 84.0% 85.0% 86.0% 87.0% 88.0% 6,050 6,100 6,150 6,200 6,250 6,300 6,350 Q3'20 Occupancy Q3'20 Executed Occupancy + Leasing Pipeline Q3'20 Occupancy Q3'20 Executed Occupancy Q3'20 Leasing Pipeline Occupancy % American Finance Trust, Inc. 14 MULTI - TENANT LEASING ACTIVITY 1) Data as of October 30, 2020, excluding Q3’2020 Occupancy. See definitions in appendix for a full description. 2) Anchor leases are spaces with 10,000 or more square feet. Occupancy Statistics Leased SF (thousands) % Leased Q3 2020: Occupancy 6,170 85.9% Q3 2020: Executed Occupancy (1) 10 86.1% Leasing Pipeline (1) : Fully Executed Leases & Executed LOIs , Net of Terminations 121 Total 6,301 87.7% Occupied Square Feet Grows from 6,170k to 6,301k (Square feet in thousands) Robust 121,000 square foot multi - tenant Leasing Pipeline as we execute on our leasing initiatives Leasing Commentary AFIN is focused on actively leasing up the multi - tenant portfolio with new long - term leases » New, 10 - year deal with Five Below for nearly 10,000 SF that will add over $159,000 in new annual base rent Multi - tenant Leasing Pipeline of 14 new, long - term, leases with executed letters of intent for nearly 121,000 square feet » Leasing Pipeline is expected to add $1.9 million of new, annual rent, with a weighted average lease - term of 10 years » Executed two LOI’s with an anchor tenant (2) at Shelby and Montecito Crossing, adding over $588,000 of expected annual base rent and 70bps to occupancy

x 80 % of top ten tenants are actual or implied Investment Grade rated with 1.4% average annual Rent Escalators x Top ten tenants are 55 % service retail focused (2) 1% 2% 3% 4% 5% 15% 0% 3% 1% 2% 1% 63% 0% 10% 20% 30% 40% 50% 60% 70% 2020 2021 2022 2023 2024 Thereafter American Finance Trust, Inc. PORTFOLIO TENANT OVERVIEW 1) Ratings information is as of September 30, 2020. Weighted based on annualized straight - line rent as of September 30, 2020. AFIN’ s top 10 tenants are 72% actual Investment Grade rated and 8% implied Investment Grade. 2) Weighted based on annualized straight - line rent as of September 30, 2020. Top Tenant Overview (1)(2) Remaining Tenants Moody’s/S&P Credit Rating: 15 A2 Portfolio Lease Expiration Schedule (Total Portfolio) x Single - tenant portfolio features minimal near - term lease expirations with 63% of total portfolio leases expiring after 2024 x AFIN’s multi - tenant portfolio features minimal, staggered, near - term lease expirations through 2024 Multi - Tenant Properties – 4.7 years weighted average lease term remaining Single - Tenant Properties – 10.6 years weighted average lease term remaining A1 Ba1* Baa3 Baa1* Ba3* A2 Baa1 Baa3 Baa2 *Represents Moody’s Implied Rating. 6% 6% 5% 5% 4% 3% 3% 3% 2% 2% 60% 0% 20% 40% 60% Sanofi Truist Mountain Express Americold Fresenius Medical Stop & Shop Bob Evans Home Depot Dollar General Lowe's Remaining Tenants
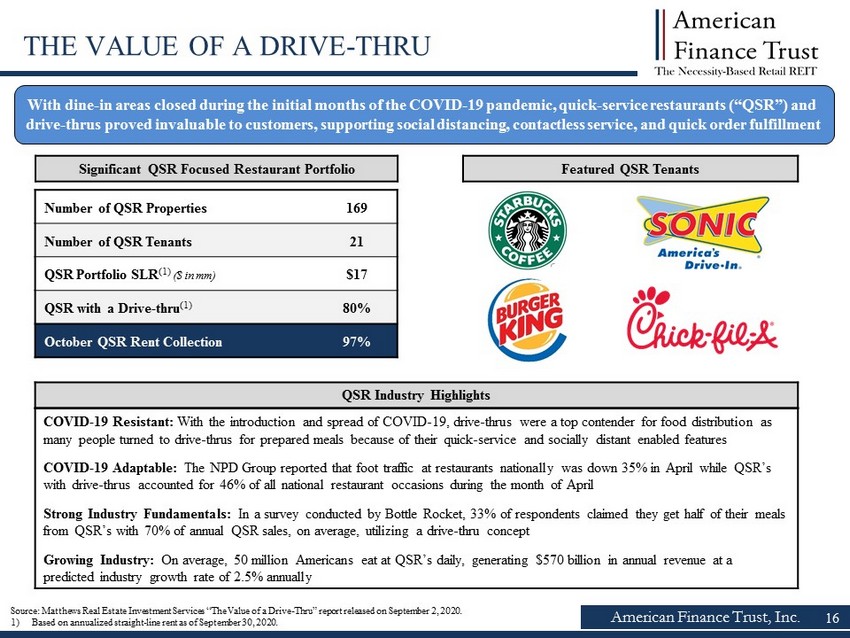
American Finance Trust, Inc. THE VALUE OF A DRIVE - THRU 16 With dine - in areas closed during the initial months of the COVID - 19 pandemic, quick - service restaurants (“QSR”) and drive - thrus proved invaluable to customers, supporting social distancing, contactless service, and quick order fulfillment Number of QSR Properties 169 Number of QSR Tenants 21 QSR Portfolio SLR (1) ($ in mm) $17 QSR with a Drive - thru (1) 80% October QSR Rent Collection 97% Featured QSR Tenants COVID - 19 Resistant: With the introduction and spread of COVID - 19, drive - thrus were a top contender for food distribution as many people turned to drive - thrus for prepared meals because of their quick - service and socially distant enabled features COVID - 19 Adaptable: The NPD Group reported that foot traffic at restaurants nationally was down 35% in April while QSR’s with drive - thrus accounted for 46% of all national restaurant occasions during the month of April Strong Industry Fundamentals: In a survey conducted by Bottle Rocket, 33% of respondents claimed they get half of their meals from QSR’s with 70% of annual QSR sales, on average, utilizing a drive - thru concept Growing Industry: On average, 50 million Americans eat at QSR’s daily, generating $570 billion in annual revenue at a predicted industry growth rate of 2.5% annually Source: Matthews Real Estate Investment Services “The Value of a Drive - Thru” report released on September 2, 2020. 1) Based on annualized straight - line rent as of September 30, 2020. Significant QSR Focused Restaurant Portfolio QSR Industry Highlights

American Finance Trust, Inc. 17 AFIN’s superior high-quality portfolio is supported by a long-dated and prudent capital structure Capitalization Highlights Long-Term Debt Maturity Schedule(1) Weighted Average Interest Rate and Debt Maturity DEBT OVERVIEW Key Debt Metrics Metric Q3’2020 Interest Coverage Ratio(2) 2.8x Fixed Rate Debt(3) (%) 83.4% Weighted-Average Interest Rate(4) 3.8% Weighted-Average Debt Maturity(4) 5.0 Years 3.9 Years 3.8 Years 3.5 Years 3.3 Years 5.0 Years 4.5% 4.3% 4.2% 3.8% 3.8% 0 1 2 3 4 5 3.0% 3.5% 4.0% 4.5% 5.0% 5.5% 6.0% Q3'2019 Q4'2019 Q1'2020 Q2'2020 Q3'2020 2% 4% 0% 17% 1% 76% 2020 2021 2022 2023 2024 Thereafter x Completed $840 million of long-term debt refinancings in the third quarter, resulting in 76% of the Company’s debt maturing after 2024 Year over year, the Company’s weighted average interest rate and debt maturity improved to 3.8% and 5.0 years respectively x Interest coverage ratio of 2.8x(1), providing significant coverage on AFIN’s low interest rate bearing debt Note: Metrics as of the end of and for the three months ended September 30, 2020 unless otherwise indicated. 1) Based on total debt outstanding as of September 30, 2020. For purposes of the revolving credit facility, the chart uses debt outstanding or drawn under the facility at such date and not the total commitment. 2) The interest coverage ratio is calculated by dividing adjusted EBITDA by cash paid for interest (interest expense less amortization of deferred financing costs, net, change in accrued interest and amortization of mortgage premiums on borrowings) for the quarter ended September 30, 2020. Adjusted EBITDA and cash paid for interest are Non-GAAP metrics. See appendix for Non-GAAP reconciliations. 3) Includes floating rate debt fixed by swaps. 4) Weighted based on the outstanding principal balance of debt as of September 30, 2020.

$23.1 $25.5 Net Loss Common Stock Dividends AFFO ($7.1) Net Loss Common Stock Dividends AFFO American Finance Trust, Inc. Q3 2020 FINANCIAL HIGHLIGHTS Note: Metrics as of the end of and for the three months ended September 30, 2020 . See Definitions in the appendix for a full description of capitalized terms. 1) Weighted average interest rate based on balance outstanding as of September 30, 2020 . 2) See Definitions in the appendix for a full description. 3) Excludes the effect of deferred financing costs, net and mortgage premiums, net. 4) Adjusted EBITDA is annualized based on Q3 2020 results. 5) See appendix for Non - GAAP reconciliations. AFIN continues to actively manage its capital structure by locking in long - term debt at low fixed interest rates to support continued earnings and portfolio growth 18 Debt Capitalization ($mm) Single - Tenant Mortgages $1,263 Multi - Tenant Mortgages $270 Total Secured Debt $1,533 Revolving Credit Facility $306 Total Unsecured Debt $306 Total Debt $1,839 Weighted Average Interest Rate (1) 3.8% Key Capitalization Metrics ($mm) Net Debt (2)(3) $1,753 Gross Asset Value (2) $4,175 Net Debt (3) / Adjusted EBITDA (4)(5) 8.1x Net Debt (3) / Gross Asset Value (2) 42.0% Earnings Summary ($ mm) Q3’20 Net loss Attributable to Common Stockholders ($7.1) NOI (2)(4) $64.3 Cash NOI (2)(4) $54.9 Funds from Operations (FFO) (2)(5) $25.6 Adjusted Funds from Operations (AFFO) (2)(5) $25.5 Funds from Operations (FFO) (2)(5) per Share $0.24 Adjusted Funds from Operations (AFFO) (2)(5) per Share $0.23 Weighted Average Basic and Diluted Shares Outstanding 108.4 Q3’20 Net Loss, Common Stock Dividends and AFFO ($mm)

American Finance Trust, Inc. 19 EXPERIENCED MANAGEMENT Jason Slear Executive Vice President of Real Estate Acquisitions and Dispositions ▪ Responsible for sourcing, negotiating, and closing AR Global's real estate acquisitions and dispositions ▪ Oversaw the acquisition of over $3.5 billion of real estate assets and the lease - up of over 10 million square feet during professional career Michael Weil Chief Executive Officer, President and Chairman of the Board of Directors ▪ Founding partner of AR Global ▪ Previously served as Senior VP of sales and leasing for American Financial Realty Trust ▪ Served as president of the Board of Directors of the Real Estate Investment Securities Association (n/k/a ADISA) Katie Kurtz Chief Financial Officer, Treasurer and Secretary ▪ Currently serves as chief financial officer of Healthcare Trust, Inc. ▪ Previously served as chief financial officer at New York City REIT, Inc., American Realty Capital - Retail Centers of America, Inc ., Business Development Corporation of America II and Crossroads Capital, Inc. (formerly BDCA Venture, Inc.). ▪ Previously served as chief accounting officer at Carlyle GMS Finance, Inc., The Carlyle Group’s business development company, Director of Finance and Controller for New Mountain Finance Corporation, and Controller at Solar Capital Ltd ▪ Mrs. Kurtz began her career at PricewaterhouseCoopers, LLP and is a certified public accountant in New York State Boris Korotkin Senior Vice President of Capital Markets and Corporate Strategy ▪ Responsible for leading all debt capital market transactions ▪ Former Executive Vice President of Transaction Structuring for American Financial Realty Trust Ori Kravel Senior Vice President of Corporate Development ▪ Responsible for corporate development and business strategy ▪ Executed over $12 billion of capital market transactions and over $25 billion of M&A transactions

Confidential – Not for Distribution 20 20 Legal Notices

American Finance Trust, Inc. 21 DISCLAIMERS This presentation includes estimated projections of future operating results. These projections were not prepared in accordan ce with published guidelines of the SEC or the guidelines established by the American Institute of Certified Public Accountants for preparation an d presentation of financial projections. This information is not fact and should not be relied upon as being necessarily indicative of future r esu lts; the projections were prepared in good faith by management and are based on numerous assumptions that may prove to be wrong. Important factors that ma y affect actual results and cause the projections to not be achieved include, but are not limited to, risks and uncertainties relating to the co mpany and other factors described in the “Risk Factors” section of the Company's Annual Report on Form 10 - K for the year ended December 31, 2019, the Co mpany's subsequent Quarterly Reports on Form 10 - Q and in future filings with the SEC. The projections also reflect assumptions as to cer tain business decisions that are subject to change. As a result, actual results may differ materially from those contained in the estimates . A ccordingly, there can be no assurance that the estimates will be realized. This presentation also contains estimates and information concerning our in dus try, including market position, market size, and growth rates of the markets in which we participate, that are based on industry publications and r epo rts. This information involves a number of assumptions and limitations, and you are cautioned not to give undue weight to these estimates. We have not independently verified the accuracy or completeness of the data contained in these industry publications and reports. The industry in which we operate is subject to a high degree of uncertainty and risk due to variety of factors, including those described in the “Risk Factors” and "Managemen t's Discussion and Analysis of Financial Condition and Results of Operations" sections of the Company's Annual Report on Form 10 - K for the year end ed December 31, 2019, filed with the SEC on February 27, 2020, the Company's Quarterly Report on Form 10 - Q for the quarter ended March 31, 2020 filed with the SEC on May 7, 2020, the Company's Quarterly Report on Form 10 - Q for the quarter ended June 30, 2020 filed with the SEC on August 6, 2020 and the Company's subsequent Quarterly Reports on Form 10 - Q filed with the SEC. These and other factors could cause results to diffe r materially from those expressed in these publications and reports. This presentation contains estimates and information concerning the Company’s industry and the Company’s peer companies that are based on industry publications, reports and peer company public filings. The Company has not independently verified the accuracy of th e d ata contained in these industry publications, reports and peer company public filings. These estimates and information involve a number of ass ump tions and limitations, and you are cautioned not to rely on or give undue weight to this information. This presentation contains COVID - 19 information and may not be indicative of any future period. The impact of the COVID - 19 pande mic on our rental revenue for the third quarter and July of 2020 and thereafter cannot be determined at present. The ultimate impact on our future results of operations and liquidity will depend on the overall length and severity of the COVID - 19 pandemic, which management is unable to predict.

American Finance Trust, Inc. 22 FORWARD - LOOKING STATEMENTS Certain statements made in this presentation are “forward - looking statements” (as defined in Section 21E of the Exchange Act), w hich reflect the expectations of the Company regarding future events. The forward - looking statements involve a number of risks, uncertainties and other factors that could cause actual results to dif fer materially from those contained in the forward - looking statements. Such forward - looking statements include, but are not limited to, market and other expectations, objectives, and intentions, as w ell as any other statements that are not historical facts. The majority of the concessions granted to its tenants as a result of the COVID - 19 pandemic are rent deferrals with the original lease term unchanged and collection of deferred rent deemed probable As a result of relief granted by the FASB and SEC related to lease modification accounting, we do not expect rental revenue u sed to calculate Net Income and NAREIT FFO to be significantly impacted by these types of deferrals. In addition, since we currently believe that these amounts are collectible, we have exc lud ed from the increase in straight - line rent for AFFO purposes the amounts recognized under GAAP relating to these types of rent deferrals. Our potential risks and uncertainties are presented in the section titled “Item 1A - Risk Factors” disclosed in our Annual Report on Form 10 - K for the year ended December 31, 2019 filed with the SEC on February 27, 2020, and the Company's subsequent Quarterly Reports on Form 10 - Q filed with the SEC. Forward - looking statements speak as of the date they and, we disclaim any obligation to update and revise statements contained in these materials to reflect changed assumptions, the occurrence of unanticipated eve nts or changes to future operating results over time, unless required by law. The following are some of the risks and uncertainties relating to us, although not all risks and uncertainties, that could ca use our actual results to differ materially from those presented in our forward - looking statements: ▪ All of our executive officers are also officers, managers, employees or holders of a direct or indirect controlling interest in American Finance Advisors, LLC (the “Advisor”) or other entities under common control with AR Global Investments, LLC (the successor business to AR Capital, LLC, “AR Global”). As a result, our exe cut ive officers, the Advisor and its affiliates face conflicts of interest, including significant conflicts created by the Advisor’s compensation arrangements with us and other investment pro gra ms advised by affiliates of AR Global and conflicts in allocating time among these entities and us, which could negatively impact our operating results. ▪ The trading price of our Class A common stock and 7.50% Series A Cumulative Redeemable Perpetual Preferred Stock, $0.01 par v alu e per share (the “Series A Preferred Stock”), may fluctuate significantly. ▪ Lincoln Retail REIT Services, LLC (“Lincoln”) and its affiliates, which provide services to the Advisor in connection with ou r r etail portfolio, faces conflicts of interest in allocating its employees’ time between providing real estate - related services to the Advisor and other programs and activities in which they are presently involved or may be involved in the future. ▪ The performance of our retail portfolio is linked to the market for retail space generally and factors that may impact our re tai l tenants, such as the increasing use of the Internet by retailers and consumers, as well as store closures and changes in consumer behavior resulting from or relating to the COVID - 19 pandemic. ▪ Our rental revenue is dependent upon the success and economic viability of our tenants. ▪ We may be unable to enter into and consummate property acquisitions on advantageous terms or our property acquisitions may no t p erform as we expect. ▪ Provisions in our revolving unsecured corporate credit facility may limit our ability to pay dividends on our Class A common sto ck, our Series A Preferred Stock and currently prohibit us from repurchasing shares. ▪ We have not generated, and in the future may not generate, operating cash flows sufficient to fund all of the dividends we pa y o ur stockholders, and, as such, we may be forced to fund dividends from other sources, including borrowings, which may not be available on favorable terms, or at all. ▪ We may be unable to pay or maintain cash dividends at the current rate and provisions in our credit facility currently restri ct us from increasing dividends over time. ▪ We are obligated to pay fees, which may be substantial, to the Advisor and its affiliates. ▪ We are subject to risks associated with a pandemic, epidemic or outbreak of a contagious disease, such as the ongoing global COV ID - 19 pandemic, including negative impacts on our tenants and their respective businesses. ▪ We are subject to risks associated with any dislocations or liquidity disruptions that may exist or occur in credit markets o f t he United States of America from time to time, including disruptions and dislocations caused by the ongoing COVID - 19 pandemic. ▪ Our operating results are affected by economic and regulatory changes that have an adverse impact on the real estate market i n g eneral. ▪ We may fail to continue to qualify to be treated as a real estate investment trust for U.S. federal income tax purposes, whic h w ould result in higher taxes, may adversely affect our operations and would reduce the value of an investment in our Series A Preferred Stock, Class A common stock and our cash available for divi den ds.

Confidential – Not for Distribution 23 23 Appendix

American Finance Trust, Inc. 24 DEFINITIONS AFFO : In calculating AFFO, we start with FFO, then we exclude certain income or expense items from AFFO that we consider to be more reflective of investing activities, such as non - cash income and expense items and the income and expense effects of other activities that are not a fundamental attribute of our day to day operating business plan, such as amounts related to the litigation arising out of AFIN's 2017 merger with American Realty Capital - Retail Centers of America, Inc . (the “Merger”) . These amounts include legal costs incurred as a result of the litigation, portions of which have been and may in the future be reimbursed under insurance policies maintained by us . Insurance reimbursements are deducted from AFFO in the period of reimbursement . We believe that excluding the litigation costs and subsequent insurance reimbursements litigation arising out of the Merger helps to provide a better understanding of the operating performance of our business . Other income and expense items also include early extinguishment of debt and unrealized gains and losses, which may not ultimately be realized, such as gains or losses on derivative instruments and gains and losses on investments . In addition, by excluding non - cash income and expense items such as amortization of above - market and below - market leases intangibles, amortization of deferred financing costs, straight - line rent, and share - based compensation related to restricted shares and the 2018 outperformance agreement with the Advisor from AFFO, we believe we provide useful information regarding those income and expense items which have a direct impact on our ongoing operating performance . By providing AFFO, we believe we are presenting useful information that can be used to better assess the sustainability of our ongoing operating performance without the impact of transactions or other items that are not related to the ongoing performance of our portfolio of properties . AFFO presented by us may not be comparable to AFFO reported by other REITs that define AFFO differently . Please refer to our Form 10 - Q for further details on our calculation of AFFO . Annualized Straight - Line Rent : Straight - line rent which is annualized and calculated using most recent available lease terms as of the period end indicated . Cap Rate : Capitalization rate is a rate of return on a real estate investment property based on the expected, annualized straight - lined rental income that the property will generate under its existing lease during its first year of ownership . Capitalization rate is calculated by dividing the annualized straight - lined rental income the property will generate (before debt service and depreciation and after fixed costs and variable costs) and the purchase price of the property . Weighted average cap rates are based on square feet unless otherwise indicated . Cash Cap Rate : For acquisitions, cash cap rate is a rate of return on a real estate investment property based on the expected, annualized cash rental income during the first year of ownership that the property will generate under its existing lease . For dispositions, cash cap rate is a rate of return based on the annualized cash rental income of the property to be sold . For acquisitions, cash cap rate is calculated by dividing the annualized cash rental income the property will generate (before debt service and depreciation and after fixed costs and variable costs) and the purchase price of the property . For dispositions, cash cap rate is calculated by dividing the annualized cash rental income by the contract sales price for the property . Weighted average cash cap rates are based on square feet unless otherwise indicated . Cash NOI : We define Cash NOI as NOI excluding amortization of above/below market lease intangibles and straight - line adjustments that are included in GAAP lease revenues . Cash Rent : Represents total of all contractual rents on a cash basis due from tenants as stipulated in the originally executed lease agreements at inception or any lease amendments thereafter prior to a Deferral Agreement or rent credit (see slide 6 for further information) . Executed Occupancy : Includes Occupancy as of September 30 , 2020 as defined below as well as all leases fully executed by both parties as of September 30 , 2020 where the tenant has yet to take possession as of such date . Experiential Retail : We define Experiential Retail as multi - tenant properties leased to tenants in the restaurant, discount retail, entertainment, salon/beauty, and grocery sectors, among others . FFO : We define FFO, a non - GAAP measure, consistent with the standards established over time by the Board of Governors of NAREIT, as restated in a White Paper and approved by the Board of Governors of NAREIT effective in December 2018 (the "White Paper") . The White Paper defines FFO as net income or loss computed in accordance with GAAP excluding depreciation and amortization related to real estate, gains and losses from sales of certain real estate assets, gain and losses from change in control and impairment write - downs of certain real estate assets and investments in entities when the impairment is directly attributable to decreases in the value of depreciable real estate held by the entity . Adjustments for unconsolidated partnerships and joint ventures are calculated to exclude the proportionate share of the non - controlling interest to arrive at FFO attributable to stockholders . Our FFO calculation complies with NAREIT's definition . GAAP : Accounting principles generally accepted in the United States of America Gross Asset Value : Total assets of $ 3 . 6 billion plus accumulated depreciation and amortization of $ 611 . 2 million as of September 30 , 2020 .
American Finance Trust, Inc. 25 DEFINITIONS (CONTINUED) Investment Grade : As used herein, investment grade includes both actual investment grade ratings of the tenant or guarantor, if available, or implied investment grade . Implied investment grade may include actual ratings of tenant parent, guarantor parent (regardless of whether or not the parent has guaranteed the tenant’s obligation under the lease) or by using a proprietary Moody’s analytical tool, which generates an implied rating by measuring a company’s probability of default . Ratings information is as of September 30 , 2020 . Single - tenant portfolio tenants are 50 % actual investment grade rated and 12 % implied investment grade rated . Leasing Pipeline : Includes ( i ) all leases fully executed by both parties as of October 30, 2020, but after September 30, and (ii) all leases under negotia tio n with an executed LOI by both parties as of October 30, 2020. Leasing pipeline includes 14 new leases totaling approximately 121,000 square feet. No lease terminations o ccu rred during this period. There can be no assurance that such leases will commence on their current terms, or at all. Leasing pipeline should not be considered an indication of future performance. Liquidity: As of September 30, 2020, the Company had $86.3 million in cash and cash equivalents, and $151 million available for future b orr owings under the Company's credit facility. The credit facility currently requires the Company to maintain a combination of cash, cash equivalents and amounts available for future borrowing s u nder the credit facility of not less than $100.0 million, which could limit the Company’s ability to incur additional indebtedness and use cash that would otherwise be available to the Company. The Jul y c redit facility amendment is designed to provide the Company with additional flexibility to continue addressing the adverse impacts of the COVID - 19 pandemic. See the Current Report on Form 8 - K f iled by the Company on July 28, 2020 for further details. LOI: Means a non - binding letter of intent. Necessity - Based : AFIN definition of Necessity - Based includes properties leased to Service Retail and/or Experiential Retail tenants . Negotiation : Represents a ctive tenant discussions where no Deferral Agreement has yet been reached . There can be no assurance that these negotiations will be successful and will lead to Deferral Agreements on favorable terms, or at all . Net Debt : Total debt of $ 1 . 8 billion less cash and cash equivalents of $ 86 . 3 million as of September 30 , 2020 . Net Debt / Adjusted EBITDA : Represents ratio of net debt as of September 30 , 2020 of $ 1 . 8 billion, to the Company’s calculation of its adjusted earnings before interest, tax, depreciation and amortization (“EBITDA”) multiplied by four for the three months ended September 30 , 2020 . Net Leverage : Represents “Net Debt” as defined above divided by “Gross Asset Value” as defined above shown as a percentage . NOI : Defined as a non - GAAP financial measure used by us to evaluate the operating performance of our real estate . NOI is equal to total revenues, excluding contingent purchase price consideration, less property operating and maintenance expense . NOI excludes all other items of expense and income included in the financial statements in calculating net (loss) . Occupancy : Represents percentage of square footage of which the tenant has taken possession of divided by the respective total rentable square feet as of the date or period end indicated . PSA : Means a definitive purchase and sale agreement . Remaining Lease Term : Represents the outstanding tenant lease term . Weighted based on annualized straight - line rent as of the date or period end indicated . Rent Escalators : Contractual rent increases include fixed percent or actual increases, or CPI - indexed increases . Annual averages are based on annualized straight - line rent as of September 30 , 2020 . Service Retail : AFIN definition of Service Retail includes single - tenant retail properties leased to tenants in the retail banking, restaurant, grocery, phar macy, gas/convenience, healthcare, and auto services sectors . Traditional Retail : AFIN definition of Traditional Retail includes single - tenant retail properties leased to tenants in the discount retail, home improvement, furniture, specialty retail, auto retail, sporting goods sectors, wireless/electronics, department stores, and home improvement .

Three Months Ended September 30, 2020 September 30, 2019 (Unaudited) (Unaudited) EBITDA: Net income (loss) $ (3,482) $ 152 Depreciation and amortization 34,951 29,901 Interest expense 20,871 18,569 EBITDA 52,340 48,622 Acquisition, transaction and other costs 1,507 489 Equity - based compensation 3,235 3,217 Gain on sale of real estate investments (2,178) (1,933)) Other income (871) (48) Adjusted EBITDA 54,033 50,347 Asset management fees to related party 6,918 6,545 General and administrative 3,312 3,573 NOI 64,263 60,465 Amortization of market lease and other intangibles, net (1,652) (2,503) Straight - line rent (7,743) (2,716) Cash NOI $ 54,868 $ 55,246 Cash Paid for Interest: Interest expense $ 20,871 $ 18,569 Amortization of deferred financing costs, net and change in accrued interest (2,782) (725) Amortization of mortgage discounts and premiums on borrowings 1,110 839 Total cash paid for interest $ 19,199 $ 18,683 American Finance Trust, Inc. 26 NON - GAAP RECONCILIATIONS Non - GAAP Measures Amounts in thousands

Three Months Ended September 30, 2020 September 30, 2019 (Unaudited) (Unaudited) Funds from operations (FFO): Net income (loss) attributable to common stockholders (in accordance with GAAP) $ (7,091) $ (2,931) Depreciation and amortization 34,951 29,901 Gain on sale of real estate investments (2,178) (1,933) Proportionate share of adjustments for non - controlling interest to arrive at FFO (51) (45) FFO attributable to common stockholders 25,631 24,992 Acquisition, transaction and other costs 1,507 489 Legal fees and expenses – COVID - 19 Lease Disputes 16 — Amortization of market lease and other intangibles, net (1,652) (2,503) Straight - line rent (7,743) (2,716) Straight - line rent (rent deferral agreements) 2,209 — Amortization of mortgage premiums on borrowings (521) (839) Equity - based compensation 3,235 3,217 Amortization of deferred financing costs, net and change in accrued interest 2,782 725 Proportionate share of adjustments for non - controlling interest to arrive at AFFO 1 3 AFFO attributable to common stockholders $ 25,465 $ 23,368 Weighted - average common shares outstanding 108,429 106,140 Net income (loss) per share attributable to common stockholders — Basic and Diluted $ (0.07) $ (0.03) FFO per common share $ 0.24 $ 0.24 AFFO per common share $ 0.23 $ 0.22 Dividends declared $ 23,065 $ 29,212 American Finance Trust, Inc. 27 NON - GAAP RECONCILIATIONS Non - GAAP Measures Amounts in thousands, except per share data