Attached files
| file | filename |
|---|---|
| EX-99.3 - EX-99.3 - Telenav, Inc. | d50981dex993.htm |
| EX-99.1 - EX-99.1 - Telenav, Inc. | d50981dex991.htm |
| EX-3.2.1 - EX-3.2.1 - Telenav, Inc. | d50981dex321.htm |
| EX-2.1.1 - EX-2.1.1 - Telenav, Inc. | d50981dex211.htm |
| EX-2.1 - EX-2.1 - Telenav, Inc. | d50981dex21.htm |
| 8-K - FORM 8-K - Telenav, Inc. | d50981d8k.htm |

Exhibit 99.2 Telenav | Transforming Life on the Go Telenav, Inc. (NASDAQ: TNAV) First Quarter Fiscal 2021 Financial Results November 3, 2020Exhibit 99.2 Telenav | Transforming Life on the Go Telenav, Inc. (NASDAQ: TNAV) First Quarter Fiscal 2021 Financial Results November 3, 2020

Forward Looking Statements This supplemental investor presentation contains forward-looking statements that are based on Telenav management’s beliefs and assumptions and on information currently available to its management. Actual events or results may differ materially from those described in these documents or communications due to a number of risks and uncertainties. These potential risks and uncertainties include, among others: the risk that the proposed transaction with V99, Inc. may not be completed in a timely manner or at all, which may adversely affect Telenav’s business and the price of the common stock of Telenav; the failure to satisfy any of the conditions to the consummation of the proposed transaction, including the adoption of the merger agreement by the stockholders of Telenav and the receipt of required regulatory approvals; the occurrence of any event, change or other circumstance that could give rise to the termination of the merger agreement; the effect of the announcement or pendency of the proposed transaction on Telenav’s business relationships, operating results and business generally; (v) the risks that the proposed transaction disrupts current plans and operations and the potential difficulties in employee retention as a result of the proposed transaction; the risks related to diverting management’s attention from Telenav’s ongoing business operations; the outcome of any legal proceedings that may be instituted against Telenav or the special committee of its independent directors related to the merger agreement or the proposed transaction; unexpected costs, charges or expenses resulting from the proposed transaction; the impact of the COVID-19 pandemic on business activity, including but not limited to the shutdown of manufacturing operations by Ford, GM and other automobile manufacturer customers, consumer demand for new vehicles and the Company’s operations; whether Ford, GM and other automobile manufacturer partners will be required to suspend production on response to spikes in COVID-19 cases and if so, when and to what extent they will be able to resume full production and the impact the continued period of reduced volume of new vehicles being produced will have on our revenue and operating results; the ensuing economic recession; the Company’s ability to achieve future revenue currently estimated under customer engagements, including the Company’s ability to determine, achieve and accurately recognize revenue under customer engagements; the Company's ability to develop and implement products for Ford, GM and Toyota and to support Ford, GM and Toyota and their customers; the impact of Ford’s announcement regarding the elimination of various sedans in North America over the near term; the impact of tariffs on sales of automobiles in the United States and other markets; the Company’s success in extending its contracts for current and new generation of products with its existing automobile manufacturers and tier ones, particularly Ford; the impact of Ford’s announcement regarding Garmin and the possibility that Ford and other OEMs may transition additional business to other platforms and providers, such as Google Automotive Services; the impact of GM’s announcement regarding Google Automotive Services; the Company’s ability to achieve additional design wins and the delivery dates of automobiles including the Company’s products; adoption by vehicle purchasers of Scout GPS Link; the Company’s dependence on a limited number of automobile manufacturers and tier ones for a substantial portion of its revenue, such as Ford and GM; reductions in demand for automobiles in general and specifically for Ford and GM vehicles; potential impacts of automobile manufacturers and tier ones, in particular Ford and GM, including competitive capabilities in their vehicles such as Apple CarPlay and Android Auto; the Company’s continued reporting of losses and operating expenses in excess of expectations; the timing of new product releases and vehicle production by the Company’s automotive customers, including inventory procurement and fulfillment; possible warranty claims, and the impact on consumer perception of its brand; the Company’s ability to perform under its initiatives with Amazon and Microsoft, and benefit from those initiatives; the potential that the Company may not be able to realize its deferred tax assets and may have to take a reserve against them. Telenav discusses these risks in greater detail in “Risk Factors” and elsewhere in its Form 10-K for the fiscal year ended June 30, 2020 and other filings with the U.S. Securities and Exchange Commission (“SEC”), including any subsequent Annual Report on Form 10-K or Quarterly Report on Form 10-Q, which are available on the SEC’s website at www.sec.gov. Also, forward-looking statements represent management’s beliefs and assumptions only as of the date made. You should review the company’s SEC filings carefully and with the understanding that actual future results may be materially different from what Telenav expects. Given these uncertainties, you should not place undue reliance on these forward-looking statements. Forward Looking Statements This supplemental investor presentation contains forward-looking statements that are based on Telenav management’s beliefs and assumptions and on information currently available to its management. Actual events or results may differ materially from those described in these documents or communications due to a number of risks and uncertainties. These potential risks and uncertainties include, among others: the risk that the proposed transaction with V99, Inc. may not be completed in a timely manner or at all, which may adversely affect Telenav’s business and the price of the common stock of Telenav; the failure to satisfy any of the conditions to the consummation of the proposed transaction, including the adoption of the merger agreement by the stockholders of Telenav and the receipt of required regulatory approvals; the occurrence of any event, change or other circumstance that could give rise to the termination of the merger agreement; the effect of the announcement or pendency of the proposed transaction on Telenav’s business relationships, operating results and business generally; (v) the risks that the proposed transaction disrupts current plans and operations and the potential difficulties in employee retention as a result of the proposed transaction; the risks related to diverting management’s attention from Telenav’s ongoing business operations; the outcome of any legal proceedings that may be instituted against Telenav or the special committee of its independent directors related to the merger agreement or the proposed transaction; unexpected costs, charges or expenses resulting from the proposed transaction; the impact of the COVID-19 pandemic on business activity, including but not limited to the shutdown of manufacturing operations by Ford, GM and other automobile manufacturer customers, consumer demand for new vehicles and the Company’s operations; whether Ford, GM and other automobile manufacturer partners will be required to suspend production on response to spikes in COVID-19 cases and if so, when and to what extent they will be able to resume full production and the impact the continued period of reduced volume of new vehicles being produced will have on our revenue and operating results; the ensuing economic recession; the Company’s ability to achieve future revenue currently estimated under customer engagements, including the Company’s ability to determine, achieve and accurately recognize revenue under customer engagements; the Company's ability to develop and implement products for Ford, GM and Toyota and to support Ford, GM and Toyota and their customers; the impact of Ford’s announcement regarding the elimination of various sedans in North America over the near term; the impact of tariffs on sales of automobiles in the United States and other markets; the Company’s success in extending its contracts for current and new generation of products with its existing automobile manufacturers and tier ones, particularly Ford; the impact of Ford’s announcement regarding Garmin and the possibility that Ford and other OEMs may transition additional business to other platforms and providers, such as Google Automotive Services; the impact of GM’s announcement regarding Google Automotive Services; the Company’s ability to achieve additional design wins and the delivery dates of automobiles including the Company’s products; adoption by vehicle purchasers of Scout GPS Link; the Company’s dependence on a limited number of automobile manufacturers and tier ones for a substantial portion of its revenue, such as Ford and GM; reductions in demand for automobiles in general and specifically for Ford and GM vehicles; potential impacts of automobile manufacturers and tier ones, in particular Ford and GM, including competitive capabilities in their vehicles such as Apple CarPlay and Android Auto; the Company’s continued reporting of losses and operating expenses in excess of expectations; the timing of new product releases and vehicle production by the Company’s automotive customers, including inventory procurement and fulfillment; possible warranty claims, and the impact on consumer perception of its brand; the Company’s ability to perform under its initiatives with Amazon and Microsoft, and benefit from those initiatives; the potential that the Company may not be able to realize its deferred tax assets and may have to take a reserve against them. Telenav discusses these risks in greater detail in “Risk Factors” and elsewhere in its Form 10-K for the fiscal year ended June 30, 2020 and other filings with the U.S. Securities and Exchange Commission (“SEC”), including any subsequent Annual Report on Form 10-K or Quarterly Report on Form 10-Q, which are available on the SEC’s website at www.sec.gov. Also, forward-looking statements represent management’s beliefs and assumptions only as of the date made. You should review the company’s SEC filings carefully and with the understanding that actual future results may be materially different from what Telenav expects. Given these uncertainties, you should not place undue reliance on these forward-looking statements.

Use of Non-GAAP Financial Measures Telenav prepares its financial statements in accordance with generally accepted accounting principles for the United States, or GAAP. The non-GAAP financial measures such as billings, change in deferred revenue, change in deferred costs, adjusted EBITDA, and free cash flow included in this supplemental investor presentation are different from those otherwise presented under GAAP. Telenav has provided these measures in addition to GAAP financial results because management believes these non-GAAP measures help provide a consistent basis for comparison between periods that are not influenced by certain items and, therefore, are helpful in understanding Telenav’s underlying operating results. These non-GAAP measures are some of the primary measures Telenav’s management uses for planning and forecasting. These measures are not in accordance with, or an alternative to, GAAP and these non-GAAP measures may not be comparable to information provided by other companies. To reconcile the historical GAAP results to non-GAAP financial metrics, please refer to the reconciliations in the financial tables included in this supplemental investor presentation. Billings equal GAAP revenue recognized plus the change in deferred revenue from the beginning to the end of the applicable period. In connection with its presentation of the change in deferred revenue, Telenav has provided a similar presentation of the change in the related deferred costs. Such deferred costs primarily include costs associated with third party content and certain development costs associated with its customized software solutions whereby customized engineering fees are earned. As the company enters into more hybrid and brought-in navigation programs, deferred revenue and deferred costs become larger components of its operating results, so Telenav believes these metrics are useful in evaluating cash flows. Telenav considers billings to be a useful metric for management and investors because billings drive revenue and deferred revenue, which is an important indicator of its business. There are a number of limitations related to the use of billings versus revenue calculated in accordance with GAAP. First, billings include amounts that have not yet been recognized as revenue and may require additional services to be provided over contracted service periods. For example, billings related to certain brought-in solutions cannot be fully recognized as revenue in a given period due to requirements for ongoing map updates and provisioning of services such as hosting, monitoring, customer support and, for certain customers, additional period content and associated technology costs. Second, we may calculate billings in a manner that is different from peer companies that report similar financial measures, making comparisons between companies more difficult. Accordingly, when Telenav uses this measure, it attempts to compensate for these limitations by providing specific information regarding billings and how they relate to revenue calculated in accordance with GAAP. Adjusted EBITDA measures GAAP net income/loss adjusted for discontinued operations and excluding the impact of stock-based compensation expense, depreciation and amortization, other income (expense) net, provision (benefit) for income taxes, and other applicable items such as legal settlements and contingencies. Stock-based compensation expense relates to equity incentive awards granted to Telenav’s employees, directors, and consultants. Legal settlements and contingencies represent settlements, offers made to settle, or loss accruals relating to litigation or other disputes in which Telenav is a party or the indemnitor of a party. Adjusted EBITDA, while generally a measure of profitability, can also represent a loss. Adjusted EBITDA is a key measure Telenav uses to understand and evaluate its core operating performance and trends, to prepare and approve its annual budget and to develop short- and long-term operational plans. In particular, Telenav believes that the exclusion of the expenses eliminated when calculating adjusted EBITDA can provide a useful measure for period-to-period comparisons of Telenav’s core business. Accordingly, Telenav believes that adjusted EBITDA generally may provide useful information to investors and others in understanding and evaluating its operating results in the same manner as Telenav does. Free cash flow is a non-GAAP financial measure Telenav defines as net cash provided by (used in) operating activities, less purchases of property and equipment. Telenav considers free cash flow to be a liquidity measure that provides useful information to management and investors about the amount of cash (used in) generated by its business after purchases of property and equipment.Use of Non-GAAP Financial Measures Telenav prepares its financial statements in accordance with generally accepted accounting principles for the United States, or GAAP. The non-GAAP financial measures such as billings, change in deferred revenue, change in deferred costs, adjusted EBITDA, and free cash flow included in this supplemental investor presentation are different from those otherwise presented under GAAP. Telenav has provided these measures in addition to GAAP financial results because management believes these non-GAAP measures help provide a consistent basis for comparison between periods that are not influenced by certain items and, therefore, are helpful in understanding Telenav’s underlying operating results. These non-GAAP measures are some of the primary measures Telenav’s management uses for planning and forecasting. These measures are not in accordance with, or an alternative to, GAAP and these non-GAAP measures may not be comparable to information provided by other companies. To reconcile the historical GAAP results to non-GAAP financial metrics, please refer to the reconciliations in the financial tables included in this supplemental investor presentation. Billings equal GAAP revenue recognized plus the change in deferred revenue from the beginning to the end of the applicable period. In connection with its presentation of the change in deferred revenue, Telenav has provided a similar presentation of the change in the related deferred costs. Such deferred costs primarily include costs associated with third party content and certain development costs associated with its customized software solutions whereby customized engineering fees are earned. As the company enters into more hybrid and brought-in navigation programs, deferred revenue and deferred costs become larger components of its operating results, so Telenav believes these metrics are useful in evaluating cash flows. Telenav considers billings to be a useful metric for management and investors because billings drive revenue and deferred revenue, which is an important indicator of its business. There are a number of limitations related to the use of billings versus revenue calculated in accordance with GAAP. First, billings include amounts that have not yet been recognized as revenue and may require additional services to be provided over contracted service periods. For example, billings related to certain brought-in solutions cannot be fully recognized as revenue in a given period due to requirements for ongoing map updates and provisioning of services such as hosting, monitoring, customer support and, for certain customers, additional period content and associated technology costs. Second, we may calculate billings in a manner that is different from peer companies that report similar financial measures, making comparisons between companies more difficult. Accordingly, when Telenav uses this measure, it attempts to compensate for these limitations by providing specific information regarding billings and how they relate to revenue calculated in accordance with GAAP. Adjusted EBITDA measures GAAP net income/loss adjusted for discontinued operations and excluding the impact of stock-based compensation expense, depreciation and amortization, other income (expense) net, provision (benefit) for income taxes, and other applicable items such as legal settlements and contingencies. Stock-based compensation expense relates to equity incentive awards granted to Telenav’s employees, directors, and consultants. Legal settlements and contingencies represent settlements, offers made to settle, or loss accruals relating to litigation or other disputes in which Telenav is a party or the indemnitor of a party. Adjusted EBITDA, while generally a measure of profitability, can also represent a loss. Adjusted EBITDA is a key measure Telenav uses to understand and evaluate its core operating performance and trends, to prepare and approve its annual budget and to develop short- and long-term operational plans. In particular, Telenav believes that the exclusion of the expenses eliminated when calculating adjusted EBITDA can provide a useful measure for period-to-period comparisons of Telenav’s core business. Accordingly, Telenav believes that adjusted EBITDA generally may provide useful information to investors and others in understanding and evaluating its operating results in the same manner as Telenav does. Free cash flow is a non-GAAP financial measure Telenav defines as net cash provided by (used in) operating activities, less purchases of property and equipment. Telenav considers free cash flow to be a liquidity measure that provides useful information to management and investors about the amount of cash (used in) generated by its business after purchases of property and equipment.

Additional Information and Where to Find It » This communication is being made in respect of the proposed transaction involving Telenav and V99. In connection with the proposed transaction, Telenav intends to file relevant materials with the Securities and Exchange Commission (the “SEC”), including a proxy statement on Schedule 14A. Promptly after filing its definitive proxy statement with the SEC, Telenav will mail the definitive proxy statement and a proxy card to each stockholder of Telenav entitled to vote at the special meeting relating to the proposed transaction. This communication is not a substitute for the proxy statement or any other document that Telenav may file with the SEC or send to its stockholders in connection with the proposed transaction. BEFORE MAKING ANY VOTING DECISION, STOCKHOLDERS OF TELENAV ARE URGED TO READ THESE MATERIALS (INCLUDING ANY AMENDMENTS OR SUPPLEMENTS THERETO) AND ANY OTHER RELEVANT DOCUMENTS IN CONNECTION WITH THE PROPOSED TRANSACTION THAT TELENAV WILL FILE WITH THE SEC WHEN THEY BECOME AVAILABLE BECAUSE THEY WILL CONTAIN IMPORTANT INFORMATION ABOUT TELENAV AND THE PROPOSED TRANSACTION. The definitive proxy statement and other relevant materials in connection with the proposed transaction (when they become available), and any other documents filed by Telenav with the SEC, may be obtained free of charge at the SEC’s website (http://www.sec.gov) or at Telenav’s website (https://www.telenav.com/) or by contacting Telenav’s Investor Relations at IR@telenav.com. » Participants in the Solicitation ❯ Telenav and its directors and executive officers, including HP Jin and Samuel Chen, may be deemed to be participants in the solicitation of proxies from Telenav’s stockholders with respect to the proposed transaction. Information about Telenav’s directors and executive officers and their ownership of Telenav common stock is set forth in Telenav’s Annual Report on Form 10-K for the fiscal year ended June 30, 2020, which was filed with the SEC on August 21, 2020, as amended on October 26, 2020. Additional information regarding the potential participants, and their direct or indirect interests in the proposed transaction, by security holdings or otherwise, will be set forth in the proxy statement and other materials to be filed with SEC in connection with the proposed transaction.Additional Information and Where to Find It » This communication is being made in respect of the proposed transaction involving Telenav and V99. In connection with the proposed transaction, Telenav intends to file relevant materials with the Securities and Exchange Commission (the “SEC”), including a proxy statement on Schedule 14A. Promptly after filing its definitive proxy statement with the SEC, Telenav will mail the definitive proxy statement and a proxy card to each stockholder of Telenav entitled to vote at the special meeting relating to the proposed transaction. This communication is not a substitute for the proxy statement or any other document that Telenav may file with the SEC or send to its stockholders in connection with the proposed transaction. BEFORE MAKING ANY VOTING DECISION, STOCKHOLDERS OF TELENAV ARE URGED TO READ THESE MATERIALS (INCLUDING ANY AMENDMENTS OR SUPPLEMENTS THERETO) AND ANY OTHER RELEVANT DOCUMENTS IN CONNECTION WITH THE PROPOSED TRANSACTION THAT TELENAV WILL FILE WITH THE SEC WHEN THEY BECOME AVAILABLE BECAUSE THEY WILL CONTAIN IMPORTANT INFORMATION ABOUT TELENAV AND THE PROPOSED TRANSACTION. The definitive proxy statement and other relevant materials in connection with the proposed transaction (when they become available), and any other documents filed by Telenav with the SEC, may be obtained free of charge at the SEC’s website (http://www.sec.gov) or at Telenav’s website (https://www.telenav.com/) or by contacting Telenav’s Investor Relations at IR@telenav.com. » Participants in the Solicitation ❯ Telenav and its directors and executive officers, including HP Jin and Samuel Chen, may be deemed to be participants in the solicitation of proxies from Telenav’s stockholders with respect to the proposed transaction. Information about Telenav’s directors and executive officers and their ownership of Telenav common stock is set forth in Telenav’s Annual Report on Form 10-K for the fiscal year ended June 30, 2020, which was filed with the SEC on August 21, 2020, as amended on October 26, 2020. Additional information regarding the potential participants, and their direct or indirect interests in the proposed transaction, by security holdings or otherwise, will be set forth in the proxy statement and other materials to be filed with SEC in connection with the proposed transaction.

Key Financial Metrics | Strong Q1 Fiscal Year 2021 +$7.3M +$3.1M Year-over-year Net Year-over-year Income Growth EBITDA Growth * Q1’20 Q4’20 Q4’20 Q1’21 Q1’20 Q4’20 Q1’21 Q1’21 Q1’20 97% Quarter-over-quarter Revenue Growth *Q1FY20 net income contained a $(4) M loss from discontinued operations 5Key Financial Metrics | Strong Q1 Fiscal Year 2021 +$7.3M +$3.1M Year-over-year Net Year-over-year Income Growth EBITDA Growth * Q1’20 Q4’20 Q4’20 Q1’21 Q1’20 Q4’20 Q1’21 Q1’21 Q1’20 97% Quarter-over-quarter Revenue Growth *Q1FY20 net income contained a $(4) M loss from discontinued operations 5

Client Roster Adding to already impressive client roster Two New OEM Awards A New U.S.- based EV Truck Xpeng SAIC Manufacturer Nio, China- based EV GM Ford ManufacturerClient Roster Adding to already impressive client roster Two New OEM Awards A New U.S.- based EV Truck Xpeng SAIC Manufacturer Nio, China- based EV GM Ford Manufacturer

Connected Car Platform Strategy Building momentum via our flywheel strategy, focusing on 3 growth engines to capture +$500B* TAM T E L E N A V C O N N E C T E D $500 Billion C A R P L A T F O R M » Location Based Connected Car Intelligence Market (LBI) » Big Data + AI Margin Expansion with Higher Quality Service * Source: McKinsey Report--Monetizing Car Data, Sept. 2016 7Connected Car Platform Strategy Building momentum via our flywheel strategy, focusing on 3 growth engines to capture +$500B* TAM T E L E N A V C O N N E C T E D $500 Billion C A R P L A T F O R M » Location Based Connected Car Intelligence Market (LBI) » Big Data + AI Margin Expansion with Higher Quality Service * Source: McKinsey Report--Monetizing Car Data, Sept. 2016 7

In-Car Software and Service »Now engaged with 3 leading EV manufacturers, including 2 new OEMs ❯ A new, U.S.-based EV Truck Manufacturer ❯ Nio, a China-based EV Manufacturer »Cadillac Escalade debut featuring advanced navigation functionality (right) »Awarded top spot for navigation by T E L E N A V JD Power for 2020 Lincoln Corsair C O N N E C T E D C A R P L A T F O R M » Location Based SUV Intelligence (LBI) » Big Data + AI 8In-Car Software and Service »Now engaged with 3 leading EV manufacturers, including 2 new OEMs ❯ A new, U.S.-based EV Truck Manufacturer ❯ Nio, a China-based EV Manufacturer »Cadillac Escalade debut featuring advanced navigation functionality (right) »Awarded top spot for navigation by T E L E N A V JD Power for 2020 Lincoln Corsair C O N N E C T E D C A R P L A T F O R M » Location Based SUV Intelligence (LBI) » Big Data + AI 8

In-Car Commerce and Communication »Continued to develop ICC; launch with Japanese OEM expected in 2H FY21 »Increased investment in Motion Auto Insurance ❯ Expanding market coverage to 48 states in coming months ❯ Continues to scale at an accelerated pace »InMarket Media merged with T E L E N A V NinthDecimal in September to become C O N N E C T E D C A R P L A T F O R M one of the largest location-based ad » Location Based Intelligence (LBI) platforms globally » Big Data + AI 9In-Car Commerce and Communication »Continued to develop ICC; launch with Japanese OEM expected in 2H FY21 »Increased investment in Motion Auto Insurance ❯ Expanding market coverage to 48 states in coming months ❯ Continues to scale at an accelerated pace »InMarket Media merged with T E L E N A V NinthDecimal in September to become C O N N E C T E D C A R P L A T F O R M one of the largest location-based ad » Location Based Intelligence (LBI) platforms globally » Big Data + AI 9

Road Intelligence T E L E N A V C O N N E C T E D C A R P L A T F O R M » Location Based Intelligence (LBI) » Big Data + AI »Working to develop full stack solutions which will include content, application and services – reducing dependency on rd 3 parties »Partnership with Grab to enhance Open Street Maps (OSM) »Exploring other road intelligence / ride hailing deals deal across the globe 10Road Intelligence T E L E N A V C O N N E C T E D C A R P L A T F O R M » Location Based Intelligence (LBI) » Big Data + AI »Working to develop full stack solutions which will include content, application and services – reducing dependency on rd 3 parties »Partnership with Grab to enhance Open Street Maps (OSM) »Exploring other road intelligence / ride hailing deals deal across the globe 10

Industry Trends »Operating Systems »EVs T E L E N A V C O N N E C T E D »China for rest of world C A R P L A T F O R M » Location Based »Consumer flexibility & voice Intelligence (LBI) »Pandemic as catalyst for ICC » Big Data + AI 11Industry Trends »Operating Systems »EVs T E L E N A V C O N N E C T E D »China for rest of world C A R P L A T F O R M » Location Based »Consumer flexibility & voice Intelligence (LBI) »Pandemic as catalyst for ICC » Big Data + AI 11

Q1 FY21 Financial OverviewQ1 FY21 Financial Overview

Key Messages Solid Q1FY21 financial performance, including strong rebound from Covid-19 impacted Q4FY20 Telenav delivered strong financial results, recovering from Covid-19 impacted Q4FY20 to post Y/Y revenue growth and positive non-GAAP adjusted EBITDA » Q1FY21 Revenue of $69.6M up 4% Y/Y, +97% Q/Q 1 » Q1FY21 Net Income of $3.3M, up $7.3M* Y/Y » Q1FY21 EBITDA of $5.6M, up $3.1M Y/Y *Q1FY20 net income contained a $(4) M loss from discontinued operations * $98.8M in cash , strong position despite investments of $5.7M made in quarter » Equity and debt investments to-date made in multiple companies of approx. $39M 2 » $138M in cash, cash equivalents, short term investments, equity and debt investments represent approximately 81% of TNAV’s Market Cap at end of quarter *Includes cash, cash equivalents, and short term investments Continued to execute on our connected car platform strategy to capitalize on the $500B connected car market » Momentum continues with two new OEM awards: a US EV OEM and Nio in China 3 » Well positioned in EV market with 3 of the top EV brands » Increasing share of Chinese OEMs for rest of world with recent Nio, X-Peng, SAIC awards » Increased investment in Motion Auto to help scale to 48 states as we continue to partner and drive our in-car insurance solution forward Covid-19 Update 4 » OEMs returning to pre-Covid production levels » Q1FY21 results solid, but Covid-19 risk still exists » TNAV workforce continuing their resilience with all key projects on track without any disruption - Please refer to the financial tables at the back of this presentation and Telenav’s Investor Relations website for the latest SEC filingsKey Messages Solid Q1FY21 financial performance, including strong rebound from Covid-19 impacted Q4FY20 Telenav delivered strong financial results, recovering from Covid-19 impacted Q4FY20 to post Y/Y revenue growth and positive non-GAAP adjusted EBITDA » Q1FY21 Revenue of $69.6M up 4% Y/Y, +97% Q/Q 1 » Q1FY21 Net Income of $3.3M, up $7.3M* Y/Y » Q1FY21 EBITDA of $5.6M, up $3.1M Y/Y *Q1FY20 net income contained a $(4) M loss from discontinued operations * $98.8M in cash , strong position despite investments of $5.7M made in quarter » Equity and debt investments to-date made in multiple companies of approx. $39M 2 » $138M in cash, cash equivalents, short term investments, equity and debt investments represent approximately 81% of TNAV’s Market Cap at end of quarter *Includes cash, cash equivalents, and short term investments Continued to execute on our connected car platform strategy to capitalize on the $500B connected car market » Momentum continues with two new OEM awards: a US EV OEM and Nio in China 3 » Well positioned in EV market with 3 of the top EV brands » Increasing share of Chinese OEMs for rest of world with recent Nio, X-Peng, SAIC awards » Increased investment in Motion Auto to help scale to 48 states as we continue to partner and drive our in-car insurance solution forward Covid-19 Update 4 » OEMs returning to pre-Covid production levels » Q1FY21 results solid, but Covid-19 risk still exists » TNAV workforce continuing their resilience with all key projects on track without any disruption - Please refer to the financial tables at the back of this presentation and Telenav’s Investor Relations website for the latest SEC filings

Key Metrics Strong rebound in Q1’21 versus Covid-19 impacted Q4’20 1 4 7 1 2 1 Billings OPEX FCF 40% of Rev $64M -$5M -5 pts YoY -$27M YoY -17% YoY -31 pts QoQ +106% QoQ +$9M QoQ 2 5 2 2,3 8 1,4 Total Cash Revenue Net Income $99M $70M $3M +4% YoY +$7M YoY -19% YoY +97% QoQ +$13M QoQ -11% QoQ 3 6 2 9 1 Gross Margin % Adjusted EBITDA Total Installed Base 42% 31M $6M -2 pts YoY +$3M YoY +19% YoY 0 pts QoQ +4% QoQ +$12M QoQ 1 - Non-GAAP measure 2 - GAAP measure 3 - Q1FY20 net income contained a $(4) M loss from discontinued operations 4 – Cash, cash equivalents, short term investments - Please refer to the financial tables at the back of this presentation and Telenav’s Investor Relations website for the latest SEC filingsKey Metrics Strong rebound in Q1’21 versus Covid-19 impacted Q4’20 1 4 7 1 2 1 Billings OPEX FCF 40% of Rev $64M -$5M -5 pts YoY -$27M YoY -17% YoY -31 pts QoQ +106% QoQ +$9M QoQ 2 5 2 2,3 8 1,4 Total Cash Revenue Net Income $99M $70M $3M +4% YoY +$7M YoY -19% YoY +97% QoQ +$13M QoQ -11% QoQ 3 6 2 9 1 Gross Margin % Adjusted EBITDA Total Installed Base 42% 31M $6M -2 pts YoY +$3M YoY +19% YoY 0 pts QoQ +4% QoQ +$12M QoQ 1 - Non-GAAP measure 2 - GAAP measure 3 - Q1FY20 net income contained a $(4) M loss from discontinued operations 4 – Cash, cash equivalents, short term investments - Please refer to the financial tables at the back of this presentation and Telenav’s Investor Relations website for the latest SEC filings

Performance Overview Breakdown Substantial revenue growth Y/Y in both product and services Services Telenav Total Company Revenue Revenue Gross profit Mix $69.6 million $29.5 million +4% y/y 42% of revenue, -2 pts y/y Product Key Highlights Product Revenue Gross profit Ø Year-over-year growth in revenue with significant services revenue mix increase $56.8 million $24.3 million Ø Total revenue of $69.6 million, up 4% Y/Y; Gross Margin of 42% down +1% y/y 43% of revenue, 0 pts y/y 2 pts Y/Y Ø Services business represented 18% of the overall revenue mix Services Ø Operating Profit rebounded to positive in Q1 FY21 at $2.0 million, compared with a loss of $(0.1) million in Q1 FY20 Revenue Gross profit Ø GAAP net income for Q1 FY21 was $3.3 million, compared with a loss of $(4.0) million for Q1 FY20* $12.8 million $ 5.2 million +20% y/y 41% of revenue, -13 pts y/y *Q1FY20 net income contained a $(4) M loss from discontinued operations All measures above are GAAP - Please refer to the financial tables at the back of this presentation and Telenav’s Investor Relations website for the latest SEC filingsPerformance Overview Breakdown Substantial revenue growth Y/Y in both product and services Services Telenav Total Company Revenue Revenue Gross profit Mix $69.6 million $29.5 million +4% y/y 42% of revenue, -2 pts y/y Product Key Highlights Product Revenue Gross profit Ø Year-over-year growth in revenue with significant services revenue mix increase $56.8 million $24.3 million Ø Total revenue of $69.6 million, up 4% Y/Y; Gross Margin of 42% down +1% y/y 43% of revenue, 0 pts y/y 2 pts Y/Y Ø Services business represented 18% of the overall revenue mix Services Ø Operating Profit rebounded to positive in Q1 FY21 at $2.0 million, compared with a loss of $(0.1) million in Q1 FY20 Revenue Gross profit Ø GAAP net income for Q1 FY21 was $3.3 million, compared with a loss of $(4.0) million for Q1 FY20* $12.8 million $ 5.2 million +20% y/y 41% of revenue, -13 pts y/y *Q1FY20 net income contained a $(4) M loss from discontinued operations All measures above are GAAP - Please refer to the financial tables at the back of this presentation and Telenav’s Investor Relations website for the latest SEC filings

Growth Opportunities Huge navigation & infotainment market opportunity with sizable market segments to address 5 4 Aftermarket all-in- 3 one VIVID solution In-Car Commerce 2 VIVID as an 1 embedded Connected car market is platform for OEMs Increase share of expected to be $500+ wallet within 2 billion by 2030 existing customers Win New OEM’s 1 http://www.automotivebusiness.com.br/abinteligencia/pdf/TheDigitalDriveReport-January2018.pdf 2 16 McKinsey Report--Monetizing Car Data, Sept. 2016, ** https://www.statista.com/statistics/233743/vehicle-sales-in-china/Growth Opportunities Huge navigation & infotainment market opportunity with sizable market segments to address 5 4 Aftermarket all-in- 3 one VIVID solution In-Car Commerce 2 VIVID as an 1 embedded Connected car market is platform for OEMs Increase share of expected to be $500+ wallet within 2 billion by 2030 existing customers Win New OEM’s 1 http://www.automotivebusiness.com.br/abinteligencia/pdf/TheDigitalDriveReport-January2018.pdf 2 16 McKinsey Report--Monetizing Car Data, Sept. 2016, ** https://www.statista.com/statistics/233743/vehicle-sales-in-china/

FY21 Focus Areas of Operational Discipline & Cost Controls » Single digit reduction in Workforce » Reduce contractor spend » Minimize discretionary spend Q1FY21 OpEx » Execute on labor location strategy -8% Y/Y » Several other initiatives in the works to further control costs » IT transformation to drive operational efficiencies and productivity gainsFY21 Focus Areas of Operational Discipline & Cost Controls » Single digit reduction in Workforce » Reduce contractor spend » Minimize discretionary spend Q1FY21 OpEx » Execute on labor location strategy -8% Y/Y » Several other initiatives in the works to further control costs » IT transformation to drive operational efficiencies and productivity gains

Q1 FY21 Appendix and Financial TablesQ1 FY21 Appendix and Financial Tables

Key Financial Metrics Significant quarter-over-quarter growth in revenue, billings, and free cash flow Revenue ($m) Billings ($m) - Revenue is a GAAP measure - Billings is a non-GAAP measure Q1 FY20 Q4 FY20 Q1 FY21 Q1 FY20 Q4 FY20 Q1 FY21 Total Cash on Hand ($m) Free Cash Flow ($m) - Both charts represent Non-GAAP measures - Total Cash on Hand includes cash, cash equivalents, and short-term investments - Please refer to the financial tables at the back of this presentation and Telenav’s Investor Relations website - Please refer to the financial tables at the back of this presentation and for the latest SEC filings Q1 FY20 Q4 FY20 Q1 FY21 Q1 FY20 Q4 FY20 Q1 FY21 Telenav’s Investor Relations website for the latest SEC filingsKey Financial Metrics Significant quarter-over-quarter growth in revenue, billings, and free cash flow Revenue ($m) Billings ($m) - Revenue is a GAAP measure - Billings is a non-GAAP measure Q1 FY20 Q4 FY20 Q1 FY21 Q1 FY20 Q4 FY20 Q1 FY21 Total Cash on Hand ($m) Free Cash Flow ($m) - Both charts represent Non-GAAP measures - Total Cash on Hand includes cash, cash equivalents, and short-term investments - Please refer to the financial tables at the back of this presentation and Telenav’s Investor Relations website - Please refer to the financial tables at the back of this presentation and for the latest SEC filings Q1 FY20 Q4 FY20 Q1 FY21 Q1 FY20 Q4 FY20 Q1 FY21 Telenav’s Investor Relations website for the latest SEC filings
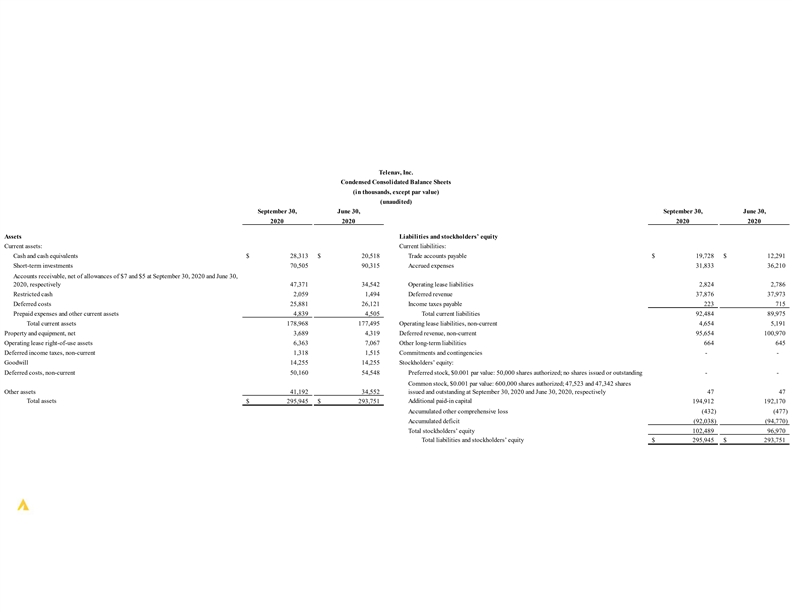
Telenav, Inc. Condensed Consolidated Balance Sheets (in thousands, except par value) (unaudited) September 30, June 30, September 30, June 30, 2020 2020 2020 2020 Assets Liabilities and stockholders’ equity Current assets: Current liabilities: Cash and cash equivalents $ 28,313 $ 20,518 Trade accounts payable $ 19,728 $ 12,291 Short-term investments 70,505 90,315 Accrued expenses 31,833 36,210 Accounts receivable, net of allowances of $7 and $5 at September 30, 2020 and June 30, 2020, respectively 47,371 34,542 Operating lease liabilities 2,824 2,786 Restricted cash 2,059 1,494 Deferred revenue 37,876 37,973 Deferred costs 25,881 26,121 Income taxes payable 223 715 Prepaid expenses and other current assets 4,839 4,505 Total current liabilities 92,484 89,975 Total current assets 178,968 177,495 Operating lease liabilities, non-current 4,654 5,191 Property and equipment, net 3,689 4,319 Deferred revenue, non-current 95,654 100,970 Operating lease right-of-use assets 6,363 7,067 Other long-term liabilities 664 645 Deferred income taxes, non-current 1,318 1,515 Commitments and contingencies - - Goodwill and intangible assets, net 14,255 14,255 Stockholders’ equity: Deferred costs, non-current 50,160 54,548 Preferred stock, $0.001 par value: 50,000 shares authorized; no shares issued or outstanding - - Common stock, $0.001 par value: 600,000 shares authorized; 47,523 and 47,342 shares Other assets 41,192 34,552 issued and outstanding at September 30, 2020 and June 30, 2020, respectively 47 47 Total assets $ 295,945 $ 2 93,751 Additional paid-in capital 194,912 192,170 Accumulated other comprehensive loss (432) (477) Accumulated deficit (92,038) (94,770) Total stockholders’ equity 102,489 96,970 Total liabilities and stockholders’ equity $ 295,945 $ 2 93,751Telenav, Inc. Condensed Consolidated Balance Sheets (in thousands, except par value) (unaudited) September 30, June 30, September 30, June 30, 2020 2020 2020 2020 Assets Liabilities and stockholders’ equity Current assets: Current liabilities: Cash and cash equivalents $ 28,313 $ 20,518 Trade accounts payable $ 19,728 $ 12,291 Short-term investments 70,505 90,315 Accrued expenses 31,833 36,210 Accounts receivable, net of allowances of $7 and $5 at September 30, 2020 and June 30, 2020, respectively 47,371 34,542 Operating lease liabilities 2,824 2,786 Restricted cash 2,059 1,494 Deferred revenue 37,876 37,973 Deferred costs 25,881 26,121 Income taxes payable 223 715 Prepaid expenses and other current assets 4,839 4,505 Total current liabilities 92,484 89,975 Total current assets 178,968 177,495 Operating lease liabilities, non-current 4,654 5,191 Property and equipment, net 3,689 4,319 Deferred revenue, non-current 95,654 100,970 Operating lease right-of-use assets 6,363 7,067 Other long-term liabilities 664 645 Deferred income taxes, non-current 1,318 1,515 Commitments and contingencies - - Goodwill and intangible assets, net 14,255 14,255 Stockholders’ equity: Deferred costs, non-current 50,160 54,548 Preferred stock, $0.001 par value: 50,000 shares authorized; no shares issued or outstanding - - Common stock, $0.001 par value: 600,000 shares authorized; 47,523 and 47,342 shares Other assets 41,192 34,552 issued and outstanding at September 30, 2020 and June 30, 2020, respectively 47 47 Total assets $ 295,945 $ 2 93,751 Additional paid-in capital 194,912 192,170 Accumulated other comprehensive loss (432) (477) Accumulated deficit (92,038) (94,770) Total stockholders’ equity 102,489 96,970 Total liabilities and stockholders’ equity $ 295,945 $ 2 93,751

Telenav, Inc. Condensed Consolidated Statements of Operations (in thousands, except per share amounts) (unaudited) Three Months Ended September 30, 2020 2019 Revenue: Product $ 56,809 $ 55,990 Services 12,787 10,639 Total revenue 69,596 66,629 Cost of revenue: Product 32,530 31,989 Services 7,553 4,862 Total cost of revenue 40,083 36,851 Gross profit 29,513 29,778 Operating expenses: Research and development 18,986 20,663 Sales and marketing 1,996 1,946 General and administrative 6,512 7,287 Total operating expenses 27,494 29,896 Income (loss) from operations 2,019 (118) Other income, net 714 561 Income from continuing operations before provision for income taxes 2,733 443 Provision for income taxes 14 411 Equity in net (income) of equity method investees (616) - Income from continuing operations 3,335 32 Discontinued operations: Income from operations of Advertising business, net of tax - 832 Loss from sale of Advertising business - (4,818) Loss on discontinued operations - (3,986) Net income (loss) $ 3,335 $ (3,954) Basic income (loss) per share: Income from continuing operations $ 0.07 $ 0.00 Loss on discontinued operations - (0.08) Net Income (loss) $ 0.07 $ (0.08) Diluted income (loss) per share: Income from continuing operations $ 0.07 $ 0.00 Loss on discontinued operations - (0.08) Net Income (loss) $ 0.07 $ (0.08) Weighted average shares used in computing income (loss) per share Basic 47,227 47,780 Diluted 47,841 49,648Telenav, Inc. Condensed Consolidated Statements of Operations (in thousands, except per share amounts) (unaudited) Three Months Ended September 30, 2020 2019 Revenue: Product $ 56,809 $ 55,990 Services 12,787 10,639 Total revenue 69,596 66,629 Cost of revenue: Product 32,530 31,989 Services 7,553 4,862 Total cost of revenue 40,083 36,851 Gross profit 29,513 29,778 Operating expenses: Research and development 18,986 20,663 Sales and marketing 1,996 1,946 General and administrative 6,512 7,287 Total operating expenses 27,494 29,896 Income (loss) from operations 2,019 (118) Other income, net 714 561 Income from continuing operations before provision for income taxes 2,733 443 Provision for income taxes 14 411 Equity in net (income) of equity method investees (616) - Income from continuing operations 3,335 32 Discontinued operations: Income from operations of Advertising business, net of tax - 832 Loss from sale of Advertising business - (4,818) Loss on discontinued operations - (3,986) Net income (loss) $ 3,335 $ (3,954) Basic income (loss) per share: Income from continuing operations $ 0.07 $ 0.00 Loss on discontinued operations - (0.08) Net Income (loss) $ 0.07 $ (0.08) Diluted income (loss) per share: Income from continuing operations $ 0.07 $ 0.00 Loss on discontinued operations - (0.08) Net Income (loss) $ 0.07 $ (0.08) Weighted average shares used in computing income (loss) per share Basic 47,227 47,780 Diluted 47,841 49,648

Telenav, Inc. Condensed Consolidated Statements of Cash Flows (in thousands) (unaudited) Three Months Ended Three Months Ended September 30, September 30, 2020 2019 2020 2019 Operating activities Investing activities Net income (loss) $ 3,335 $ (3,954) Purchases of property and equipment (67) (461) Loss on discontinued operations - 3,986 Purchases of short-term investments (2,381) (41,418) Income from continuing operations 3,335 32 Purchases of long-term investments (5,711) (2,000) Adjustments to reconcile income from continuing operations to net cash provided by (used in) operating activities: Proceeds from sales and maturities of short-term investments 21,791 11,052 Stock-based compensation expense 2,857 1,752 Net cash provided by (used in) investing activities 13,632 (32,827) Depreciation and amortization 7 60 922 Financing activities Operating lease amortization, net of accretion 7 10 5 44 Proceeds from exercise of stock options 67 8,306 Accretion of net premium on short-term investments 85 12 Tax withholdings related to net share settlements of restricted stock units (359) (832) Equity in net (income) of equity method investees (616) - Proceeds from issuance of common stock under employee stock purchase plan 1,204 - Other (351) 101 Repurchase of common stock (1,630) - Changes in operating assets and liabilities: Net cash provided by (used in) financing activities (718) 7,474 Accounts receivable (12,653) 16,355 Effect of exchange rate changes on cash, cash equivalents and restricted cash 4 54 (336) Deferred income taxes 245 171 Net increase (decrease) in cash, cash equivalents and restricted cash, continuing operations 8,360 (3,520) Deferred costs 4,694 1,979 Net cash used in discontinued operations - (3,975) Prepaid expenses and other current assets 2 05 (502) Cash, cash equivalents and restricted cash, beginning of period 22,012 29,225 Other assets (513) 28 Cash, cash equivalents and restricted cash, end of period $ 30,372 $ 21,730 Trade accounts payable 7,431 1,738 Supplemental disclosure of cash flow information Accrued expenses and other liabilities (4,537) ( 10,259) Income taxes paid, net $ 472 $ 739 Non-cash investing: Investment in inMarket Media, LLC acquired in exchange for sale of Income taxes payable (500) (152) Advertising business $ - $ 15,600 Operating lease liabilities (504) (897) Cash flow from discontinued operations: Deferred revenue (5,656) 10,345 Net cash used in operating activities $ - $ ( 3,569) Net cash provided by (used in) operating activities (5,008) 22,169 Net cash used in financing activities - (406) Net cash transferred from continuing operations - 3,975 Net change in cash and cash equivalent from discontinued operations - - Cash and cash equivalents of discontinued operations, beginning of period - - Cash and cash equivalenta of discontinued operations, end of period $ - $ - Reconciliation of cash, cash equivalents and restricted cash to the condensed consolidated balance sheets Cash and cash equivalents $ 28,313 $ 19,278 Restricted cash 2,059 2,452 Total cash, cash equivalents and restricted cash $ 30,372 $ 21,730Telenav, Inc. Condensed Consolidated Statements of Cash Flows (in thousands) (unaudited) Three Months Ended Three Months Ended September 30, September 30, 2020 2019 2020 2019 Operating activities Investing activities Net income (loss) $ 3,335 $ (3,954) Purchases of property and equipment (67) (461) Loss on discontinued operations - 3,986 Purchases of short-term investments (2,381) (41,418) Income from continuing operations 3,335 32 Purchases of long-term investments (5,711) (2,000) Adjustments to reconcile income from continuing operations to net cash provided by (used in) operating activities: Proceeds from sales and maturities of short-term investments 21,791 11,052 Stock-based compensation expense 2,857 1,752 Net cash provided by (used in) investing activities 13,632 (32,827) Depreciation and amortization 7 60 922 Financing activities Operating lease amortization, net of accretion 7 10 5 44 Proceeds from exercise of stock options 67 8,306 Accretion of net premium on short-term investments 85 12 Tax withholdings related to net share settlements of restricted stock units (359) (832) Equity in net (income) of equity method investees (616) - Proceeds from issuance of common stock under employee stock purchase plan 1,204 - Other (351) 101 Repurchase of common stock (1,630) - Changes in operating assets and liabilities: Net cash provided by (used in) financing activities (718) 7,474 Accounts receivable (12,653) 16,355 Effect of exchange rate changes on cash, cash equivalents and restricted cash 4 54 (336) Deferred income taxes 245 171 Net increase (decrease) in cash, cash equivalents and restricted cash, continuing operations 8,360 (3,520) Deferred costs 4,694 1,979 Net cash used in discontinued operations - (3,975) Prepaid expenses and other current assets 2 05 (502) Cash, cash equivalents and restricted cash, beginning of period 22,012 29,225 Other assets (513) 28 Cash, cash equivalents and restricted cash, end of period $ 30,372 $ 21,730 Trade accounts payable 7,431 1,738 Supplemental disclosure of cash flow information Accrued expenses and other liabilities (4,537) ( 10,259) Income taxes paid, net $ 472 $ 739 Non-cash investing: Investment in inMarket Media, LLC acquired in exchange for sale of Income taxes payable (500) (152) Advertising business $ - $ 15,600 Operating lease liabilities (504) (897) Cash flow from discontinued operations: Deferred revenue (5,656) 10,345 Net cash used in operating activities $ - $ ( 3,569) Net cash provided by (used in) operating activities (5,008) 22,169 Net cash used in financing activities - (406) Net cash transferred from continuing operations - 3,975 Net change in cash and cash equivalent from discontinued operations - - Cash and cash equivalents of discontinued operations, beginning of period - - Cash and cash equivalenta of discontinued operations, end of period $ - $ - Reconciliation of cash, cash equivalents and restricted cash to the condensed consolidated balance sheets Cash and cash equivalents $ 28,313 $ 19,278 Restricted cash 2,059 2,452 Total cash, cash equivalents and restricted cash $ 30,372 $ 21,730
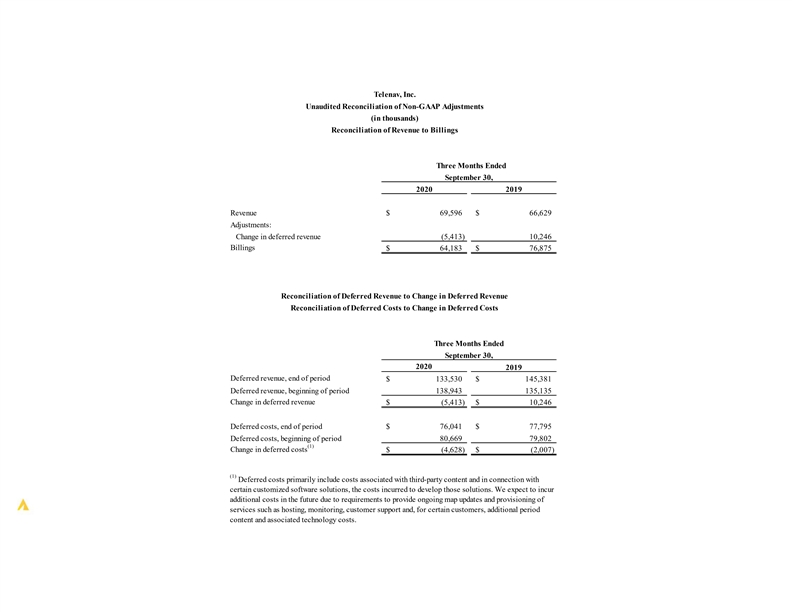
Telenav, Inc. Unaudited Reconciliation of Non-GAAP Adjustments (in thousands) Reconciliation of Revenue to Billings Three Months Ended September 30, 2020 2019 Revenue $ 69,596 $ 66,629 Adjustments: Change in deferred revenue (5,413) 10,246 Billings $ 64,183 $ 76,875 Reconciliation of Deferred Revenue to Change in Deferred Revenue Reconciliation of Deferred Costs to Change in Deferred Costs Three Months Ended September 30, 2020 2019 Deferred revenue, end of period $ 133,530 $ 1 45,381 Deferred revenue, beginning of period 138,943 135,135 Change in deferred revenue $ ( 5,413) $ 10,246 Deferred costs, end of period $ 76,041 $ 77,795 Deferred costs, beginning of period 80,669 79,802 (1) Change in deferred costs $ ( 4,628) $ (2,007) (1) Deferred costs primarily include costs associated with third-party content and in connection with certain customized software solutions, the costs incurred to develop those solutions. We expect to incur additional costs in the future due to requirements to provide ongoing map updates and provisioning of services such as hosting, monitoring, customer support and, for certain customers, additional period content and associated technology costs.Telenav, Inc. Unaudited Reconciliation of Non-GAAP Adjustments (in thousands) Reconciliation of Revenue to Billings Three Months Ended September 30, 2020 2019 Revenue $ 69,596 $ 66,629 Adjustments: Change in deferred revenue (5,413) 10,246 Billings $ 64,183 $ 76,875 Reconciliation of Deferred Revenue to Change in Deferred Revenue Reconciliation of Deferred Costs to Change in Deferred Costs Three Months Ended September 30, 2020 2019 Deferred revenue, end of period $ 133,530 $ 1 45,381 Deferred revenue, beginning of period 138,943 135,135 Change in deferred revenue $ ( 5,413) $ 10,246 Deferred costs, end of period $ 76,041 $ 77,795 Deferred costs, beginning of period 80,669 79,802 (1) Change in deferred costs $ ( 4,628) $ (2,007) (1) Deferred costs primarily include costs associated with third-party content and in connection with certain customized software solutions, the costs incurred to develop those solutions. We expect to incur additional costs in the future due to requirements to provide ongoing map updates and provisioning of services such as hosting, monitoring, customer support and, for certain customers, additional period content and associated technology costs.

Telenav, Inc. Unaudited Reconciliation of Non-GAAP Adjustments (in thousands) Reconciliation of Net Income (Loss) to Adjusted EBITDA Three Months Ended September 30, 2020 2019 Net income (loss) $ 3,335 $ (3,954) Loss on discontinued operations - 3,986 Income from continuing operations 3,335 32 Adjustments: Stock-based compensation expense 2,857 1,752 Depreciation and amortization expense 760 922 Other income, net (714) (561) Provision for income taxes 14 4 11 Equity in net (income) of equity method investees (616) - Adjusted EBITDA $ 5,636 $ 2,556Telenav, Inc. Unaudited Reconciliation of Non-GAAP Adjustments (in thousands) Reconciliation of Net Income (Loss) to Adjusted EBITDA Three Months Ended September 30, 2020 2019 Net income (loss) $ 3,335 $ (3,954) Loss on discontinued operations - 3,986 Income from continuing operations 3,335 32 Adjustments: Stock-based compensation expense 2,857 1,752 Depreciation and amortization expense 760 922 Other income, net (714) (561) Provision for income taxes 14 4 11 Equity in net (income) of equity method investees (616) - Adjusted EBITDA $ 5,636 $ 2,556

Telenav, Inc. Unaudited Reconciliation of Non-GAAP Adjustments (in thousands) Reconciliation of Net Income (Loss) to Free Cash Flow Three Months Ended September 30, 2020 2019 Net income (loss) $ 3,335 $ (3,954) Loss on discontinued operations - 3,986 Income from continuing operations 3,335 32 Adjustments to reconcile income from continuing operations to net cash provided by (used in) operating activities: (1) Change in deferred revenue (5,656) 10,345 (2) Change in deferred costs 4,694 1,979 Changes in other operating assets and liabilities (10,826) 6,482 (3) Other adjustments 3,445 3,331 Net cash provided by (used in) operating activities (5,008) 22,169 Less: Purchases of property and equipment (67) (461) Free cash flow $ ( 5,075) $ 21,708 (1) Consists of product royalties, customized software development fees, service fees and subscription fees. (2) Consist primarily of third party content costs and customized software development expenses. (3) Consist primarily of depreciation and amortization, stock-based compensation expense and other non-cash items.Telenav, Inc. Unaudited Reconciliation of Non-GAAP Adjustments (in thousands) Reconciliation of Net Income (Loss) to Free Cash Flow Three Months Ended September 30, 2020 2019 Net income (loss) $ 3,335 $ (3,954) Loss on discontinued operations - 3,986 Income from continuing operations 3,335 32 Adjustments to reconcile income from continuing operations to net cash provided by (used in) operating activities: (1) Change in deferred revenue (5,656) 10,345 (2) Change in deferred costs 4,694 1,979 Changes in other operating assets and liabilities (10,826) 6,482 (3) Other adjustments 3,445 3,331 Net cash provided by (used in) operating activities (5,008) 22,169 Less: Purchases of property and equipment (67) (461) Free cash flow $ ( 5,075) $ 21,708 (1) Consists of product royalties, customized software development fees, service fees and subscription fees. (2) Consist primarily of third party content costs and customized software development expenses. (3) Consist primarily of depreciation and amortization, stock-based compensation expense and other non-cash items.