Attached files
| file | filename |
|---|---|
| EX-99.1 - EX-99.1 - PENN VIRGINIA CORP | d27537dex991.htm |
| 8-K - 8-K - PENN VIRGINIA CORP | d27537d8k.htm |
Penn Virginia Positions for the Future: November 3, 2020 Transformational Equity Investment from Juniper Capital and Bolt-on Asset Purchase Exhibit 99.2
Forward-Looking and Cautionary Statements This communication contains “forward-looking statements” within the meaning of Section 27A of the Securities Act of 1933, as amended, and Section 21E of the Securities Exchange Act of 1934, as amended. All statements, other than statements of historical fact, included in this communication that address activities, events or developments that Penn Virginia expects, believes or anticipates will or may occur in the future are forward-looking statements. Words such as “estimate,” “project,” “predict,” “believe,” “expect,” “anticipate,” “potential,” “create,” “intend,” “could,” “may,” “plan,” “will,” “guidance,” “look,” “goal,” “future,” “build,” “focus,” “continue,” “allow” or the negative of such terms or other variations thereof and words and terms of similar substance used in connection with any discussion of future plans, actions, or events identify forward-looking statements. However, the absence of these words does not mean that the statements are not forward-looking. These forward-looking statements include, but are not limited to, statements regarding the transactions with Juniper Capital described herein (the “Transaction”), pro forma descriptions of the combined company and its operations, integration, debt levels, acreage, well performance, development plans, per unit costs, ability to maintain production within cash flow, synergies, opportunities and anticipated future performance. Pro forma information should not be considered a forecast of future results. There are a number of risks and uncertainties that could cause actual results to differ materially from the forward-looking statements included in this communication. These include the expected timing and likelihood of completion of the Transaction, including the timing, receipt and terms and conditions of any required governmental and regulatory approvals of the Transaction that could reduce anticipated benefits or cause the parties to abandon the Transaction; the ability to successfully integrate the assets to be acquired in the Transaction; the occurrence of any event, change or other circumstances that could give rise to the termination of the contribution agreements related to the Transaction; the possibility that shareholders of Penn Virginia may not approve the issuance of equity in the Transaction or there may be a delay in receiving expected shareholder approval; the risk that the parties may not be able to satisfy the conditions to the Transaction in a timely manner or at all; the risk that any announcements relating to the Transaction could have adverse effects on the market price of Penn Virginia’s common stock; the risk that changes in Penn Virginia’s capital structure and governance, including its status as a controlled company, could have adverse effects on the market value of its securities; the ability of Penn Virginia to retain customers and retain and hire key personnel and maintain relationships with its suppliers and customers and on Penn Virginia’s operating results and business generally; the risk the pending Transaction could distract management from ongoing business operations or cause Penn Virginia to incur substantial costs; the risk that the expanded acreage footprint does not allow for longer laterals, lower per unit operating expenses, and increased number of wells per pad as expected; the ability of Penn Virginia to develop drilling locations, which do not represent oil and gas reserves, into production or proved reserves; the risk that Penn Virginia may be unable to reduce expenses or access financing or liquidity; the risk that the Company does not realize expected benefits of its hedges; the impact of the COVID-19 pandemic, the related economic downturn and the related substantial decline in demand for oil and natural gas; and other important factors that could cause actual results to differ materially from those projected. All such factors are difficult to predict and are beyond Penn Virginia’s control, including those detailed in Penn Virginia’s Annual Reports on Form 10-K, Quarterly Reports on Form 10-Q and Current Reports on Form 8-K that are available on Penn Virginia’s website at www.pennvirginia.com and on the website of the Securities and Exchange Commission (the “SEC”) at www.sec.gov. All forward-looking statements are based on assumptions that Penn Virginia believes to be reasonable but that may not prove to be accurate. Any forward-looking statement speaks only as of the date on which such statement is made, and Penn Virginia undertakes no obligation to correct or update any forward-looking statement, whether as a result of new information, future events or otherwise, except as required by applicable law. Readers are cautioned not to place undue reliance on these forward-looking statements, which speak only as of the date hereof. Additional Information and Where to Find It In connection with the Transaction, Penn Virginia will file a proxy statement and other documents with the SEC. Investors and security holders are urged to carefully read the definitive proxy statement when it becomes available because it will contain important information regarding the Transaction. A definitive proxy statement will be sent to shareholders of Penn Virginia relating to the approval of, among other things, the issuance of Penn Virginia equity securities in the Transaction. This communication is not a substitute for any proxy statement or any other document which Penn Virginia may file with the SEC in connection with the proposed Transaction. INVESTORS AND SECURITY HOLDERS OF PENN VIRGINIA ARE URGED TO READ THE PROXY STATEMENT AND ANY OTHER RELEVANT DOCUMENTS THAT WILL BE FILED WITH THE SEC, AS WELL AS ANY AMENDMENTS OR SUPPLEMENTS TO THESE DOCUMENTS, CAREFULLY AND IN THEIR ENTIRETY WHEN THEY BECOME AVAILABLE BECAUSE THEY WILL CONTAIN IMPORTANT INFORMATION ABOUT THE PROPOSED TRANSACTION. Investors and security holders may obtain a free copy of the definitive proxy statement (when available) and other documents filed by Penn Virginia with the SEC at the SEC’s website, www.sec.gov. The definitive proxy statement (when available) and such other documents relating to Penn Virginia may also be obtained free-of-charge by directing a request to Penn Virginia, Attn: Clay Jeansonne, 16285 Park Ten Place, Suite 500, Houston, TX 77084, or from Penn Virginia’s website, www.pennvirginia.com. Penn Virginia and certain of its directors, executive officers and other members of management and employees may, under the rules of the SEC, be deemed to be “participants” in the solicitation of proxies in connection with the proposed Transaction. Information concerning the interests of the persons who may be “participants” in the solicitation will be set forth in the definitive proxy statement when it is filed with the SEC. Information about Penn Virginia’s executive officers and directors can be found in the above-referenced proxy statement when it becomes available and in Penn Virginia’s proxy statement relating to its 2020 Annual Meeting of Shareholders filed with the SEC on April 7, 2020 and Penn Virginia’s Current Report on Form 8-K filed with the SEC on August 21, 2020. Definitions Proved reserves are those quantities of oil and gas which, by analysis of geosciences and engineering data, can be estimated with reasonable certainty to be economically producible from a given date forward, from known reservoirs, and under existing economic conditions, operating methods and government regulation before the time at which contracts providing the right to operate expire, unless evidence indicates that renewal is reasonably certain, regardless of whether the estimate is a deterministic estimate or probabilistic estimate. Proved developed reserves are proved reserves that can be expected to be recovered: (a) through existing wells with existing equipment and operating methods or in which the cost of the required equipment is relatively minor compared with the cost of a new well; or (b) through installed extraction equipment and infrastructure operational at the time of the reserves estimate if the extraction is means not involving a well. Probable reserves are those additional reserves that are less certain to be recovered than proved reserves, but which are as likely than not to be recoverable (there should be at least a 50% probability that the quantities actually recovered will equal or exceed the proved plus probable reserve estimates). Possible reserves are those additional reserves that are less certain to be recoverable than probable reserves (there should be at least a 10% probability that the total quantities actually recovered will equal or exceed the proved plus probable plus possible reserve estimates). Estimated ultimate recovery (EUR) is the sum of reserves remaining as of a given date and cumulative production as of that date. EUR is a measure that by its nature is more speculative than estimates of reserves prepared in accordance with SEC definitions and guidelines and accordingly is less certain. Cautionary Statements The estimates and guidance presented in this presentation, including those regarding inventory of drilling locations and expected free cash flow, are based on assumptions of capital expenditure levels, prices for oil, natural gas and NGLs, current indications of supply and demand for oil, well results and operating costs. The guidance, estimates and type curves provided or used in this presentation do not constitute any form of guarantee or assurance that the matters indicated will be achieved. Statements regarding inventory are based on current information, assumptions regarding well costs, the drilling program and economics and are subject to material change. The number of locations shown as being in the Company’s current estimated inventory is not a guarantee of the number of wells that will actually be drilled and completed or the results or return that will be achieved. While we believe these estimates and the assumptions on which they are based are reasonable, they are inherently uncertain and are subject to, among other things, significant business, economic, operational and regulatory risks and uncertainties and are subject to material revision. Actual results may differ materially from estimates and guidance. Reconciliation of Non‐GAAP Financial Measures This presentation contains references to certain non‐GAAP financial measures. Reconciliations between GAAP and non‐GAAP financial measures are available in the appendix to this presentation. The non-GAAP financial measures presented may not provide information that is directly comparable to that provided by other companies, as other companies may calculate such financial results differently. The Company's non-GAAP financial measures are not measurements of financial performance under GAAP and should not be considered as alternatives to amounts presented in accordance with GAAP. The Company views these non-GAAP financial measures as supplemental and they are not intended to be a substitute for, or superior to, the information provided by GAAP financial results.
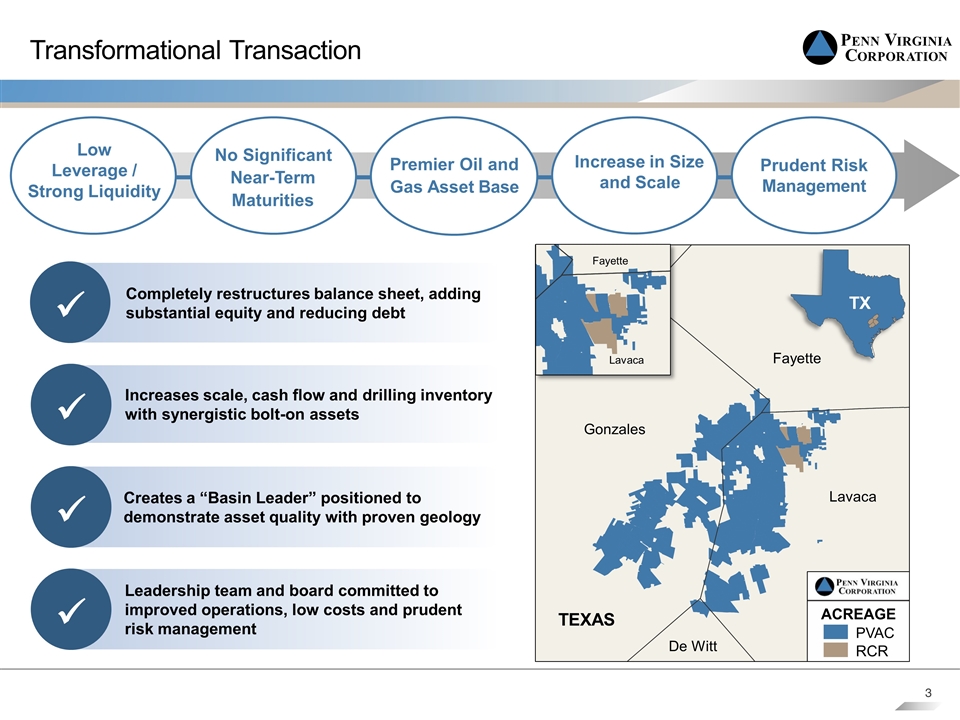
Transformational Transaction Completely restructures balance sheet, adding substantial equity and reducing debt ü Gonzales Lavaca De Witt Fayette TEXAS Lavaca Fayette TX No Significant Near-Term Maturities Increase in Size and Scale Premier Oil and Gas Asset Base Prudent Risk Management Low Leverage / Strong Liquidity Increases scale, cash flow and drilling inventory with synergistic bolt-on assets ü Creates a “Basin Leader” positioned to demonstrate asset quality with proven geology ü Leadership team and board committed to improved operations, low costs and prudent risk management ü
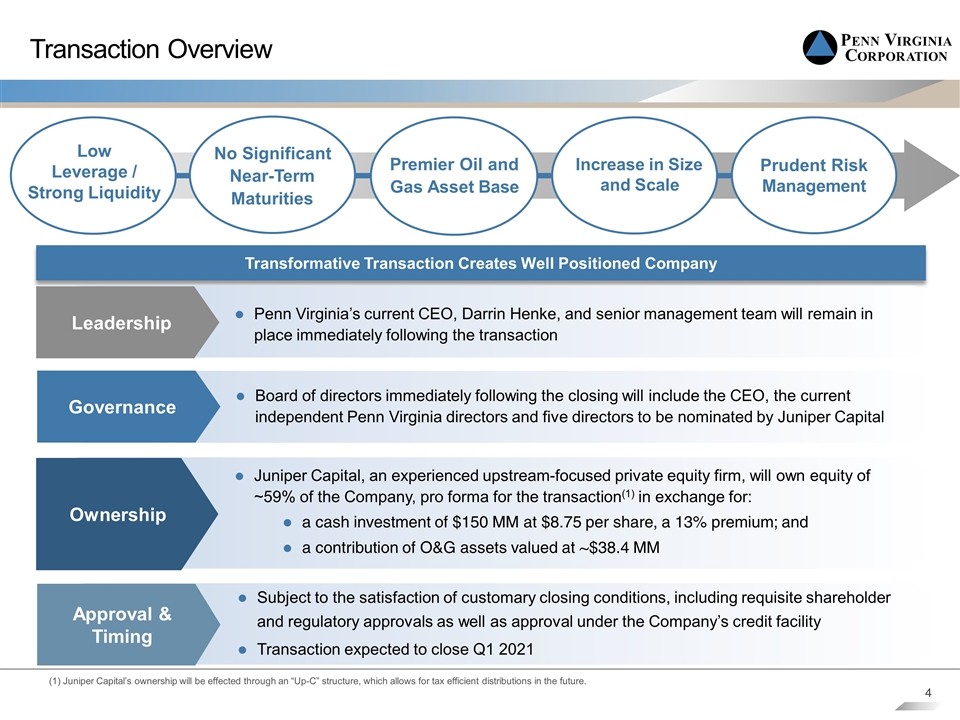
Transaction Overview Increase in Size and Scale Premier Oil and Gas Asset Base Prudent Risk Management Low Leverage / Strong Liquidity Transformative Transaction Creates Well Positioned Company (1) Juniper Capital’s ownership will be effected through an “Up-C” structure, which allows for tax efficient distributions in the future. Ownership Juniper Capital, an experienced upstream-focused private equity firm, will own equity of ~59% of the Company, pro forma for the transaction(1) in exchange for: a cash investment of $150 MM at $8.75 per share, a 13% premium; and a contribution of O&G assets valued at ~$38.4 MM Governance Board of directors immediately following the closing will include the CEO, the current independent Penn Virginia directors and five directors to be nominated by Juniper Capital Penn Virginia’s current CEO, Darrin Henke, and senior management team will remain in place immediately following the transaction Leadership Subject to the satisfaction of customary closing conditions, including requisite shareholder and regulatory approvals as well as approval under the Company’s credit facility Transaction expected to close Q1 2021 Approval & Timing No Significant Near-Term Maturities
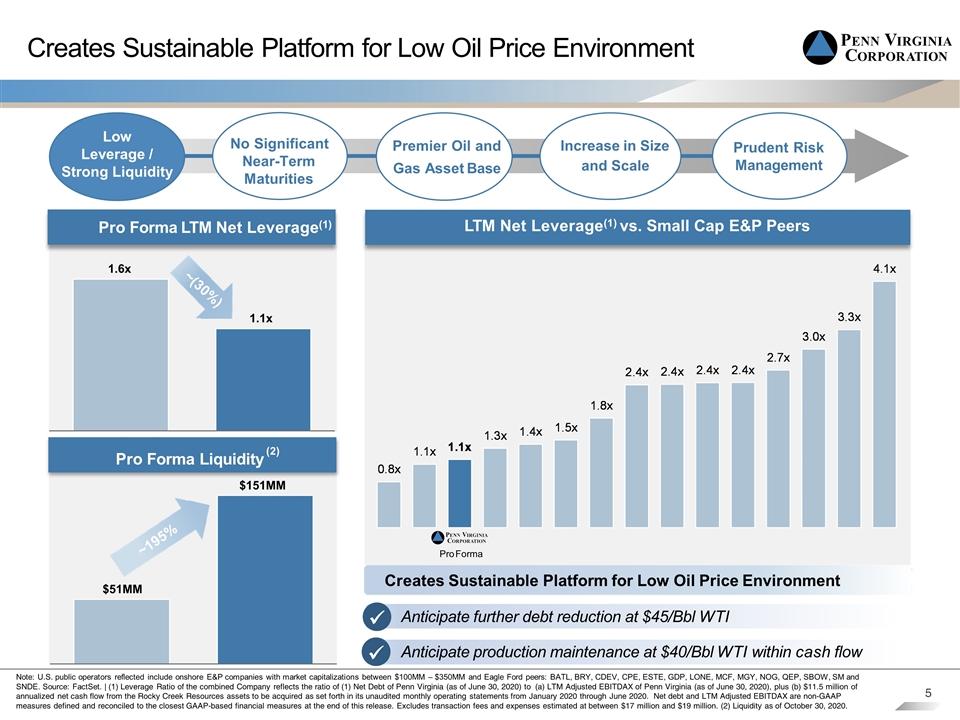
Creates Sustainable Platform for Low Oil Price Environment 65 121 171 173 194 210 174 153 128 49 91 128 191 191 191 242 242 242 Creates Sustainable Platform for Low Oil Price Environment Anticipate further debt reduction at $45/Bbl WTI Anticipate production maintenance at $40/Bbl WTI within cash flow Pro Forma LTM Net Leverage(1) 1.1x 1.6x LTM Net Leverage(1) vs. Small Cap E&P Peers Pro Forma Pro Forma Liquidity Pro Forma $51MM $151MM Premier Oil and Gas Asset Base Low Leverage / Strong Liquidity Prudent Risk Management ü ü (2) ~(30%) ~195% No Significant Near-Term Maturities Note: U.S. public operators reflected include onshore E&P companies with market capitalizations between $100MM – $350MM and Eagle Ford peers: BATL, BRY, CDEV, CPE, ESTE, GDP, LONE, MCF, MGY, NOG, QEP, SBOW, SM and SNDE. Source: FactSet. | (1) Leverage Ratio of the combined Company reflects the ratio of (1) Net Debt of Penn Virginia (as of June 30, 2020) to (a) LTM Adjusted EBITDAX of Penn Virginia (as of June 30, 2020), plus (b) $11.5 million of annualized net cash flow from the Rocky Creek Resources assets to be acquired as set forth in its unaudited monthly operating statements from January 2020 through June 2020. Net debt and LTM Adjusted EBITDAX are non-GAAP measures defined and reconciled to the closest GAAP-based financial measures at the end of this release. Excludes transaction fees and expenses estimated at between $17 million and $19 million. (2) Liquidity as of October 30, 2020. Increase in Size and Scale
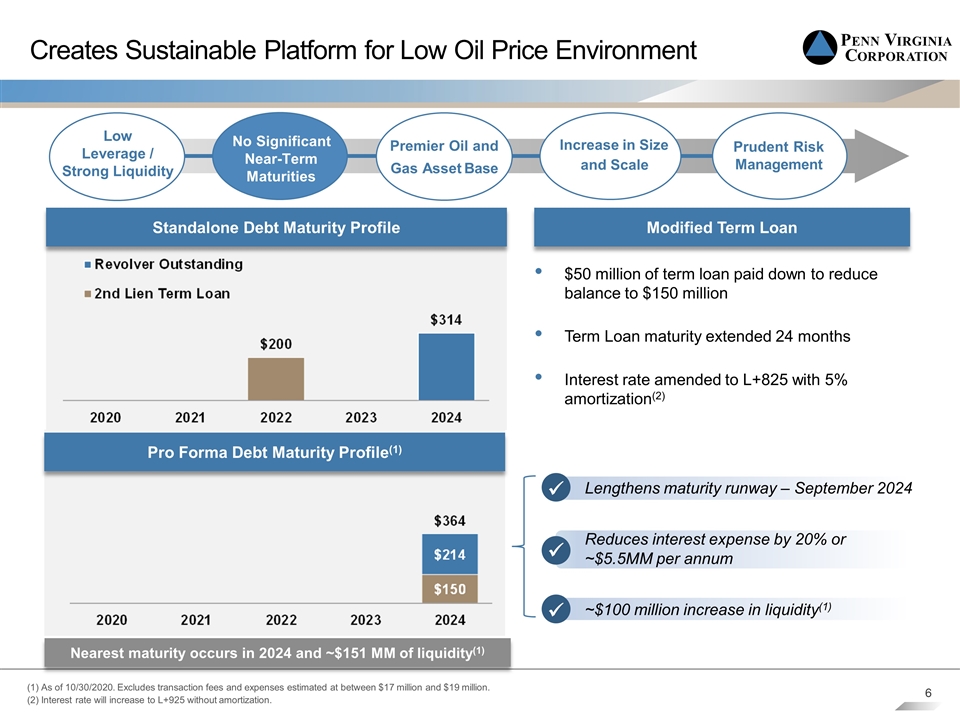
Creates Sustainable Platform for Low Oil Price Environment Standalone Debt Maturity Profile Pro Forma Debt Maturity Profile(1) $50 million of term loan paid down to reduce balance to $150 million Term Loan maturity extended 24 months Interest rate amended to L+825 with 5% amortization(2) Modified Term Loan Nearest maturity occurs in 2024 and ~$151 MM of liquidity(1) ü ü ü No Significant Near-Term Maturities Premier Oil and Gas Asset Base Low Leverage / Strong Liquidity Prudent Risk Management Lengthens maturity runway – September 2024 Reduces interest expense by 20% or ~$5.5MM per annum ~$100 million increase in liquidity(1) (1) As of 10/30/2020. Excludes transaction fees and expenses estimated at between $17 million and $19 million. (2) Interest rate will increase to L+925 without amortization. Increase in Size and Scale
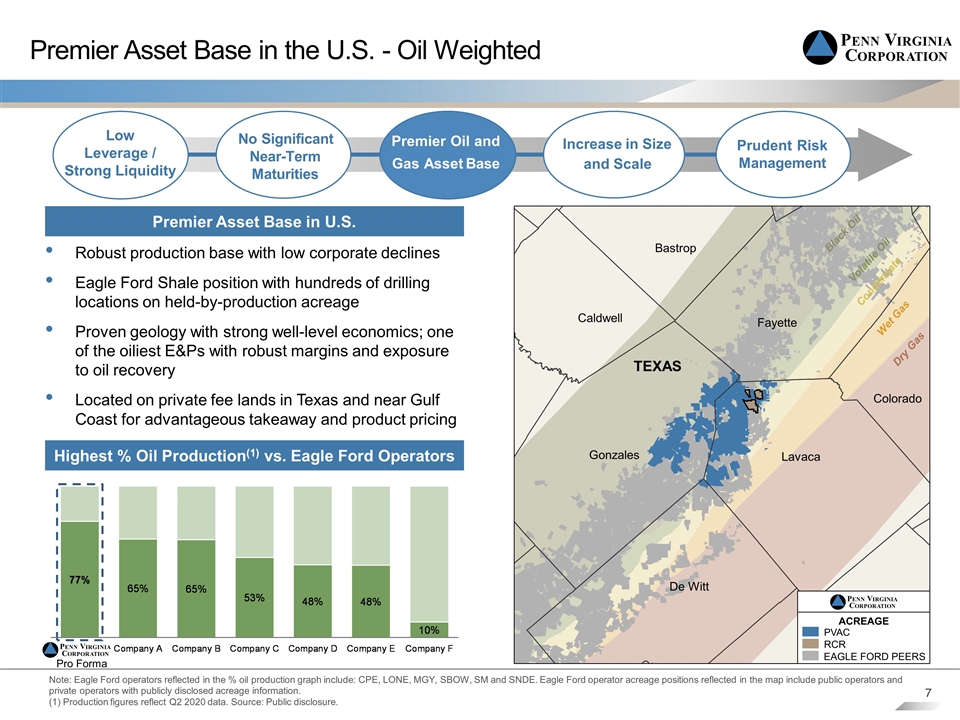
Premier Asset Base in the U.S. - Oil Weighted Note: Eagle Ford operators reflected in the % oil production graph include: CPE, LONE, MGY, SBOW, SM and SNDE. Eagle Ford operator acreage positions reflected in the map include public operators and private operators with publicly disclosed acreage information. (1) Production figures reflect Q2 2020 data. Source: Public disclosure. Premier Asset Base in U.S. Highest % Oil Production(1) vs. Eagle Ford Operators Robust production base with low corporate declines Eagle Ford Shale position with hundreds of drilling locations on held-by-production acreage Proven geology with strong well-level economics; one of the oiliest E&Ps with robust margins and exposure to oil recovery Located on private fee lands in Texas and near Gulf Coast for advantageous takeaway and product pricing Gonzales Lavaca Fayette De Witt Colorado TEXAS Bastrop Caldwell Black Oil Volatile Oil Condensate Wet Gas Dry Gas Premier Oil and Gas Asset Base Low Leverage / Strong Liquidity Prudent Risk Management Pro Forma No Significant Near-Term Maturities Increase in Size and Scale
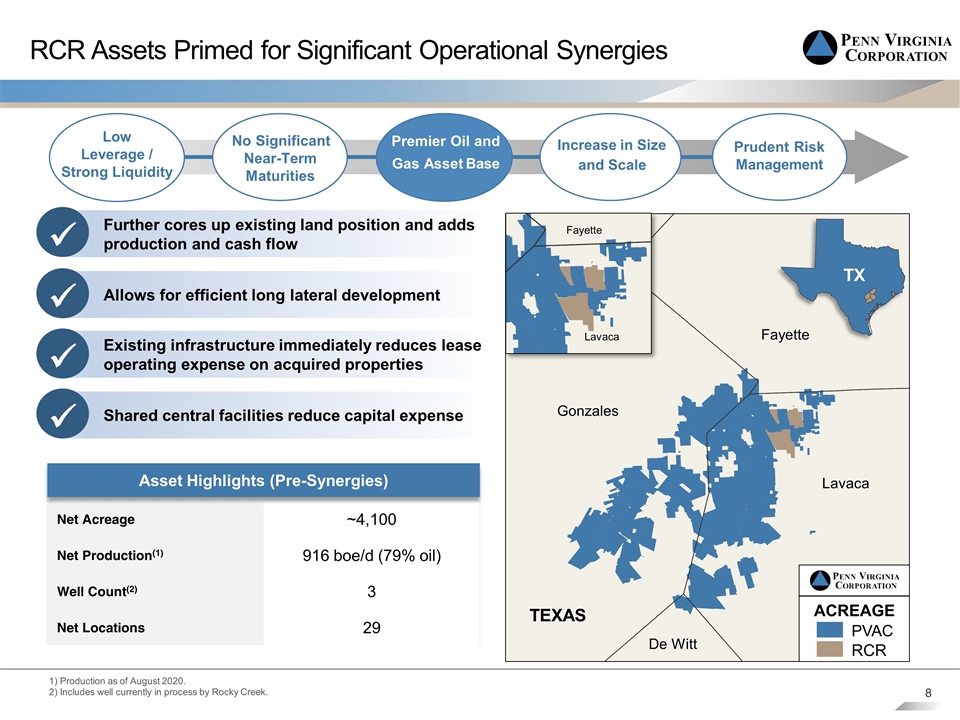
RCR Assets Primed for Significant Operational Synergies Further cores up existing land position and adds production and cash flow ü Allows for efficient long lateral development ü Existing infrastructure immediately reduces lease operating expense on acquired properties ü 1) Production as of August 2020. 2) Includes well currently in process by Rocky Creek. Shared central facilities reduce capital expense ü Net Acreage ~4,100 Net Production(1) 916 boe/d (79% oil) Well Count(2) 3 Net Locations 29 Asset Highlights (Pre-Synergies) Gonzales Lavaca De Witt Fayette TEXAS Lavaca Fayette TX Low Leverage / Strong Liquidity Prudent Risk Management No Significant Near-Term Maturities Premier Oil and Gas Asset Base Increase in Size and Scale
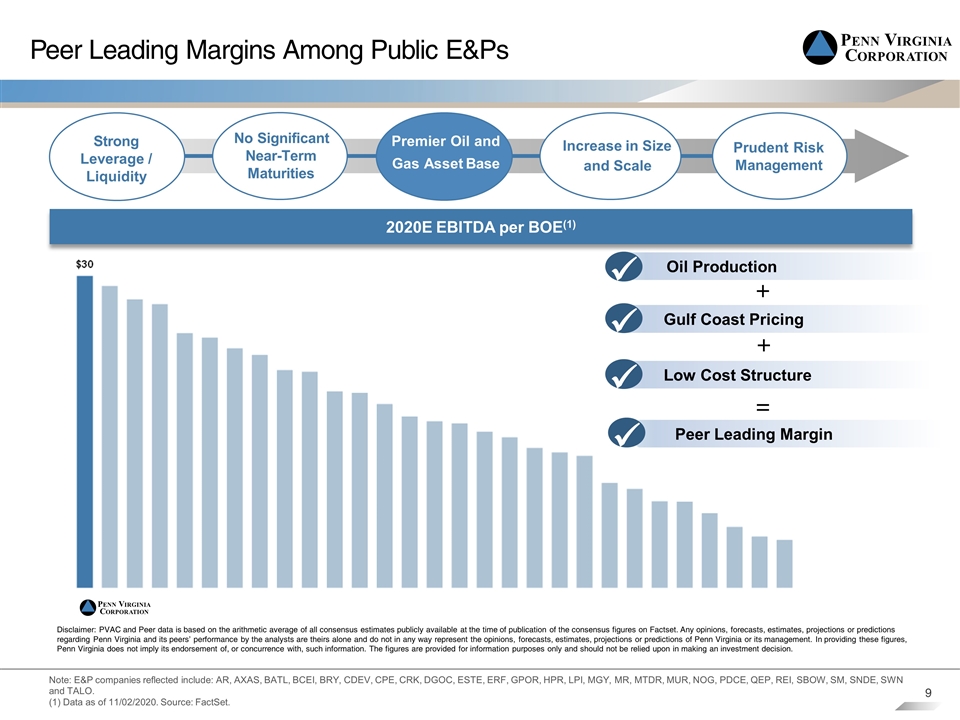
Peer Leading Margins Among Public E&Ps Note: E&P companies reflected include: AR, AXAS, BATL, BCEI, BRY, CDEV, CPE, CRK, DGOC, ESTE, ERF, GPOR, HPR, LPI, MGY, MR, MTDR, MUR, NOG, PDCE, QEP, REI, SBOW, SM, SNDE, SWN and TALO. (1) Data as of 11/02/2020. Source: FactSet. 2020E EBITDA per BOE(1) Strong Leverage / Liquidity Prudent Risk Management Disclaimer: PVAC and Peer data is based on the arithmetic average of all consensus estimates publicly available at the time of publication of the consensus figures on Factset. Any opinions, forecasts, estimates, projections or predictions regarding Penn Virginia and its peers’ performance by the analysts are theirs alone and do not in any way represent the opinions, forecasts, estimates, projections or predictions of Penn Virginia or its management. In providing these figures, Penn Virginia does not imply its endorsement of, or concurrence with, such information. The figures are provided for information purposes only and should not be relied upon in making an investment decision. No Significant Near-Term Maturities Premier Oil and Gas Asset Base Increase in Size and Scale + + = Oil Production ü Gulf Coast Pricing ü Low Cost Structure ü Peer Leading Margin ü
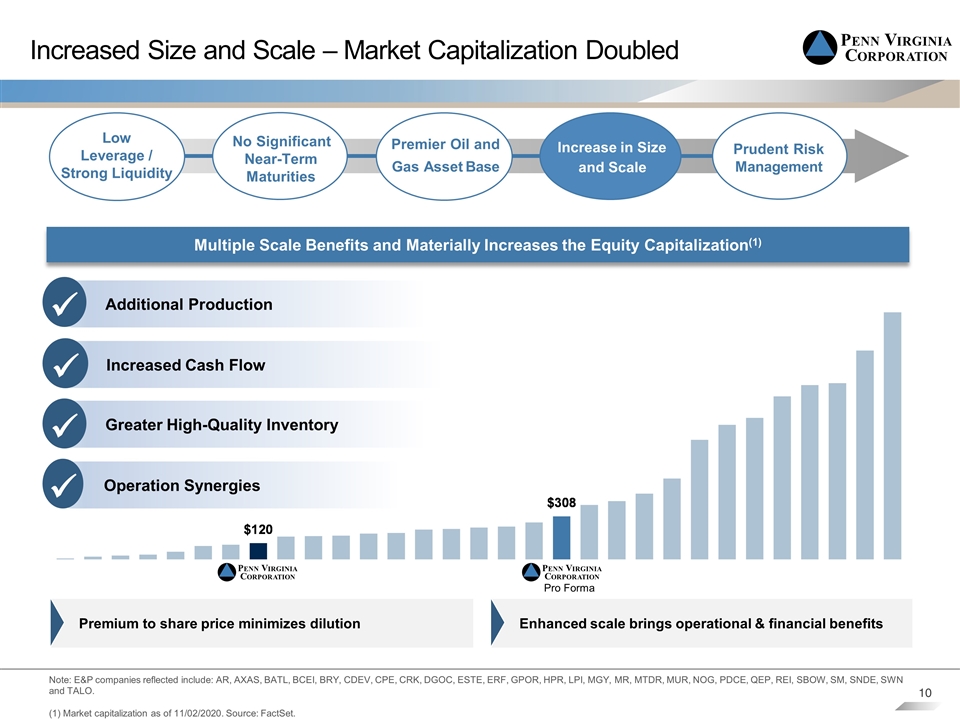
Increased Size and Scale – Market Capitalization Doubled Enhanced scale brings operational & financial benefits Pro Forma Premium to share price minimizes dilution Note: E&P companies reflected include: AR, AXAS, BATL, BCEI, BRY, CDEV, CPE, CRK, DGOC, ESTE, ERF, GPOR, HPR, LPI, MGY, MR, MTDR, MUR, NOG, PDCE, QEP, REI, SBOW, SM, SNDE, SWN and TALO. (1) Market capitalization as of 11/02/2020. Source: FactSet. Multiple Scale Benefits and Materially Increases the Equity Capitalization(1) Low Leverage / Strong Liquidity Prudent Risk Management No Significant Near-Term Maturities Increase in Size and Scale Premier Oil and Gas Asset Base Additional Production ü Increased Cash Flow ü Greater High-Quality Inventory ü Operation Synergies ü
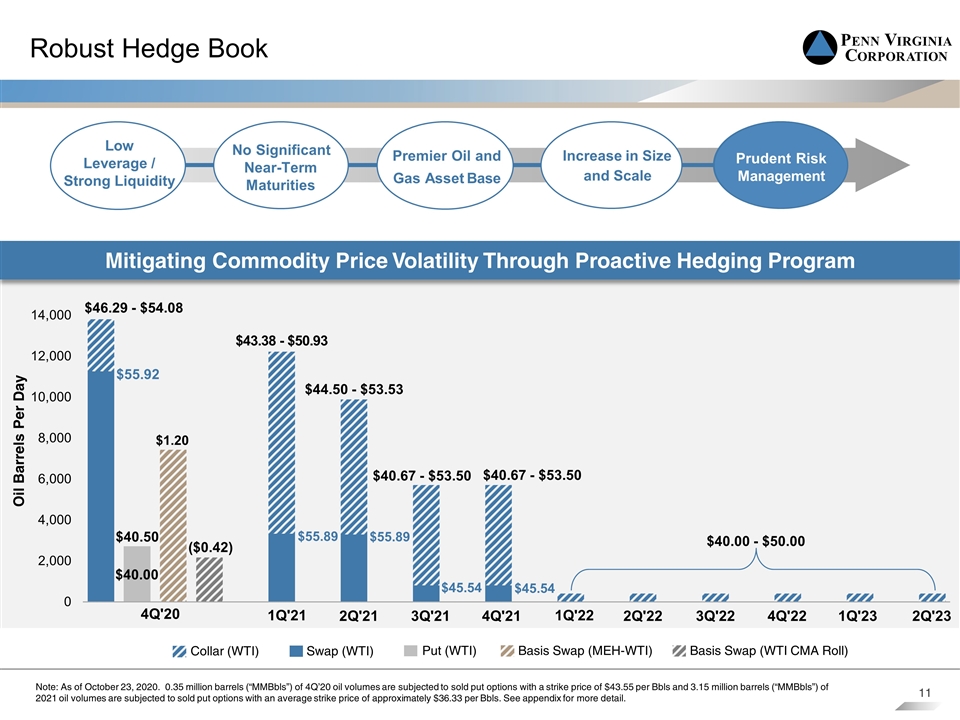
Robust Hedge Book Oil Barrels Per Day Mitigating Commodity Price Volatility Through Proactive Hedging Program Note: As of October 23, 2020. 0.35 million barrels (“MMBbls”) of 4Q’20 oil volumes are subjected to sold put options with a strike price of $43.55 per Bbls and 3.15 million barrels (“MMBbls”) of 2021 oil volumes are subjected to sold put options with an average strike price of approximately $36.33 per Bbls. See appendix for more detail. $46.29 - $54.08 $44.50 - $53.53 $55.92 $55.89 $45.54 $40.67 - $53.50 $40.67 - $53.50 $55.89 Collar (WTI) Swap (WTI) Basis Swap (MEH-WTI) Put (WTI) Basis Swap (WTI CMA Roll) $45.54 4Q'21 3Q'21 1Q'21 2Q'21 4Q'20 1Q'22 1Q'23 $40.00 - $50.00 2Q'22 3Q'22 4Q'22 2Q'23 Significant Increase in Size & Scale Low Leverage / Strong Liquidity No Significant Near-Term Maturities Prudent Risk Management Increase in Size and Scale Premier Oil and Gas Asset Base
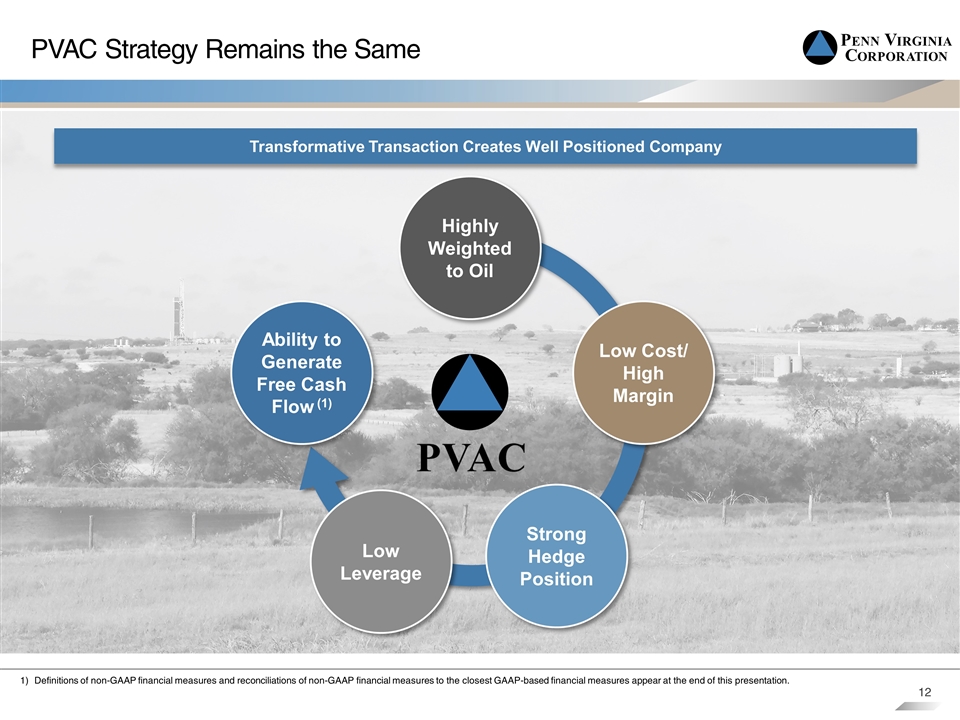
PVAC Strategy Remains the Same Highly Weighted to Oil Low Cost/ High Margin Strong Hedge Position Low Leverage Ability to Generate Free Cash Flow(1) Definitions of non-GAAP financial measures and reconciliations of non-GAAP financial measures to the closest GAAP-based financial measures appear at the end of this presentation. Transformative Transaction Creates Well Positioned Company
Appendix
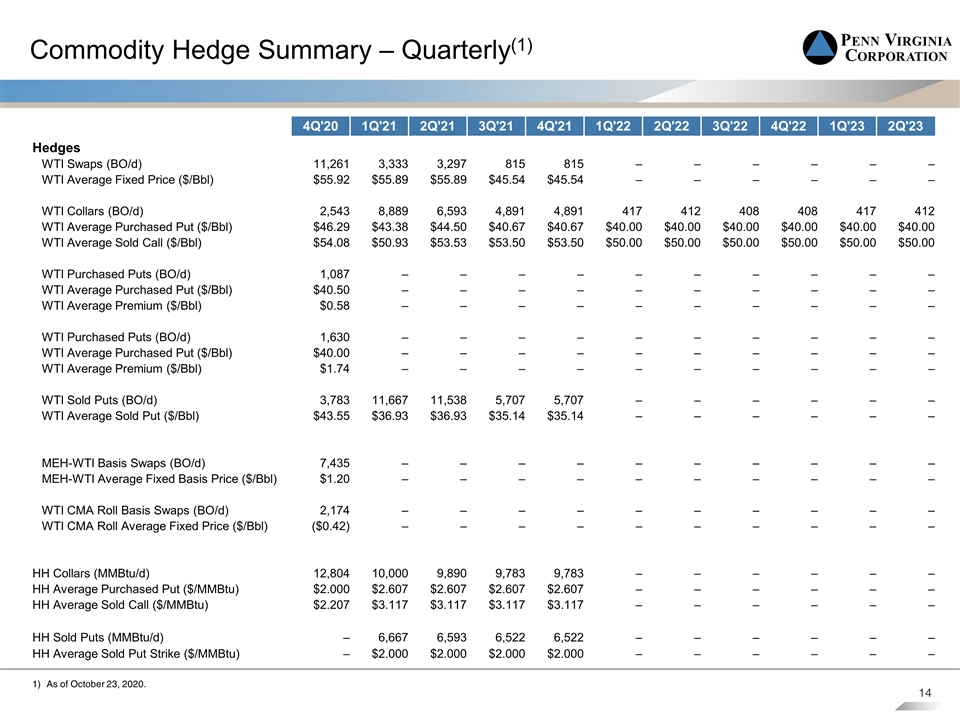
Commodity Hedge Summary – Quarterly(1) As of October 23, 2020. 4Q'20 1Q'21 2Q'21 3Q'21 4Q'21 1Q'22 2Q'22 3Q'22 4Q'22 1Q'23 2Q'23 Hedges WTI Swaps (BO/d) 11,261 3,333 3,297 815 815 – – – – – – WTI Average Fixed Price ($/Bbl) $55.92 $55.89 $55.89 $45.54 $45.54 – – – – – – WTI Collars (BO/d) 2,543 8,889 6,593 4,891 4,891 417 412 408 408 417 412 WTI Average Purchased Put ($/Bbl) $46.29 $43.38 $44.50 $40.67 $40.67 $40.00 $40.00 $40.00 $40.00 $40.00 $40.00 WTI Average Sold Call ($/Bbl) $54.08 $50.93 $53.53 $53.50 $53.50 $50.00 $50.00 $50.00 $50.00 $50.00 $50.00 WTI Purchased Puts (BO/d) 1,087 – – – – – – – – – – WTI Average Purchased Put ($/Bbl) $40.50 – – – – – – – – – – WTI Average Premium ($/Bbl) $0.58 – – – – – – – – – – WTI Purchased Puts (BO/d) 1,630 – – – – – – – – – – WTI Average Purchased Put ($/Bbl) $40.00 – – – – – – – – – – WTI Average Premium ($/Bbl) $1.74 – – – – – – – – – – WTI Sold Puts (BO/d) 3,783 11,667 11,538 5,707 5,707 – – – – – – WTI Average Sold Put ($/Bbl) $43.55 $36.93 $36.93 $35.14 $35.14 – – – – – – MEH-WTI Basis Swaps (BO/d) 7,435 – – – – – – – – – – MEH-WTI Average Fixed Basis Price ($/Bbl) $1.20 – – – – – – – – – – WTI CMA Roll Basis Swaps (BO/d) 2,174 – – – – – – – – – – WTI CMA Roll Average Fixed Price ($/Bbl) ($0.42) – – – – – – – – – – HH Collars (MMBtu/d) 12,804 10,000 9,890 9,783 9,783 – – – – – – HH Average Purchased Put ($/MMBtu) $2.000 $2.607 $2.607 $2.607 $2.607 – – – – – – HH Average Sold Call ($/MMBtu) $2.207 $3.117 $3.117 $3.117 $3.117 – – – – – – HH Sold Puts (MMBtu/d) – 6,667 6,593 6,522 6,522 – – – – – – HH Average Sold Put Strike ($/MMBtu) – $2.000 $2.000 $2.000 $2.000 – – – – – –
Definition and Explanation of Free Cash Flow Free Cash Flow is a non-GAAP financial measure that management believes illustrates our ability to generate cash flows from our business that are available to be returned to our providers of financing capital represented primarily by our debt holders as we do not currently have a dividend or share repurchase program. We present Free Cash Flow as the excess (deficiency) of Discretionary cash flow over Capital additions, net. Discretionary cash flow is defined as Adjusted EBITDAX (as defined and reconciled above) less interest expense and debt issue costs and adjustments for income taxes (paid) refunded and changes for working capital. Capital additions represent our committed capital expenditure and acquisition transactions, net of any proceeds from the sales or disposition of assets. Free Cash Flow is also defined as net cash provided by operating activities less net cash used in investing activities and debt issuance costs paid plus other, net cash. We believe Free Cash Flow is commonly used by investors and professional research analysts for the valuation, comparison, rating, investment recommendations of companies in many industries. Free Cash Flow should be considered as a supplement to net income (loss) as a measure of performance and net cash provided by operating activities as a measure of our liquidity. Definition and Explanation of Free Cash Flow
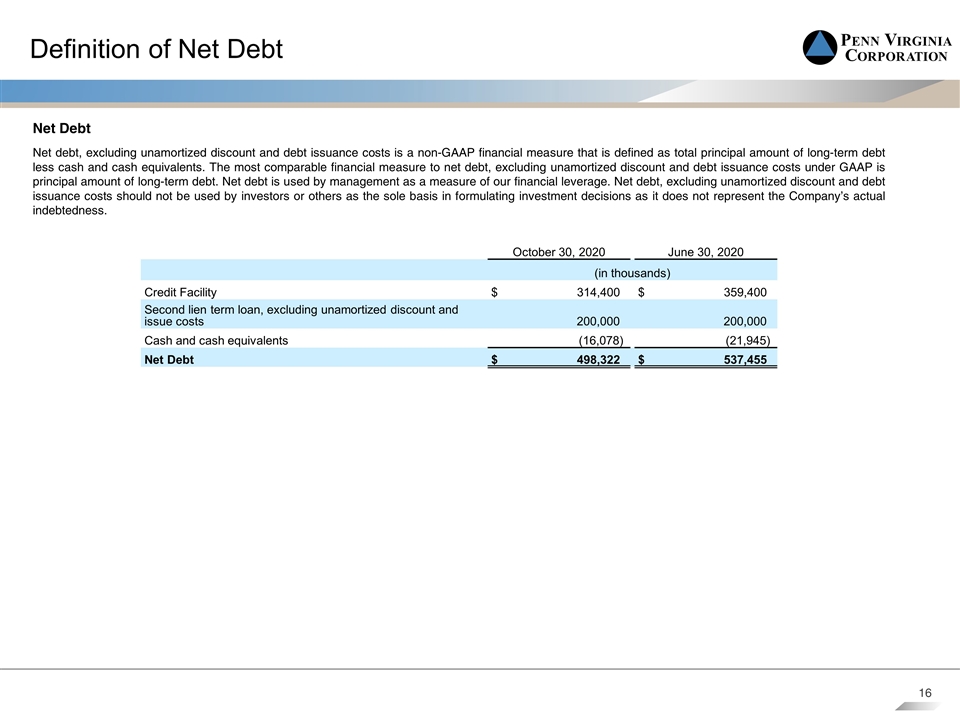
Definition of Net Debt Net Debt Net debt, excluding unamortized discount and debt issuance costs is a non-GAAP financial measure that is defined as total principal amount of long-term debt less cash and cash equivalents. The most comparable financial measure to net debt, excluding unamortized discount and debt issuance costs under GAAP is principal amount of long-term debt. Net debt is used by management as a measure of our financial leverage. Net debt, excluding unamortized discount and debt issuance costs should not be used by investors or others as the sole basis in formulating investment decisions as it does not represent the Company’s actual indebtedness. October 30, 2020 June 30, 2020 (in thousands) Credit Facility $ 314,400 $ 359,400 Second lien term loan, excluding unamortized discount and issue costs 200,000 200,000 Cash and cash equivalents (16,078) (21,945) Net Debt $ 498,322 $ 537,455
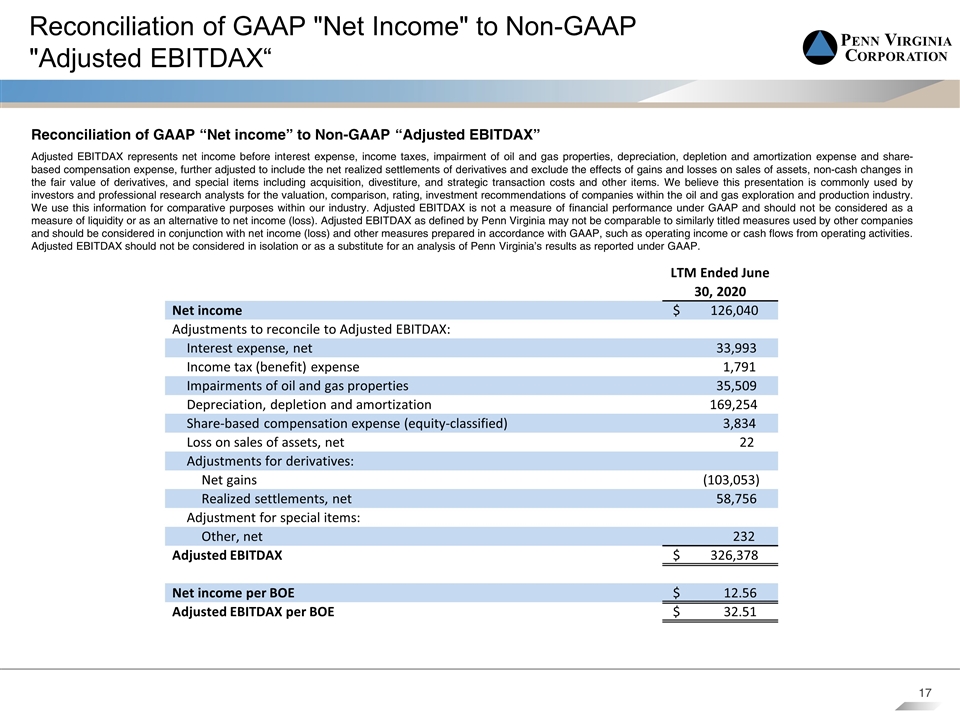
Reconciliation of GAAP "Net Income" to Non-GAAP "Adjusted EBITDAX“ Reconciliation of GAAP “Net income” to Non-GAAP “Adjusted EBITDAX” Adjusted EBITDAX represents net income before interest expense, income taxes, impairment of oil and gas properties, depreciation, depletion and amortization expense and share-based compensation expense, further adjusted to include the net realized settlements of derivatives and exclude the effects of gains and losses on sales of assets, non-cash changes in the fair value of derivatives, and special items including acquisition, divestiture, and strategic transaction costs and other items. We believe this presentation is commonly used by investors and professional research analysts for the valuation, comparison, rating, investment recommendations of companies within the oil and gas exploration and production industry. We use this information for comparative purposes within our industry. Adjusted EBITDAX is not a measure of financial performance under GAAP and should not be considered as a measure of liquidity or as an alternative to net income (loss). Adjusted EBITDAX as defined by Penn Virginia may not be comparable to similarly titled measures used by other companies and should be considered in conjunction with net income (loss) and other measures prepared in accordance with GAAP, such as operating income or cash flows from operating activities. Adjusted EBITDAX should not be considered in isolation or as a substitute for an analysis of Penn Virginia’s results as reported under GAAP. LTM Ended June 30, 2020 Net income $ 126,040 Adjustments to reconcile to Adjusted EBITDAX: Interest expense, net 33,993 Income tax (benefit) expense 1,791 Impairments of oil and gas properties 35,509 Depreciation, depletion and amortization 169,254 Share-based compensation expense (equity-classified) 3,834 Loss on sales of assets, net 22 Adjustments for derivatives: Net gains (103,053) Realized settlements, net 58,756 Adjustment for special items: Other, net 232 Adjusted EBITDAX $ 326,378 Net income per BOE $ 12.56 Adjusted EBITDAX per BOE $ 32.51
