Attached files
| file | filename |
|---|---|
| EX-99.1 - EXHIBIT 99.1 - NABORS INDUSTRIES LTD | tm2034373d1_ex99-1.htm |
| 8-K - FORM 8-K - NABORS INDUSTRIES LTD | tm2034373d1_8k.htm |
Exhibit 99.2

1 11/3/2020 NABORS INDUSTRIES LTD. 3Q Earnings Presentation

2 Forward Looking Statements We often discuss expectations regarding our future markets, demand for our products and services, and our performance in our annual, quarterly, and current reports, press releases, and other written and oral statements . Such statements, including statements in this document that relate to matters that are not historical facts, are “forward - looking statements” within the meaning of the safe harbor provisions of Section 27 A of the U . S . Securities Act of 1933 and Section 21 E of the U . S . Securities Exchange Act of 1934 . These “forward - looking statements” are based on our analysis of currently available competitive, financial and economic data and our operating plans . They are inherently uncertain, and investors should recognize that events and actual results could turn out to be significantly different from our expectations . Factors to consider when evaluating these forward - looking statements include, but are not limited to: • The Covid - 19 pandemic and its impact on oil and gas markets and prices; • fluctuations and volatility in worldwide prices of and demand for oil and natural gas; • fluctuations in levels of oil and natural gas exploration and development activities; • fluctuations in the demand for our services; • competitive and technological changes and other developments in the oil and gas and oilfield services industries; • our ability to renew customer contracts in order to maintain competitiveness; • the existence of operating risks inherent in the oil and gas and oilfield services industries; • the possibility of the loss of one or a number of our large customers; • the impact of long - term indebtedness and other financial commitments on our financial and operating flexibility; • our access to and the cost of capital, including the impact of a further downgrade in our credit rating, covenant restriction s, availability under our unsecured revolving credit facility, and future issuances of debt or equity securities; • our dependence on our operating subsidiaries and investments to meet our financial obligations; • our ability to retain skilled employees; • our ability to complete, and realize the expected benefits, of strategic transactions; • changes in tax laws and the possibility of changes in other laws and regulation; • the possibility of political or economic instability, civil disturbance, war or acts of terrorism in any of the countries in whi ch we do business; • the possibility of changes to U.S. trade policies and regulations including the imposition of trade embargoes or sanctions; a nd • general economic conditions, including the capital and credit markets. Our businesses depend, to a large degree, on the level of spending by oil and gas companies for exploration, development and production activities . Therefore, sustained lower oil or natural gas prices that have a material impact on exploration, development or production activities could also materially affect our financial position, results of operations and cash flows . The outbreak of the novel coronavirus (“COVID - 19 ”), together with actions by large oil and natural gas producing countries, has led to decreases in commodity prices, specifically oil and natural gas prices, resulting from oversupply and demand weakness . These price decreases caused significant disruptions and volatility in the global marketplace during 2020 . Lower prices and the resulting weakness in demand for our services, which have negatively affected our results of operations and cash flows, have persisted into the fourth quarter, and uncertainty remains regarding the length and impact of COVID - 19 on the energy industry and the outlook for our business . The above description of risks and uncertainties is by no means all - inclusive, but is designed to highlight what we believe are important factors to consider . For a discussion of these factors and other risks and uncertainties, please refer to our filings with the Securities and Exchange Commission ("SEC"), including those contained in our Annual Reports on Form 10 - K and Quarterly Reports on Form 10 - Q, which are available at the SEC's website at www . sec . gov .

Recent Company Highlights Generated Free Cash Flow in 3Q after funding semiannual interest payments on notes maintained capacity and interest rate eliminated leverage covenant including RigCloud ® , SmartNAV ™, SmartSLIDE ™ in 3Q20 resulting in a 23% sequential increase in revenue Amended Revolving Credit Facility in the open market in 3Q20, at a discount Repurchased ~$47 Million of Debt resulting in estimated cumulative savings of ~$260 million in 2Q - 4Q 2020 Cost Reductions and Capital Discipline Increased Installations of Digital Services on Nabors Lower 48 Rigs ESG Improved ISS Social Score by 3 points in 3Q20 reflecting heightened focus on ESG
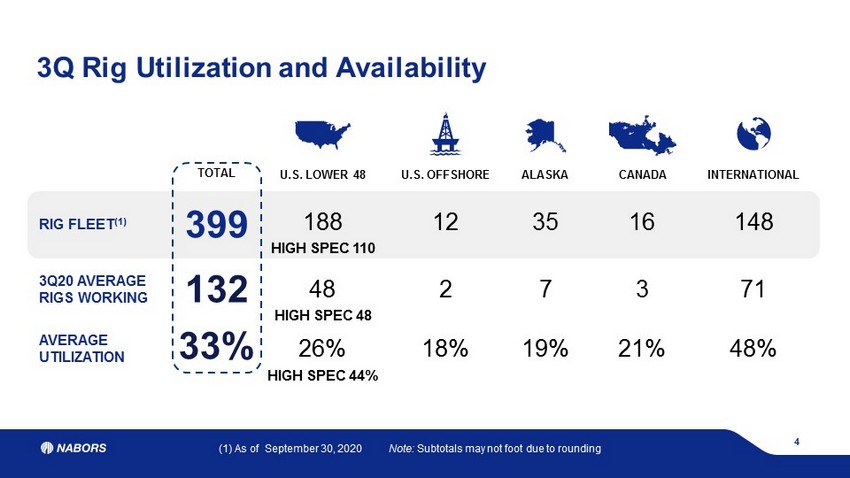
4 3Q Rig Utilization and Availability RIG FLEET (1) 399 3Q20 AVERAGE RIGS WORKING 132 AVERAGE UTILIZATION 33% (1) As of September 30, 2020 Note: Subtotals may not foot due to rounding TOTAL U.S. OFFSHORE 12 2 18% CANADA 16 3 21% ALASKA 35 7 19% INTERNATIONAL 148 71 48% 188 48 26% U.S. LOWER 48 HIGH SPEC 110 HIGH SPEC 48 HIGH SPEC 44%

5 Growing position with the top customers in the Lower 48 % OF LOWER 48 DRILLING REVENUE 63% 14% 23% 3Q 2020 48% 11% 41% Market Peak 2014 TIER 1 TIER 2 TIER 3 Successfully Improving Customer Mix

48% 26% 7% 3% 7% 10% 3Q 2020 NBR HP PTEN ESI PDS Other 22% 39% 22% 7% 0% 9% 2014 6 Building L48 Market Share with the Supermajors The leader in the supermajors market segment, Nabors more than doubled market share compared to the peak in 2014. “Nabors has invested heavily in their fleet and support services. They’ve also made tough decisions to ensure the right talent is in their front - line leadership positions.” “ Best in - basin rig performance. Attentive corporate and field personnel.” “New technology, consistently evolving. Quality performance and excellent service.” Major Independent Major Independent Supermajor “I gave Nabors a 9 for their quality, forward - thinking mentality, low NPT and performance - minded personnel.” Supermajor

7 Powering Rigs with Alternative Power Sources & Dual Fuel 40 dual - fuel - capable rigs in Lower 48 Deployed first unit in 1985 on the North Slope of Alaska • Highline - capable • Gas - capable with turbine Rig27E in Deadhorse Alaska

8 Smart Technology Portfolio Former Names Current Names Product Description Rigtelligent ® , Rigtelligence ™ Smart ROS ™ Rig operating system for machine and process automation apps WellProg ™ Smart PLAN ™ Interactive rig activity planning, scheduling and coordination system ROCKit ® Pilot Smart SLIDE ™ Automated directional steering control system Navigator™ Smart NAV ™ Directional guidance platform; generates automated steering instructions DrillSmart ® , ROP Cruise Control™ Smart CRUISE ™ Adaptive autodriller with set - point optimization Smart Family Expansion Smart FILL ™ Tubular fill - up while running casing Smart DECODE ™ Integrated downlinking to downhole tools Smart DOC ™ Digital Operations Center Smart TRIP ™ Automated tripping Smart CONNECT ™ Drilling and casing connection automation Smart DRILL ™ Process Automation
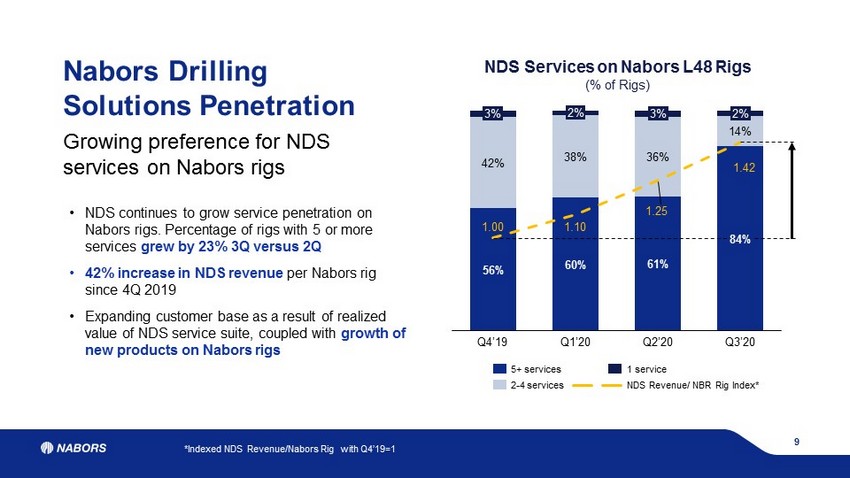
9 Nabors Drilling Solutions Penetration Growing preference for NDS services on Nabors rigs • NDS continues to grow service penetration on Nabors rigs. Percentage of rigs with 5 or more services grew by 23% 3Q versus 2Q • 42% increase in NDS revenue per Nabors rig since 4Q 2019 • Expanding customer base as a result of realized value of NDS service suite, coupled with growth of new products on Nabors rigs 1.00 1.10 1.25 1.42 3% 56% 3% Q1’20 42% Q4’19 60% 2% 38% 61% 36% Q2’20 84% 14% 2% Q3’20 5+ services NDS Revenue/ NBR Rig Index * 2 - 4 services 1 service NDS S ervices on Nabors L48 R igs (% of Rigs) *Indexed NDS Revenue/Nabors Rig with Q4’19=1

20% 29% 44% 6% 19% 1Q20 2Q20 3Q20 SmartNAV TM / SmartSLIDE TM SmartDRILL TM Smart Apps Penetration (% of Nabors rigs) 3.3 1.8 1.6 1.7 Jun 20 Sep 20 Jul 20 Aug 20 L48 Directional Drilling Personnel Per Rig: On Location & Remote Ops - 50% NDS Smart Apps Update Smart apps Life To Date 3Q20 Wells SmartNAV ™ 1,231 66 SmartSLIDE ™ 581 66 SmartDRILL ™ 86 35 Footage (ft. i n millions) SmartNAV ™ 22.0 1.1 SmartSLIDE ™ 10.9 1.2 SmartDRILL ™ 1.6 0.6 Increasing automation driving performance and de - manning Added emphasis on remote operations and cross functional staff Increased Smart applications penetration on Nabors rigs YTD 2020 despite contracting market conditions Align with customer focus to de - man and automate wellsite operations 50% decrease in personnel per job for NDS Directional Drilling operations 2Q - 3Q ( SmartSLIDE ™ / SmartNAV ™ and Wellbore Placement)
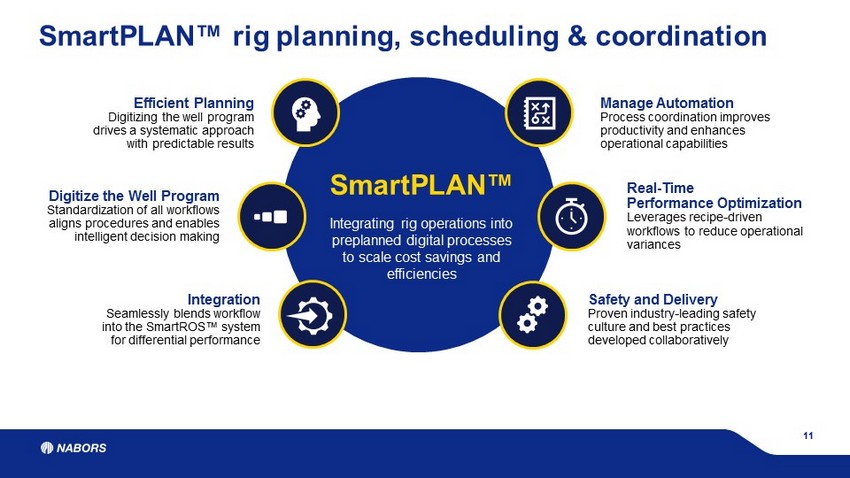
11 SmartPLAN ™ Integrating rig operations into preplanned digital processes to scale cost savings and efficiencies Efficient Planning Digitizing the well program drives a systematic approach with predictable results Integration Seamlessly blends workflow into the SmartROS ™ system for differential performance Manage Automation Process coordination improves productivity and enhances operational capabilities Safety and Delivery Proven industry - leading safety culture and best practices developed collaboratively Digitize the Well Program Standardization of all workflows aligns procedures and enables intelligent decision making Real - Time Performance Optimization Leverages recipe - driven workflows to reduce operational variances SmartPLAN ™ rig planning, scheduling & coordination

12 Platform 2 Data is delivered from Edge devices to the cloud Field crew executes drilling plan using RigCLOUD ® applications 1 3 Real - time visibility and analytics drive performance 4 Remote team in Digital Operations Center manages instructions MWD Suite SmartNAV ™ RigCLOUD ® LiveOps RigCLOUD ® Metrics SmartPLAN ™ RigCLOUD ® Edge Partner Apps Cybersecurity Remote Visualization Digital Operations Center RigCLOUD ® Apps Go beyond remote monitoring and collaborate with your team at the rig site.

129 173 575 775 600 400 752 $0 $500 $1,000 $1,500 $2,000 2020 2021 2022 2023 2024 2025 2026 2027 2028 Bonds, Notes & Other Revolving Credit Facility (1) (2) 13 (1) Annual figures shown in millions at maturity value (2) Debt balances reflect carrying values as of September 30, 2020 As of September 30, 2020 outstanding balance maturing in 2021 is $129 million Debt at 9/30/2020 Total Debt: $3.29Bn (2) Cash, Cash Equivalents & STI $0.51Bn Total Debt Less Cash, Cash Equiv. & STI $2.78Bn (2) (1) Debt Maturity Profile as of September 30, 2020

nabors.com Contact Us: William C. Conroy VP - Corporate Development and Investor Relations William.Conroy@nabors.com Kara K. Peak Director - Corporate Development and Investor Relations Kara.Peak@nabors.com NABORS CORPORATE SERVICES 515 W. Greens Road Suite 1200 Houston, TX 77067 - 4525