Attached files
| file | filename |
|---|---|
| EX-99.1 - EX-99.1 - INSIGHT ENTERPRISES INC | nsit-ex991_7.htm |
| 8-K - 8-K - INSIGHT ENTERPRISES INC | nsit-8k_20201103.htm |

Insight Enterprises, Inc. Third Quarter 2020 Earnings Conference Call and Webcast Exhibit 99.2
Agenda Disclosures CEO Commentary Financial Highlights and Results Operating Highlights Current Environment CFO Commentary Year to Date Highlights Cashflow and Debt Covenants Financial Results by Region Taxes and Cash Flow Closing Comments
Disclosures Safe harbor statement This presentation includes “forward-looking statements” within the meaning of the Private Securities Litigation Reform Act of 1995 related to Insight’s plans and expectations. Statements that are not historical facts, including those related to Coronavirus strain (“COVID-19”), our future responses to and the impact of COVID-19 on our Company, our expectations about future benefits relating to the PCM integration, future expected trends in the IT market and our opportunities for growth, are forward-looking statements. These forward-looking statements are subject to assumptions, risks and uncertainties which could cause actual results or future events to differ materially from such statements. The Company undertakes no obligation to update publicly or revise any of the forward-looking statements, except as otherwise required by law. More detailed information about risk factors is included in today’s press release and discussed in the Company’s most recently filed periodic reports and subsequent filings with the Securities and Exchange Commission. Non-GAAP measures This presentation will reference certain non-GAAP financial information as ‘Adjusted’. A reconciliation of non-GAAP financial measures presented in this document to our actual GAAP results is attached to the back of this presentation and included in the press release issued today, which you may find on the Investor Relations section of our website at investor.insight.com. Constant currency In some instances the Company refers to changes in net sales, gross profit and earnings from operations on a consolidated basis and in North America, EMEA and APAC excluding the effects of fluctuating foreign currency exchange rates. In computing these changes and percentages, the Company compares the current year amount as translated into U.S. dollars under the applicable accounting standards to the prior year amount in local currency translated into U.S. dollars utilizing the weighted average translation rate for the current period.
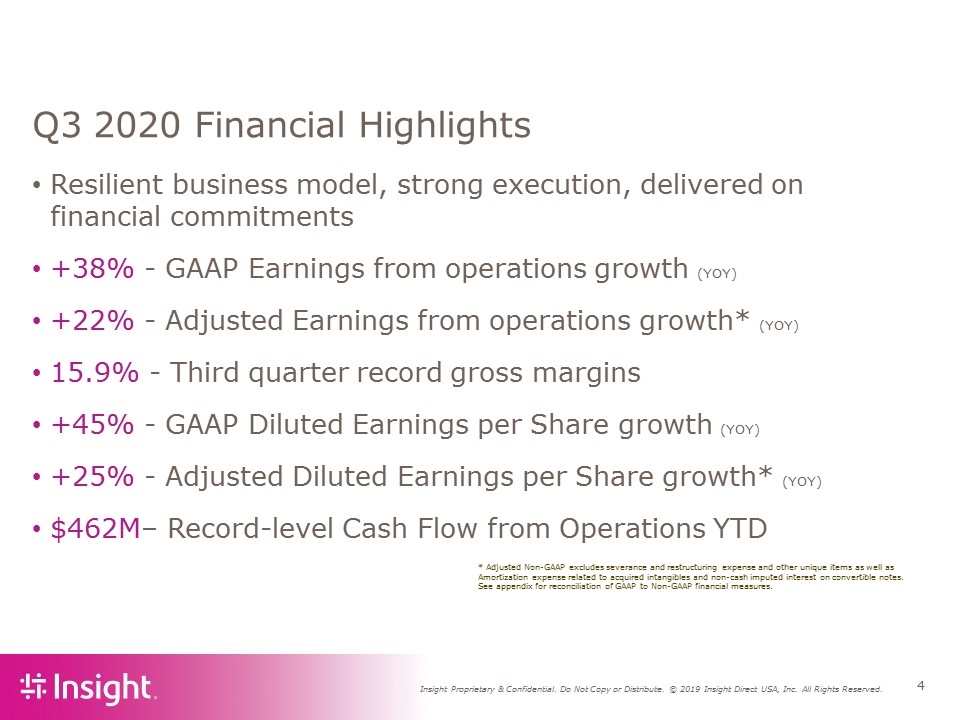
Q3 2020 Financial Highlights Resilient business model, strong execution, delivered on financial commitments +38% - GAAP Earnings from operations growth (YOY) +22% - Adjusted Earnings from operations growth* (YOY) 15.9% - Third quarter record gross margins +45% - GAAP Diluted Earnings per Share growth (YOY) +25% - Adjusted Diluted Earnings per Share growth* (YOY) $462M– Record-level Cash Flow from Operations YTD * Adjusted Non-GAAP excludes severance and restructuring expense and other unique items as well as Amortization expense related to acquired intangibles and non-cash imputed interest on convertible notes. See appendix for reconciliation of GAAP to Non-GAAP financial measures.
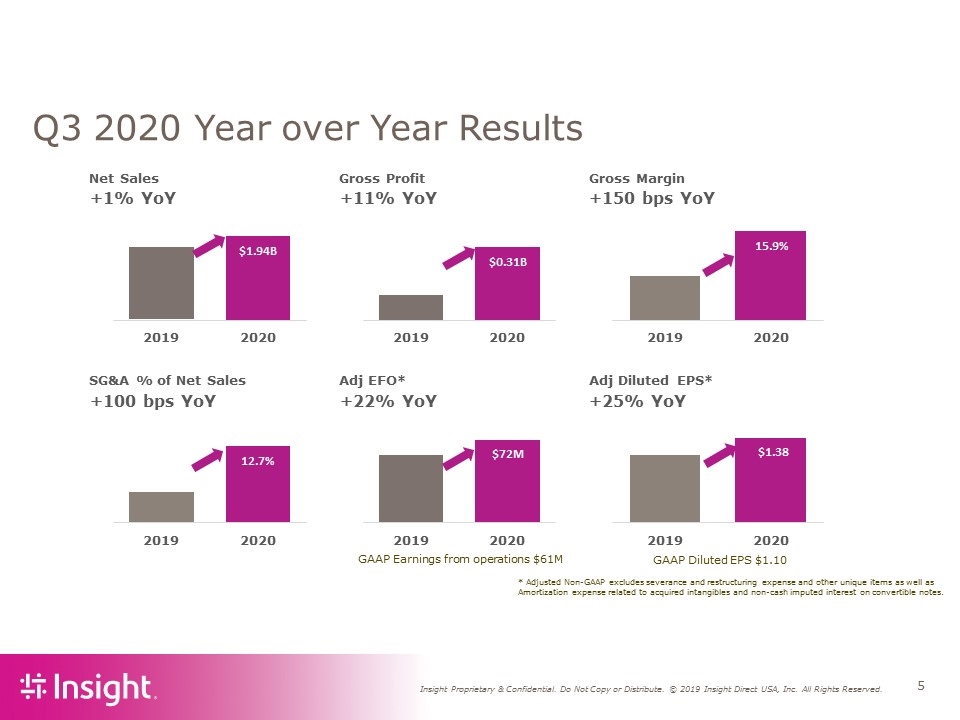
Q3 2020 Year over Year Results GAAP Earnings from operations $61M GAAP Diluted EPS $1.10 * Adjusted Non-GAAP excludes severance and restructuring expense and other unique items as well as Amortization expense related to acquired intangibles and non-cash imputed interest on convertible notes. Net Sales Gross Profit Gross Margin +1% YoY +11% YoY +150 bps YoY SG&A % of Net Sales Adj EFO* Adj Diluted EPS* +100 bps YoY +22% YoY +25% YoY $1.94B 2019 2020 $0.31B 2019 2020 $72M 2019 2020 12.7% 2019 2020 15.9% 2019 2020 $1.38 2019 2020
Third Quarter Operating Highlights PCM Integration ahead of plan - Expect ~$60-$65 million in annualized run-rate cost savings by year end Investing in sales and technical talent Organizational updates North America hardware booking trends improved double digits sequentially in the third quarter Elevated backlog heading into fourth quarter Fourth quarter hardware bookings trending positive year over year Software-as-a-service and cloud solutions growing * * Reported in Services Net Sales
Current Environment Markets open in limited capacity across geos Demand for solutions as economy recovers Solution Areas Partner Recognition NetApp 2020 Cloud Innovation Partner of the Year Dell Technologies 2019 Transformation Partner of the Year Named to Forbes World’s Best Employers 2020
CFO Commentary Year to Date Highlights Cashflow and Debt Covenants Q3-2020 Financial Results by Region Taxes and Cash Flow
Nine months ended September 30, 2020 | Highlights PCM Integration ahead of Plan – Synergies of $60-$65M annual run rate by year end Gross Margins up more than 100 basis points year over year Cost reduction initiatives and integration plans Adjusted earnings from operations growth of 15% year over year Record level cash flow from operations of $462M ABL Facility paid off in Q3
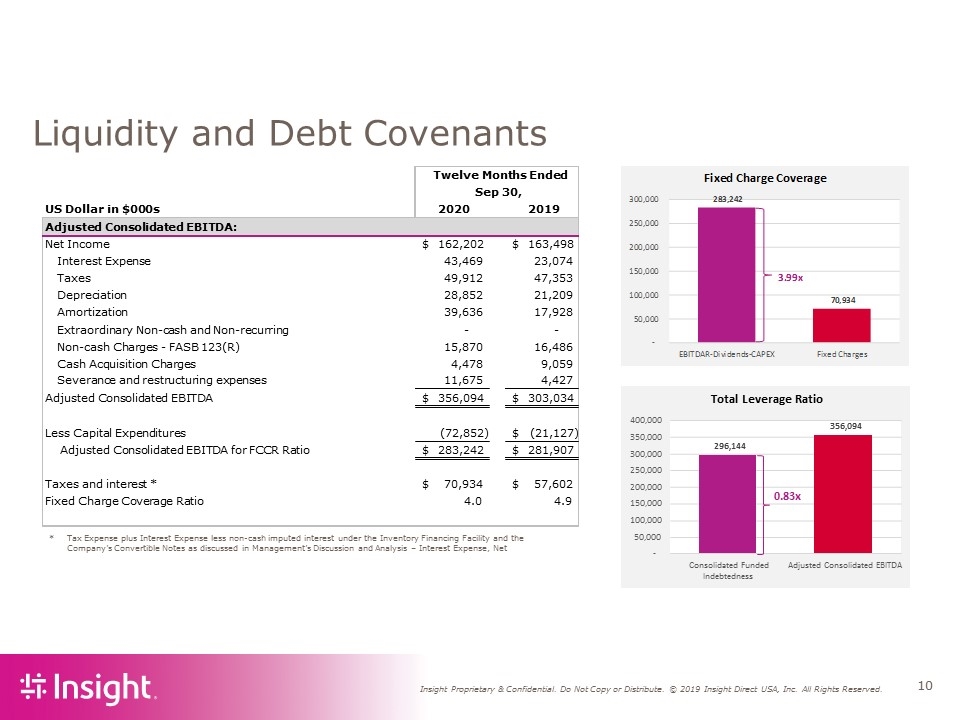
Liquidity and Debt Covenants Tax Expense plus Interest Expense less non-cash imputed interest under the Inventory Financing Facility and the Company’s Convertible Notes as discussed in Management’s Discussion and Analysis – Interest Expense, Net US Dollar in $000s 2020 2019 Adjusted Consolidated EBITDA: Net Income 162,202 $ 163,498 $ Interest Expense 43,469 23,074 Taxes 49,912 47,353 Depreciation 28,852 21,209 Amortization 39,636 17,928 Extraordinary Non-cash and Non-recurring - - Non-cash Charges - FASB 123(R) 15,870 16,486 Cash Acquisition Charges 4,478 9,059 Severance and restructuring expenses 11,675 4,427 Adjusted Consolidated EBITDA 356,094 $ 303,034 $ Less Capital Expenditures (72,852) (21,127) $ Adjusted Consolidated EBITDA for FCCR Ratio 283,242 $ 281,907 $ Taxes and interest * 70,934 $ 57,602 $ Fixed Charge Coverage Ratio 4.0 4.9 Twelve Months Ended Sep 30, Total Leverage Ratio 296,144 356,094 - 50,000 100,000 150,000 200,000 250,000 300,000 350,000 400,000 Consolidated Funded Indebtedness Adjusted Consolidated EBITDA 0.83x
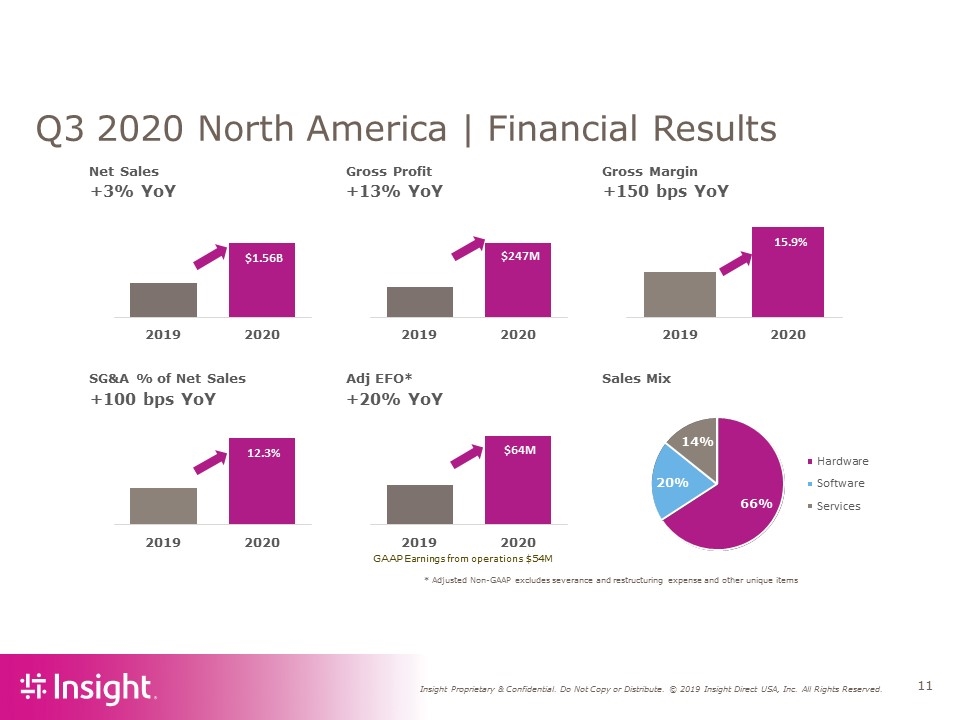
* Adjusted Non-GAAP excludes severance and restructuring expense and other unique items Q3 2020 North America | Financial Results GAAP Earnings from operations $54M Net Sales Gross Profit Gross Margin +3% YoY +13% YoY +150 bps YoY SG&A % of Net Sales Adj EFO* Sales Mix +100 bps YoY +20% YoY 66% 20% 14% Hardware Software Services $1.56B 2019 2020 $247M 2019 2020 15.9% 2019 2020 $64M 2019 2020 12.3% 2019 2020
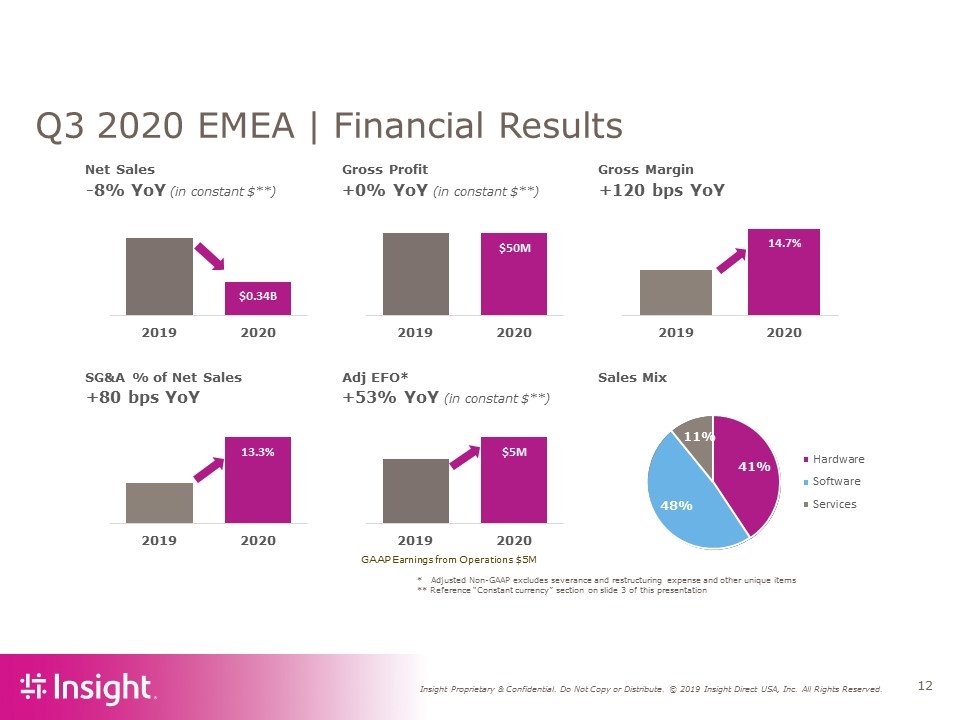
* Adjusted Non-GAAP excludes severance and restructuring expense and other unique items ** Reference “Constant currency” section on slide 3 of this presentation Q3 2020 EMEA | Financial Results (in constant $**) (in constant $**) GAAP Earnings from Operations $5M (in constant $**) Net Sales Gross Profit Gross Margin -8% YoY +0% YoY +120 bps YoY SG&A % of Net Sales Adj EFO* Sales Mix +80 bps YoY +53% YoY 41% 48% 11% Hardware Software Services $0.34B 2019 2020 $50M 2019 2020 14.7% 2019 2020 $5M 2019 2020 13.3% 2019 2020
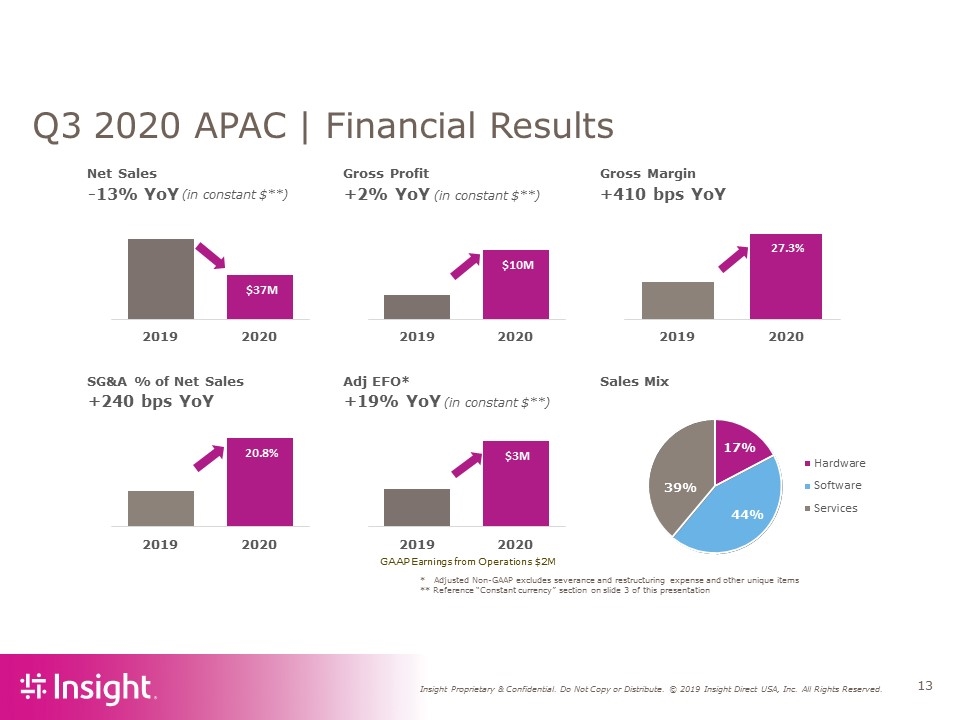
* Adjusted Non-GAAP excludes severance and restructuring expense and other unique items ** Reference “Constant currency” section on slide 3 of this presentation Q3 2020 APAC | Financial Results (in constant $**) (in constant $**) GAAP Earnings from Operations $2M (in constant $**) Net Sales Gross Profit Gross Margin -13% YoY +2% YoY +410 bps YoY SG&A % of Net Sales Adj EFO* Sales Mix +240 bps YoY +19% YoY $37M 2019 2020 $10M 2019 2020 27.3% 2019 2020 $3M 2019 2020 20.8% 2019 2020 17% 44% 39% Hardware Software Services
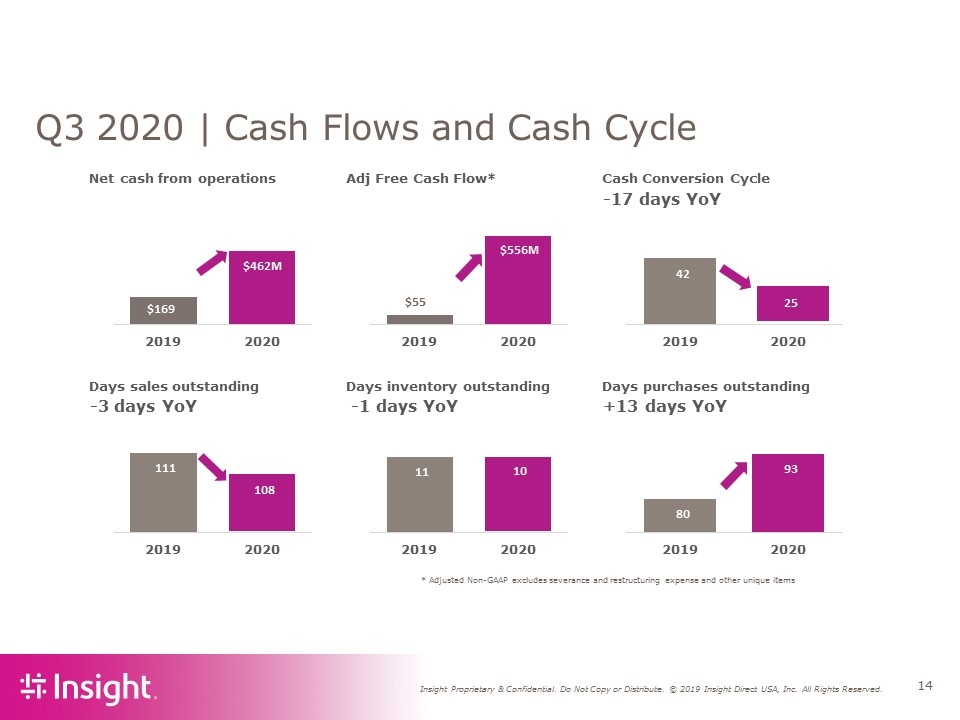
* Adjusted Non-GAAP excludes severance and restructuring expense and other unique items Q3 2020 | Cash Flows and Cash Cycle Net cash from operations Adj Free Cash Flow* Cash Conversion Cycle -17 days YoY Days sales outstanding Days inventory outstanding Days purchases outstanding -3 days YoY -1 days YoY +13 days YoY $169 $462M 2019 2020 $55 $556M 2019 2020 42 25 2019 2020 111 108 2019 2020 11 10 2019 2020 80 93 2019 2020
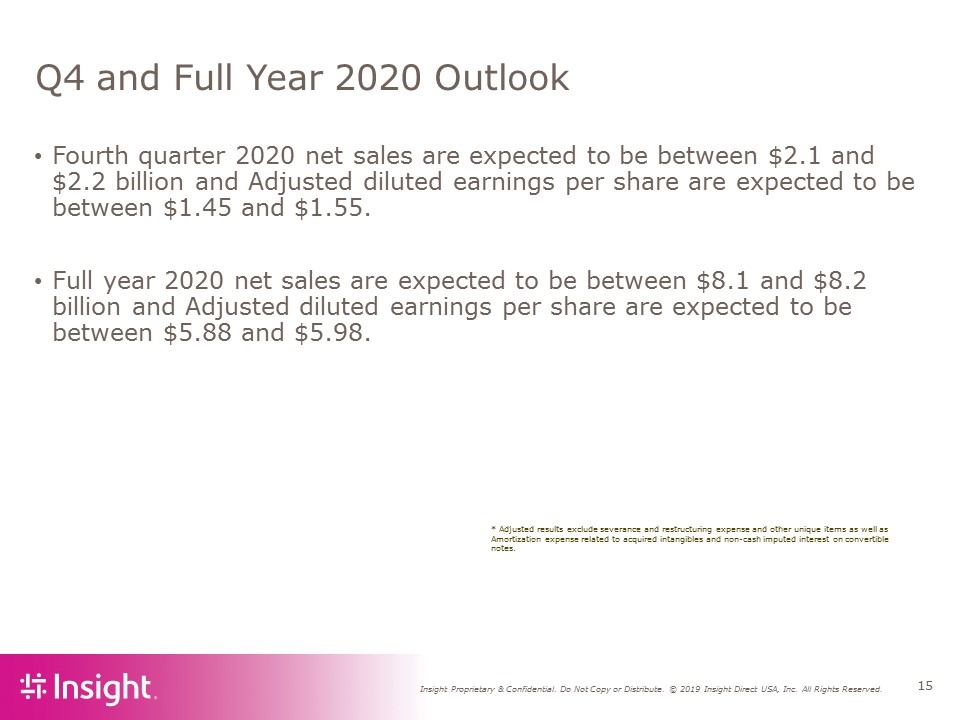
Q4 and Full Year 2020 Outlook Fourth quarter 2020 net sales are expected to be between $2.1 and $2.2 billion and Adjusted diluted earnings per share are expected to be between $1.45 and $1.55. Full year 2020 net sales are expected to be between $8.1 and $8.2 billion and Adjusted diluted earnings per share are expected to be between $5.88 and $5.98. * Adjusted results exclude severance and restructuring expense and other unique items as well as Amortization expense related to acquired intangibles and non-cash imputed interest on convertible notes.
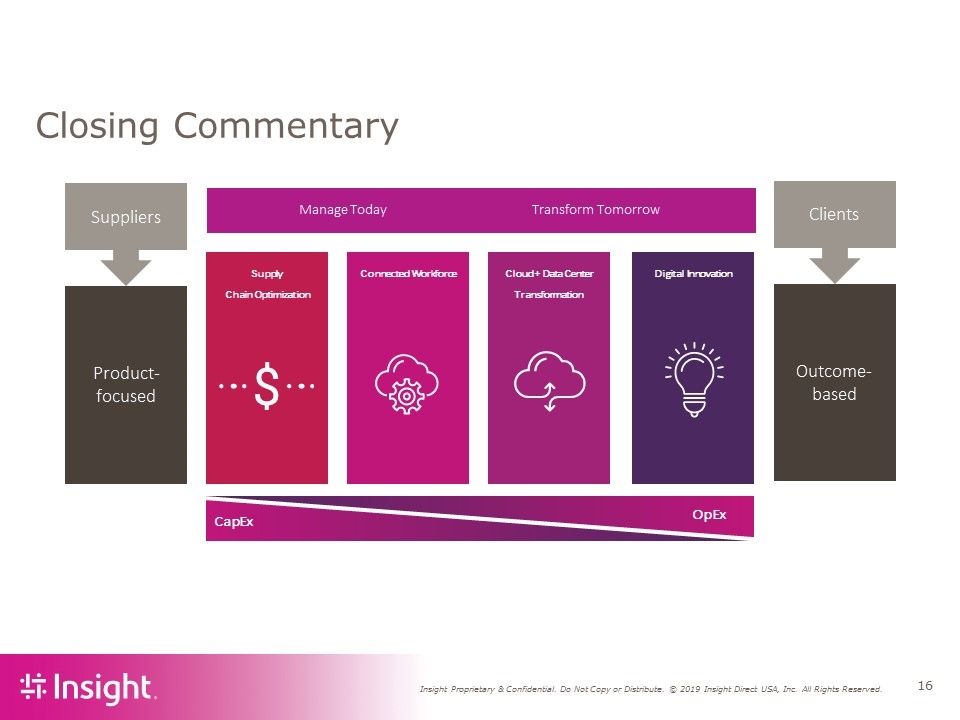
Closing Commentary Product-focused Suppliers Outcome-based Clients Supply Chain Optimization Connected Workforce Cloud + Data Center Transformation Digital Innovation CapEx OpEx Manage Today Transform Tomorrow
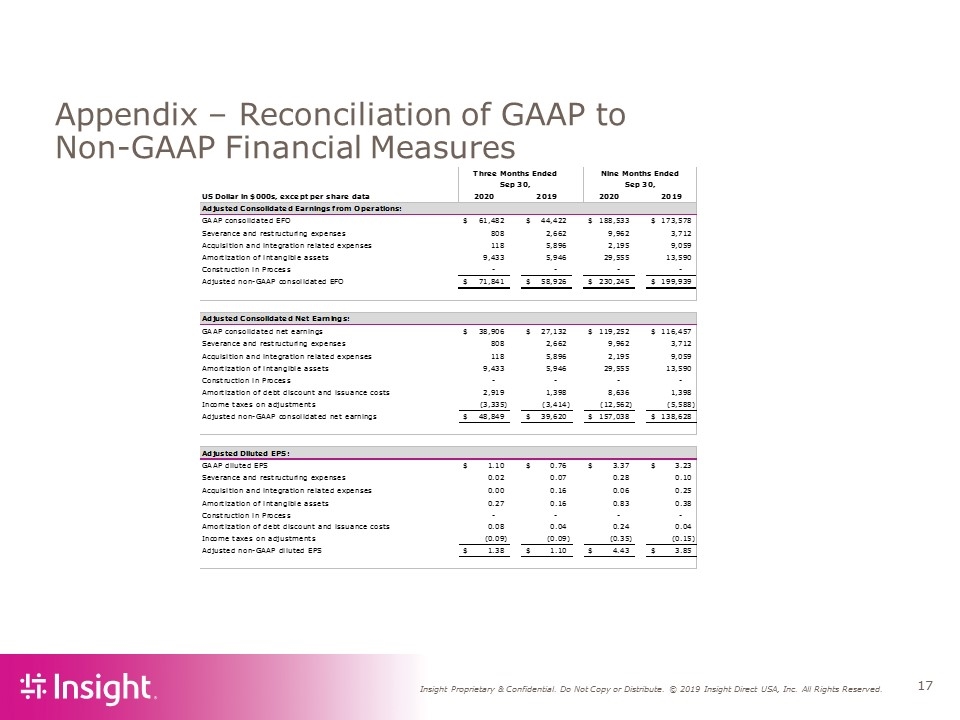
Appendix – Reconciliation of GAAP to Non-GAAP Financial Measures
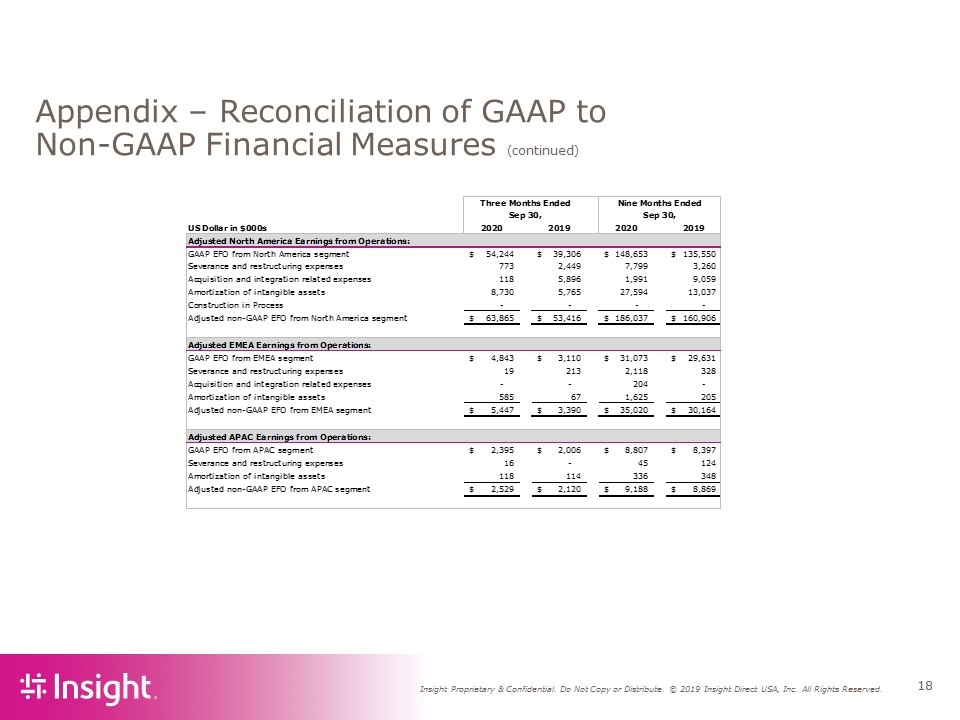
Appendix – Reconciliation of GAAP to Non-GAAP Financial Measures (continued)
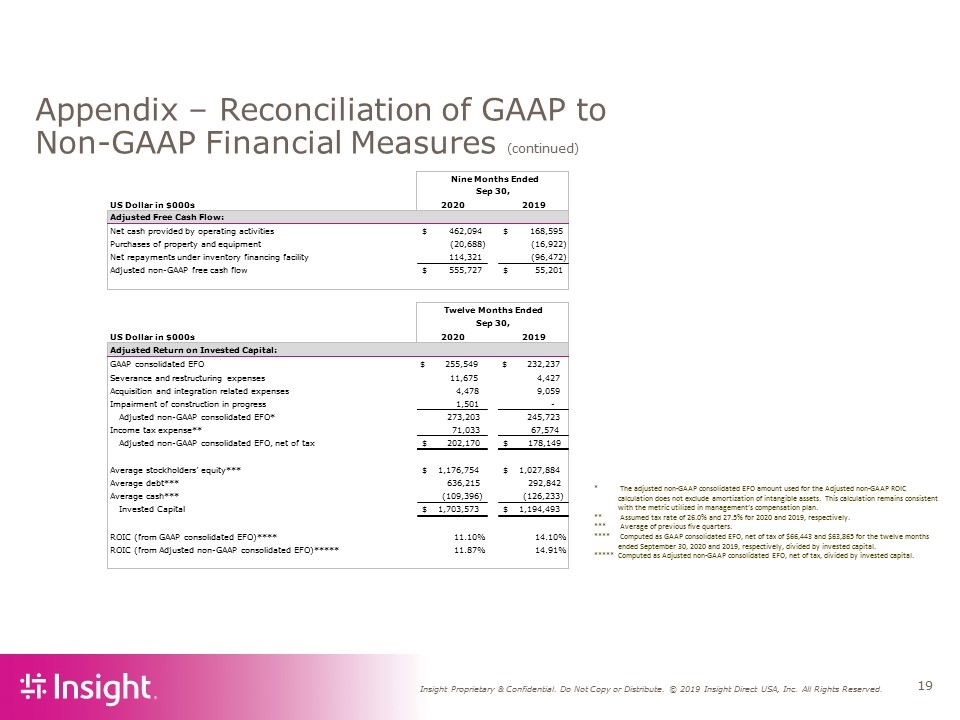
Appendix – Reconciliation of GAAP to Non-GAAP Financial Measures (continued) * The adjusted non-GAAP consolidated EFO amount used for the Adjusted non-GAAP ROIC calculation does not exclude amortization of intangible assets. This calculation remains consistent with the metric utilized in management’s compensation plan. ** Assumed tax rate of 26.0% and 27.5% for 2020 and 2019, respectively. *** Average of previous five quarters. **** Computed as GAAP consolidated EFO, net of tax of $66,443 and $63,865 for the twelve months ended September 30, 2020 and 2019, respectively, divided by invested capital. ***** Computed as Adjusted non-GAAP consolidated EFO, net of tax, divided by invested capital. US Dollar in $000s 2020 2019 Net cash provided by operating activities 462,094 $ 168,595 $ Purchases of property and equipment (20,688) (16,922) Net repayments under inventory financing facility 114,321 (96,472) Adjusted non-GAAP free cash flow 555,727 $ 55,201 $ US Dollar in $000s 2020 2019 GAAP consolidated EFO $ 255,549 $ 232,237 Severance and restructuring expenses 11,675 4,427 Acquisition and integration related expenses 4,478 9,059 Impairment of construction in progress 1,501 - Adjusted non-GAAP consolidated EFO* 273,203 245,723 Income tax expense** 71,033 67,574 Adjusted non-GAAP consolidated EFO, net of tax $ 202,170 $ 178,149 Average stockholders’ equity*** $ 1,176,754 $ 1,027,884 Average debt*** 636,215 292,842 Average cash*** (109,396) (126,233) Invested Capital $ 1,703,573 $ 1,194,493 ROIC (from GAAP consolidated EFO)**** 11.10% 14.10% ROIC (from Adjusted non-GAAP consolidated EFO)***** 11.87% 14.91% Adjusted Free Cash Flow: Twelve Months Ended Sep 30, Adjusted Return on Invested Capital: Nine Months Ended Sep 30,
